Article

Surface Settlement of Deep Foundation Pit Considering the Influence of Excavation and Freeze–Thaw

1
School of Civil Engineering and Water Resources, Qinghai University, Xi’ning 810016, China
2
Qinghai Key Laboratory of Engineering Safety and Energy-Saving Building Materials, Xi’ning 810016, China
*
Author to whom correspondence should be addressed.
Buildings 2025, 15(7), 1104; https://doi.org/10.3390/buildings15071104
Submission received: 5 March 2025 / Revised: 21 March 2025 / Accepted: 27 March 2025 / Published: 28 March 2025
(This article belongs to the Special Issue Soil–Structure Interactions for Civil Infrastructure)

Abstract

:
In order to address the issue of surface deformation in wintering foundation pits in seasonal frozen soil areas due to excavation and freeze–thaw, an indoor scale model test was conducted to examine the displacement relationship between pit wall soil and supporting structures under freeze–thaw conditions, as well as the temperature change and water migration of soil surrounding the foundation pit. The distribution mode of surface settlement under excavation and freeze–thaw conditions was examined and a surface settlement calculation model was established based on the maximum value of surface settlement. The water will move from the frozen to the unfrozen region as a result of the freeze–thaw cycle. About 1.1 m is the freezing depth. An increase in surface settlement will result from the coordination of deformation between the soil and the supporting structure during freezing and thawing. The greatest surface settlement value following the initial freeze–thaw cycle is 1.082 mm, which is around 215% greater than that of excavation. The skewed distribution is comparable to the surface settlement curves produced by excavation and freeze–thaw cycles. The calculated model’s results and the measured settlement values agree rather well.

1. Introduction

The freezing and thawing cycles in seasonally frozen regions cause the surrounding soil to freeze and thaw, altering the stress field around the foundation. Because it causes uneven sinking or even rupture damage, this poses serious risks to the safety and stability of surrounding structures. Excavation and freeze–thaw-induced ground deformations can cause the uneven settlement of nearby structures and road surfaces, as well as the rupture of soil and pipelines. These deformations are influenced by a number of important parameters such as the characteristics of the soil, freezing temperatures, excavation procedures, support structures, and construction processes. Studying surface deformations brought on by excavation and freeze–thaw cycles is crucial because these factors vary by region.
Through case studies, a great deal of work has been carried out to examine how excavation causes ground surface settling [1,2,3,4]. As a result, several hypotheses and prediction methods have been proposed [5,6,7]. This study provided several comprehensive direct shear tests on the freeze–thaw interface in CGS using a temperature control system [8]. Unconfined compression tests under various freeze–thaw cycles were used to examine the strength damage of loess in seasonal frozen areas [9]. The law of water movement during freezing and thawing was investigated, and frost heave and thaw surface deformation of the subgrade were simulated using COMSOL [10]. However, these empirical methods are only relevant to the specific geology and provide cautious upper limit estimations for ground surface settlement.
Drawing on a number of real-world engineering studies, Tang and Nie created an estimation method that considers the surface subsidence curve as a normal and skewed distribution model and applied it to engineering practice [11,12]. Zhang used a new thermal-boundary-controlled triaxial testing system with bender elements to investigate how cyclic freeze–thaw affects a sandy silt’s stiffness under both unidirectional and all-around freezing modes [13]. Li used numerical simulations and computational analyses on actual projects to create a model for forecasting surface degradation based on ground damage criteria [14]. His research demonstrated that surface deterioration close to deep excavations has a parabolic distribution, emphasizing how important it is to take overload effects into consideration while calculating settlement. Mo shown that the parabolic distribution model accurately predicts soil settlement, and that additional stories should be translated into equivalent loads for structural analysis for shallow foundations taller than three stories [15].
However, the assumption that excavation unloading and freeze–thaw cycles do not damage the soil is the foundation of all existing surface settlement calculation techniques. Significant surface deformation will occur in the seasonal frozen loess area as a result of deep foundation pit excavation and freeze–thaw cycles. It is recommended that the surface settlement surrounding the foundation pit be investigated using model testing in order to develop a calculating model of the surface settlement distribution pattern of the deep foundation pit supported by piles and anchors. The relationship between the maximum surface settlement and the number of freeze–thaw cycles is used to calculate the settlement of any point on the surface under different freeze–thaw times in order to more precisely predict the surface settlement surrounding the deep foundation pit supported by piles and anchors as a result of foundation pit excavation and freeze–thaw cycles.

2. Model Trial of the Foundation Pit with Pile Support

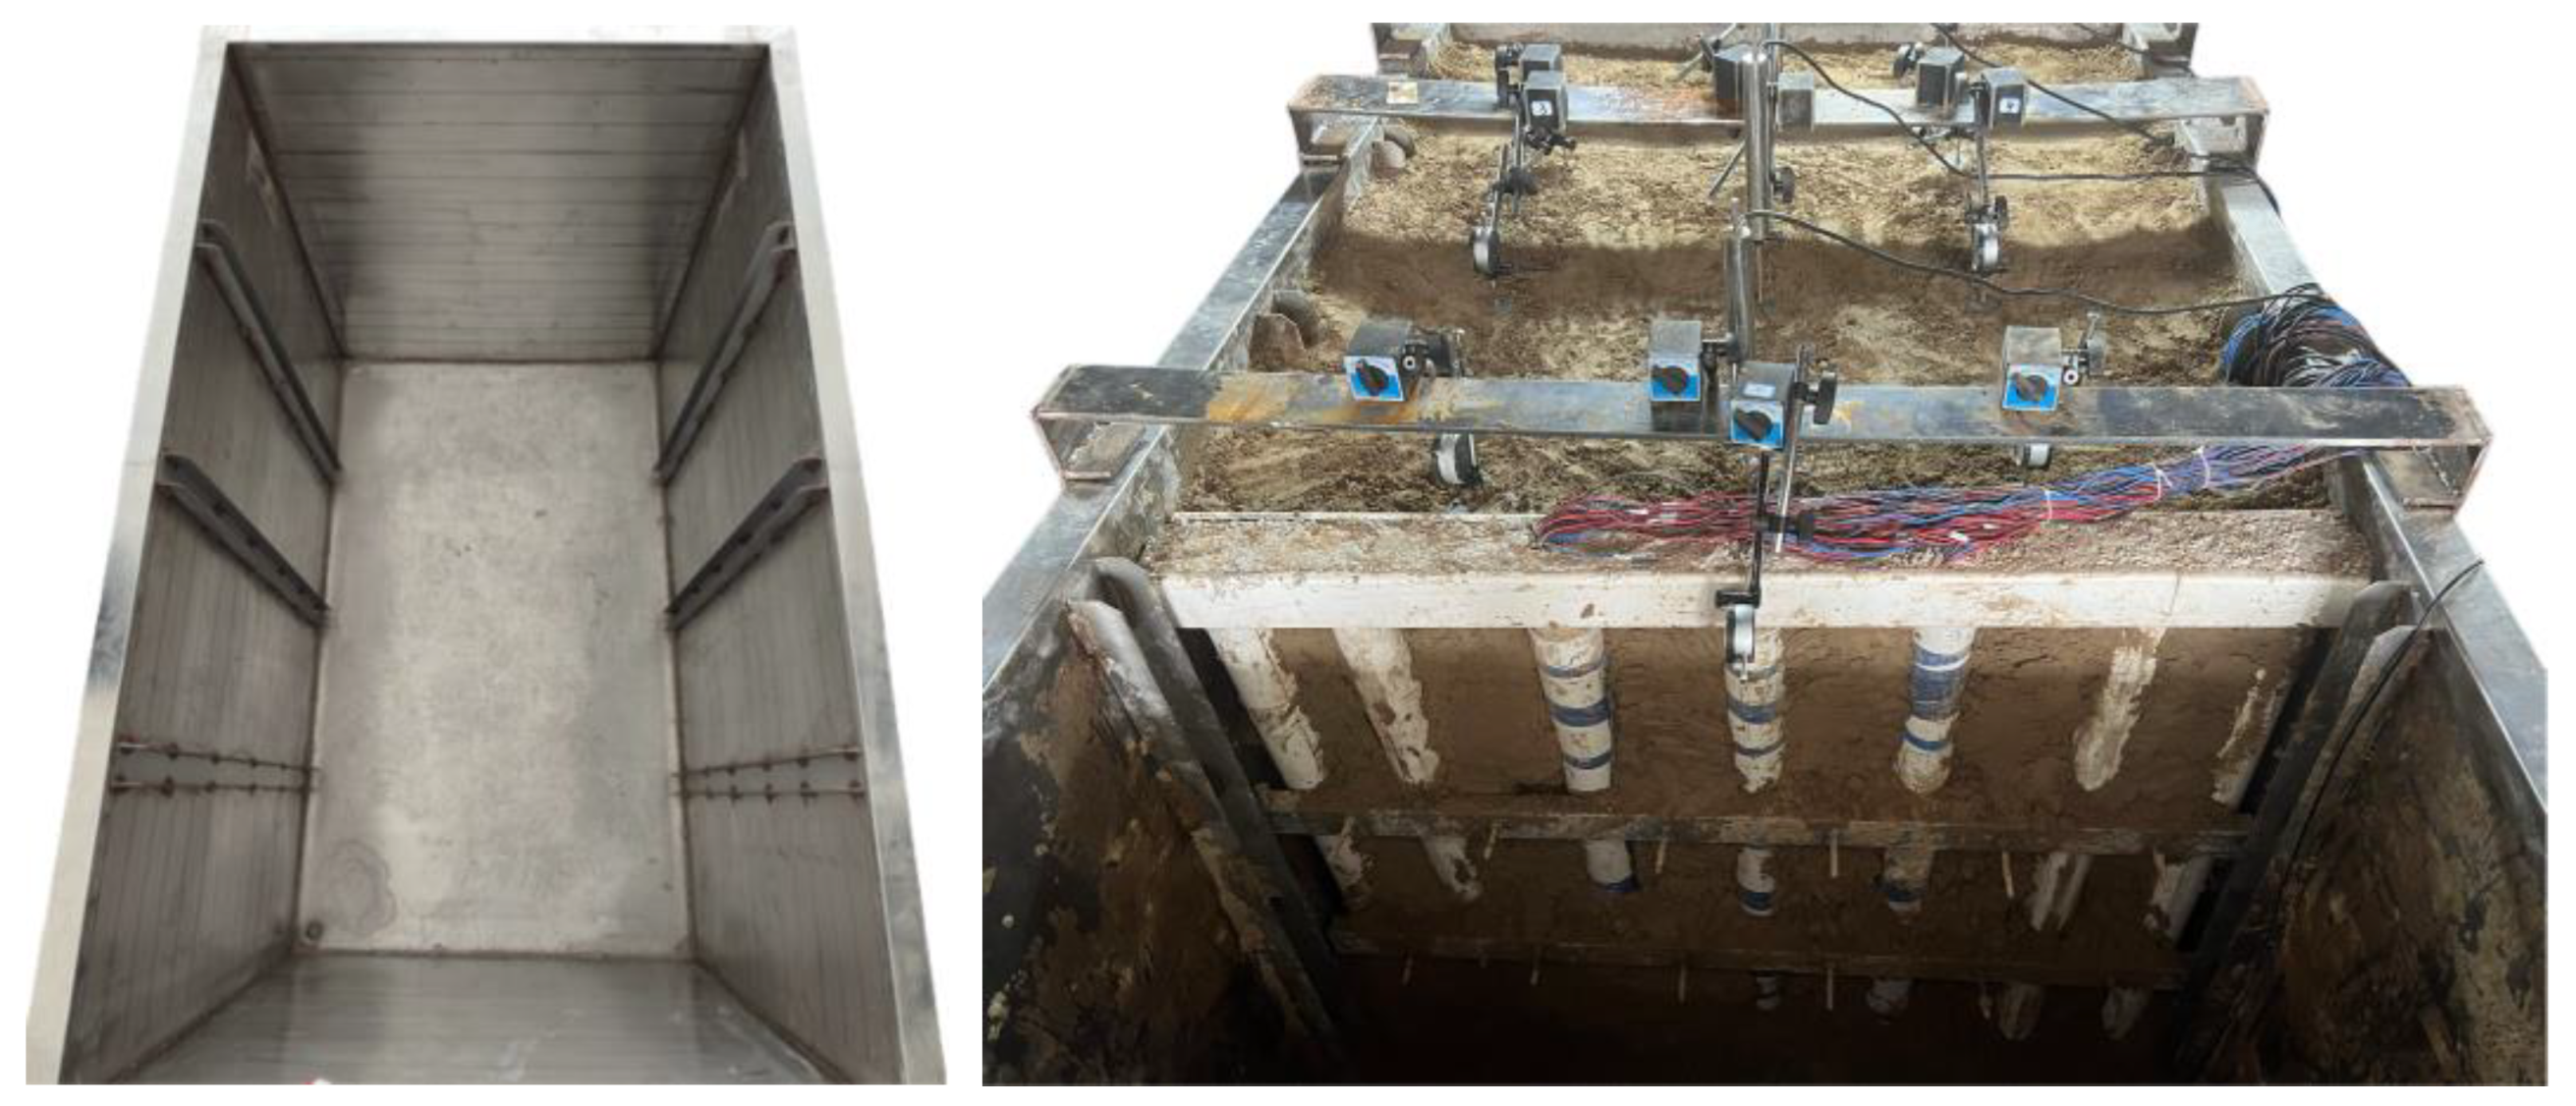
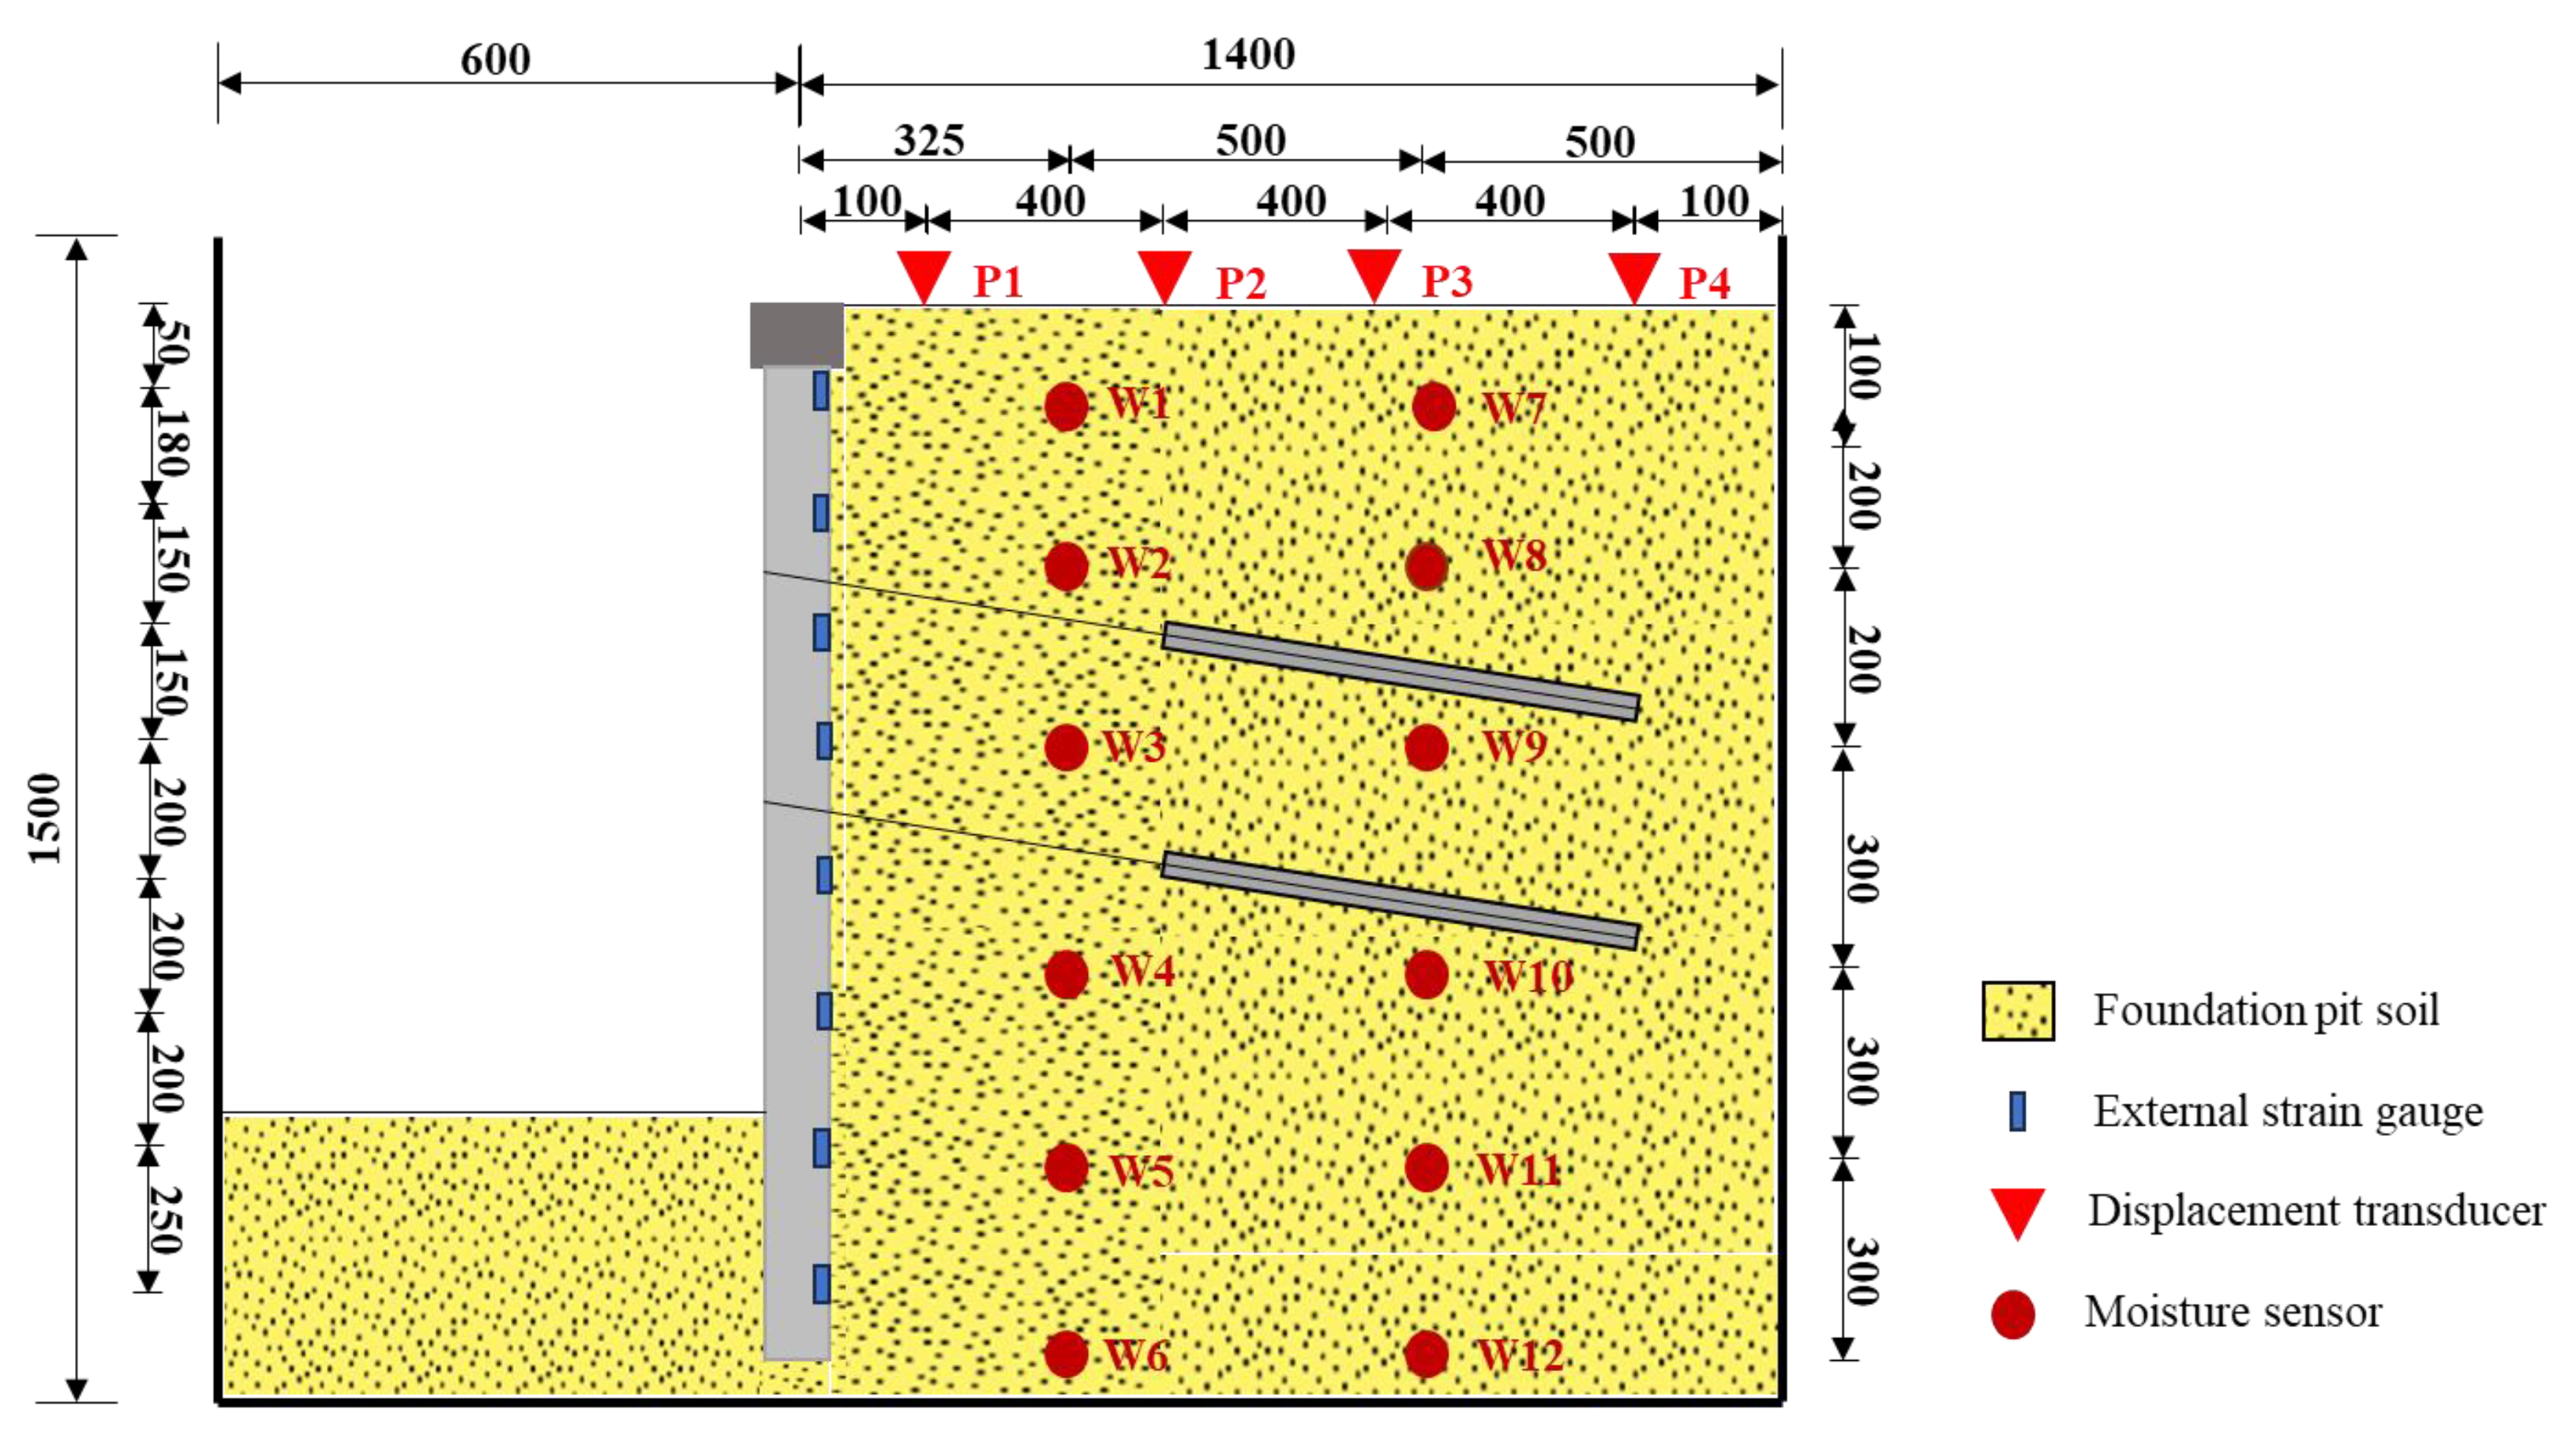
2.1. Overview of Model Trials

The model test was conducted with specific constants and coefficients, including the geometric similarity constant C L = 10 , gravity similarity coefficient C γ = 1 , and thermal conductivity C α = 1 . The test utilized an independently developed model box with dimensions of 2.0 × 1.5 × 1.2 cubic meters (Figure 1). The model box’s exterior wall was composed of 304 stainless steel plate. The entire model box was insulated. The box was insulated from the outside environment using a thermal insulation material that had a thermal conductivity of less than 0.035. The crown beam was made of square PVC tube. The crown beam’s length was fixed at 1180 mm, with 10 mm spaces left at either end to prevent it from touching the model box’s inner wall. The crown beam’s dimensions were 0.07 × 0.1 × 1.18 cubic meters. A PVC hollow pipe was also used to imitate the model pile, which had been constructed from fine stone concrete that had been poured after steel wire had been connected into a steel cage inside a PVC pipe. The model pile had an effective pile length of 1330 mm, an outside diameter of 80 mm, and a wall thickness of 2 mm. Along the pit edge, seven roots were planted, with a pile gap distance of 120 mm or a pile center spacing of 200 mm. The model pile’s elastic modulus satisfied the test’s requirements.
The test bolt was made from a screw rod that was 1400 mm long and had an 8 mm diameter. The diameter was 32 mm, the free portion was 500 mm long, and the anchorage section was 900 mm long. The PVC pipe was chosen as a mold in the production process. The first row and the second row were positioned 300 mm below the pile top and 300 mm below each other, respectively. There was a 15° inclination angle. The bolt spacing was 200 mm, and there were six in each row and one between every two heaps. By altering the contact between the nut and the waist beam to mimic the prestressing force, the bolt could be tightened. The nut was positioned at the end of the bolt. The square steel tube was chosen as the test material, and the waist beam was pre-embedded.
The model box was filled in stages after the soil was sieved and blended beforehand, taking into account its natural water content of 10.48%. Table 1 lists the precise soil parameters that were used in the model test. To remove the side wall friction resistance, a layer of Vaseline was applied to the model box’s side wall prior to each soil layer being filled. Leveling and uniform compaction were performed following each 0.1 m filling to guarantee that the model soil’s compaction degree reached 82%. The excavation was carried out in five stages, each measuring 0.2 m, and the next excavation was carried out after the previous one was finished in order to prevent the negative deformation of soil consolidation settlement [16]. This procedure ensured that the observed surface settlement was solely attributed to excavation and freeze–thaw effects. Measurement instruments, including the YWC-100bit transfer sensor and a temperature–moisture sensor, were calibrated in the laboratory before the experiment. The sensors provided data throughout the freezing cycle, monitoring changes in water content in the deep-base model. Further details regarding the model setup and sensor configuration are shown in Figure 2.
The model test was performed using the TMS9023 freezing environment simulation system (Figure 3). There were three major components to it: a freeze–thaw environment simulation system, determination parameter setting and real-time data observation, and a temperature control system. This allowed for the precise control of ambient temperature intervals within the enclosure, with an accuracy of ±0.1 °C. The system was programmed to replicate a temperature gradient that followed the temperature curve observed during freeze–thaw cycles, spanning 20 cycles in total. Each cycle lasted 24 h, with 12 h for freezing and 12 h for melting. The analysis focused on surface deformations resulting from excavation, freezing, and melting under three distinct conditions.

2.2. Analysis of Experimental Results

Figure 4 presents the surface deformation measurements resulting from the excavation of the foundation pit. The surface settlement distribution curve, caused by deep-base excavation with cave support, was oriented perpendicular to the surface. Surface settlement at the supporting structure was greater than at other locations (P1 = 0.0218 mm). This was primarily due to the reduced lateral support provided by the foundation pit walls, which diminished the load-bearing capacity and caused surface subsidence around the excavation. The measured value at point P2 post excavation was 0.48 mm, aligning closely with expected deformation based on prior engineering studies [17]. Furthermore, experimental data from various excavation stages, and studies by other researchers [18,19,20], indicated that the maximum surface settlement during excavation significantly differed from the edges to the center of the base.
x m = α h 0
Here, x m represents surface settlement, h 0 is the excavation depth, and α is the experience coefficient (with a range of 0.1 to 0.7, typically 0.4 for excavation).
Figure 4. Ground settlement of foundation pit excavation.
Buildings 15 01104 g004
The findings of surface deformation monitoring during the freezing process are also displayed in Figure 5 (1F and 1T represent it after freezing and after melting, respectively). Three measurement points were selected for analysis during each freeze and at the end of each melt cycle. As illustrated, surface settlement was more pronounced during the freezing phase and decreased with an increasing distance from the pit edge. Deformation during the freezing phase was generally lower compared to that during the freeze–melt cycles, primarily because ice occupies soil pores during freezing while melting ice leads to surface deformation as it reverts to its unfrozen state. This deformation correlates with the moisture migration in the soil during freeze and melt cycles [21].
During the freezing process, the maximum deformation at point P2 was 1.082 mm, which corresponded to a measured deformation of 10.82 mm during construction. These values were approximately 1.95, 5.57, and 13.65 times greater than those observed at points P1, P3, and P4, respectively, during the initial freeze–melt cycle (when n = 1, P1 = 0.56 mm, P3 = 0.19 mm, and P4 = 0.08 mm). This was due to variations in the extent of soil excavation unloading and freeze–thaw damage at various locations. Measurement point P4, located 1.3 m from the pit edge, showed minimal changes in surface settlement (less than 0.1 mm) across different freeze cycles, indicating a minimal impact on the safety and stability of the base pit. Therefore, when designing foundation pits in seasonally frozen zones, it is crucial to consider the potential impacts of freeze-induced surface deformations on surrounding ground stability.
The peak deformation at each measurement point occurred during the first freeze–melt cycle, after which deformation gradually decreased and stabilized after approximately eight cycles. This behavior aligned with the theory of decongestion expansion, which suggests that water migrates towards the colder areas in pre-frozen soil, altering the soil structure and inter-particle connections. These changes are most significant in the early stages of freeze–thaw cycles. Over multiple freeze conditions, the soil transitions from an unstable to a dynamically stable state through moisture rearrangement and redistribution, resulting in changes in soil volume [22]. Post-stabilization, the surface melting percentages at points P1, P2, P3, and P4 were 39%, 51%, 53%, and 34% (when n = 10, P1 = 0.21 mm, P2 = 0.53 mm, P3 = 0.10 mm, and P4 = 0.03 mm), respectively, at the initial melt. These findings highlight the importance of considering the effect of surface deformation before the freezing period when assessing the safety and stability of foundation pits.
It is evident that the foundation pit’s excavation and freeze–thaw cycle will cause varying degrees of stratum deformation, which will have an impact on the nearby buildings. Predicting the surface settlement brought on by excavation and the foundation pit’s freeze–thaw cycle is essential. The largest surface settlement difference during the freeze–thaw cycle and following excavation was 1.034 mm, representing an increase of around 215%. This was because, in freeze–thaw circumstances, the dirt in the foundation pit freezes in both directions, affecting the pit wall and the surface. Freeze–thaw weakens the soil’s resistance to deformation and damages its strength. At the same time, frost heaving will ruin the foundation pit soil’s natural structure and deform the supporting structure. It was evident that the excavation and freeze–thaw cycles of the foundation pit would cause varying degrees of degradation of the surrounding strata, posing serious safety risks to the nearby structures and amenities. Accurately forecasting the surface settling brought on by excavation and the freeze–thaw of a foundation pit is therefore essential and significant. Under excavation, frost heave, and thaw settlement circumstances, the distribution pattern of surface settlement surrounding the foundation pit must be examined.

3. Investigation of the Surface Settlement Distribution Pattern During Foundation Pit Excavation and Freeze–Thaw Cycles

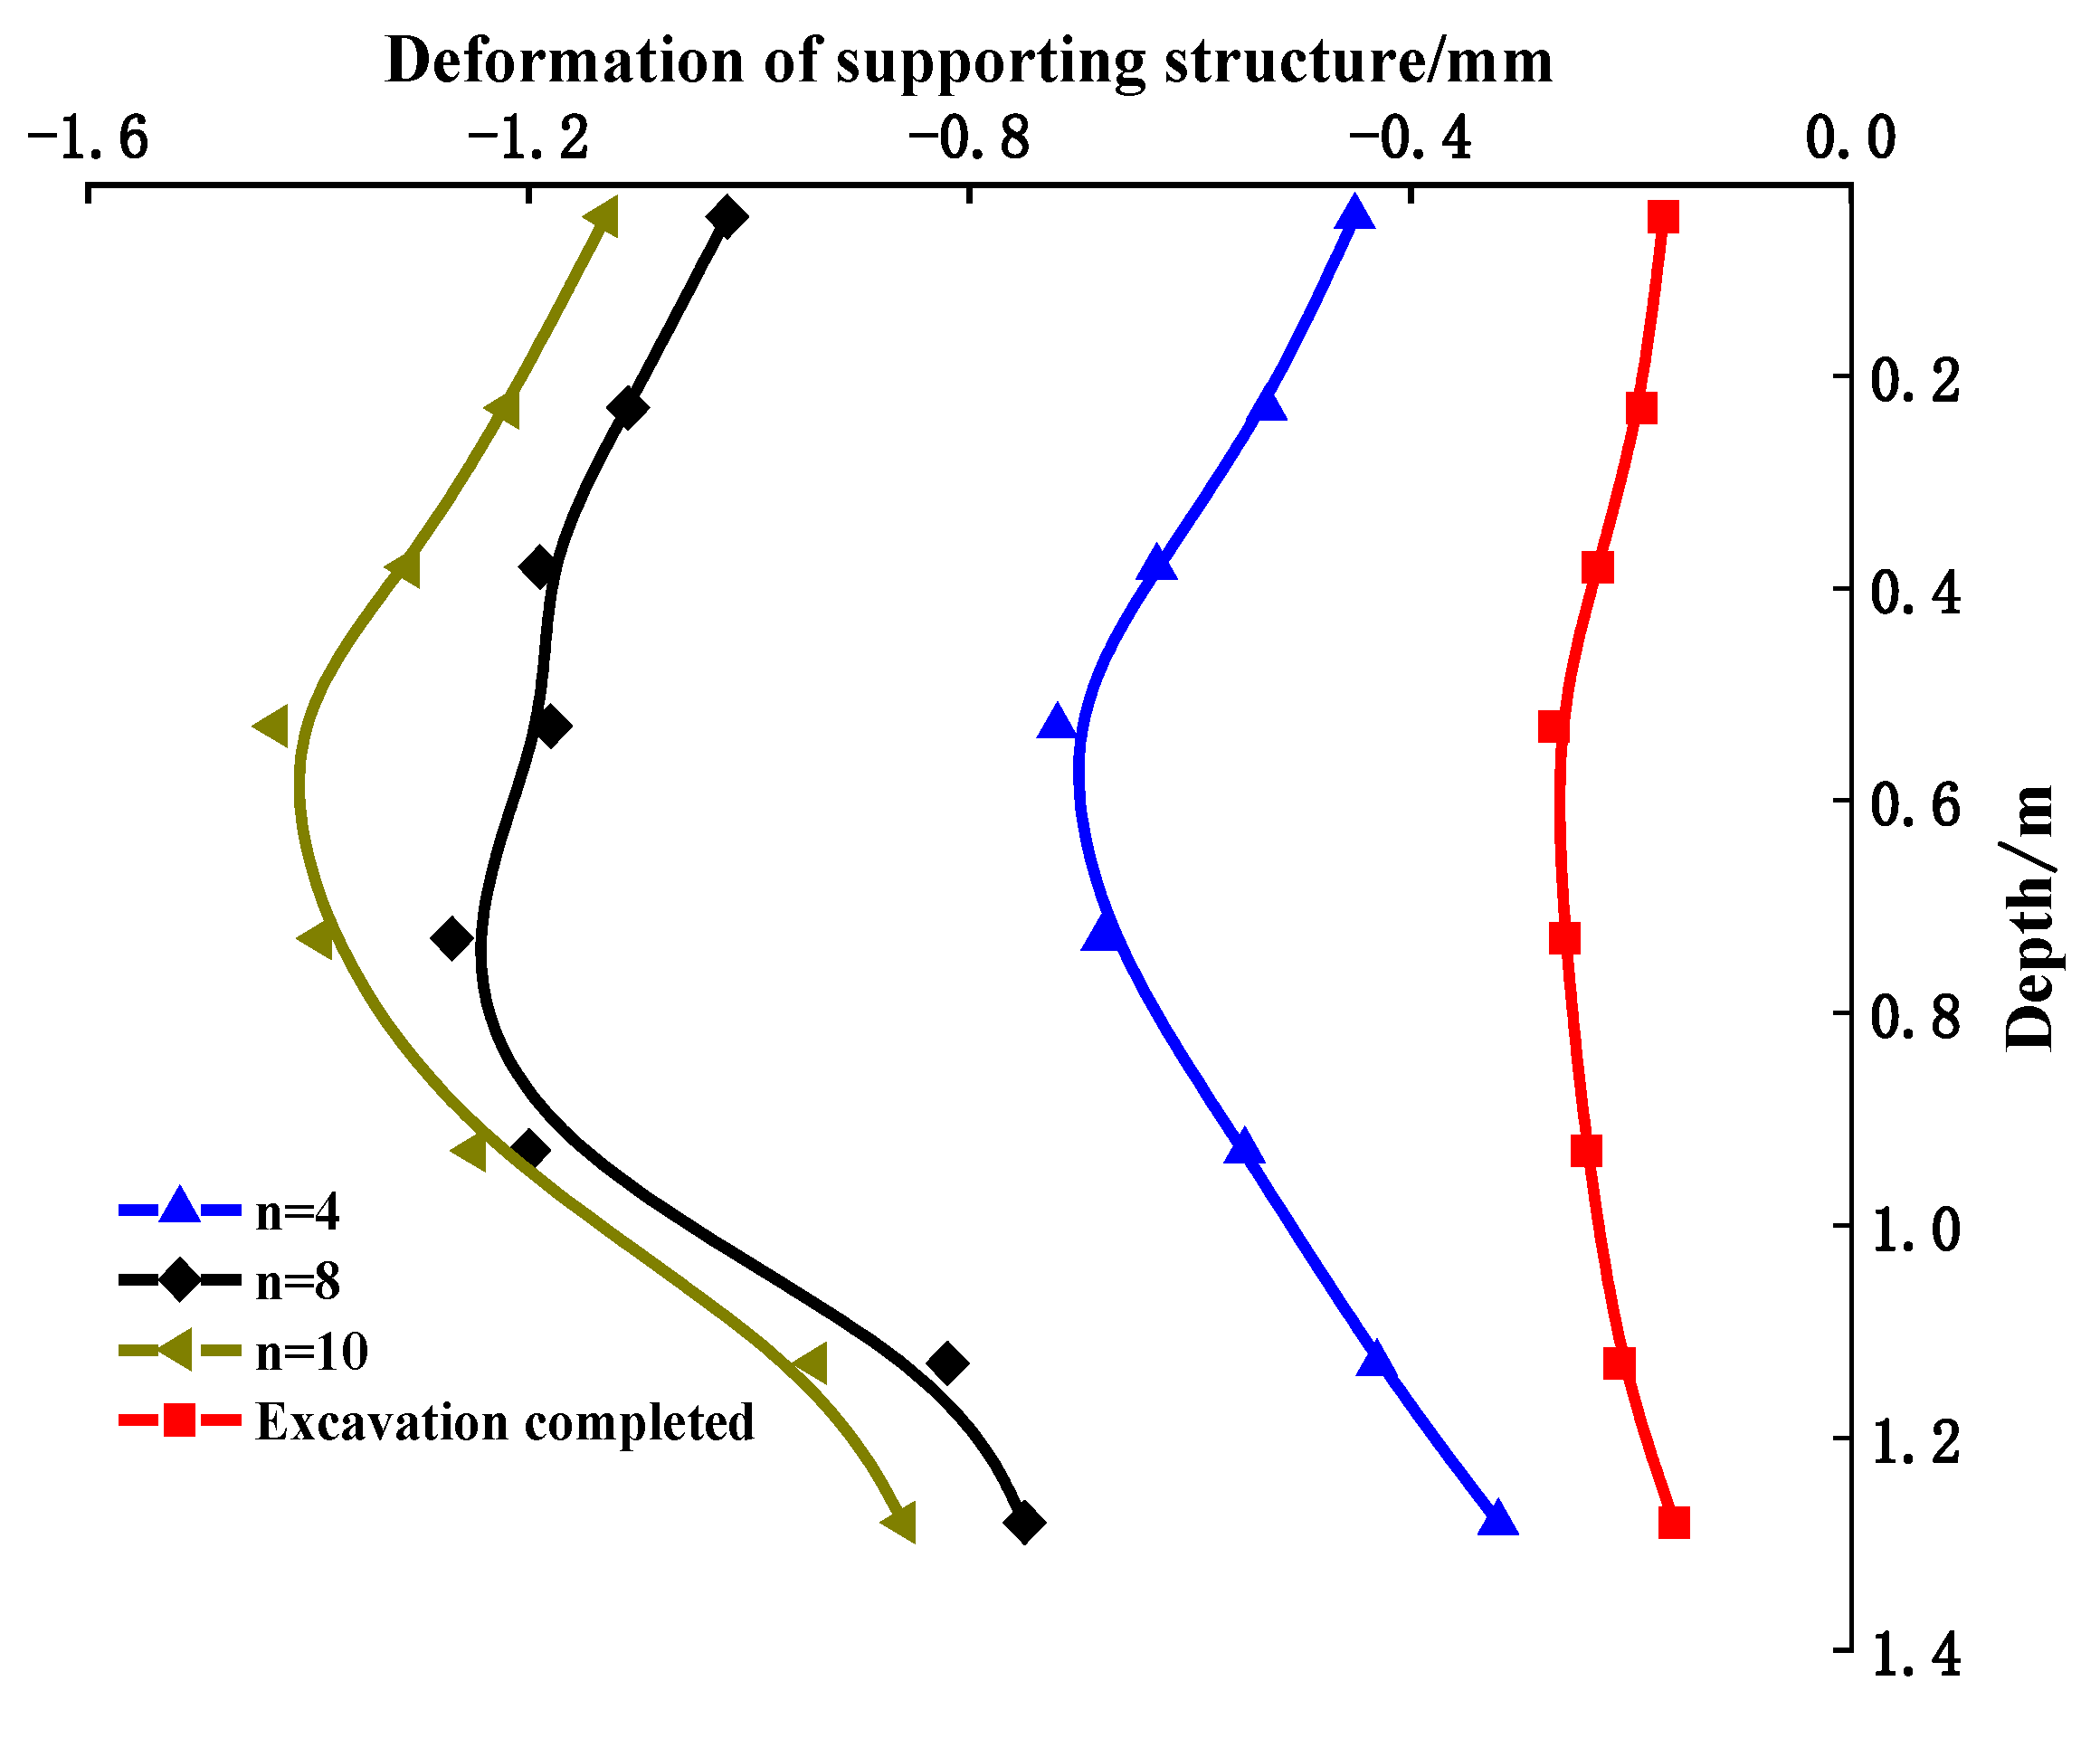
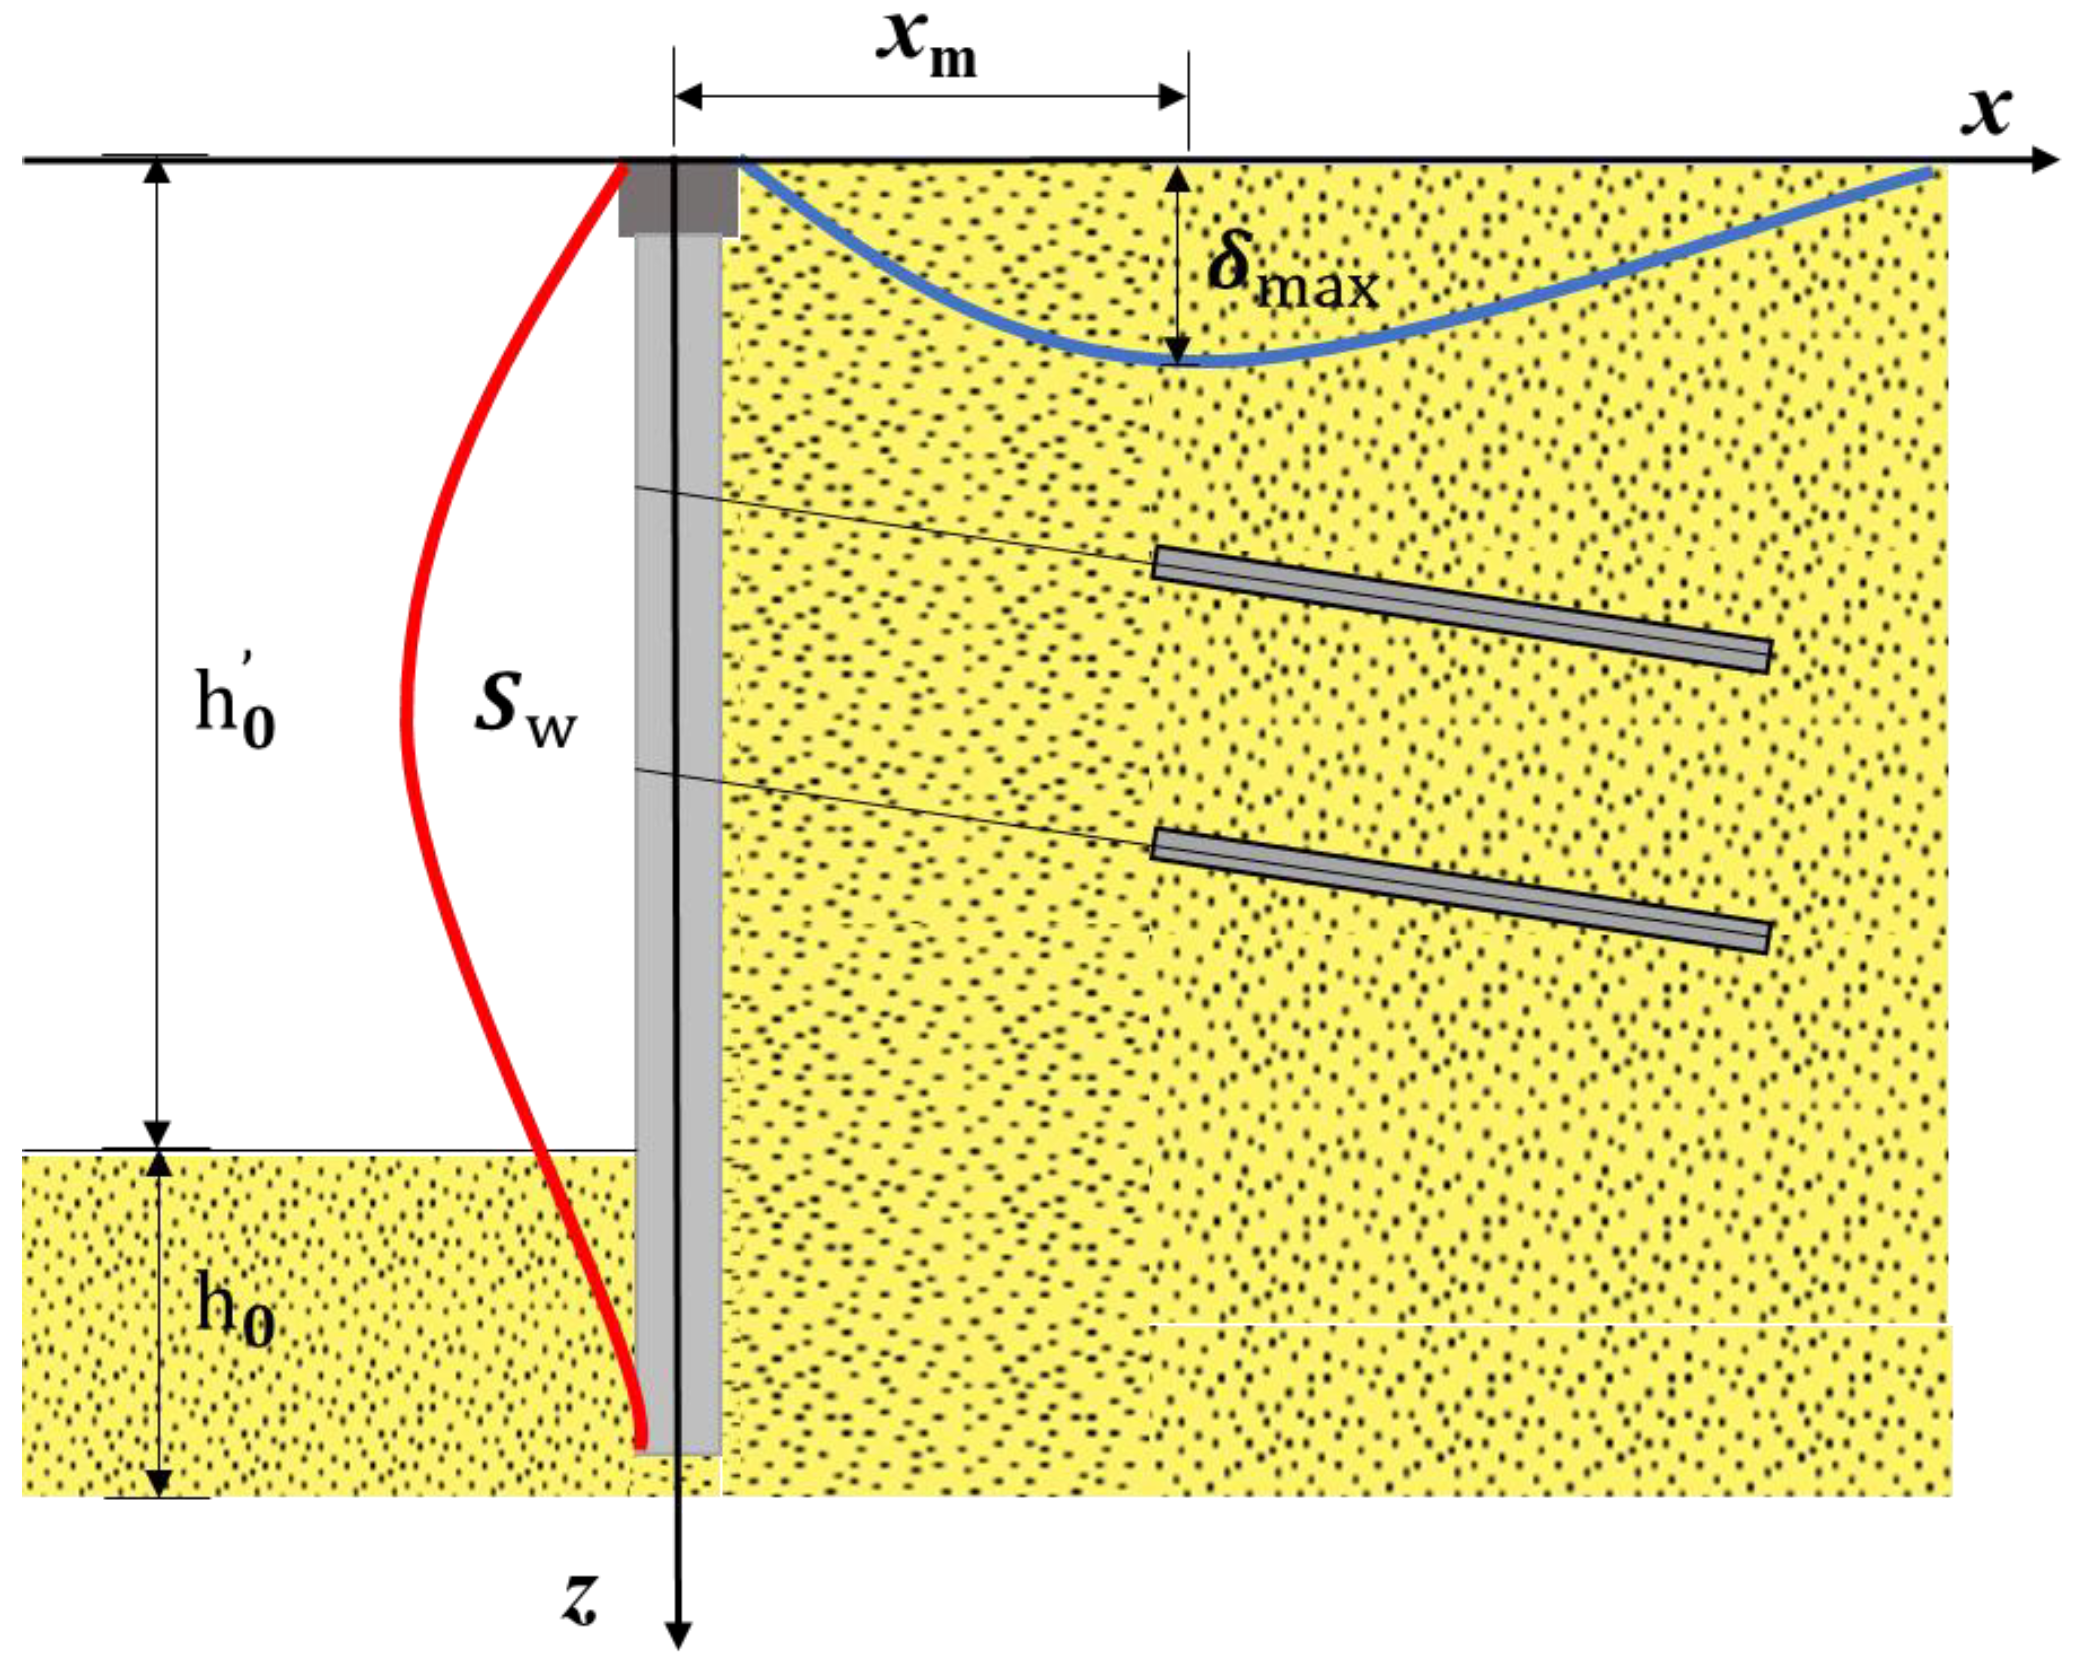
3.1. Deformation of Supporting Structure and Internal Water Migration of Soil

When the excavation is finished, the overall displacement of the support structure was minimal, with a maximum displacement of 0.27 mm, according to the analysis of the test data (Figure 6). This was because the excavation of the pit lessened the lateral constraints of the pit wall, which caused the soil of the pit’s side wall to generate a horizontal displacement to the inner side of the pit and act on the support structure, i.e., the coordination of deformation between the soil body and the support structure. The supporting structure’s displacement increased with the number of freezing and thawing cycles and tended to stabilize after ten cycles. At this point, the supporting structure’s displacement at various measurement points was clearly greater than that at the time the excavation was completed, with the pile body’s maximum displacement measuring 1.43 mm, or 5.30 times the excavation’s completion time. The soil freezing deformation created the freezing force acting on the supporting structure, which, when combined with the anchor rod tension and the horizontal freezing force, resulted in a significant horizontal displacement and the coordination of deformation between the earth and the supporting structure. The supporting structure created a significant horizontal displacement under the combined action of the anchor pulling force and the horizontal frost expansion force. This displacement progressively increased as the rate of frost expansion increased and the stiffness of the constraint decreased, leading to increased settlement and deformation of the foundation pit surface. However, through finite element analysis, related researchers discovered that the cohesion and friction angle significantly affected the displacement of the pile and anchor support structure [23]. Additionally, the freezing and thawing cycle and excavation unloading will cause a soil body to lose strength, meaning that its ability to withstand deformation will deteriorate and the displacement of the support structure will increase. For this reason, the effect of the coordination of deformation between the soil and the support structure should be considered when calculating the surface settlement of the foundation pit.
Soil moisture content, temperature, particle composition, and mineral composition are the primary determinants of frost heave and thaw settlement. According to pertinent researchers, it is clear that surface settlement during the freeze–thaw process is influenced by water migration in the soil [24,25,26,27]. Consequently, an analysis is conducted on the law of water migration in foundation pit soil during the freeze–thaw process.
To study the migration of soil moisture during the freeze–thaw cycle, the moisture content at each measurement point was compared to its initial moisture content. Increases in moisture content are represented here by positive values while decreases are represented by negative values. Regions with a negative change in water content were classified as frozen areas while regions with a positive change were classified as unfrozen areas. Figure 7 illustrates the moisture content change curves for two different sections of the model. The data show that as the number of freeze–thaw cycles increased, the moisture content in different sections of the model also changed. Specifically, the water content in the frozen regions progressively decreased with each freeze–thaw cycle while it increased in the unfrozen regions. This phenomenon occurred because pore water in unsaturated soil freezes, forming ice crystals during the freezing phase. These growing ice crystals draw water from the surrounding hydration films, causing water from the thicker hydration films to replenish the thinner ones. As a result, unfrozen water migrated upwards in the lower sections of the model, increasing the water content in the upper sections and decreasing it in the lower sections, thereby forming a freezing front. During the thawing phase, the ice in the upper sections melted and migrated downward under the influence of gravity, creating a melting front [9]. Throughout the entire freeze–thaw cycle, the migration of unfrozen water in the soil of the foundation pit was significantly influenced by gravitational forces, causing the continuous downward movement of water through the soil pores and effectively transferring water from the frozen to the unfrozen regions. The degree of frost heaving of the soil on the foundation pit’s side wall would progressively rise with water migration, and the impact of soil pressure on the pit’s supporting structure would be lessened. The soil’s ability to produce a horizontal frost heaving force would have become the primary effect on the supporting structure.
At Section One’s measurement stations, the variations in soil moisture content were more noticeable than in Section Two. In Section One, for example, the maximum change in moisture content at a site after five freeze–thaw cycles was 18%, but in Section Two, it was 15%. Smaller differences were seen at measurement locations in other parts. Moisture moved from regions farther away from the pit wall toward regions nearer to it throughout the freeze–thaw cycle. Additionally, the soil temperatures close to the pit wall were lower than those away from the wall due to bidirectional heat transfer within the foundation pit, which intensified the moisture migration effect in these regions. According to Figure 5, moisture content at sensors W5–W6 and W11–W12 remained stable throughout the freeze–thaw cycles, suggesting that no freezing or thawing occurred below a depth of 1.1 m. This indicates that the maximum freezing depth in the deep foundation pit was approximately 1.1 m.

3.2. Establishment of Calculation Model for Ground Settlement of Foundation Pit Considering Excavation and Freeze–Thaw

Figure 8 illustrates the ground surface settlement observed during the initial freeze–thaw cycle of the model. The physicochemical and mechanical properties of soil would change during the freezing and thawing cycle. These changes in the intrinsic properties would cause changes in the external form of the soil or the pit surface during the freezing and thawing cycle of deformation. As shown in Figure 8, the largest settlement point was near the pit’s side wall, the surface settlement curves of the pit during freezing and thawing were skewed, and the deformation of the surface surrounding the pit diminished as one moved farther away from the pit’s edge. When the ice in the soil body melted, the water in the pore space migrated due to self-gravitation, temperature distribution, etc., and was lost in all directions, which reduced the strength of the soil body and caused compression, i.e., the thawing and sinking deformation of the pit surface. During the freezing process, the water inside the soil body of the pit formed ice, which increased the pore volume of the soil body and caused the expansion of the volume of the soil body: the surface of the pit experienced freezing and expansion deformation. The ground surface created melt-sinking deformation.
When combined with Figure 4, it is evident that the surface settlement following a freeze–thaw cycle also exhibits a skewed distribution curve. Thus, the surface settlement during excavation cannot be used for the design and calculation of foundation pit engineering in seasonal frozen areas because the surface settlement outside the pit will increase during the freeze–thaw cycle and the deformation of each measuring point will increase by more than 50% in comparison to the excavation. The ground loss approach states that the relationship between the surface settlement area and the displacement area of the supporting structure [9] determines the surface settlement expression of any location surrounding the deep foundation hole:
δ x = S w 2 π w x e x p ln x 2 x m 2 / 2 w 2
Here, δ x is the surface settlement, x is the distance from the settlement point to the edge of the foundation pit, w is an empirical coefficient, and x m is the distance from the maximum settlement point to the edge of the foundation pit.
Based on Figure 8, the coefficient α under freeze–thaw conditions was found to be 0.4 in Equation (1). When the foundation pit was frozen, the value in the formula was positive, and when thawed, it was negative. Further analysis indicated that the coefficient could be directly calculated, with the first derivative of Equation (2) given thus:
δ x = S w 2 π w x 1 w 2 l n x 2 x m + 1 / x 2 e x p ln x 2 x m 2 / 2 w 2
At this time x = x m , δ x = 0 , when the position of the maximum settlement of the local surface is known, the coefficient can be obtained as w = 0 . 83 , and when x = x m = 0 . 4 h 0 substituted into Equation (2), the envelope area expression of the settlement curve can be obtained as follows:
S w = 1 . 1796 h 0 δ max
Here, δ max represents the maximum settlement value under excavation, freezing, or melting conditions. The relevant parameters are shown in Figure 9.
Thus, the surface settlement at any location on the ground surface under excavation and freeze–thaw conditions in a seasonal freeze zone can be calculated using the following equation:
δ x = 1 . 4212 h d δ max 2 π w x e x p ln x 0 . 8 h 0 2 / 1 . 3778

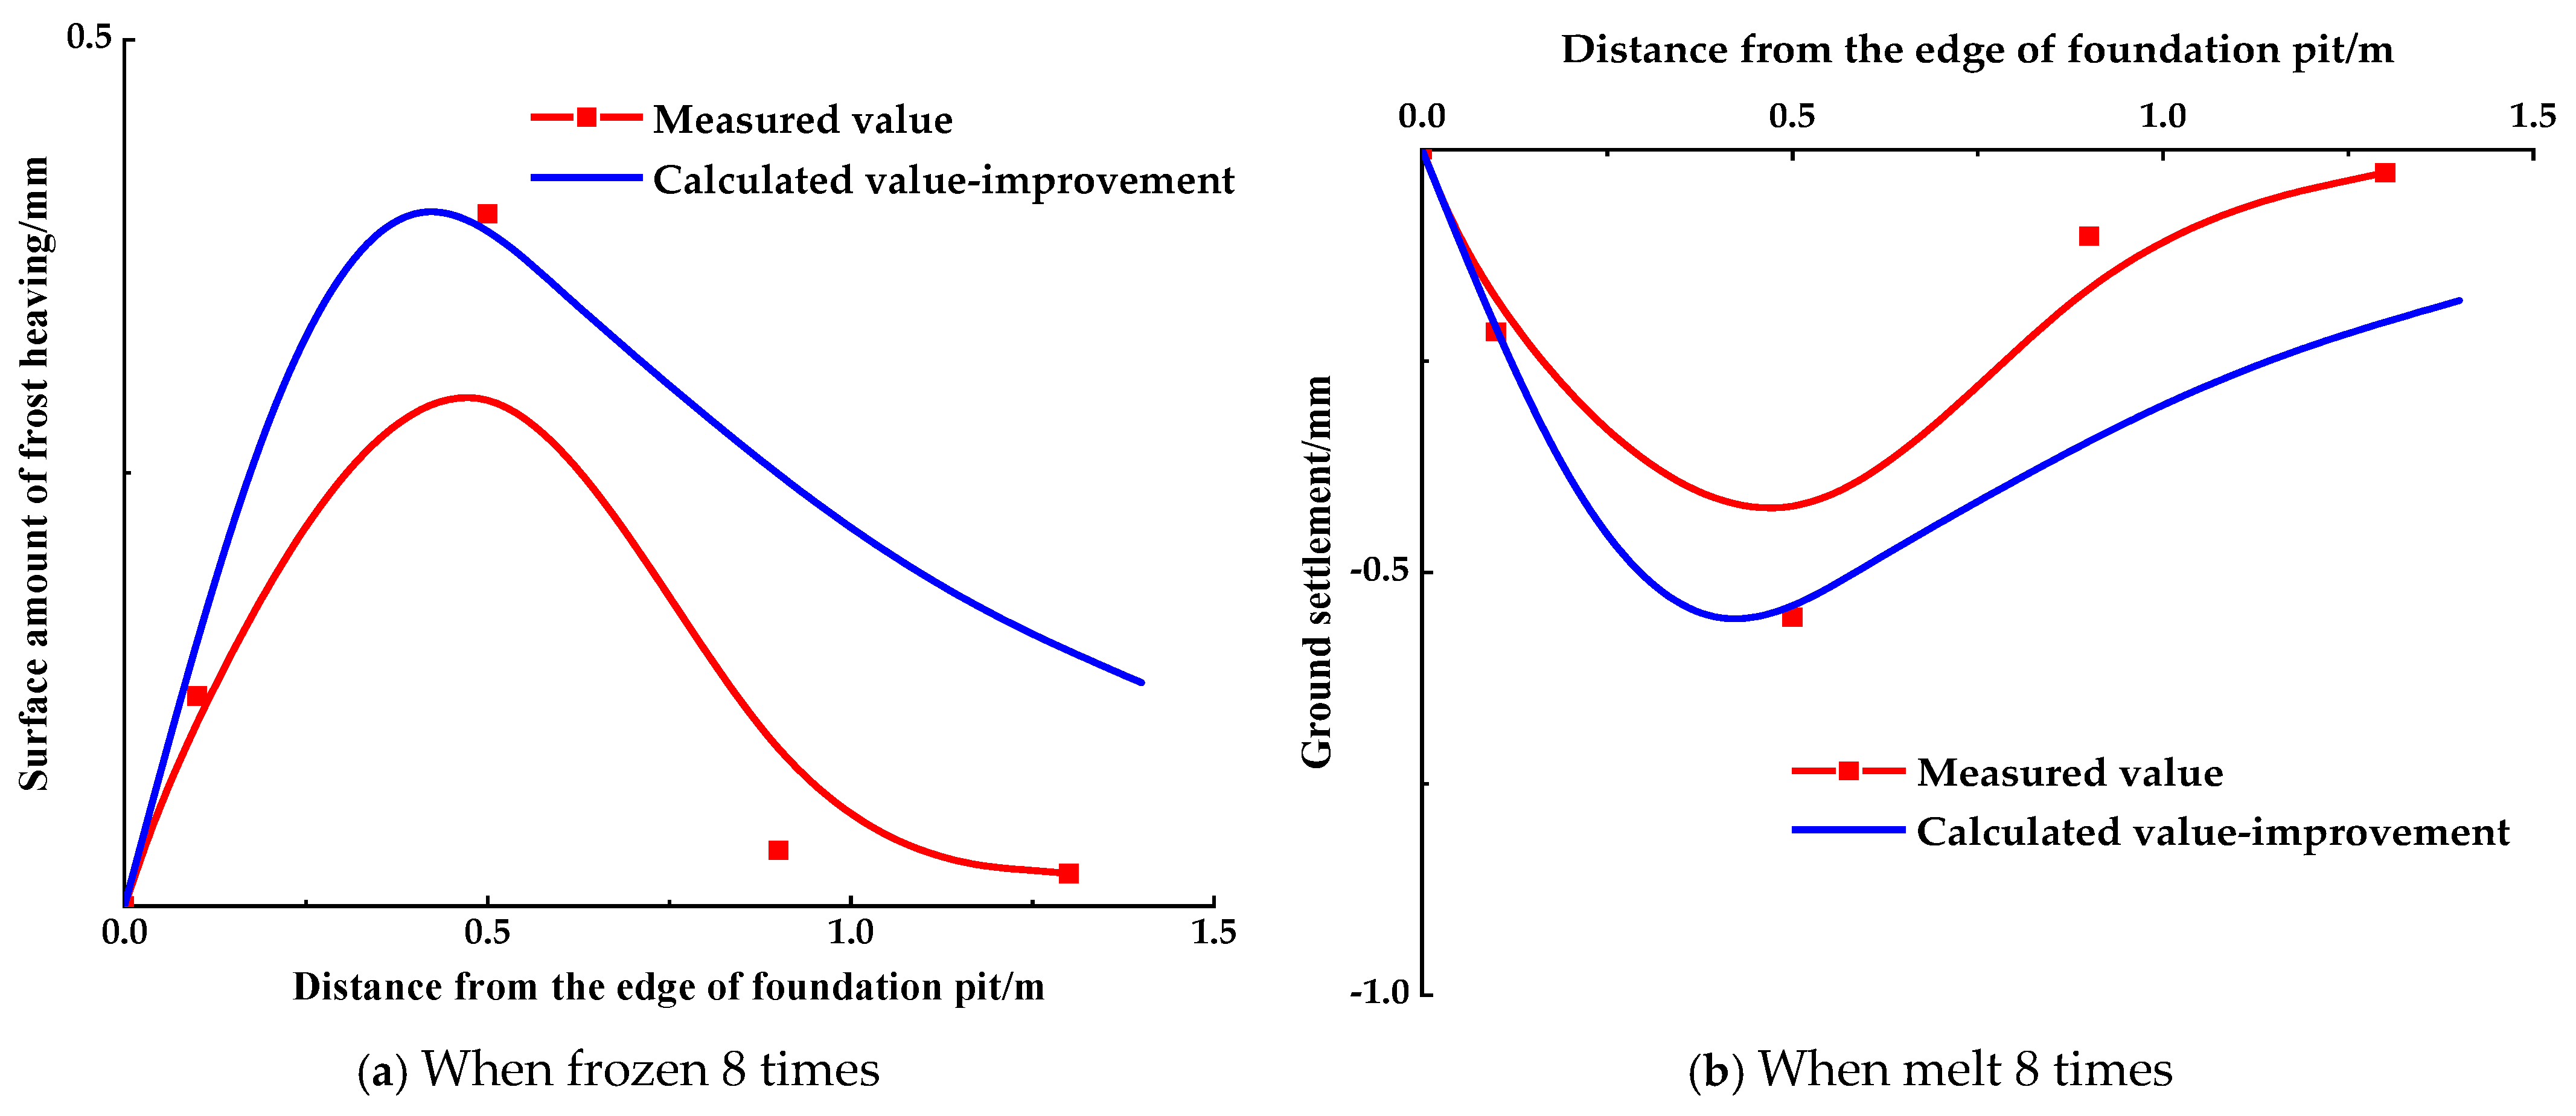
3.3. Model Verification

The surface settlement of the pile-anchor-supported deep foundation pit under excavation and freeze–thaw conditions can be calculated using Equation (5) by substituting the excavation depth, maximum settlement values under various conditions, and the coordinates of the measuring points. Settlement at any given point on the surface can be obtained by applying Equation (2) and comparing it with the envelope area of the deformation curve of the supporting structure. This process is complex, but the surface settlements under excavation, freezing, and thawing conditions are calculated using Equations (2) and (5) and compared with measured values. The comparative results are displayed in Figure 10.
Figure 10 shows that it is possible to use certain empirical relations to predict the surface settlement curve under pit excavation and freezing and thawing conditions as a skewed distribution mode. The distribution patterns of the calculated curves of the two methods are more in line with the measured values, which can better reflect the deformation pattern of the ground surface surrounding the pit, and the error is within an acceptable range. However, compared to the enhanced method, the settlement obtained using the traditional method during pit excavation, freezing, and thawing circumstances was bigger. When freezing for a single time, the traditional method yielded a maximum value of freezing expansion of 1.407 mm, which was safer and more conservative. The improved method yielded a maximum value of freezing expansion of 1.082 mm under the same conditions, which was closer to the measured value. Additionally, the maximum value of settlement obtained by the improved method under excavation and thawing conditions was also closer to the measured value. Not only does the new approach yield calculation results that are more accurate in predicting surface settlement, but it also calculates a maximum value of settlement under excavation and thawing conditions that is closer to the measured value.

4. Analysis of the Quantity of Freezes–Thaws Affects the Pit Surface’s Settlement

The data analysis revealed a strong correlation between the number of freeze–thaw cycles and the maximum surface settlement during the process. The maximum settlement was modeled as a function of the number of freeze–thaw cycles, as shown in Figure 11. The functional expression is as follows:
δ max = a + b e n / c
Here, δ max is the maximum surface settlement (in mm), n is the number of freeze–thaw cycles, and a , b , and c are fitting parameters.
Figure 11 and Table 2 show the fitting parameters during freezing and thawing phases. As the number of freeze–thaw cycles increased, the maximum surface settlement exhibited an exponential decay, as depicted in the curve. The maximum settlements during freezing cycles were consistently lower than those during thawing cycles. The fitting parameters derived from these observations are shown in Table 2.
Substituting Equation (6) into Equation (5), the surface settlement calculation expression for any point on the surface during various freeze–thaw cycles was as follows:
δ x = 1 . 4212 h d a + b e n / c 2 π w x e x p ln x 0 . 8 h 0 2 / 1 . 3778
Equation (7) can be used to compute thaw settlement and frost heave at various points around a foundation pit during different freeze–thaw cycles. Figure 12 and Figure 13 illustrate the comparison of calculated and measured surface settlements after four and eight freeze–thaw cycles. The settlement patterns remain consistent, showing a skewed distribution. The maximum settlements calculated using the improved method closely aligned with the measured values, demonstrating the accuracy and effectiveness of the model.

5. Conclusions

In order to investigate the deformation of the supporting structure, moisture migration within the soil, and the distribution pattern of surface settlement in the foundation pit in the seasonal permafrost zone, we employed loess that had been formulated with an 82% compaction for modeling tests. The following findings were reached:
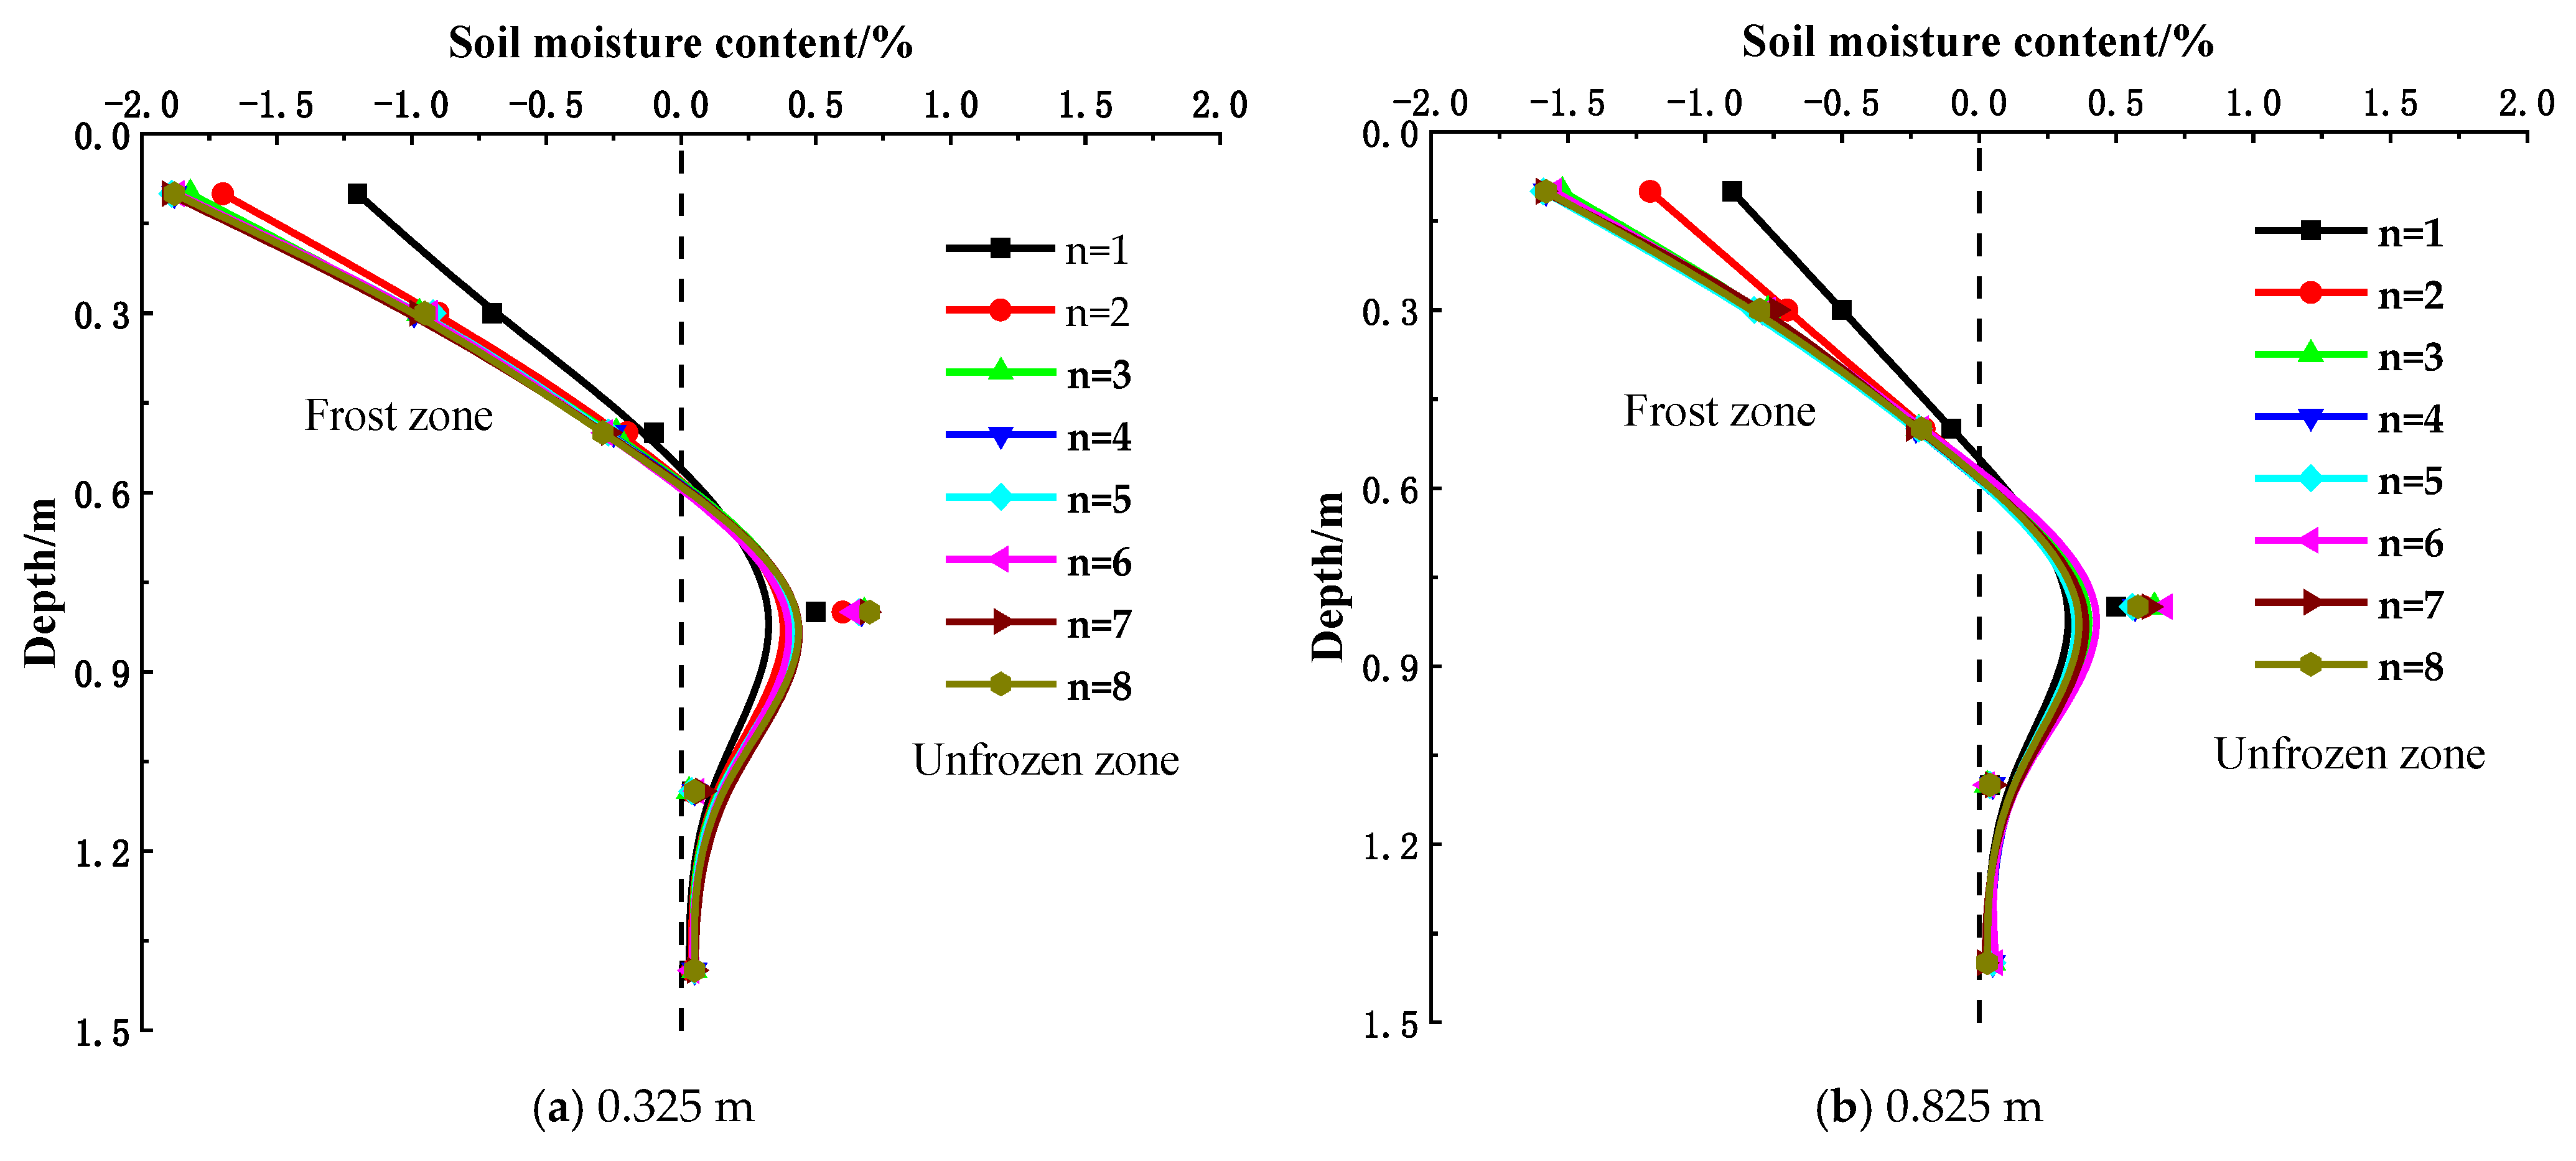
  • Based on the indoor scaling model test used to analyze the deformation of the supporting structure and moisture migration of the pit soil during the freeze–thaw process, the study demonstrated that the freezing depth was approximately 1.1 m, the displacement of the supporting structure increased with the number of freeze–thaw times, the coordination of the deformation between the supporting structure and the soil would increase the surface settlement, and the freeze–thaw cycle would cause the migration of moisture from the frozen area to the unfrozen area.
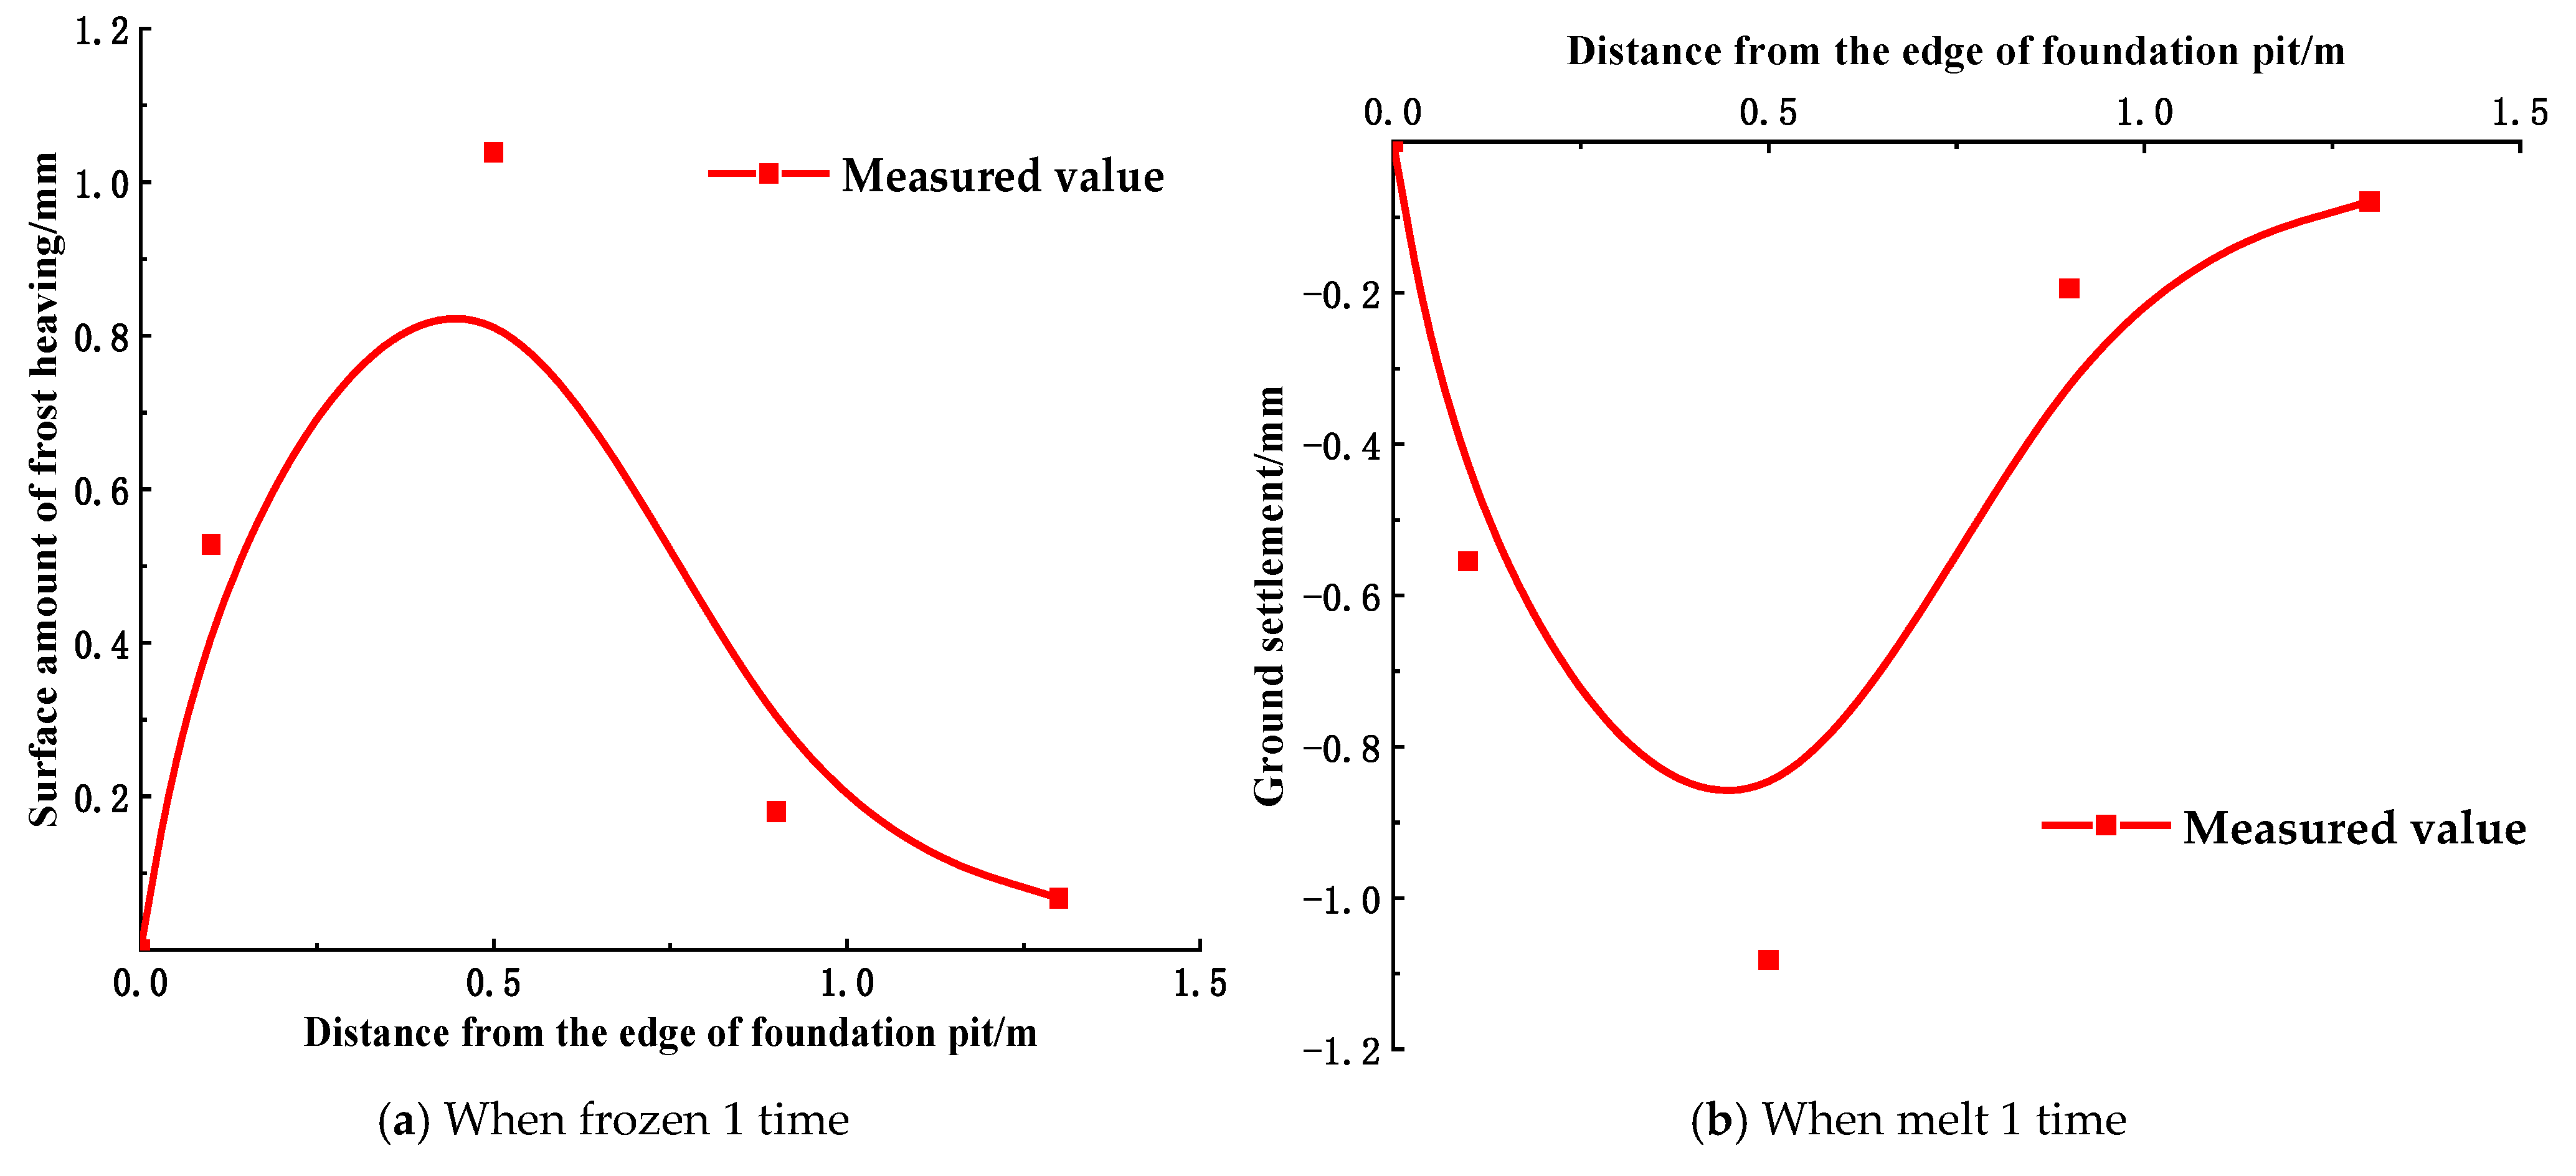
  • Under the impact of freeze–thaw cycles, surface settlement around the foundation pit first rose, reaching its maximum during the first cycle. Surface settlement had a maximum value of 1.082 mm, declined as the number of freeze–thaw cycles increased, and stabilized after eight cycles. This emphasizes how crucial it is to take early-stage surface deformation into account for foundation pit safety and stability.
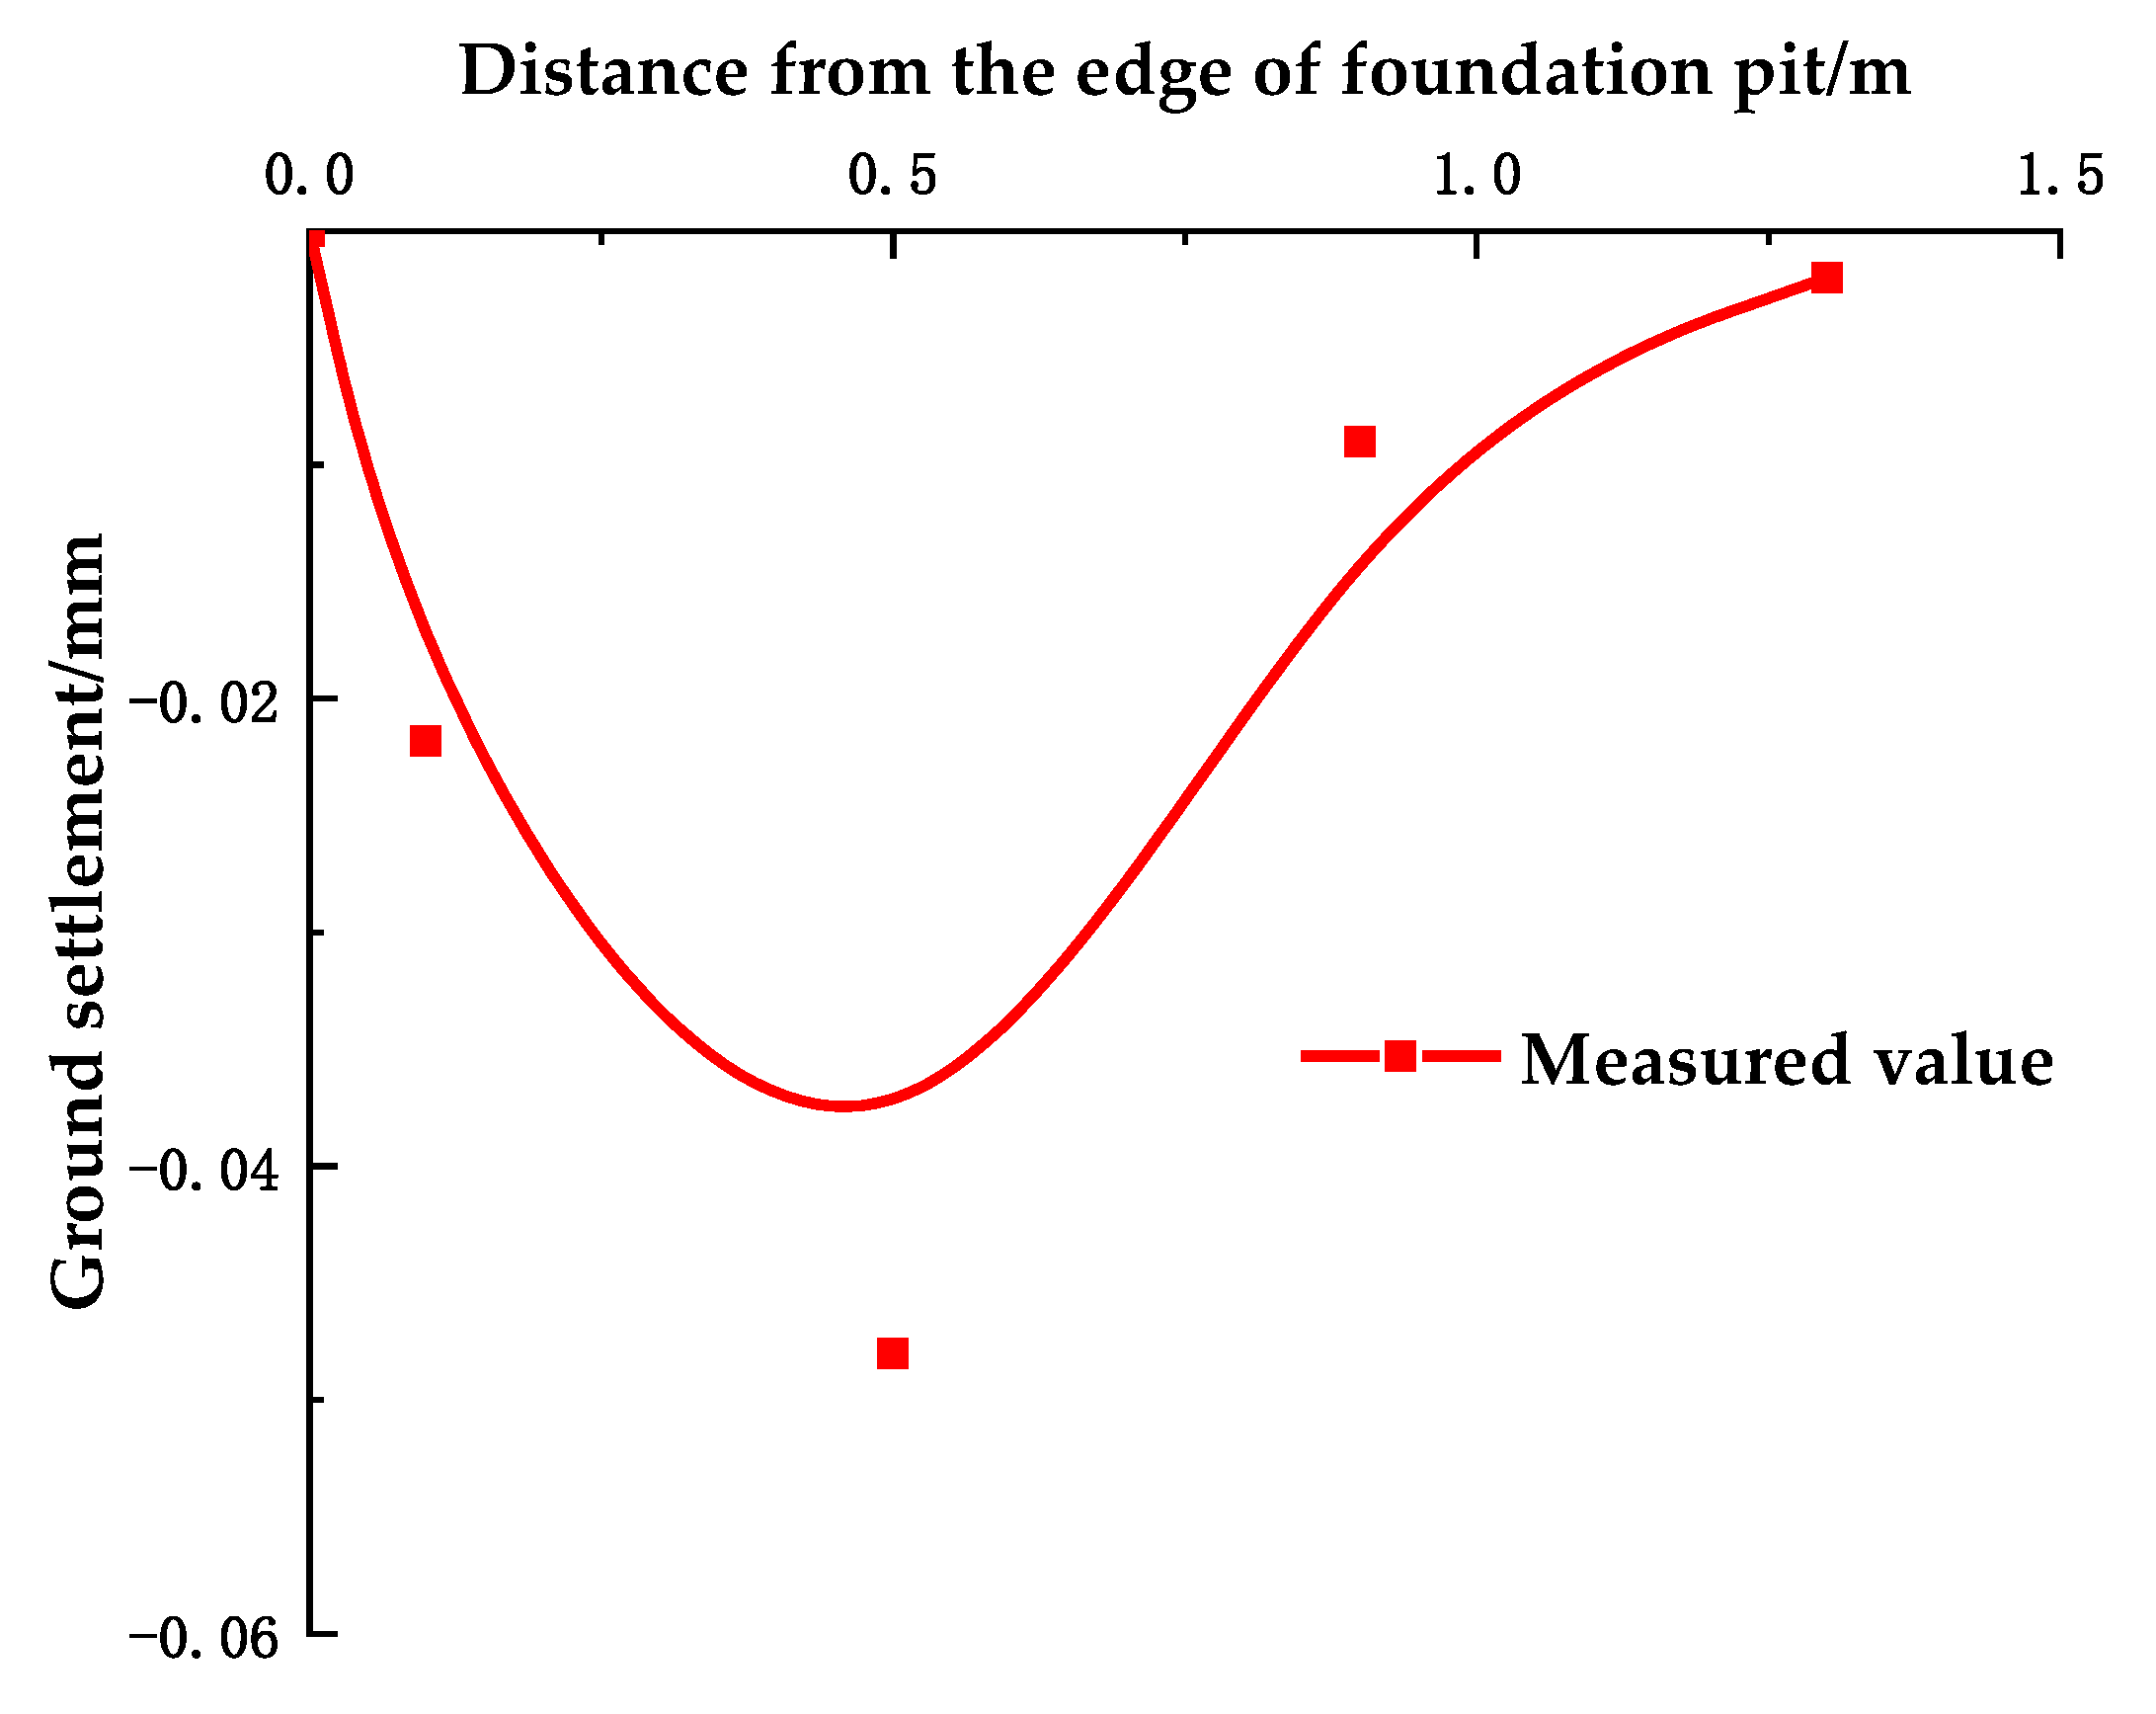
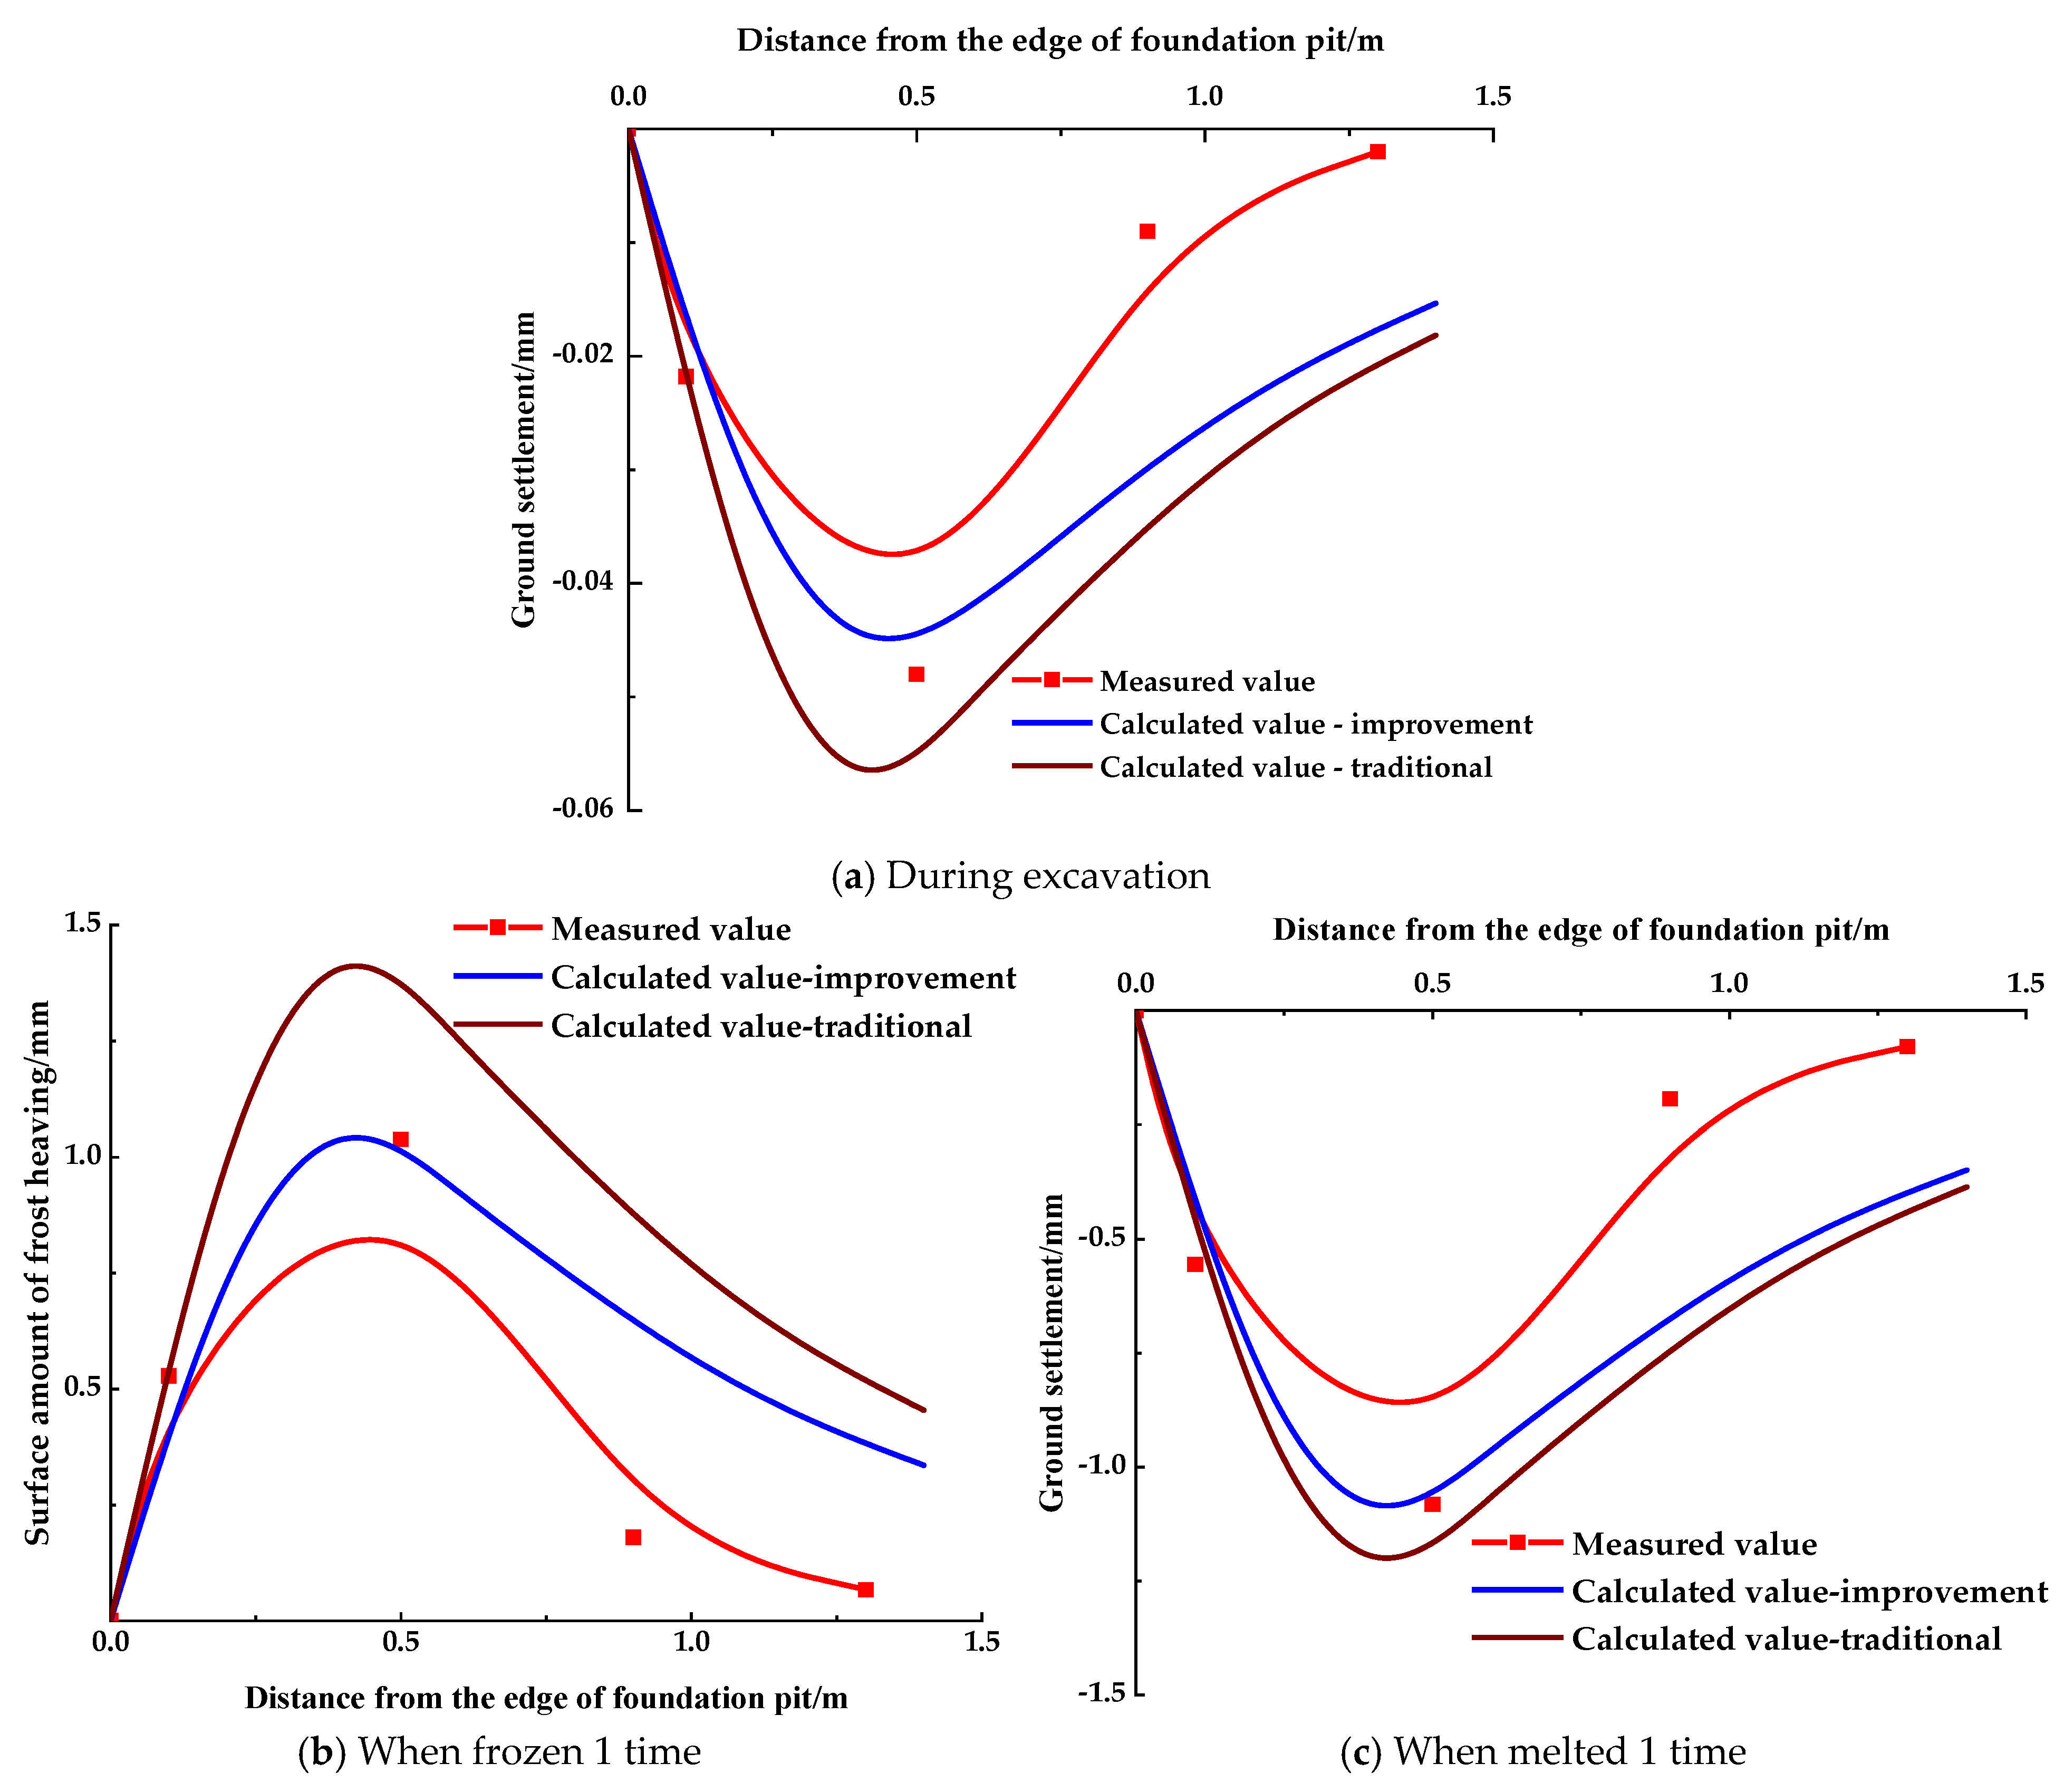
  • The calculation model of the surface settlement distribution pattern of the pile-anchor-supported deep foundation pit was optimized, and the method of calculating the settlement at any point of the surface under various freeze–thaw conditions was obtained based on the relationship between the maximum value of surface settlement and the number of freezing and thawing cycles. It was discovered that the surface settlement curves created during the excavation and freeze–thaw process of the foundation pit were skewed distributions.
The calculation model only considers the influence of freezing and thawing times on the surface deformation of a deep foundation pit supported by a loess pile anchor, which has certain limitations. In a follow-up study, the surface deformation of foundation pits under different soil, water contents, and supporting structure types should be further studied.

Author Contributions

Conceptualization, Y.L.; Methodology, Y.L.; Software, C.M.; Validation, Y.L.; Formal analysis, S.C.; Investigation, J.S.; Resources, C.M. and J.S.; Data curation, S.C.; Writing—original draft, Y.L.; Writing—review & editing, Y.L. All authors have read and agreed to the published version of the manuscript.

Funding

This research was funded by China Qinghai Provincial Science & Technology Department (NO.2023-ZJ-764).

Data Availability Statement

The data used to support the findings of this study are included within the article.

Conflicts of Interest

The authors declare no conflict of interest.

References

  1. Chen, H.H.; Li, J.P.; Yang, C.Y.; Feng, C. A theoretical study on ground surface settlement induced by a braced deep excavation. Eur. J. Environ. Civ. Eng. 2018, 10, 1080–1100. [Google Scholar]
  2. Dan, K.; Sahu, R.B. Estimation of ground movement and wall deflection in braced excavation by minimum potential energy approach. Int. J. Geomech. 2018, 18, 04018068. [Google Scholar]
  3. Zhang, D.W.; Shu, J.C.; Sun, J.P. Observed deformation characteristics of a deep excavation for the spring area in Jinan. J. Mt. Sci. 2017, 14, 581–594. [Google Scholar]
  4. Hsieh, P.G.; Ou, C.Y. Simplified approach to estimate the maximum wall deflection for deep excavations with cross walls in clay under the undrained condition. Acta Geotech. 2016, 11, 177–189. [Google Scholar]
  5. Lim, A.; Ou, C.Y. Stress paths in deep excavations under undrained conditions and its influence on deformation analysis. Tunn. Undergr. Space Technol. 2017, 63, 118–132. [Google Scholar]
  6. Liyana, D.S.; Nishanthan, R. Influence of deep excavation induced ground movements on adjacent piles. Tunn. Undergr. Space Technol. 2016, 52, 168–181. [Google Scholar]
  7. Li, Y.X.; Zhang, W.Y.; Jiang, N.S. Surface Settlement Damage Model of Pile-Anchor Supporting Structure in Deep Excavation. Adv. Civ. Eng. 2020, 10, 115–128. [Google Scholar]
  8. Qu, Y.L.; Niu, W.K.; Niu, F.J. Shear Properties and Mechanism of Freeze-Thaw Interface in Unsaturated Coarse-Grained Soil from Qinghai-Tibet Plateau. Adv. Civ. Eng. 2021, 10, 1155–1163. [Google Scholar]
  9. Wang, Q.S.; Li, Y.J.; Li, P.; Qi, Y.P. Using Cement and Calcium Lignosulfonate to Improve the Mechanical Properties and Microstructure of Loess in a Seasonal Freezing Zone. Build. 2024, 14, 14061945. [Google Scholar]
  10. Lu, B.; Zhao, W.; Li, S.J.; Dong, M.M. Study on Seasonal Permafrost Roadbed Deformation Based on Water–Heat Coupling Characteristics. Buildings 2024, 14, 2710. [Google Scholar] [CrossRef]
  11. Tang, M.X.; Zhao, X.H. Analysis of ground settlement around deep excavation. Build. Sci. 1996, 4, 31–35. [Google Scholar]
  12. Nie, Z.Q.; Zhang, S.G.; Meng, S.P. Surface settlement of deep foundation pits by excavation. Chin. J. Geotech. Eng. 2008, 30, 1218–1223. [Google Scholar]
  13. Zhang, S.; Wang, D.S.; Peprah-Manu, D.; Wang, Y.; Ng, C.W. Cyclic freeze–thaw induced stiffness anisotropy of sandy silt under all-round and unidirectional freezing modes. Catena 2024, 236, 107749. [Google Scholar] [CrossRef]
  14. Li, Y.X.; Zhu, Y.P.; Ye, S.H.; Ma, X.R. Skewness distribution patterns of surface settlement considering overload effect. Chin. J. Geotech. Eng. 2018, 40, 171–176. [Google Scholar]
  15. Mo, D.; Gong, B.D. Analysis of settlement of adjacent shallow foundation buildings induced by foundation pit excavation. Build. Struct. 2022, 52, 2315–2321. [Google Scholar]
  16. Yang, X.H.; Cai, S.C.; He, S.H.; Shao, Y.; Yan, C.-G. Force and deformation characteristics of subway station foundation pit under severe cold condition. J. Traffic Transp. Eng. 2023, 23, 233–247. [Google Scholar]
  17. Liu, G.B.; Wang, W.D. Foundation Pit Engineering Manual, 2nd ed.; China Building Industry Press: Beijing, China, 2009. [Google Scholar]
  18. Gao, X.Y. Freeze-Thaw Damage Model of Deep Excavation Settlement in Loess Areas of Xining; Qinghai University: Xining, China, 2022. [Google Scholar]
  19. Li, H.; Song, Y.Y.; Zhou, J.; Li, J.; Shen, Z. Filed Test of Pile-anchor Retaining Structure Mechanical and Deformation Characteristics in Deep Foundation Pit. Chin. J. Undergr. Space Eng. 2017, 13, 264–270. [Google Scholar]
  20. Zhu, L. Study on Performance of Prestressed Pile Anchor System for Deep Foundation Pit during Spring Thaw in High Lati Cold Zone; Harbin Polytechnic Institute: Ha’erbin, China, 2022. [Google Scholar]
  21. Wu, D.Y.; Lai, Y.M.; Ma, Q.G.; Wang, C. Model test study of water and salt migration and deformation characteristics in seasonally frozen soil. Rock Soil Mech. 2016, 37, 465–476. [Google Scholar]
  22. Wang, T.L.; Bu, J.Q.; Wang, Y.; Xu, L.; Yan, H. Thaw subsidence properties of soils under repeated freeze-thaw cycles. Chin. J. Geotech. Eng. 2014, 36, 625–632. [Google Scholar]
  23. Ling, Y.Q.; Song, L.; Hao, J. Analytical analysis for horizontal displacement of pile anchor support structure considering prestress. Front. Ecol. Evol. 2023, 11, 1239–1249. [Google Scholar] [CrossRef]
  24. Bai, Q.B.; Li, X.; Tian, Y.H.; Fang, J.H. Equations and numerical simulation for coupled water and heat transfer in frozen soil. Chin. J. Geotech. Eng. 2015, 37, 131–136. [Google Scholar]
  25. Masum, S.A.; Kirk, G.J.; Daly, K.R.; Roose, T. The effect of non-uniform microscale distribution of sorption sites on solute diffusion in soil. Eur. J. Soil Sci. 2016, 67, 514–522. [Google Scholar] [CrossRef]
  26. Teng, J.; Zhang, X.; Zhang, S. An analytical model for evaporation from unsaturated soil. Comput. Geotech. 2019, 108, 107–116. [Google Scholar] [CrossRef]
  27. Wan, X.; Gong, F.; Qu, M. Experimental study of the salt transfer in a cold sodium sulfate soil. KSCE J. Civ. Eng. 2019, 23, 1573–1585. [Google Scholar] [CrossRef]
Figure 1. Test model box.
Buildings 15 01104 g001
Figure 2. Test model and sensor layout (unit: mm).
Buildings 15 01104 g002
Figure 3. Freeze–thaw environment simulation system.
Buildings 15 01104 g003
Figure 5. Ground deformation of foundation pit under freeze–thaw action.
Buildings 15 01104 g005
Figure 6. Deformation of support structures during excavation and freeze–thaw.
Buildings 15 01104 g006
Figure 7. Moisture content change curve for different freeze–thaw times.
Buildings 15 01104 g007
Figure 8. Ground surface settlement when the foundation pit was frozen and thawed once.
Buildings 15 01104 g008
Figure 9. Surface subsidence calculation diagram.
Buildings 15 01104 g009
Figure 10. Comparison between computed and measured surface settlements.
Buildings 15 01104 g010
Figure 11. Maximum surface subsidence fitted to the number of freezes–thaws.
Buildings 15 01104 g011
Figure 12. Comparison between computed and measured surface settlements.
Buildings 15 01104 g012
Figure 13. Comparison between computed and measured surface settlements.
Buildings 15 01104 g013
Table 1. Soil properties.
Soil GroupDensity ρ / g c m 2 Gravity γ / kN × m 3 Area S / c m 2 Water Content W /%
Loess1.7118240010.48
Table 2. Fitting parameters during freezing and thawing.
Working ConditionabcR2
Freeze−0.543−0.8322.3880.974
Thaw0.3900.9912.4130.977
Disclaimer/Publisher’s Note: The statements, opinions and data contained in all publications are solely those of the individual author(s) and contributor(s) and not of MDPI and/or the editor(s). MDPI and/or the editor(s) disclaim responsibility for any injury to people or property resulting from any ideas, methods, instructions or products referred to in the content.

