Article

Performance Optimization and Field Validation of Post-Grouting Geopolymer Materials for Pile Foundations: Microstructural Insights and Environmental Durability

1
Zhengzhou Transportation Development Investment Group Co., Ltd., Zhengzhou 450000, China
2
General Institute of Water Resources and Hydropower Planning and Design, Ministry of Water Resources, Beijing 100120, China
3
Yellow River Institute of Hydraulic Research, Yellow River Conservancy Commission, Zhengzhou 450003, China
4
Research Center for Levee Safety Disaster Prevention, Ministry of Water Resources, Zhengzhou 450003, China
5
Yellow River Laboratory, Zhengzhou 450003, China
6
Henan Yellow River Expressway Co., Ltd., Zhengzhou 475002, China
7
School of Water Conservancy and Transportation, Zhengzhou University, Zhengzhou 450001, China
8
Shanghai Tunnel Engineering Co., Ltd., Shanghai 200032, China
*
Author to whom correspondence should be addressed.
Buildings 2025, 15(7), 1121; https://doi.org/10.3390/buildings15071121
Submission received: 27 February 2025 / Revised: 25 March 2025 / Accepted: 27 March 2025 / Published: 29 March 2025
(This article belongs to the Section Building Structures)

Abstract

:
To investigate the potential application of geopolymer materials in pile foundation post-grouting engineering, this study utilized industrial solid wastes such as fly ash (FA), slag (SL), and steel slag (SS) to prepare geopolymer grouting materials (GGMs) with various mix proportions. The fluidity, setting time, bleeding rate, and mechanical properties of these materials were evaluated to determine the optimal mix proportions for pile foundation grouting. Furthermore, the influence mechanisms of different maintenance conditions on material performance were investigated, including unconfined compressive strength, flexural strength, and microstructural changes. The results indicated that when the SL-to-FA ratio was 1:1, the GGMs satisfied the requirements for pile foundation grouting, and their mechanical properties significantly improved with extended curing time. Under Yellow River water maintenance conditions, the materials formed a dense three-dimensional network of hydrated products, notably enhancing their mechanical characteristics. Additionally, field tests confirmed that GGMs effectively improved the shear strength of the pile–soil interface. The grout distribution pattern on the pile side exhibited a “compaction-splitting” mechanism. These research findings provide theoretical support for applying geopolymer materials in pile foundation grouting engineering.

1. Introduction

Due to its of powerful adaptability, high bearing capacity (BC), and low construction cost, the bored cast-in-place pile is widely used in the construction of foundations for houses, roads, bridges, and other projects [1]. However, during pile formation, the key role of slurry wall protection is used to prevent collapse. After the pile is formed, a mud skin forms on the side of the pile and sediment accumulates at the pile base. If left unaddressed, these issues can reduce the pile foundation’s bearing performance [2]. Post-grouting technology (Figure 1) has emerged as an effective method to address these challenges and improve the pile foundation’s bearing performance [3,4]. It also enables designers to reduce pile length, thereby decreasing concrete consumption in the pile [5,6]. Cement is the most commonly used post-grouting material for pile foundations. It is estimated that 5% to 7% of global carbon dioxide (CO2) emissions are generated during cement production [7,8]. As the world’s largest cement producer, China accounts for approximately 54% of global cement output [9]. To mitigate the global “greenhouse effect”, the Chinese government has pledged to achieve peak carbon emissions by 2030 and carbon neutrality by 2060 [10]. Beyond carbon footprint, cement grouts pose additional environmental risks: (1) chemical leaching through groundwater seepage may alter aquatic chemistry, potentially contaminating water resources; (2) soil infiltration could disrupt microbial ecosystems and modify soil physicochemical properties, triggering adverse ecological impacts. Therefore, research on green, low-carbon post-grouting materials has already become a current and critical topic.
Widely acknowledged as an eco-friendly construction material, geopolymers leverage aluminosilicate-rich natural minerals and industrial byproducts as primary raw materials. It is activated at room temperature using sodium hydroxide (NaOH) or alkaline solutions to initiate the polymerization reaction [11]. In contrast to ordinary Portland cement, geopolymer not only avoids the release of large amounts of CO2 from the calcination of calcium carbonate (CaCO3) but also utilize industrial wastes, such as fly ash (FA), slag (SL), coal gangue, silica fume (SF), and waste bricks, effectively promoting efficient recycling and reuse of industrial waste [12,13,14]. Studies indicate that geopolymers reduce CO2 emissions by 70–80% and energy consumption by 43% [15] while exhibiting superior mechanical properties, thermal stability, frost resistance, and durability—attributes that position them as a viable cement alternative [16]. First conceptualized by Davidovits [17], as their green, low-carbon, and sustainable properties have been recognized by many scholars [18], research on geopolymers has become a hot topic. Fort et al. [19] investigated the curing reaction mechanism of powdered brick geopolymers based on reaction kinetics, microstructure, and composition, taking into account the silicate modulus (SM) of the alkaline activator and the variation of maintenance conditions, and found that the type of zeolite phases in the reaction products was significantly affected by the SM. Yazdi et al. [20] studied the properties of waste brick powder-based polymers using XRD, thermogravimetric analysis (TGA), environmental scanning electron microscopy (ESEM), and MIP microanalytical methods, combined with compressive and flexural mechanical property tests. Their work examined the correlation between the micro-properties and mechanical performances of slag-containing, high-strength fly ash (FA)-based polymers. Wang et al. [21] used molecular dynamics simulations and flexural and compressive strength tests to investigate the curing mechanism of mineral micro powder/kaolinite base polymers. They found that the geopolymers exhibited excellent mechanical properties at a mineral micro powder content of 30 wt%. Hui-Teng et al. [22] compared the thermal stability and mechanical properties between fly ash (FA) and fly ash-ladle slag (FA-LS) geopolymers through microscopic thermomechanical characterization and compressive strength tests and found that FA-LS geopolymers have high compressive strength and good heat resistance. The above-mentioned scholars formulated different geopolymer materials using various wastes and investigated the properties of these materials through mechanical properties and microstructural characterization tests, but fewer studies have been conducted on the grouting properties of geopolymer materials.
Grouting is a commonly used method in foundation engineering reinforcement [23,24]. With the emergence of environmentally friendly building materials such as geopolymers and polymers, traditional cement-based grouting materials are gradually being replaced. In the research on geopolymer grouting materials (GGMs), Ge et al. [25] investigated the curing mechanism and mechanical properties of underwater GGMs using XRD, XRF, SEM, and unconfined compressive strength tests. They found that leaching or intrusion of the slurry and hardening are the two competing processes that dominate the curing reaction and the final cured geopolymer’s properties. Li et al. [26] studied the viscoelastic and rheological properties of GGMs with different ratios of FA, SL, and SF using rotational rheological shear tests. They discovered that geopolymers have very good flowability compared to cement slurries, making them more suitable for use as grouting materials. Liu et al. [27] developed a slag-coal ash-based GGM while studying its composition and physical-mechanical properties through single-factor and orthogonal experiments. They found that the geopolymer could be used to fill voids under cement pavement slabs and repair cracks in cement-stabilized stones. Zhang et al. [28] used response surface methodology (RSM) to explore the effect of powder-to-binder percentage, sodium oxide content, and water-binder percentage and their interactions on the properties of GGM for road use. They concluded that the addition of water-reducing agents can improve the flowability and strength of GGM. Although scholars have executed extensive research on GGMs, there are few reports on using GGMs for post-grouting pile foundations.
This study developed GGMs using industrial solid wastes (fly ash (FA), steel slag (SS), and slag (SL) micro-powders) as primary raw materials. Through a comprehensive evaluation of fluidity, setting time, bleeding rate, and mechanical properties, the optimal formulation suitable for post-grouting cast-in-place piles was identified. Multi-scale characterization techniques including unconfined compressive strength (UCS), flexural strength (FS), scanning electron microscopy (SEM), X-ray diffraction (XRD), and Fourier-transform infrared spectroscopy (FTIR) were employed to elucidate the mechanisms underlying the effects of maintenance conditions and aging on GGM performance. Field validation was conducted through in situ interface shear tests, confirming the practical applicability of the developed geopolymer material. This research significantly enhances the utilization of industrial solid wastes (FA, SL, and SS micropowders) while advancing the application of post-grouting technology in cast-in-place pile foundations.

2. Materials and Methods

2.1. Raw Materials

FA originated from a power station in Henan Province and was categorized as low-calcium FA obtained from a high-temperature furnace. It was classified as Class II FA with an average particle size of 68 μm. SP originated from an iron and steel plant in Henan Province, which is an industrial by-product categorized as S95-grade high-temperature furnace slag micropowder with an average particle size of 18 μm. SS came from an iron and steel plant in Henan Province and is a high-temperature molten converter SS with an average particle size of 3.15 μm. The main chemical components of the FA, SP, and SS are indicated in Table 1, with data provided by the manufacturer; “Others” represents chemical compositions other than those known in Table 1, and “LOI” is the amount of loss on ignition. Sodium silicate (Na2SiO3) and sodium hydroxide (NaOH), serving as alkaline activators, were supplied by the Zhejiang Institute of Transportation Science. The Na2SiO3 solution had a modulus of 3.3, a Be° of 39.2, and a solids content of 25% by mass. NaOH, provided in solid flake form, had a purity of 99%. The water used to prepare the geopolymer slurry was local tap water.

2.2. Experimental Test Methods

To develop geopolymer materials suitable for post-grouting in pile foundations, seven different GGMs were prepared, referring to the findings of Zeng and Wang [29]. These GGMs utilize FA, SL, and SS as primary raw materials and are proportioned as follows (Table 2): GP-1 (FA:SP:SS = 1:0:0), GP-2 (FA:SP:SS = 0:1:0), GP-3 (FA:SP:SS = 0:0:1), GP-4 (FA:SP:SS = 1:1:0), GP-5 (FA:SP:SS = 1:0:1), GP-6 (FA:SP:SS = 0:1:1), GP-7 (FA:SP:SS = 1:1:1). In these formulations, sodium silicate (Na2SiO3) and sodium hydroxide (NaOH) were added at 10% and 5% of the material mass, respectively. According to the relevant requirements for post-grouting [30], a liquid-to-solid ratio of 0.6 was selected. Since the Na2SiO3 doping is only 5%, the liquid-to-solid ratio is calculated without considering the effect of water in the Na2SiO3 solution, and the solid materials include FA, SP, SS, and NaOH. Through fluidity, bleeding, setting time, and mechanical property tests, one suitable geopolymer material was chosen for post-grouting. Subsequently, macro- and micro-scale tests were conducted on the selected geopolymer material under different maintenance conditions and ages to determine the performance improvement mechanism of the prepared geopolymer material. Finally, field interface shear tests validated the feasibility of using the prepared geopolymer material for post-grouting pile foundations.
Figure 2 shows the preparation and performance testing process of geopolymer grouting materials. First, seven geopolymer grouting material slurries were prepared according to the mix ratios in Table 2. Then, the fluidity, bleeding rate, and setting time of the materials were tested, while the compressive and flexural strength test specimens were prepared and maintained. Finally, the specimens were tested for flexural and compressive strength, and the specimens after mechanical property testing were taken for SEM, XRD, and FTIR tests.

2.2.1. Macroscopic Performance Test

(1)
Fluidity test
Fluidity is a crucial parameter for assessing the diffusion of grouting materials [28]. According to GB/T 50448-2015 standards [31], the fluidity test (FT) for geopolymer post-grouting materials was conducted using the inverted cone method, as shown in Figure 2. The inverted cone has an upper diameter of 178.0 mm, a lower diameter of 12.7 mm, and a total height of 306.0 mm. It is a single-needle inverted cone made of stainless steel showing a thickness of 2.0 mm. About 1725 mL ± 5 mL of the stirred slurry was poured into the inverted cone. Once the tip of the single needle was in contact with the surface of the slurry, the lower plug of the inverted cone was opened, and a stopwatch was started simultaneously. The stopwatch was stopped when the slurry was visible at the cone’s mouth, and the flow time was recorded.
(2)
Bleeding test
Since groundwater and grouting pressure significantly affect slurry behavior during post-grouting in pile foundations, excessive bleeding can lead to segregation and blockages in grouting pipes [15]. To assess the bleeding characteristics of the geopolymer post-grouting materials prepared in this study, a test was performed using a graduated cylinder following the JT/T 946-2022 standard (Figure 2) [32]. Approximately 800 mL ± 10 mL of the mixed geopolymer slurry was poured into the graduated cylinder. After standing still for 1 min, the initial height of the slurry was measured and recorded as h1. Following 3 h of settling, the heights of the segregated water surface and the expansion surface of the slurry were measured and recorded as h2 and h3, respectively. The free bleeding rate (BR) of the slurry after i hours can be calculated according to Equation (1).
B f , i = h 2 h 3 h 1 × 100 %
(3)
Setting time test
Setting time is a critical parameter for determining construction timelines and estimating slurry diffusion distances in post-grouting pile foundations [33,34]. According to GB/T 1346-2011 [35], the Vicat apparatus was employed to measure the setting time of the slurry [27] (Figure 2). The mixed geopolymer slurry was poured into the test mold and vibrated to remove air bubbles, and excess material was scraped off. The mold was then placed in a standardized curing chamber. Initial testing commenced after 30 min, with observations recorded every 5 min as the initial setting time (IST) approached. The IST was defined as the time when the Vicat needle penetration reached 4 mm ± 1 mm. Subsequently, the mold was inverted 180°, and curing continued. For the final setting time (FST), tests were conducted every 15 min until the needle left no visible indentation on the slurry surface.
(4)
UCS and FS test
The mechanical properties of post-grouting materials play a pivotal role in enhancing the load-bearing capacity of piles [35]. To assess the mechanical performance of GGMs, UCS and FS tests were carried out in accordance with GB/T 17671-2021 [36]. Specimens with dimensions of 40 mm × 40 mm × 160 mm were prepared using a triple-gang mold (Figure 2), with three specimens per test condition. After demolding, specimens were cured in a standardized maintenance chamber for 7 days. Mechanical tests were performed using a combined compression-flexure testing machine. For FS testing, small beam specimens were loaded at a rate of 50 N/s, and flexural strength was calculated via Equation (2). For UCS testing, the halved beams were compressed at 2400 N/s using a compression fixture, with UCS calculated according to Equation (3):
FS :   R f = 1.5 F f L b 3
UCS :   R c = F c A
where Rf is FS (MPa); Ff indicates the load when the specimen breaks (N); L indicates the distance between the supporting columns (mm); b indicates the length of the stressed square cross-section; Rc is the UCS (MPa); Fc indicates the maximal load at the time of compression damage (N); and A is the compressed area (mm2).

2.2.2. Microstructure Test

(1)
SEM test
A FEI QUANTA FEG250 field emission scanning electron microscope was used to characterize the microscopic morphology of geopolymer grouting material blocks; the size of the specimen was 1 cm × 1 cm × 1 cm, with a resolution of 3.0 nm in high-vacuum pattern, a magnification of 50 w, and an accelerating voltage of 30 kV.
(2)
XRD test
A Bruker D8 Advance XRD was employed to construe the chemical component and crystal structure of GGMs; the test samples were milled and dried geopolymer powders, and the particle size was approximately 2 μm; the XRD test was executed through a Cu target, the scanning rate was 5°/min, and the diffraction angle test varied from 5° to 90°.
(3)
FTIR test
Functional group analysis was performed using an iS50 FTIR spectrometer manufactured by Thermo Fisher Scientific, Waltham, MA, USA, and the samples were ground and dried geopolymer powder, with a particle size of approximately 2 μm; the spectra were collected in the range of wave number between 400 cm−1 and 4000 cm−1, with the resolution being 4 cm−1.

3. Results and Discussion

3.1. Optimization of GGMs

Table 3 presents the macroscopic performance test results of seven GGMs, along with comparative data from existing geopolymer materials [29] and traditional cement-based materials under identical liquid-to-solid ratios. Flexural strength (FS) and unconfined compressive strength (UCS) at 7 days were selected as primary mechanical performance indicators, with all results averaged across three specimens or repeated tests (fluidity test [FT], bleeding rate [BR], initial setting time [IST], and final setting time [FST]). GGM GP-2 (FA:SP:SS = 0:1:0) exhibited the shortest initial setting time (29 min); however, its rapid fluidity loss makes it unsuitable for post-cast pile grouting due to challenges in controlling construction timelines. In contrast, GP-4 (FA:SP:SS = 1:1:0) demonstrated optimal performance for post-cast pile grouting, balancing superior fluidity (9.1 ± 0.2 s), low bleeding rate (0.1 ± 0.02%) and setting times (IST = 95 ± 4.9 min, FST = 155 ± 4.1 min), and enhanced mechanical properties (FS = 4.82 ± 0.16 MPa, UCS = 25.51 ± 1.13 MPa). These attributes meet critical construction requirements, including compatibility with underwater grouting. Traditional cement-based grouting materials (Figure 3) showed higher bleeding rates (0.3 ± 0.02%) and prolonged setting times (IST = 245 ± 5.7 min, FST = 385 ± 10.6 min), which hinder post-grouting efficiency. Although the geopolymer material presented by Zeng and Wang [29] achieved high mechanical strength, its poor fluidity (32.35 s) and short initial setting time (34 min) limit practical applicability for slurry diffusion and construction control. Therefore, GP-4 is identified as the optimal grouting material for post-cast pile applications.

3.2. The Impact of Maintenance Conditions and Age on the Mechanical Performance of GGMs

Since post-grouting technology for bored piles is widely applied to the foundations of large bridges and buildings, the maintenance environment of the grout body after grouting includes submersion in groundwater and river water and natural drying (in arid areas). To explore the suitability of the GP-4 type geopolymer material for use in post-grouting of bored piles, Figure 4 presents the changes in FS and UCS of the GP-4-type geopolymer material under different maintenance conditions as the curing age increases. It can be seen that, similar to cement materials, the geopolymer grout has a lower FS but a higher UCS. From Figure 4a, it is evident that the FS of the GP-4-type geopolymer material increases with curing age, and FS under Yellow River water immersion maintenance (YRWIM) conditions is greater than that under pure water immersion maintenance (WIM) and natural drying maintenance (NDM) conditions. In the initial stages of maintenance, the FS increases quickly and then gradually slows down after 7 days. For example, under YRWIM conditions, the FS of the geopolymer grout after 1, 3, 7, and 28 days of curing is 3.1 ± 0.79 MPa, 4.1 ± 0.53 MPa, 5.8 ± 0.47 MPa, and 6.4 ± 0.21 MPa, respectively, representing increases of 32.26%, 41.46%, and 10.34%. Under WIM conditions, the FS of the geopolymer grout after 1, 3, 7, and 28 days of curing is 3.0 ± 0.35 MPa, 4.0 ± 0.11 MPa, 5.4 ± 0.44 MPa, and 5.7 ± 0.23 MPa, representing increases of 33.33%, 35.00%, and 5.56%. Under NDM conditions, the FS of the geopolymer grout after 1, 3, 7, and 28 days of curing is 2.7 ± 0.15 MPa, 3.5 ± 0.32 MPa, 4.7 ± 0.06 MPa, and 4.9 ± 0.06 MPa, respectively, representing increases of 33.33%, 35.00%, and 5.56%. Notably, as the curing age rises, the FS first rises and then decreases, reaching its maximum increase between 3 and 7 days. Moreover, in the first 1–3 days of curing, the increase in FS under WIM conditions is the greatest, while in the later stages of curing, the increase in FS under YRWIM conditions is the greatest.
As shown in Figure 4b, similar to FS, the UCS of GP-4 type geopolymer material increases with curing age [16]. Under YRWIM conditions, the UCS is more significant than under WIM and NDM conditions. UCS increases quickly in the initial curing stages, then gradually slows down after 7 days. For example, under YRWIM conditions, the UCS of geopolymer grout after 1, 3, 7, and 28 days of curing is 15.1 ± 0.96 MPa, 20.4 ± 1.71 MPa, 30.4 ± 1.06 MPa, and 42.1 ± 2.16 MPa, respectively, representing increases of 35.10%, 49.02%, and 38.49%. Under WIM conditions, the UCS of geopolymer grout after 1, 3, 7, and 28 days of curing is 10.9 ± 0.89 MPa, 16.5 ± 1.14 MPa, 25.5 ± 1.31 MPa, and 34.9 ± 2.15 MPa, representing increases of 51.38%, 54.55%, and 36.8%. Under NDM conditions, the UCS of geopolymer grout after 1, 3, 7, and 28 days of curing is 10.1 ± 0.38 MPa, 14.7 ± 0.53 MPa, 20.2 ± 0.99 MPa, and 27.5 ± 0.59 MPa, representing increases of 32.43%, 37.42%, and 31.19%. This shows that as the curing age increases, the increase in UCS first rises and then decreases, reaching its maximum increase between 3 and 7 days. Moreover, in the first 1–3 days of curing, the increase in UCS under WIM conditions is the greatest, while in the later stages of curing, the increase in UCS under YRWIM conditions is the greatest.
This is mainly because the water environment during the early phases of curing accelerates the hydration process of the geopolymer grout material [25], bringing about a more marked increase in strength in the preliminary curing duration [37]. As hydration products form, the moisture transport channels on the surface of GGMs become filled, reducing the material’s porosity and increasing its strength. However, the hydration response speed decreases, with the rate of strength increase also slowing. Under NDM conditions, the hydrating reaction of the geopolymer relies on its moisture and moisture in the air, so the strength and the increased rate in material strength become lower than under the other two maintenance conditions. It is worth noting that during the early phases of curing (1–3 days), the speed of increase in strength under YRWIM conditions is lower than under WIM conditions. However, the strength of the geopolymer material under YRWIM conditions is always higher than under WIM conditions. The reason for this is twofold: first, the high sand content in the Yellow River water adheres to the surface of the geopolymer grout material. It slows down the moisture transport rate, resulting in a slower initial rate of hydration reaction. Second, the presence of large quantities of metal cations [38] such as Na+, Ca2+, Mg2+, and K+ in the Yellow River water creates hydrated products with higher strength, causing a higher strength of geopolymer grout materials under YRWIM conditions.

3.3. Microstructure Characterization of GGMs Under Different Maintenance Conditions and Ages

3.3.1. Analysis on SEM Morphology of GGMs

Figure 5 presents the SEM morphology images of raw GP-4 geopolymer components (fly ash [FA] and slag powder [SP]) and the uncured geopolymer material at 50,000× magnification. As shown in Figure 5a,b, fly ash (FA) exhibits spherical particles, while slag powder (SP) displays irregular polyhedral shapes, consistent with the findings of Su et al. [39]. The uncured geopolymer material (Figure 5c) reveals a loose particle arrangement with large interparticle voids, where SP particles are significantly larger than FA particles.
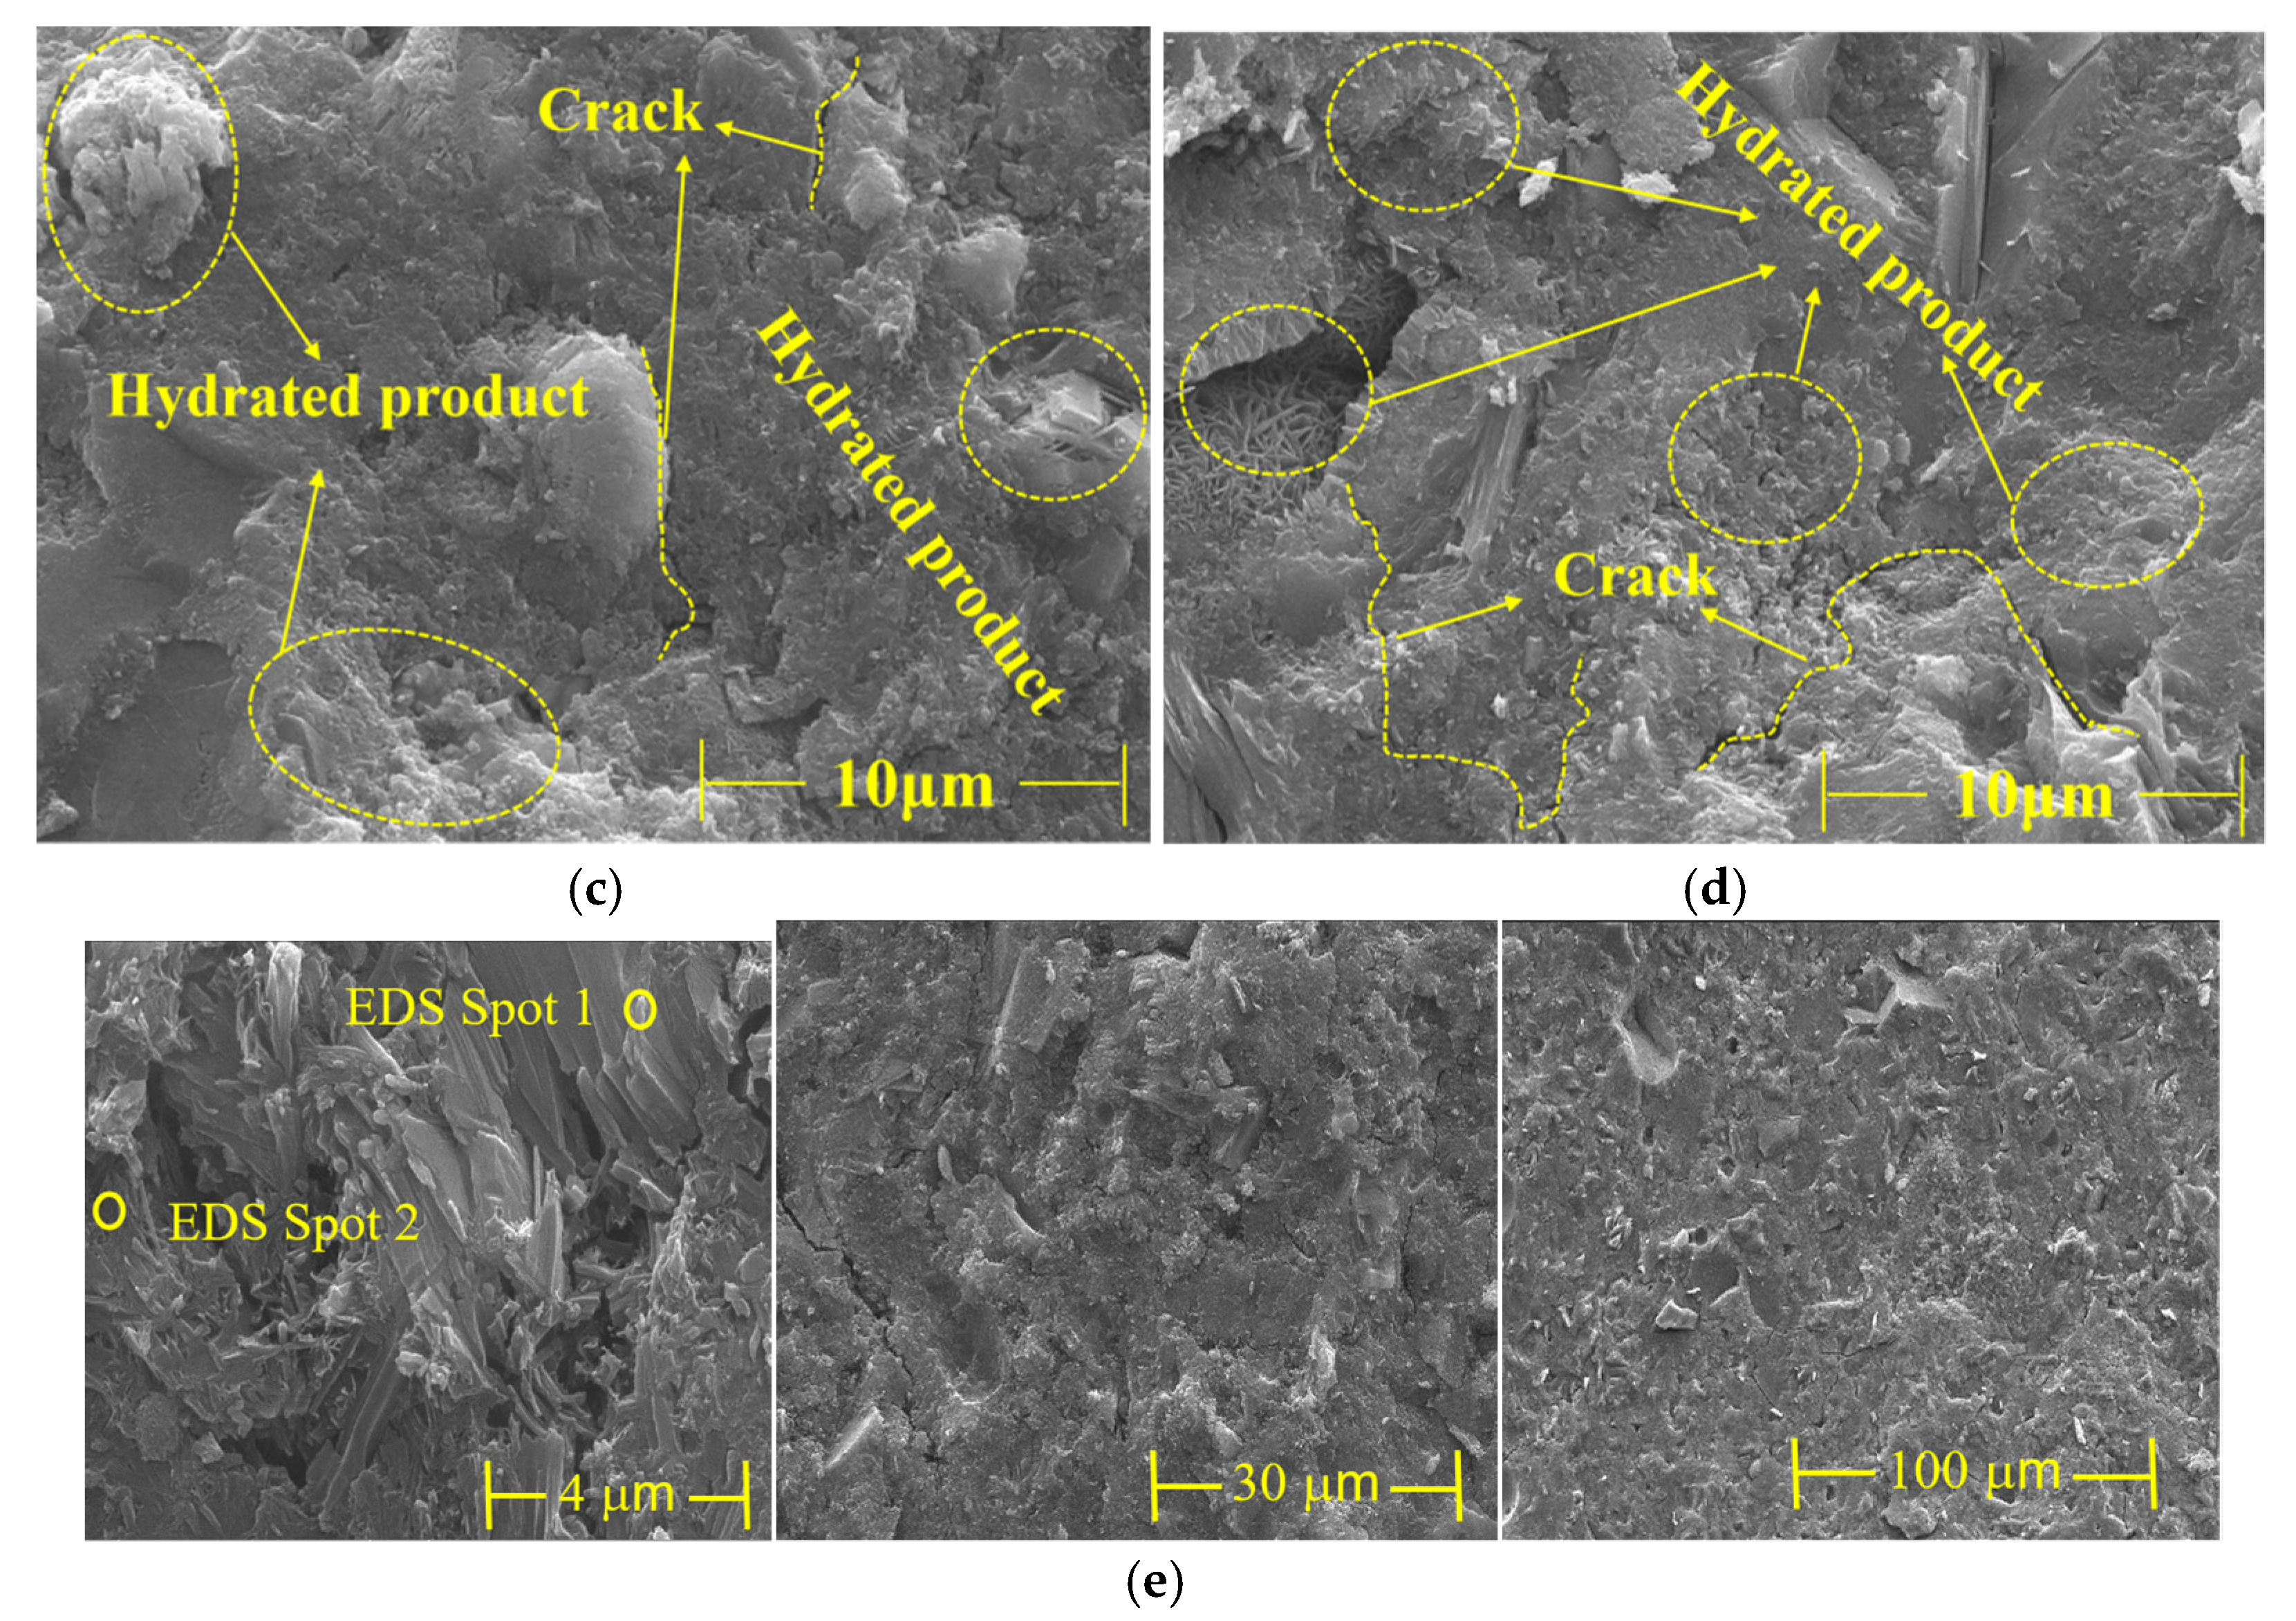
Figure 6 presents the SEM morphology images of geopolymer grouting material under YRWIM conditions at different curing ages to analyze the influence of maintenance conditions and age on the geopolymer solidification reaction mechanism. As shown in Figure 6a, for geopolymer grouting material cured for 1 day under YRWIM conditions, there is still unhydrated fly ash (FA) and slag powder (SP) inside the material. The arrangement of particles is relatively loose, with some voids present, most of which are full of the hydrated products, primarily in the form of fine filaments, flakes, and flocculent structures such as calcium silicate hydrate (C-S-H), sodium aluminum silicate hydrate (N-A-S-H), and calcium aluminum silicate hydrate (C-A-S-H) [40]. With the increase in the curing age, Figure 6b,c show that the voids between geopolymer material particles are progressively full of hydrated products, resulting in aggregation on the surface of the geopolymer material. An excess of hydration products leads to the formation of microcracks on the surface of the geopolymer material. Figure 6d,e illustrates that for geopolymer grouting material cured for 28 days under YRWIM conditions, many microcracks appear on the material’s surface, and the aggregation of hydration products forms a relatively dense three-dimensional network structure on the surface. This further contributes to a rise in the mechanical properties of GGMs. However, the presence of numerous microcracks causes the rate of mechanical properties enhancement to slow down.
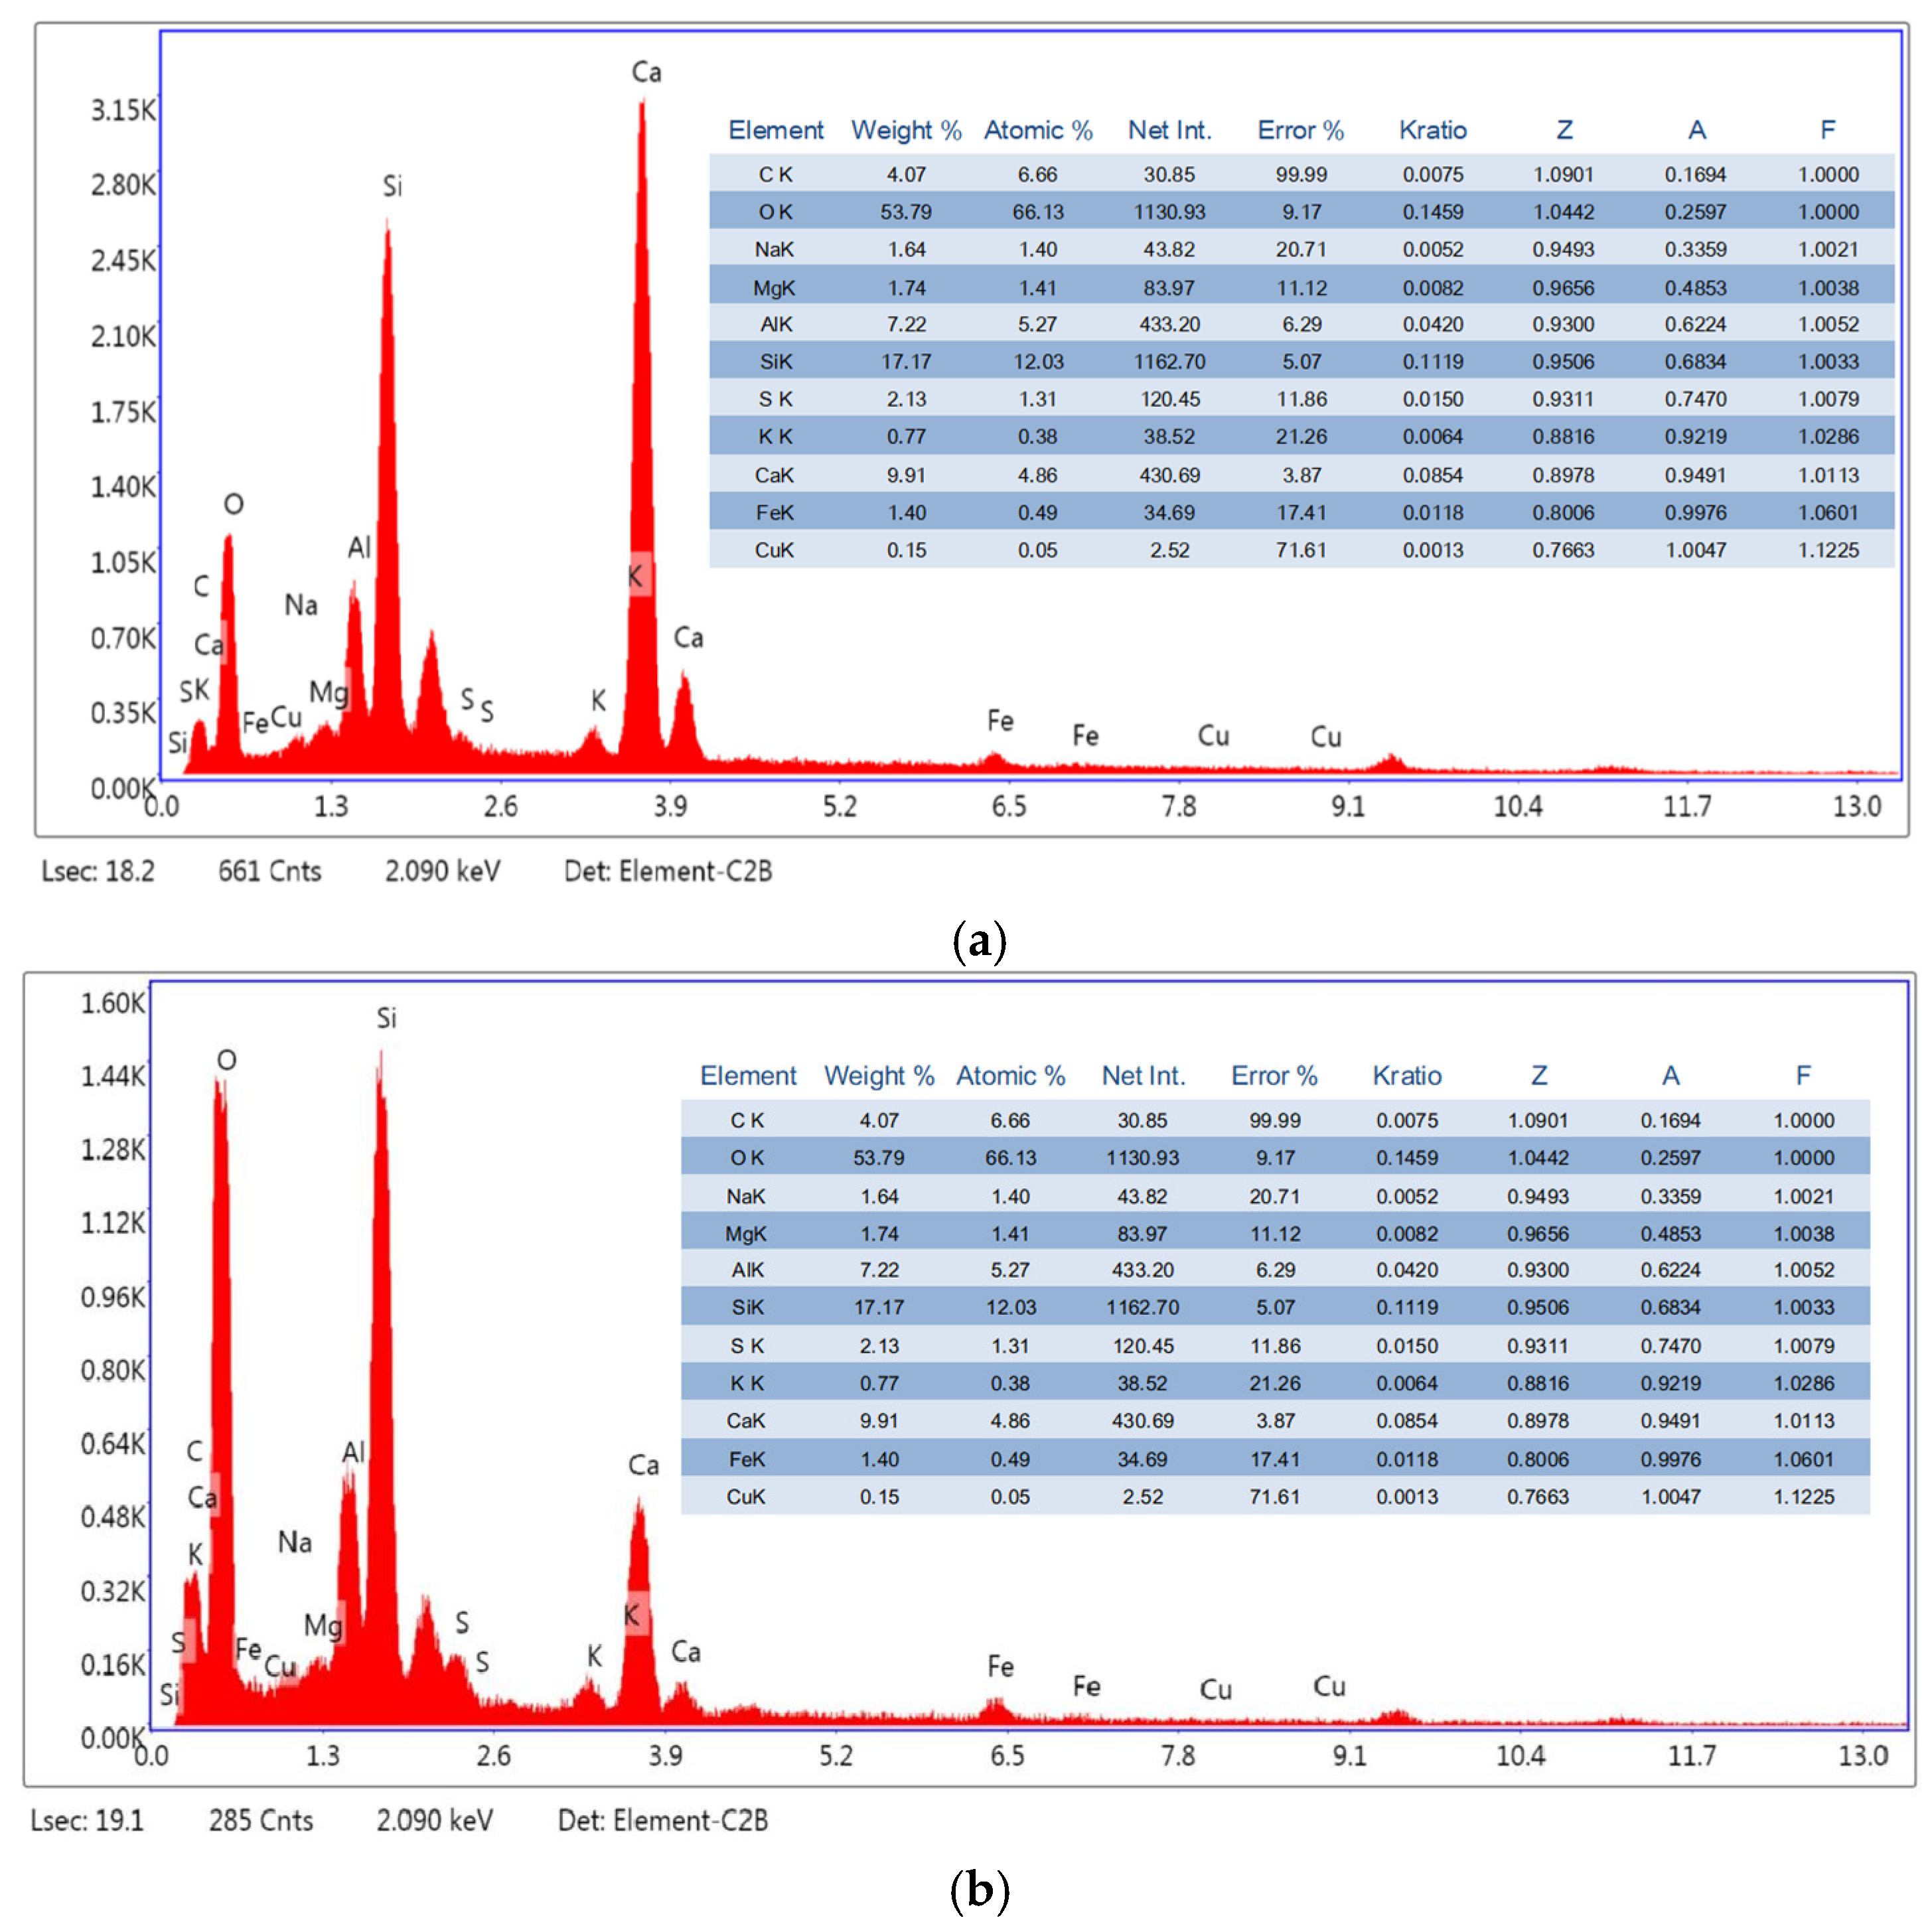
To further clarify the chemical element composition of GGMs, the EDS spectra corresponding to Figure 6e are given in Figure 7 for the GGMs specimens maintained in Yellow River water immersion for 28 days. It can be seen that the main elements of the GGMs prepared in this paper are Ca, O, Si, Al, and Na and a small number of elements such as S, Fe, Mg, and Cu, which further indicates that the hydration products of the GGMs in this study are dominated by substances containing the elements of Ca, O, Si, Al, and Na, and the range of Ca/Si from 0.6 to 1.6 can also be seen in Figure 7, further indicating the presence of C-S-H and C-A-S-H gels in the hydration products.
Figure 8 presents the SEM morphology of geopolymer grouting materials under WIM at different curing ages. Similar to the YRWIM conditions, under WIM conditions, the geopolymer grouting material still contains unhydrated fly ash (FA) and slag powder (SP) after 1 day of curing (Figure 8a). The particles are loosely arranged with limited voids, most of which are filled by hydration products dominated by flocculent calcium-silicate-hydrate (C-S-H) [37]. As shown in Figure 8b, after 3 days of WIM curing, a significant amount of flocculent hydration products forms, which accounts for the more pronounced increase in mechanical strength between 1 and 3 days under WIM conditions compared to YRWIM conditions. By the 7th day of WIM curing, the hydration products aggregate and a continuous network structure gradually develops, covering the geopolymer surface. However, the excessive hydration products compress the voids, leading to the formation of surface microcracks. After 28 days of WIM curing, the hydration products fully coat the geopolymer surface, forming an interconnected network architecture. Notably, the material surface exhibits a higher density of microcracks at this stage, likely due to internal stress accumulation during prolonged hydration.
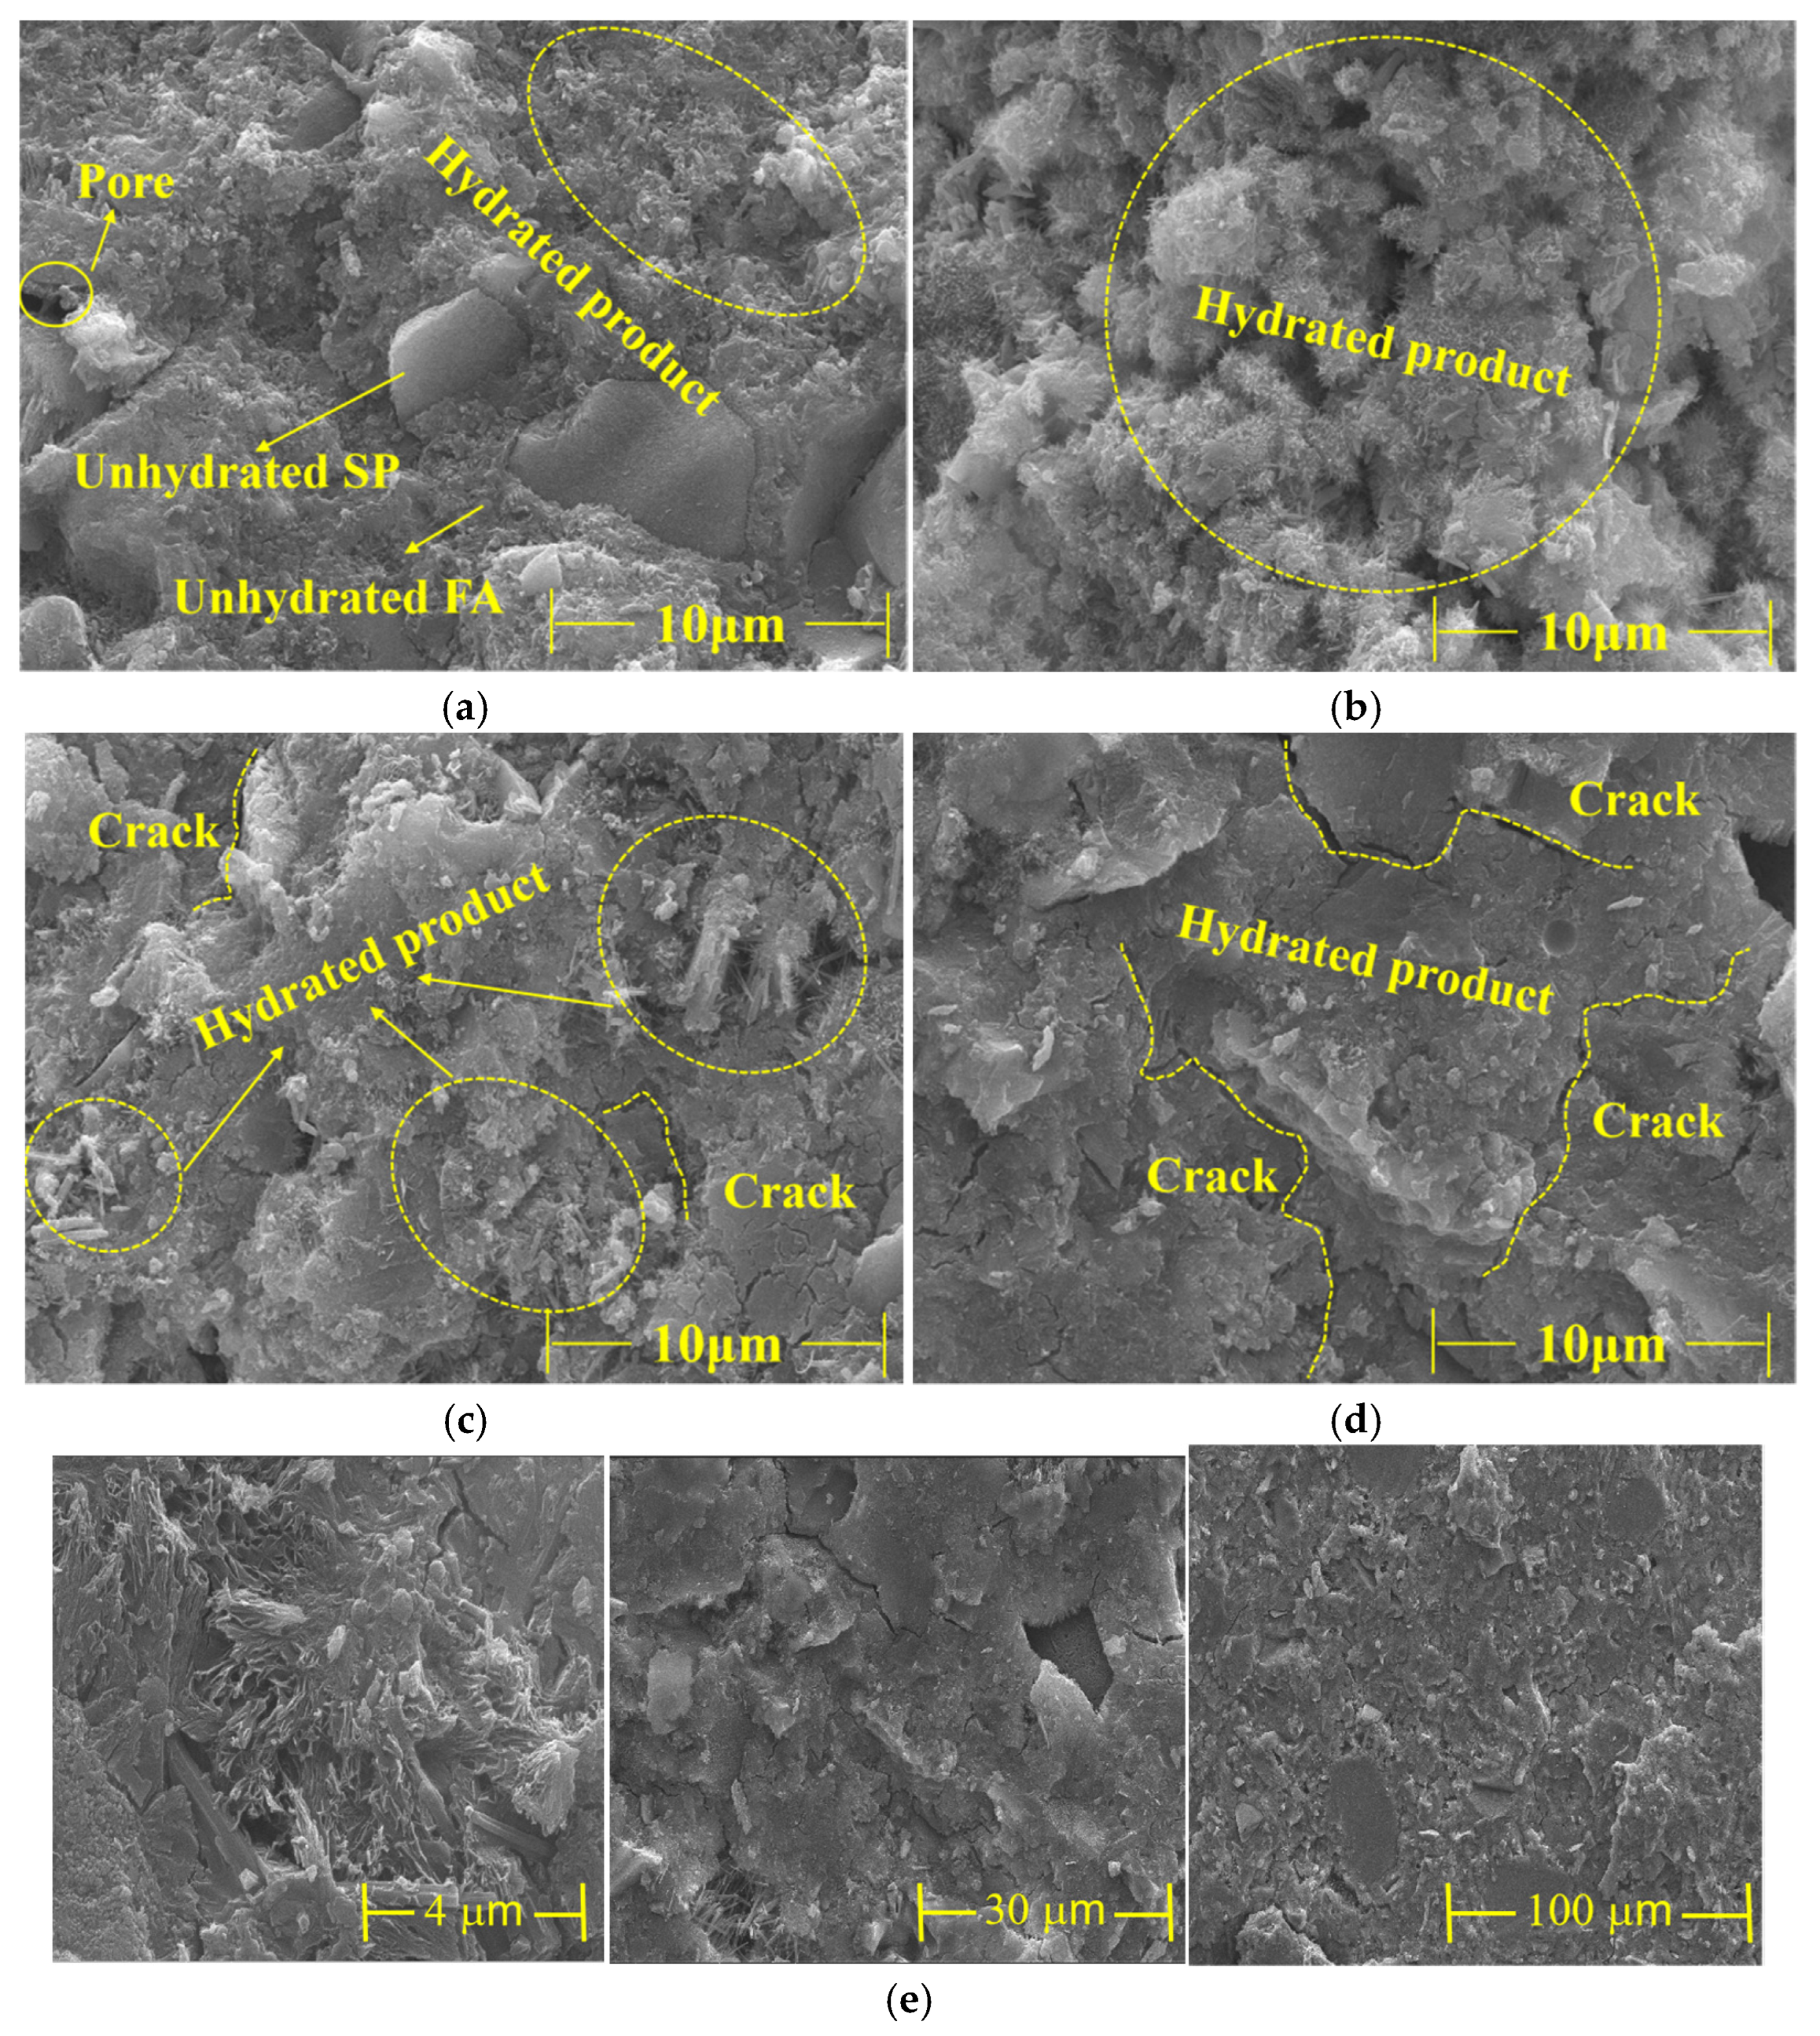
Figure 9 illustrates the SEM morphology of geopolymer grouting materials (GGMs) under NDM conditions at varying curing ages. Unlike the underwater environments, the hydration reaction of GGMs under NDM progresses significantly slower. As shown in Figure 9a–c, even after 1, 3, and 7 days of NDM curing, unhydrated fly ash (FA) and slag powder (SP) persist, while the hydration products retain a flocculent morphology with pervasive microcracks throughout the curing period. This phenomenon arises because the hydration process under NDM relies solely on the initial moisture content of the mixture and limited airborne humidity. The absence of external water replenishment leads to excessive moisture consumption during hydration product formation, thereby inducing drying shrinkage and subsequent microcrack generation in the geopolymer matrix. Consequently, both the mechanical strength and strength development rate of GGMs under NDM are markedly lower than those in water-saturated environments. These findings validate the feasibility of employing GP-4 geopolymer grouting materials for post-grouting applications in cast-in-place piles, where controlled hydration and reduced shrinkage are critical for structural integrity.

3.3.2. Analysis of XRD Patterns of GGMs

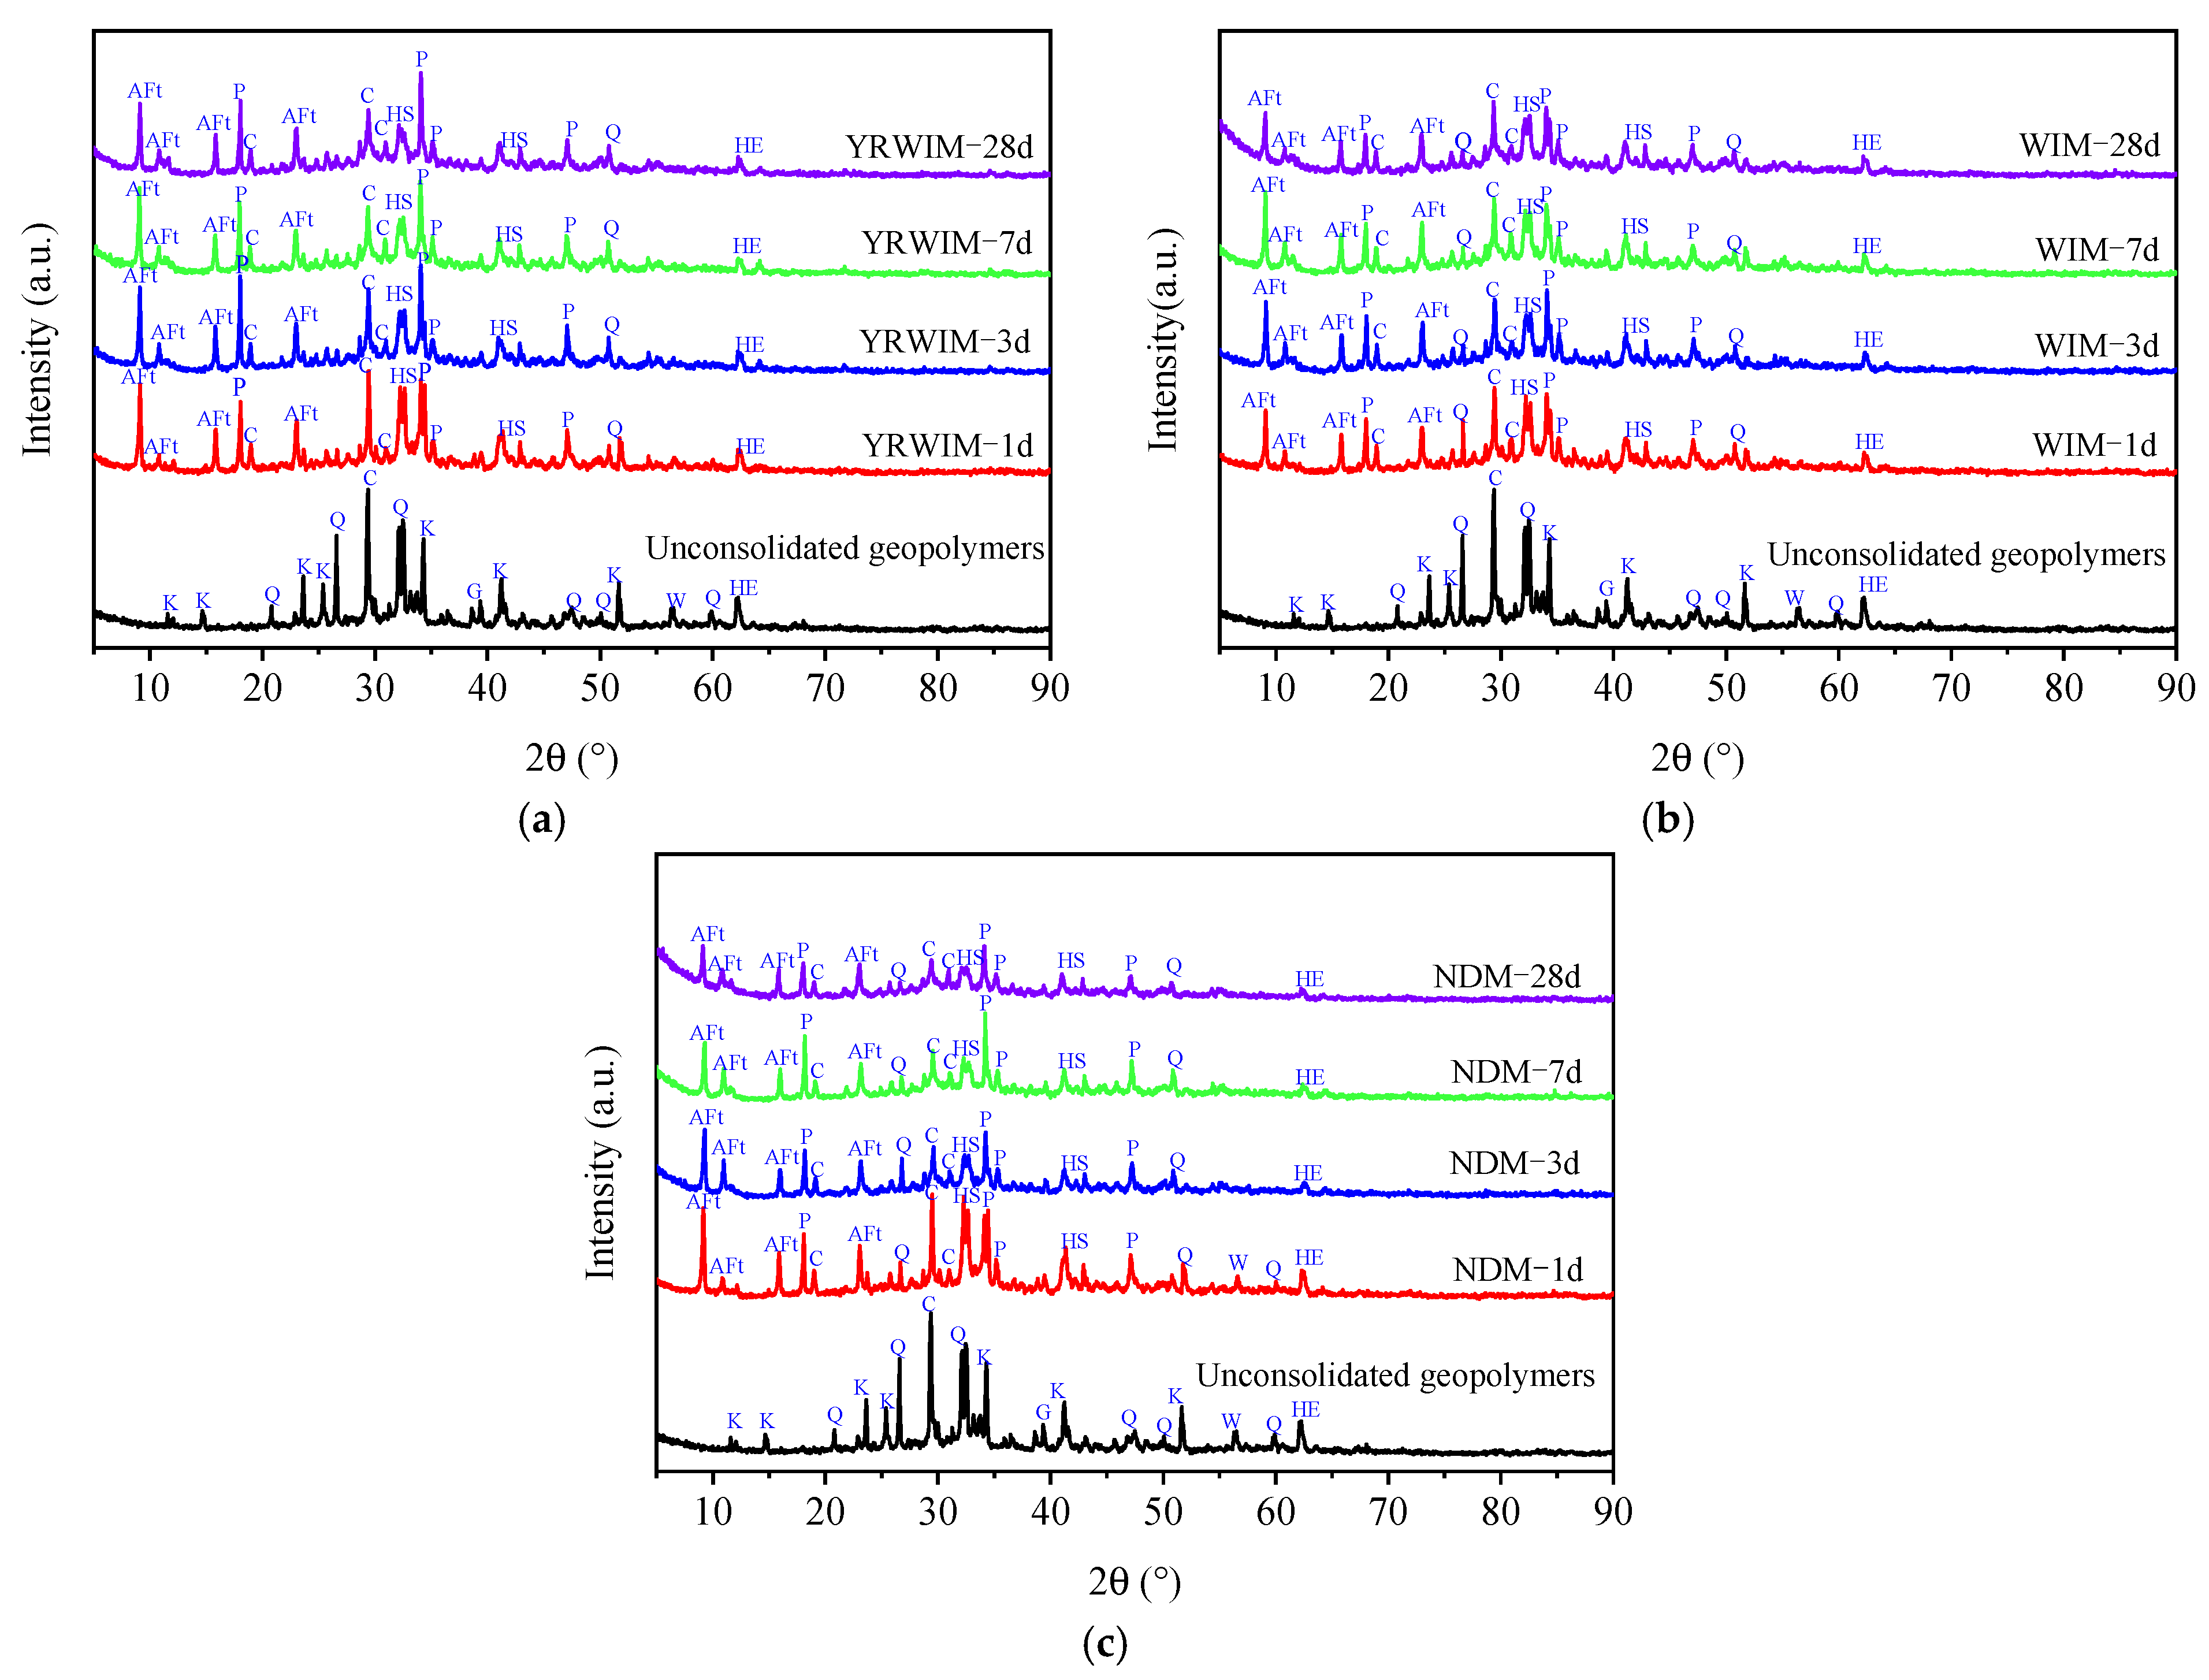
To analyze the hydration reaction process of GGMs under three maintenance conditions, Figure 10 presents the XRD patterns of GGMs at different ages under these conditions. Mineral abbreviations are defined as follows: K = kaolinite (Al2Si2O5(OH)4), Q = quartz (SiO2), C = calcite (CaCO3), G = gehlenite (Ca2Al2SiO7), HE = hematite (Fe2O3), W = wollastonite (CaSiO3), AFt = ettringite (Ca6Al2(SO4)3(OH)12·26H2O), P = portlandite (Ca(OH)2), HS = hydrated silicate phases (C-A-S-H/C-S-H gels). Combined with Table 1, it can be seen that the uncured GGM consists mainly of K, Q, C, and small amounts of G, W, and HE. Under alkali-activation conditions, hydration reactions occur in GGMs, producing AFt, P, C, and HS as the main hydration products. The diffraction peak of HS at 2θ = 32.1° exhibits a broad hump characteristic of amorphous phases, which is a key feature of C-A-S-H and C-S-H gels [16,39,41]. The dominant peak of AFt at 2θ = 9.1° appears as a sharp peak. Combined with Figure 7, the presence of sulfates in GGMs suggests that AFt is formed by the combination of C-A-S-H/C-S-H gels with sulfate ions (SO42−). Furthermore, the high calcium content of SP generates significant amounts of C and P during alkali activation. Their diffraction peaks are observed at 2θ = 29.4° (calcite) and 2θ = 18.1°, 34.1° (portlandite). These high-calcium products facilitate the formation of HS and AFt, which is one of the key factors enhancing the mechanical properties of GGMs. However, by comparing Figure 10a–c, it is evident that while the hydration products of GGMs remain consistent across maintenance conditions, the peak intensities of these products differ. The intensities rank as follows: YRWIM > WIM > NDM, which further explains the observed mechanical performance trend: YRWIM > WIM > NDM.

3.3.3. Analysis of FTIR Pattern of GGMs

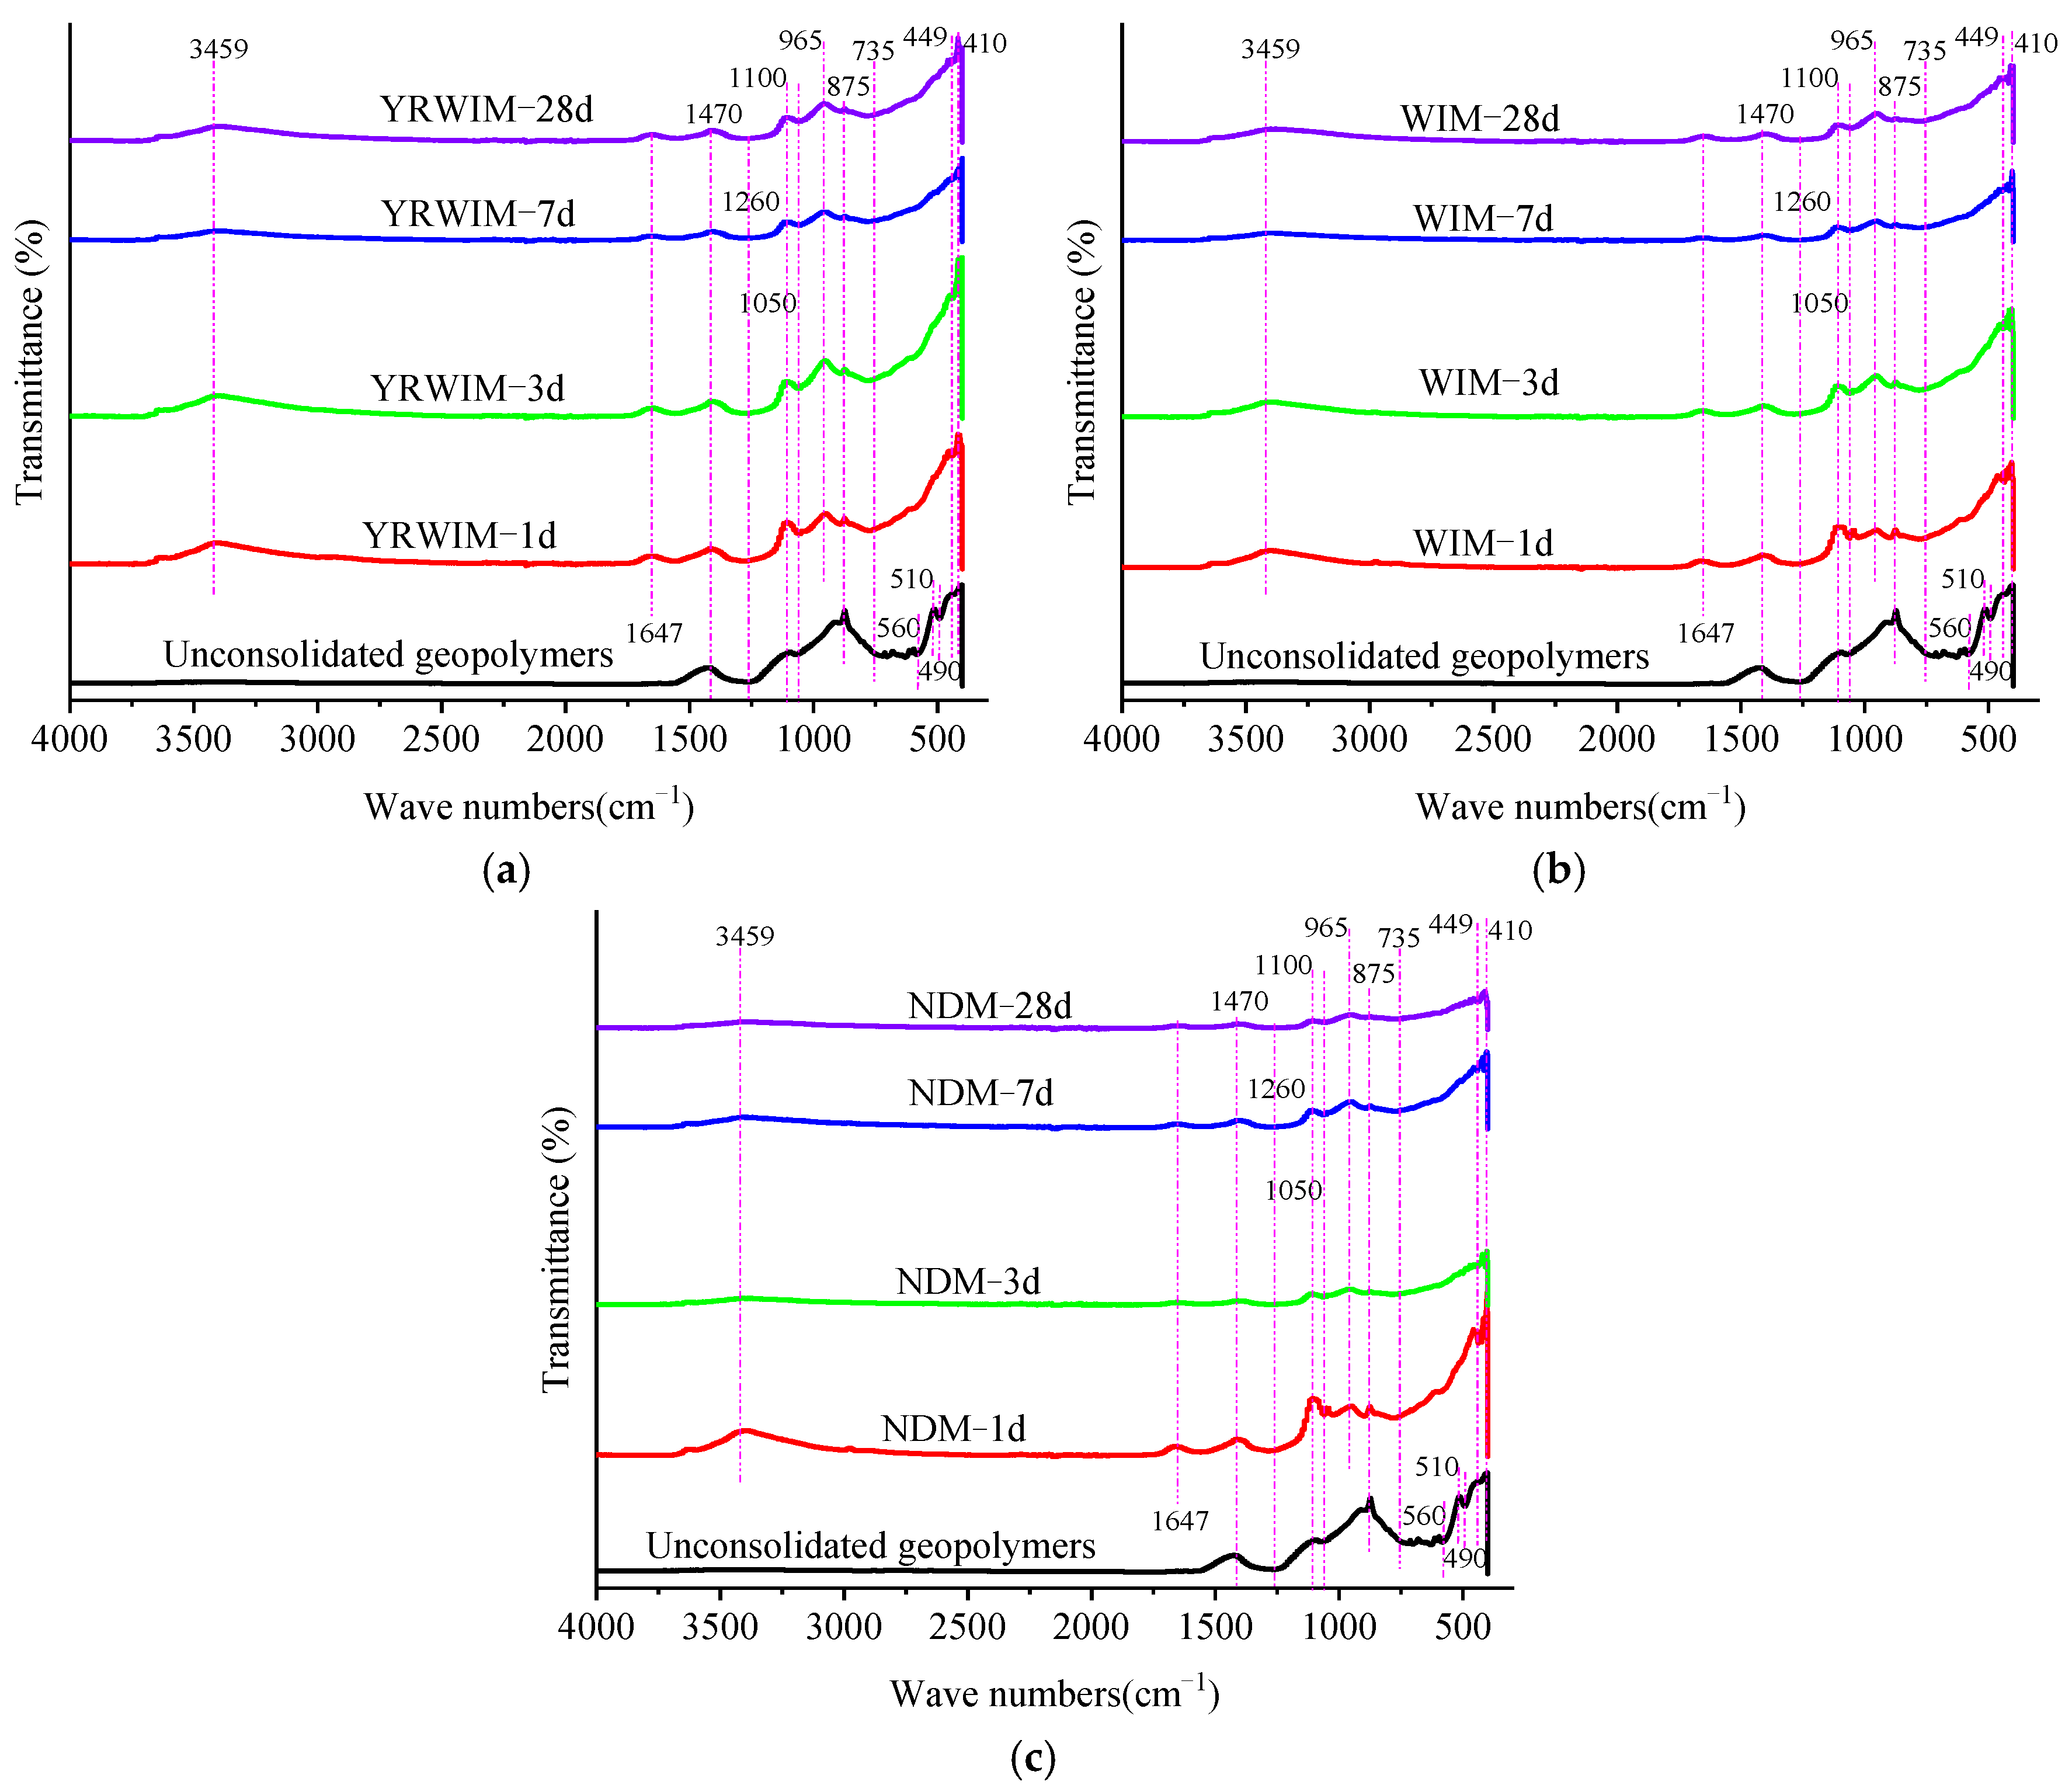
To examine the variations in functional groups of hydrated products in GGMs under different maintenance conditions and ages, Figure 11 shows the FTIR stacked spectra of GGMs under different maintenance conditions and ages, showing the analysis scope of 400 to 4000 cm−1. The stronger the absorption peak, the higher the content of the functional group. Figure 11 shows that the absorption bands of unconsolidated geopolymer powder mainly appear in the range of 400 to 1500 cm−1. According to previous studies [41], 1470 cm−1 aligns with the O-C-O stretching vibration of CO32−, wherein the CO32− group mainly comes from the CaCO3 in the original materials FA and SP. Peaks at 1050, 1100, and 875 cm−1 align with the Si-O bond, while peaks at 735 cm−1 and 449 cm−1 align with the Si-O-Si bond, primarily derived from SiO2 in FA. The peak at 560 cm−1 is mainly caused by the Al-O-Al bond, originating from the metakaolin in the original materials. This further confirms the results in the XRD spectra, indicating that unconsolidated geopolymer powder mainly contains CaCO3, SiO2, and metakaolin.
Compared to unconsolidated geopolymer powder, GGMs undergo hydration reactions during the curing period. The peak at 3459 cm−1 is primarily due to OH-, suggesting the main reason for the presence of Ca(OH)2 in hydrated products. The peak at 1647 cm−1 is caused by the combined water in C-S-H and -OH in other water molecules, a typical alkaline hydration product. The O-C-O stretching vibration peak (1470 cm−1) is still present in the initial curing period, but the peak intensity gradually weakens with increasing curing age. The vibration peak at 965 cm−1 is a band from the symmetric tensile vibration of the tetrahedral Si-O-T bond (T being Si or Al) in polymerization reaction products, reflecting the characteristic formation of SiO4 and AlO4 tetrahedral substances [42]. The peak at 875 cm−1 represents the tensile vibration band of Si-O in non-polymeric silicates. By comparing Figure 11, it can also be observed that no new functional groups appear under different maintenance conditions, and the strength of absorption peaks gradually decreases as the curing age rises. The intensity of absorption peaks follows the order of YRWIM > WIM > NDM. The newly formed functional groups under the three maintenance conditions mainly show absorption peaks at 3459, 1647, 965, and 875 cm−1, corresponding to OH- in hydration products, the -OH bond in water molecules, the tetrahedral Si-O-T bond in polymerization reaction products, and the Si-O bond in non-polymeric silicates, respectively. Combined with the XRD spectra, the hydration products of GP-4 GGMs are chiefly C-A-S-H, C-S-H, and N-A-S-H gels.

3.3.4. Hydration Mechanism of GP-4 Geopolymer

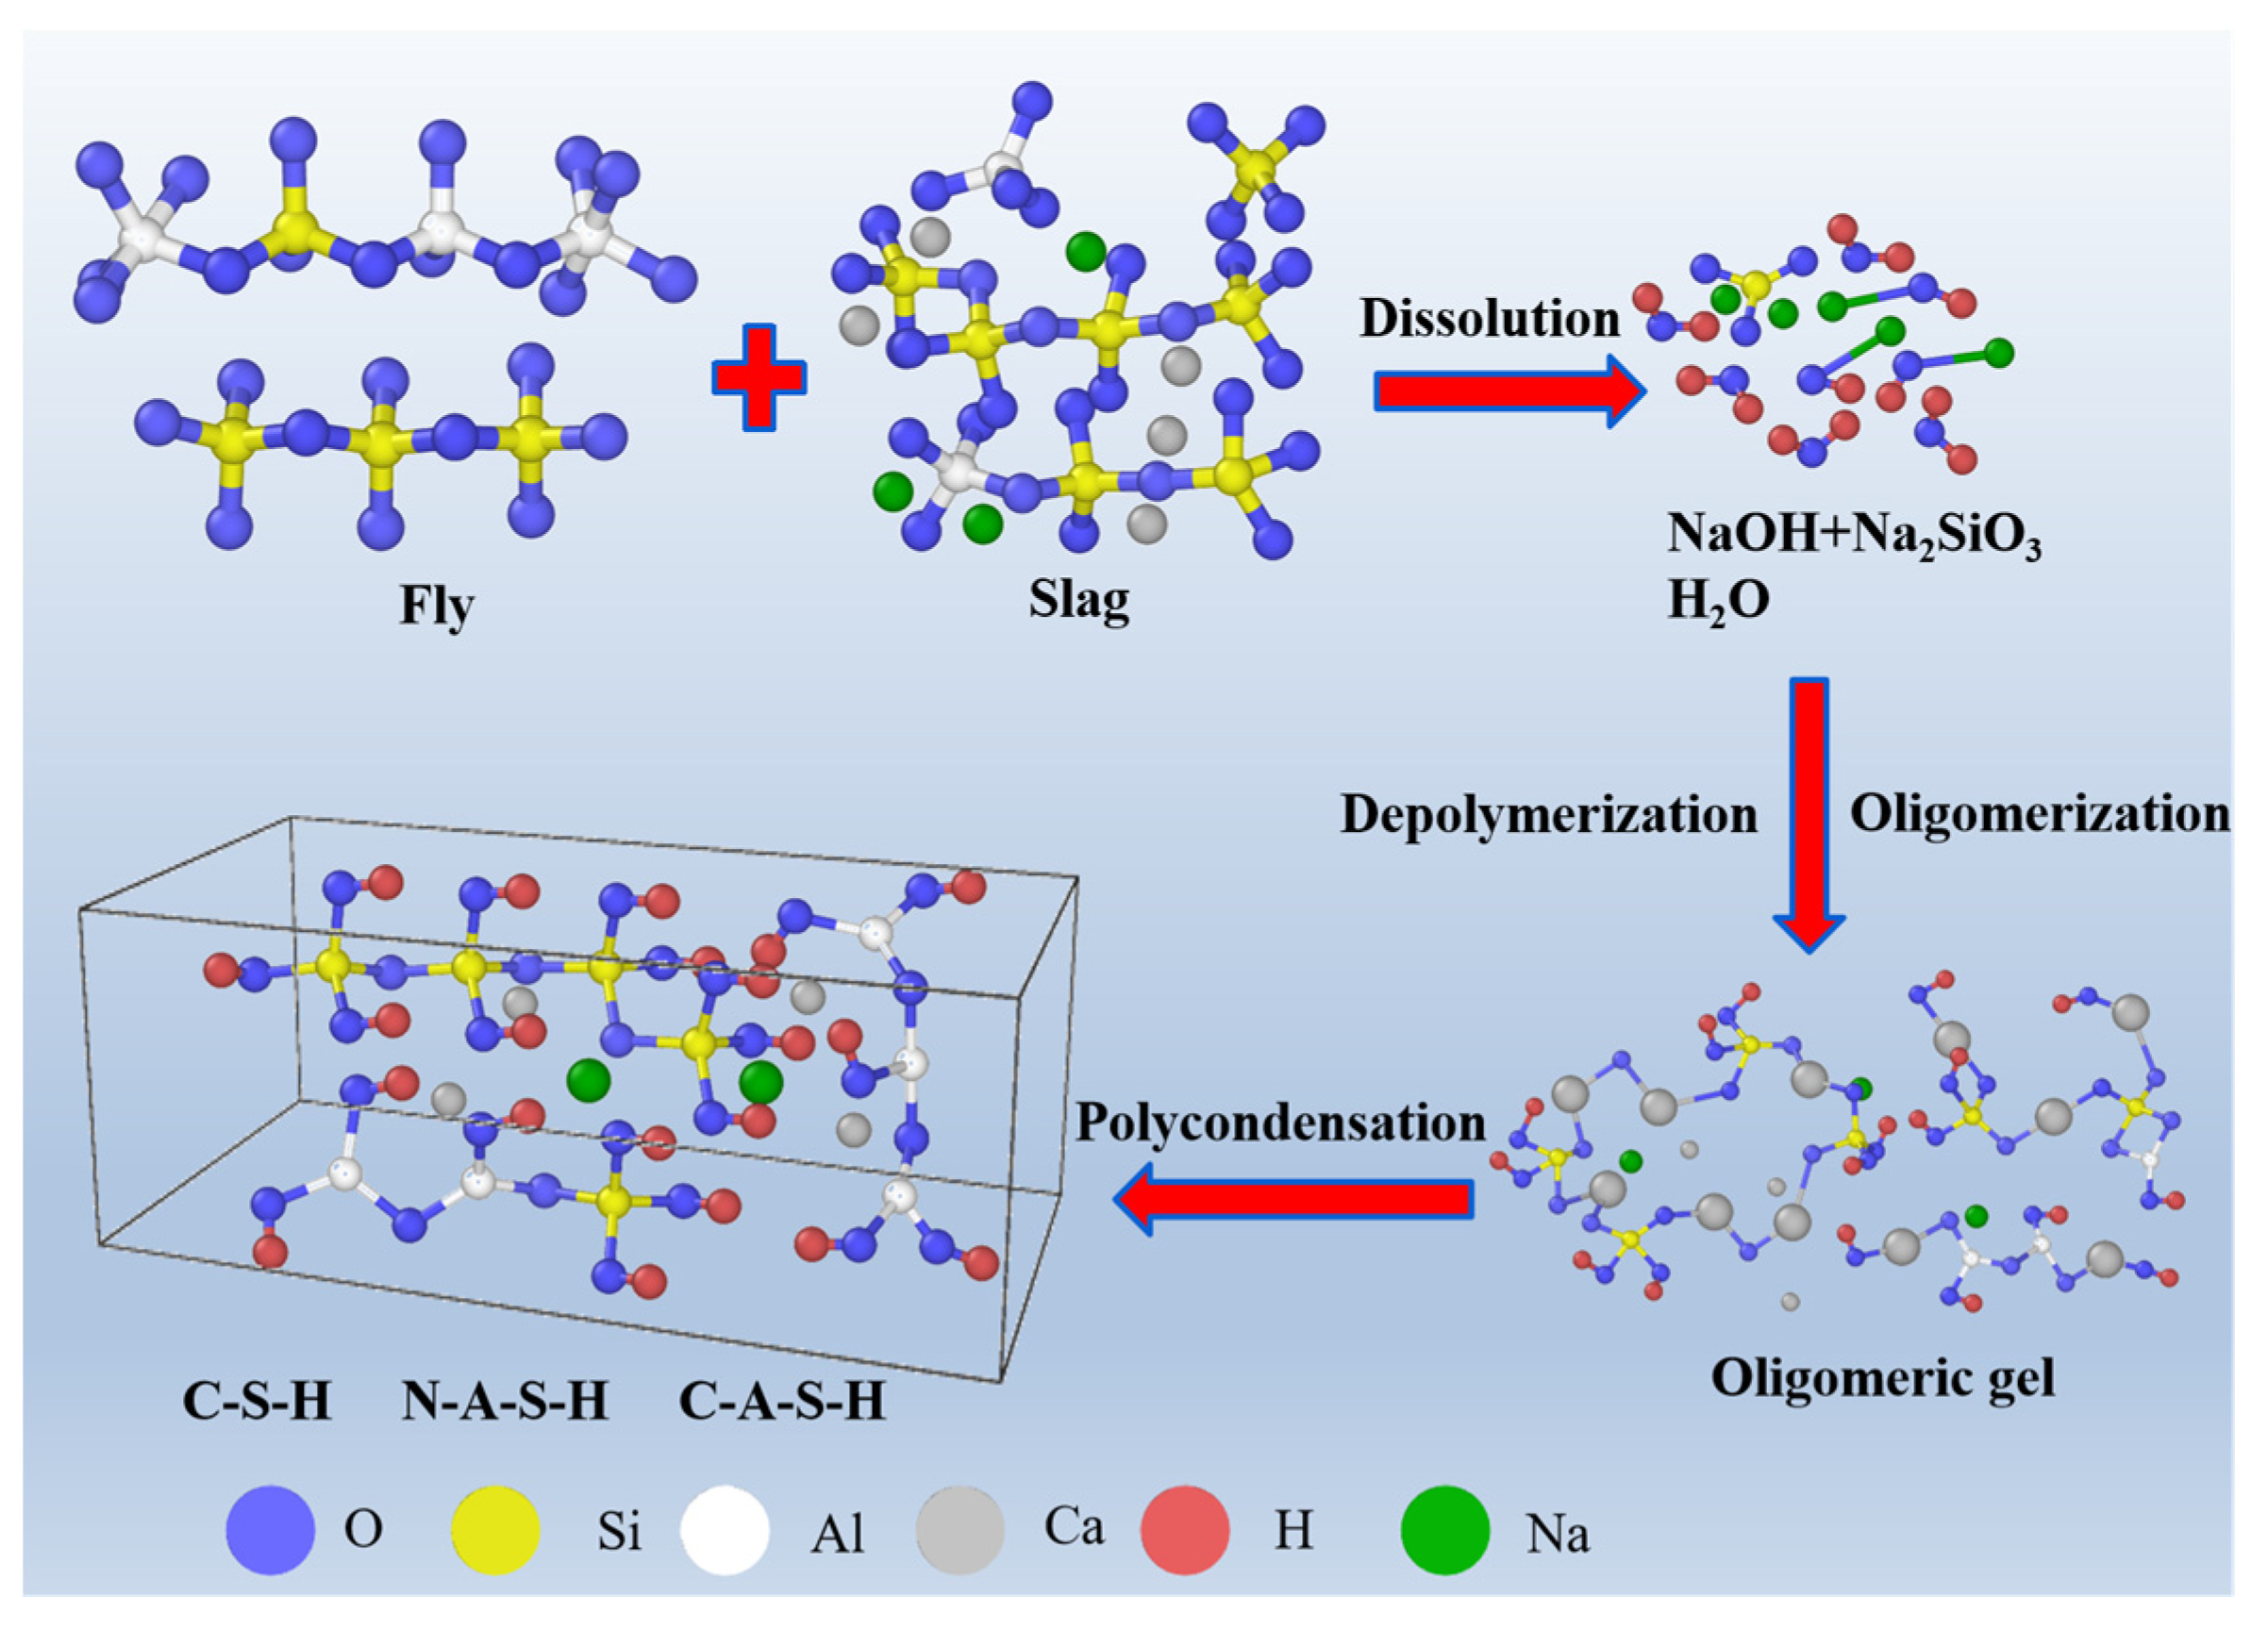
Based on SEM, XRD, and FTIR analyses, Figure 12 illustrates the hydration mechanism of GP-4 geopolymer grouting material. Consistent with Guo et al. [37], during the initial hydration stage, the FA and SP dissolve in the alkaline environment of Na2SiO3 and NaOH. The Ca-O bonds in the calcium phase, the Si-O-Si bonds in the Si-Al phase, and the Al-O-Al bonds start breaking, releasing Ca2+, silicon tetrahedron, and aluminum tetrahedron monomers. Due to the different stability of the Ca-O, Si-O-Si, and Al-O-Al bonds, the order of dissolution of Ca2+, silicon tetrahedron monomers, and aluminum tetrahedron monomers may vary. Since the Ca-O bond has the lowest bond energy, it breaks first, followed by the aluminum tetrahedron monomers and the silicon tetrahedron monomers. In the liquid phase, some Ca2+ reacts with the silicon tetrahedron monomers in the environment to formulate the C-S-H gel. Therefore, during the original hydration phase, the main hydration product is flocculent C-S-H gel, consistent with the SEM micrographs in Figure 8b. As hydration continues, the concentration of silicon and aluminum tetrahedron monomers during the liquid phase increases rapidly in the presence of alkali activators. Na+ and OH in the alkali activators form a large number of -Si-O-Na, Al(OH)4−, Al(OH)52−, and Al(OH)63− silicoaluminate oligomers with silicon and aluminum tetrahedron monomers. The presence of cations in the Yellow River water promotes the formation of more hydration products, inducing higher FS and UCS of the geopolymer grouting material under YRWIM conditions.
In the mid-hydration stage, the low stability of the generated oligomer structures allows silicon and aluminum tetrahedron monomers to undergo polymerization reactions, forming networked N-A-S-H and C-A-S-H gels. However, the degree of the network structure polymerization is relatively low, which is reflected in Figure 6, Figure 8 and Figure 9, where the hydration products appear loose. As the reaction continues, more silicon and aluminum tetrahedron monomers are dissolved, increasing the degree of polymerization and forming a 3D network architecture of interwoven N-A-S-H and C-A-S-H gels. Due to the high content of Ca2+ and Al3+ in the system, Ca2+ replaces some Na+ in the N-A-S-H gel, while Al3+ replaces several Si4+ in the C-S-H gel, forming an interwoven three-dimensional (N, C)-(A)-S-H gel structure.
During the late hydration stage, C-S-H, C-A-S-H, and N-A-S-H gels in the system gradually dehydrate and solidify into geopolymer blocks, filling the voids in the geopolymer and effectively improving the pore structure, making the overall geopolymer denser. This enhances FS and UCS, but microcracks form due to excessive hydration product accumulation, slowing mechanical property improvements.

4. Field Application Experiment

4.1. Field Experiment Design

To further investigate the feasibility of using GGMs for post-grouting of bored piles, as well as to clarify the diffusion mechanism of GGMs in the soil, four groups of field pile–soil interface shear tests were designed, as shown in Table 4. The test field is located in the third section of Zhengzhou Anluo Yellow River Bridge post-pile foundation grouting engineering; the soil at the engineering site is silt soil, and the physical property parameters of the soil are shown in Table 5 [35].

4.2. Experimental Process

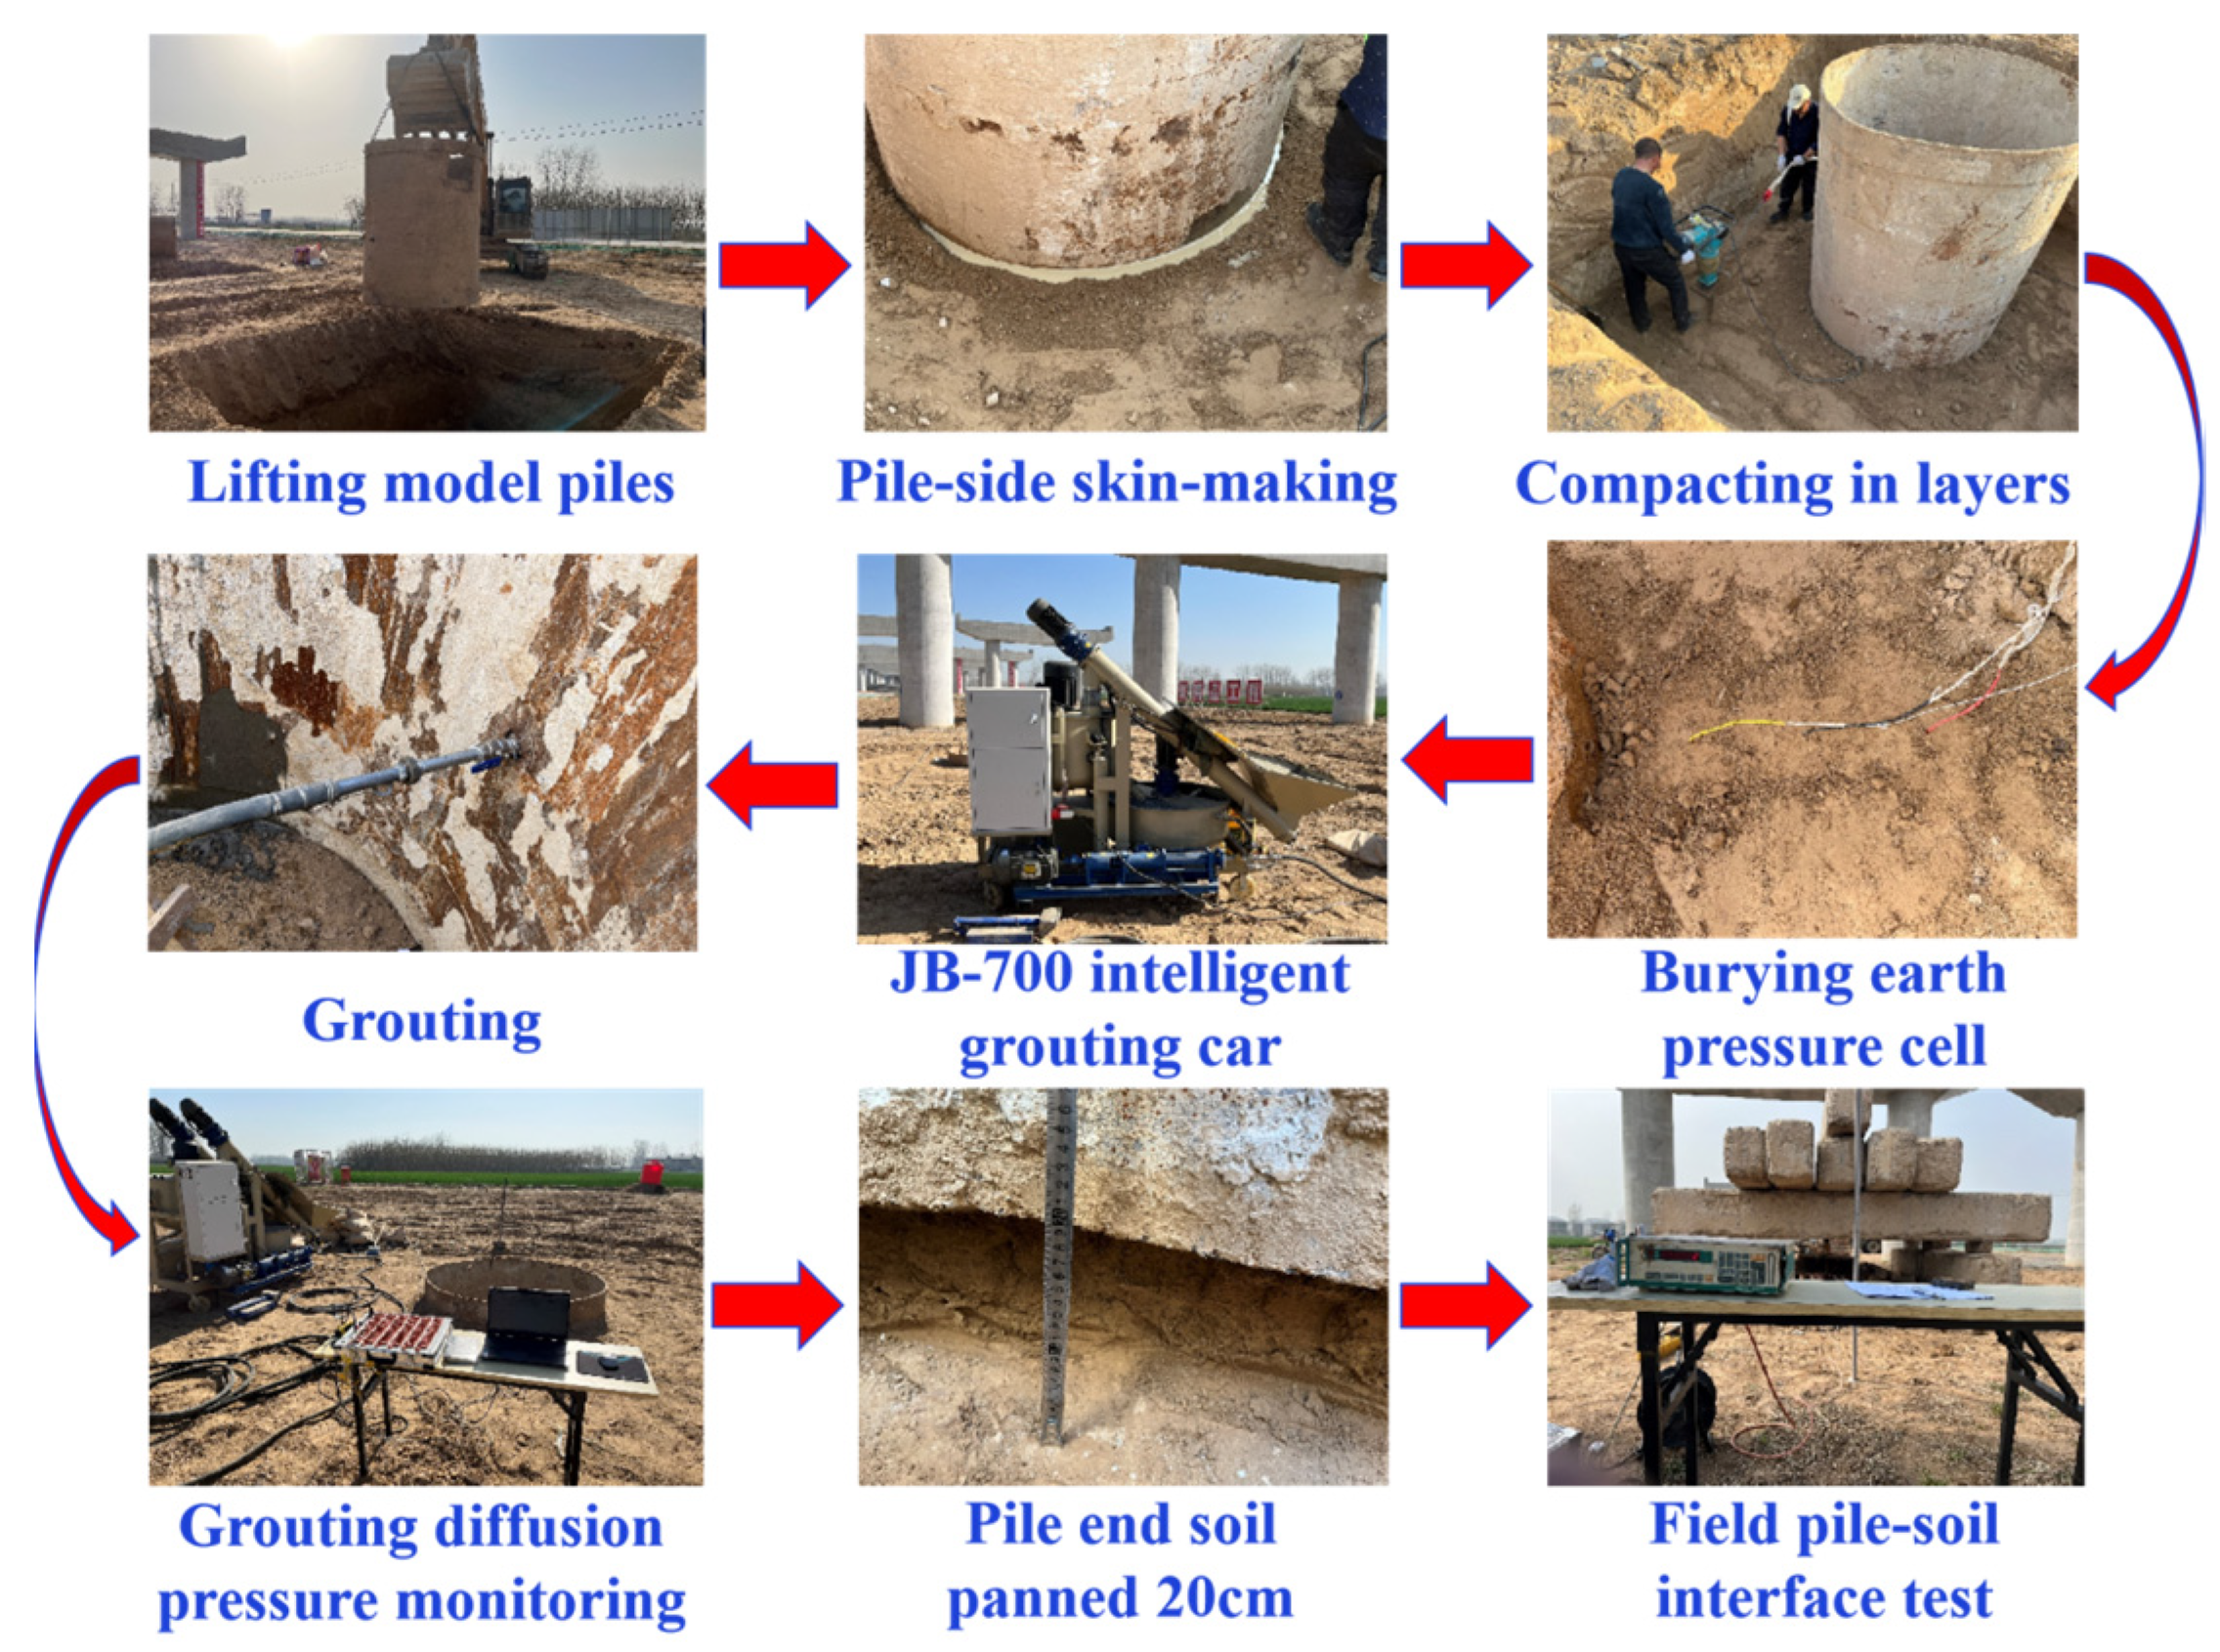
Figure 13 illustrates the field testing procedure for pile–soil interface shear performance. The experimental setup involves three key phases:
(1)
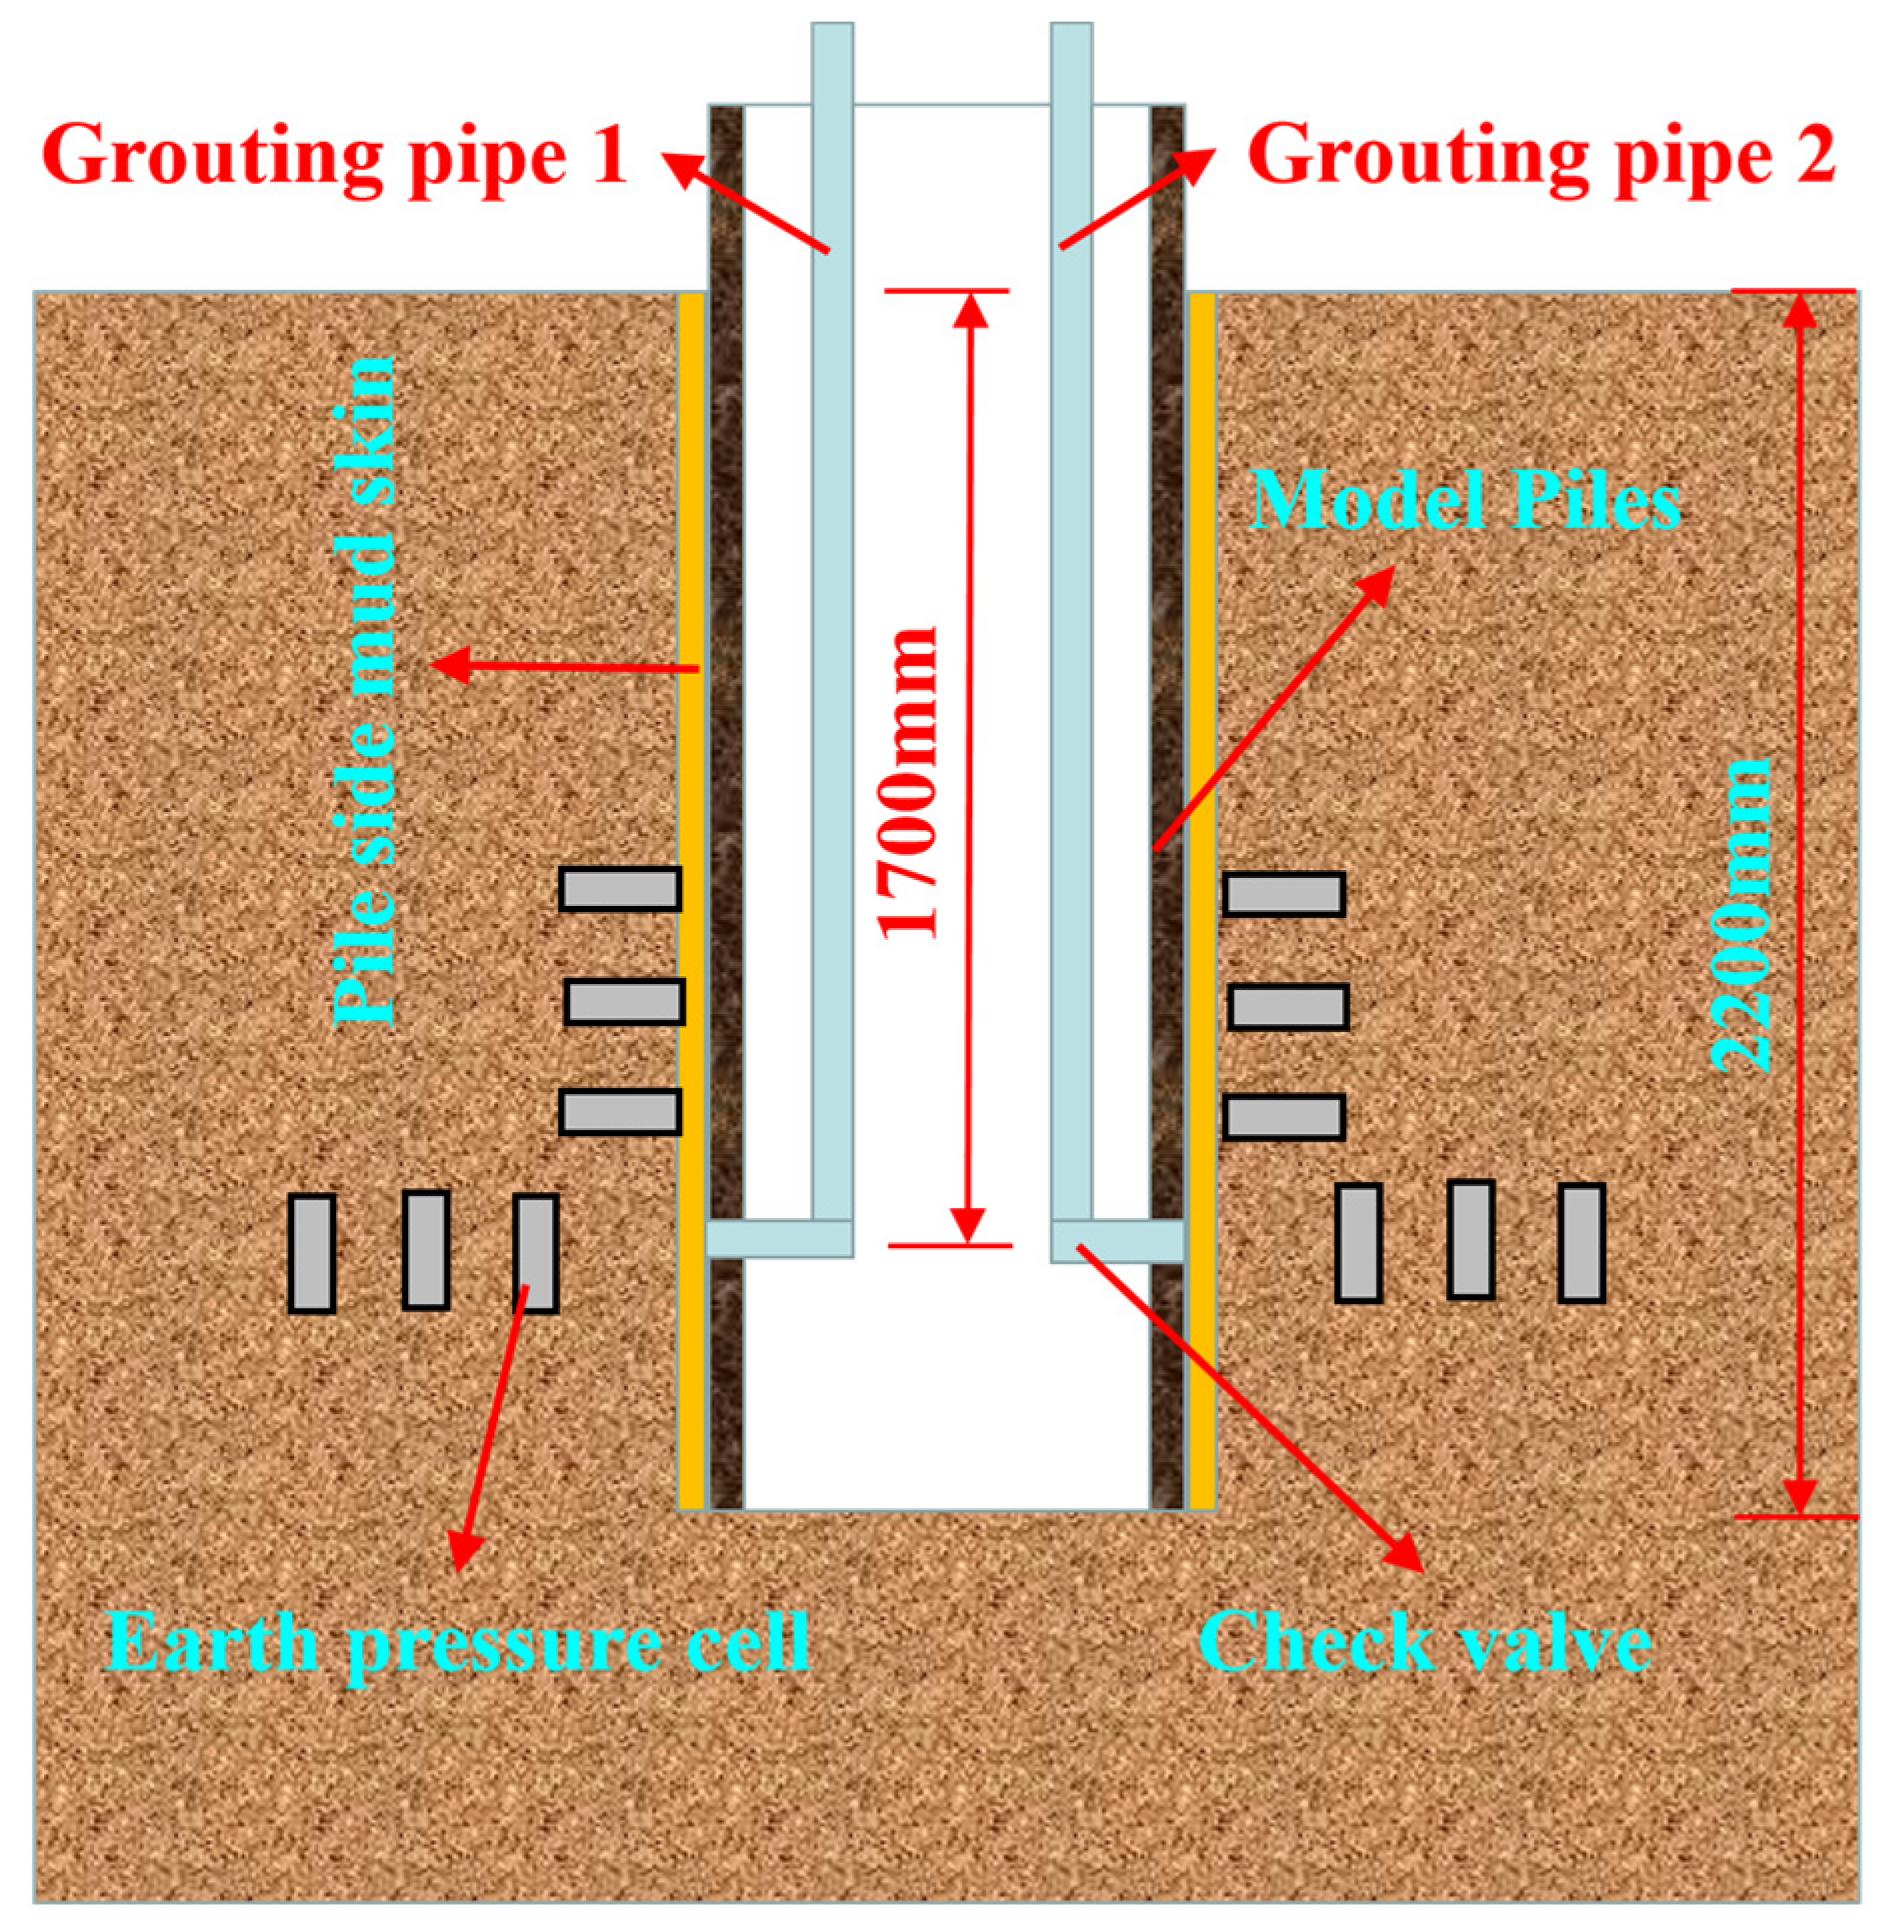
The installation of model piles and sensors is conducted. This study uses the steel casing used in on-site construction as a model pile, as reflected in Figure 14. Such a pile is 2500 mm long, showing an internal diameter of 1800 mm and a wall thickness of 20 mm. The depth of the model pile’s burial is 2200 mm. Two grout outlets are symmetrically arranged on the pile side, with one grout outlet as a spare. The outlet diameter is 25 mm, and the outlet’s center is 1700 mm from the ground. A soil pressure box is placed every 300 mm in the horizontal and vertical directions to monitor the grouting diffusion pressure during the grouting process.
(2)
Field post-grouting is conducted. As shown in Figure 13, the on-site grouting uses a JB-700 intelligent grouting machine used in construction sites, with the grouting pressure set to 0.1 to 0.2 MPa.
(3)
Interface shear test. As shown in Figure 13, three days after the grouting is completed, the soil at the pile end is excavated to a depth of 20 cm to eliminate pile end resistance. Then, a hydraulic jack and displacement gauge are set up at the pile top. According to JGJ 106-2014 [43] requirements, graded loading is applied while recording the load and displacement at the pile top.

4.3. Analysis and Discussion of Experimental Results

4.3.1. Analysis of the Shear Properties of Geopolymer Post-Grouting Mud-Skinned Pile–Soil Interface

Figure 15 presents the pile top shear load–displacement curves for different model piles. Similar to the results of Zhou and Xu et al. [2] in single-pile model tests, the shear load–displacement curves at the pile top exhibit a “plateau” region. If the grouting volume is larger, the interface shear performance will be greater. For the cases of no grouting, post-grouting with 100 kg of geopolymer, 150 kg geopolymer, and 200 kg geopolymer, the corresponding maximum shear loads are 200.0 kN, 234.0 kN, 252.0 kN, and 265.5 kN, respectively, with respective shear displacements at the pile top of 30.52 mm, 27.50 mm, 24.22 mm, and 20.23 mm. Compared to the ungrouted pile, the maximum shear loads for post-grouting with 100 kg, 150 kg, and 200 kg of geopolymer increased by 17.0%, 26%, and 32.5%, respectively. In contrast, the shear displacements decreased by 9.89%, 20.64%, and 33.72%, separately. This suggests that increasing the grouting volume is capable of improving the interface’s shear performance and the pile foundation’s bearing capacity, but the improvement is limited; therefore, it is essential to design the grouting volume reasonably in practical engineering projects. Additionally, to describe the interaction at the soil–geopolymer post–grouted pile interface, a hyperbolic function relationship, as shown in Equation (4), was fitted using MATLAB—2024 software.
τ = s a + b s
Here, τ represents the shear stress, s represents the shear displacement, and a and b are the corresponding shear load displacement parameters.
Table 6 provides the fitting parameters in discrepant calculation conditions. Evidently, the shear load–displacement parameters a and b are correlated with the grouting volume, decreasing as the grouting volume increases. The goodness of fit (R2) for the hyperbolic function model to the shear test results of the geopolymer post-grouted pile–soil interface, which includes a clay layer, exceeds 0.99 in all cases. This further demonstrates the applicability of the hyperbolic function model in describing the shear behavior of the geopolymer post-grouted pile–soil interface with a clay layer.

4.3.2. Analysis of Diffusion Pressure of Pile-Side Geopolymer Grouting

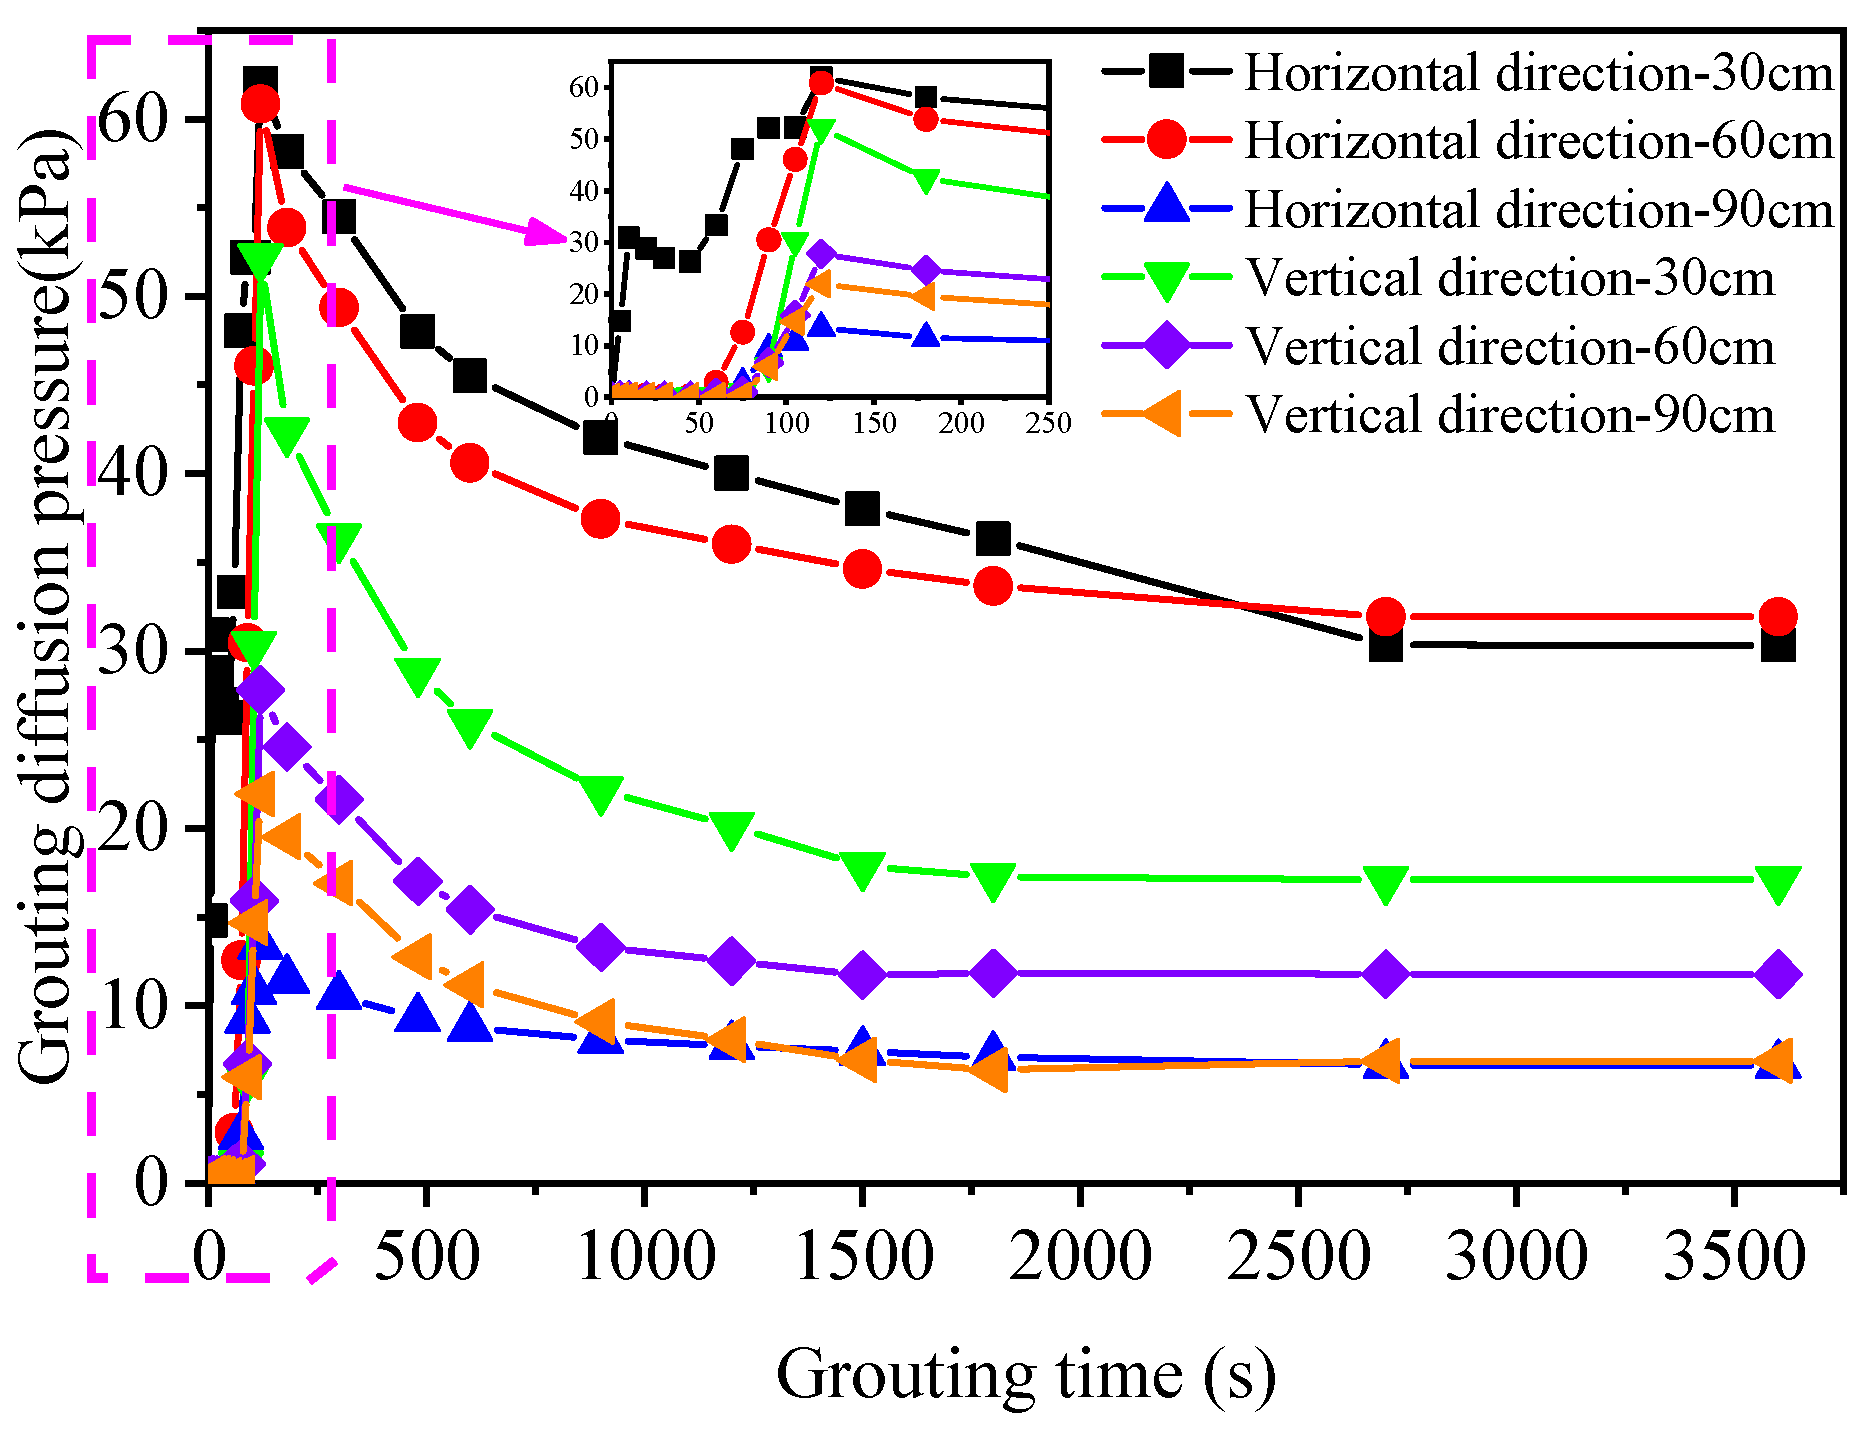
To further investigate the diffusion mechanism of GGMs during the post-grouting of large-diameter piles, the pressure–time relationship of grout diffusion is presented in Figure 16, using a grouting volume of 150 kg. The graph illustrates that the grouting diffusion pressure at six monitoring points initially increases and then decreases over time, reaching its peak at 120 s, coinciding with the completion of the grouting process. As the grouting concludes, the grouting diffusion pressure gradually dissipates. It is noteworthy that the grouting pressure is first detected at the 30 cm horizontal position, followed by the 60 cm horizontal position, and then sequentially at the 30 cm upward position, 60 cm upward position, 90 cm upward position, and 90 cm horizontal position. This indicates that during the post-grouting of large-diameter piles, the geopolymer grout spreads laterally along the pile side under grouting pressure. After reaching a certain point, the grout moves upward and seeps downward. Once it reaches the 60 cm upward position, the grout spreads simultaneously toward the 90 cm upward and 90 cm horizontal positions. Due to the soft clay layer on the side of the pile, the grout’s upward and downward movements occur faster than its lateral diffusion, and the lateral diffusion pressure is lower than the upward diffusion pressure.

4.3.3. Analysis of Diffusion Form of Pile-Side Geopolymer Grouting

To characterize the grout diffusion patterns during large-diameter pile post-grouting, Figure 17 presents the excavated diffusion morphology and schematic diagrams of geopolymer grout under 100 kg, 150 kg, and 200 kg injection masses. When the mass of geopolymer post-grouting is 100 kg, the grout first compresses and diffuses along the pile circumference in the soil, causing layered fracturing with a fracture thickness of approximately 0.9 cm. When the mass of geopolymer post-grouting is 150 kg, the grout initially compresses and diffuses along the pile circumference in the soil, then fractures in a radial, sheet-like manner. The fracture thickness is approximately 0.9 cm, the radial diffusion reaches around 60 cm, the upward diffusion extends 80 cm, and the downward diffusion spans 30 cm. Since the upper consolidated soil mass is larger, the lateral frictional resistance is stronger in the upper part compared to the lower part, and the lower consolidated soil mass is destroyed when the ultimate bearing capacity is reached. When the mass of geopolymer post-grouting is 200 kg, the diffusion pattern is similar to that observed with 150 kg, with a fracture thickness of around 0.8 cm, radial diffusion extending up to 80 cm, upward diffusion reaching 90 cm, and downward diffusion extending 55 cm. Therefore, the diffusion form of GGMs in the clay-coated pile–soil interface is primarily compression diffusion. When the grouting volume exceeds a certain threshold, it causes fracturing of the soil surrounding the pile.

5. Conclusions

(1)
Compared with the traditional geopolymer grouting material and cement-based grouting material, the GPG-4 (FA:SP:SS = 1:1:0)-type geopolymer grouting material prepared in this study has good performance, and its fluidity (9.1 ± 0.2 s), bleeding rate (0.1 ± 0.02%), setting time (IST = 95 ± 4.9 min, FST = 155 ± 4.1 min), and compressive and flexural properties (FS = 4.82 ± 0.16 MPa, UCS = 25.51 ± 1.13 MPa) meet the requirements for post-grouting of pile foundations.
(2)
The geopolymer grouting material’s compressive and flexural properties were best under the YRWIM condition and worst under the NDM condition. For all three maintenance conditions, their compressive and flexural properties increased with the age of curing, and the rate of increase first increased and then decreased. For example, under YRWIM conditions, the FS of the geopolymer grout after 1, 3, 7, and 28 days of curing was 3.1 ± 0.79 MPa, 4.1 ± 0.53 MPa, 5.8 ± 0.47 MPa, and 6.4 ± 0.21 MPa, respectively, representing increases of 32.26%, 41.46%, and 10.34%.
(3)
The hydration products of the geopolymer grouting material prepared in this paper are mainly C-S-H and C-A-S-H gels. As the hydration reaction proceeds, the hydration products turn from low polymerization to a dense three-dimensional mesh structure, which constantly fills up the inter-particle voids. This is one of the main reasons for the enhancement of the geopolymer material’s mechanical properties.
(4)
Geopolymer post-compaction grouting can effectively weaken the effect of mud skin on the pile–soil interface’s performance, improving the shear strength of the pile–soil interface. Compared to the ungrouted pile, the maximum shear loads for post-grouting with 100 kg, 150 kg, and 200 kg of geopolymer increased by 17.0%, 26%, and 32.5%, respectively. In contrast, the shear displacements decreased by 9.89%, 20.64%, and 33.72%, separately.
(5)
Its pile–soil interface shear load–displacement curve meets the hyperbolic function relationship, and the goodness-of-fit R2 exceeds 0.99. We assessed the geopolymer slurry in the pile side performance of the squeeze split diffusion, and the slurry is firstly squeezed to the side of the pile for the squeeze diffusion and then along the periphery of the pile for the upward return and the downward seepage. Finally, the slurry fracture diffusion in the soil body increases with the increase in the grouting volume, and the length of the fractured grouted stone body increases with the increase in the grouting volume. The radial diffusion distance is 40–80 cm, the upward diffusion distance is 60–90 cm along the side of the pile, and the downward diffusion distance is 25–55 cm along the side of the pile.
In this study, a geopolymer grouting material suitable for post-compaction grouting of piles was prepared, micro characterization tests under different maintenance conditions were carried out to obtain the hydration mechanism of the geopolymer grouting material, and its suitability for post-compaction grouting of piles was verified by field interfacial shear tests. However, assessment of the carbon footprint of the whole life cycle of geopolymer post-grouting piles and its comparison with the mechanical properties and cost of conventional cement grouting materials will be carried out in a further study.

Author Contributions

Conceptualization, Y.X., C.Z. and W.H.; methodology, C.H., Z.X., J.W., P.L., Z.C. and W.H.; formal analysis, C.H., Z.X., J.W. and P.L.; investigation, C.H., Z.X. and Z.C.; resources, C.Z.; writing—first draft, C.H. and Y.X.; review and editing, J.W. and C.Z.; program administration, J.W. and C.Z.; funding, J.W. and C.Z. All authors have read and agreed to the published version of the manuscript.

Funding

Our work received support from the Yellow River Institute of Hydraulic Sciences Basic Research Business Expenses Special (HKY-JBYW-2023-07), the Transportation Science and Technology Program of Henan Province (No. 2021-2-2), the Open Project Funded by the Engineering Technology Research Center for Dike Safety and Disease Prevention and Control of the Ministry of Water Resources (LSDP202402), AND the First-class Project Special Funding of Yellow River Laboratory (YRL22LT07), which the authors gratefully acknowledge.

Data Availability Statement

The following supporting information can be downloaded at: www.zjjtkyy.com/zsriot/website/homeList.html?newsShow=110#/index (accessed on 25 March 2025), all materials for this study were provided by the Zhejiang Provincial Institute of Transportation Science and Research at the above URL. Data will be accessible on request.

Acknowledgments

Thanks to eceshi (www.eceshi.com (accessed on 29 February 2025)) for the SEM, FT-IR, and XRD test.

Conflicts of Interest

Authors Chongchong He and Wei He were employed by the company Zhengzhou Transportation Development Investment Group Co., Ltd. Author Pan Li was employed by the company Henan Yellow River Expressway Co., Ltd. Author Zhenpeng Chen was employed by the company Shanghai Tunnel Engineering Co., Ltd. The remaining authors declare that the research was conducted in the absence of any commercial or financial relationships that could be construed as a potential conflict of interest.

References

  1. Zheng, X.; Shi, B.; Sun, M.; Wang, X.; Wang, K.; Ni, W. Evaluating the effect of post-grouting on long bored pile based on ultra-weak fiber bragg grating array. Measurement 2023, 214, 112743. [Google Scholar] [CrossRef]
  2. Zhou, Z.; Xu, F.; Lei, J.; Bai, Y.; Chen, C.; Xu, T.; Zhang, Z.; Zhu, L.; Liu, T. Experimental study of the influence of different hole-forming methods on the bearing characteristics of post-grouting pile in loess areas. Transp. Geotech. 2021, 27, 100423. [Google Scholar] [CrossRef]
  3. Luan, S.; Wang, F.; Wang, T.; Lu, Z.; Shui, W. Characteristics of gravelly granite residual soil in bored pile design: An in situ test in shenzhen. Adv. Mater. Sci. Eng. 2018, 2018, 1–13. [Google Scholar] [CrossRef]
  4. Zhou, Z.J.; Wang, K.C.; Feng, H.M.; Tian, Y.Q.; Zhu, S.S. Centrifugal model test of post-grouting pile group in loess area. Soil. Dyn. Earthq. Eng. 2021, 151, 106985. [Google Scholar] [CrossRef]
  5. Wan, Z.; Dai, G.; Gong, W. Field and theoretical analysis of response of axially loaded grouted drilled shafts in extra-thick fine sand. Can. Geotech. J. 2020, 57, 391–407. [Google Scholar] [CrossRef]
  6. Gong, W.; Dai, G.; Zhang, H. Experimental study on pile-end post-grouting piles for superlarge bridge pile foundations. Front. Archit. Civil. Eng. China 2009, 3, 228–233. [Google Scholar] [CrossRef]
  7. Ahmad, Z.F.H.; Ahmad, R.; Al Bakri Abdullah, M.M.; Abd Rahim, S.Z.; Yahya, Z.; Li, L.Y.; Ediati, R. Geopolymer as underwater concreting material: A review. Constr. Build. Mater. 2021, 291, 123276. [Google Scholar] [CrossRef]
  8. Shehata, N.; Sayed, E.T.; Abdelkareem, M.A. Recent progress in environmentally friendly geopolymers: A review. Sci. Total Environ. 2021, 762, 143166. [Google Scholar] [CrossRef]
  9. Akhtar, N.; Ahmad, T.; Husain, D.; Majdi, A.; Alam, M.T.; Husain, N.; Wayal, A.K.S. Ecological footprint and economic assessment of conventional and geopolymer concrete for sustainable construction. J. Clean. Prod. 2022, 380, 134910. [Google Scholar] [CrossRef]
  10. Wei, Y.; Li, X.; Liu, L.; Kang, J.; Yu, B. A cost-effective and reliable pipelines layout of carbon capture and storage for achieving China’s carbon neutrality target. J. Clean. Prod. 2022, 379, 134651. [Google Scholar] [CrossRef]
  11. Bajpai, R.; Choudhary, K.; Srivastava, A.; Sangwan, K.S.; Singh, M. Environmental impact assessment of fly ash and silica fume based geopolymer concrete. J. Clean. Prod. 2020, 254, 120147. [Google Scholar] [CrossRef]
  12. Zhao, J.H.; Tong, L.Y.; Li, B.E.; Chen, T.H.; Wang, C.P.; Yang, G.Q.; Zhang, Y. Eco-friendly geopolymer materials: A review of performance improvement, potential application and sustainability assessment. J. Clean. Prod. 2021, 307, 127085. [Google Scholar] [CrossRef]
  13. Shobeiri, V.; Bennett, B.; Xie, T.; Visintin, P. A comprehensive assessment of the global warming potential of geopolymer concrete. J. Clean. Prod. 2021, 297, 126669. [Google Scholar] [CrossRef]
  14. Zhuang, X.Y.; Chen, L.; Komarneni, S.; Zhou, C.H.; Tong, D.S.; Yang, H.M.; Yu, W.H.; Wang, H. Fly ash-based geopolymer: Clean production, properties and applications. J. Clean. Prod. 2016, 125, 253–267. [Google Scholar] [CrossRef]
  15. Zhou, S.; Yang, Z.; Zhang, R.; Li, F. Preparation, characterization and rheological analysis of eco-friendly road geopolymer grouting materials based on volcanic ash and metakaolin. J. Clean. Prod. 2021, 312, 127822. [Google Scholar] [CrossRef]
  16. Zhang, P.; Gao, Z.; Wang, J.; Guo, J.; Hu, S.; Ling, Y. Properties of fresh and hardened fly ash/slag based geopolymer concrete: A review. J. Clean. Prod. 2020, 270, 122389. [Google Scholar] [CrossRef]
  17. Davidovits, J. Geopolymers and geopolymeric materials. J. Therm. Anal. 1989, 35, 429–441. [Google Scholar] [CrossRef]
  18. Fahim, H.G.; Mirza, J.; Ismail, M.; Ghoshal, S.K.; Abdulameer, H.A. Geopolymer mortars as sustainable repair material: A comprehensive review. Renew. Sustain. Energy Rev. 2017, 80, 54–74. [Google Scholar] [CrossRef]
  19. Fořt, J.; Novotný, R.; Vejmelková, E.; Trník, A.; Rovnaníková, P.; Keppert, M.; Pommer, V.; Černý, R. Characterization of geopolymers prepared using powdered brick. J. Mater. Res. Technol. 2019, 8, 6253–6261. [Google Scholar] [CrossRef]
  20. Yazdi, M.A.; Liebscher, M.; Hempel, S.; Yang, J.; Mechtcherine, V. Correlation of microstructural and mechanical properties of geopolymers produced from fly ash and slag at room temperature. Constr. Build. Mater. 2018, 191, 330–341. [Google Scholar] [CrossRef]
  21. Wang, X.; Zhang, C.; Zhu, H.; Wu, Q. Reaction kinetics and mechanical properties of a mineral-micropowder/metakaolin-based geopolymer. Ceram. Int. 2022, 48, 14173–14181. [Google Scholar] [CrossRef]
  22. Hui-Teng, N.; Cheng-Yong, H.; Yun-Ming, L.; Abdullah, M.M.A.B.; Pakawanit, P.; Bayuaji, R.; Yong-Sing, N.; Zulkifly, K.B.; Wan-En, O.; Yong-Jie, H.; et al. Comparison of thermal performance between fly ash geopolymer and fly ash-ladle furnace slag geopolymer. J. Non Cryst. Solids 2022, 585, 121527. [Google Scholar] [CrossRef]
  23. Du, X.M.; Liu, C.; Wang, C.J.; Fang, H.Y.; Xue, B.H.; Gao, X.L.; Han, Y.H. Diffusion characteristics and reinforcement effect of cement slurry on porous medium under dynamic water condition considering infiltration. Tunn. Undergr. Space Technol. 2022, 130, 104766. [Google Scholar] [CrossRef]
  24. Zhang, C.; Yang, J.S.; Fu, J.Y.; Wang, S.Y.; Yin, J.; Xie, Y.P.; Li, L.Y. Cement based eco-grouting composite for pre-reinforcement of shallow underground excavation in vegetation protection area. Tunn. Undergr. Space Technol. 2021, 118, 104188. [Google Scholar] [CrossRef]
  25. Ge, X.; Duran, L.; Tao, M.; Degroot, D.J.; Li, E.; Zhang, G. Characteristics of underwater cast and cured geopolymers. Cem. Concr. Compos. 2020, 114, 103783. [Google Scholar] [CrossRef]
  26. Li, L.; Wei, Y.; Li, Z.; Farooqi, M.U. Rheological and viscoelastic characterizations of fly ash/slag/silica fume-based geopolymer. J. Clean. Prod. 2022, 354, 131629. [Google Scholar] [CrossRef]
  27. Liu, F.; Zheng, M.; Ye, Y. Formulation and properties of a newly developed powder geopolymer grouting material. Constr. Build. Mater. 2020, 258, 120304. [Google Scholar] [CrossRef]
  28. Zhang, Y.; Wang, Y.; Wu, Z.; Lu, Y.; Kang, A.; Xiao, P. Optimal design of geopolymer grouting material for semi-flexible pavement based on response surface methodology. Constr. Build. Mater. 2021, 306, 124779. [Google Scholar] [CrossRef]
  29. Zeng, M.; Wang, Z. Composition optimization and mechanism study of solid waste based road geopolymer grouting materials. Bull. Chin. Ceram. Soc. 2023, 42, 3033–3044. [Google Scholar] [CrossRef]
  30. Li, P.; Xia, Y.; Xie, X.; Wang, J.; Wang, C.; Shi, M.; Wang, B.; Wu, H.Y. Study on vertical bearing capacity of pile foundation with distributed geopolymer post-grouting on pile side. Materials 2024, 17, 398. [Google Scholar] [CrossRef]
  31. GB/T 50448-2015; Technical Code for Application of Cementitious Grout. China Building Industry Press: Beijing, China, 2015.
  32. JT/T 946-2022; Grouting Material for Prestressed Structure in Highway Engineering. Ministry of Transport of China: Beijing, China, 2022.
  33. Wan, Z.; Liu, H.; Zhou, F.; Dai, G. Axial bearing mechanism of post-grouted piles in calcareous sand. Appl. Sci. 2022, 12, 2731. [Google Scholar] [CrossRef]
  34. Wu, T.; Gao, Y.; Zhou, Y. Application of a novel grouting material for prereinforcement of shield tunnelling adjacent to existing piles in a soft soil area. Tunn. Undergr. Space Technol. 2022, 128, 104646. [Google Scholar] [CrossRef]
  35. GB/T 1346-2011; Test Methods for Water Requirement of Normal Consistency, Setting Time and Soundness of the Portland Cement. Standards Press of China: Beijing, China, 2011.
  36. GB/T 17671-2021; Test Method of Cement Mortar Strength (ISO Method). Standards Press of China: Beijing, China, 2021.
  37. Guo, Y.; Huang, Y.; Li, J.; Ouyang, S.; Fan, B.; Liu, Y.; Hou, J.F. Preparation of the geopolymer grouting material by coal-based solid wastes for the aquiclude key strata and its application. Constr. Build. Mater. 2023, 408, 133539. [Google Scholar] [CrossRef]
  38. Tong, X.; Tang, H.; Gan, R.; Li, Z.; He, X.; Gu, S. Characteristics and causes of changing groundwater quality in the boundary line of the middle and lower yellow river (right bank). Water 2022, 14, 1846. [Google Scholar] [CrossRef]
  39. Su, Y.; Luo, B.; Luo, Z.; Xu, F.; Huang, H.; Long, Z.; Shen, C.P. Mechanical characteristics and solidification mechanism of slag/fly ash-based geopolymer and cement solidified organic clay: A comparative study. J. Build. Eng. 2023, 71, 106459. [Google Scholar] [CrossRef]
  40. Liu, Z.; Zhang, D.; Li, L.; Wang, J.; Shao, N.; Wang, D. Microstructure and phase evolution of alkali-activated steel slag during early age. Constr. Build. Mater. 2019, 204, 158–165. [Google Scholar] [CrossRef]
  41. Guo, L.; Zhou, M.; Wang, X.; Li, C.; Jia, H. Preparation of coal gangue-slag-fly ash geopolymer grouting materials. Constr. Build. Mater. 2022, 328, 126997. [Google Scholar] [CrossRef]
  42. Wang, C.; Wen, P.; Wang, M.; Fan, Q.; Wang, X. Preparation and characterization of road alkali-activated blast furnace slag paste. Constr. Build. Mater. 2018, 181, 175–184. [Google Scholar] [CrossRef]
  43. JGJ 106-2014; Technical Code for Testing of Building Foundation Piles. China Building Industry Press: Beijing, China, 2014.
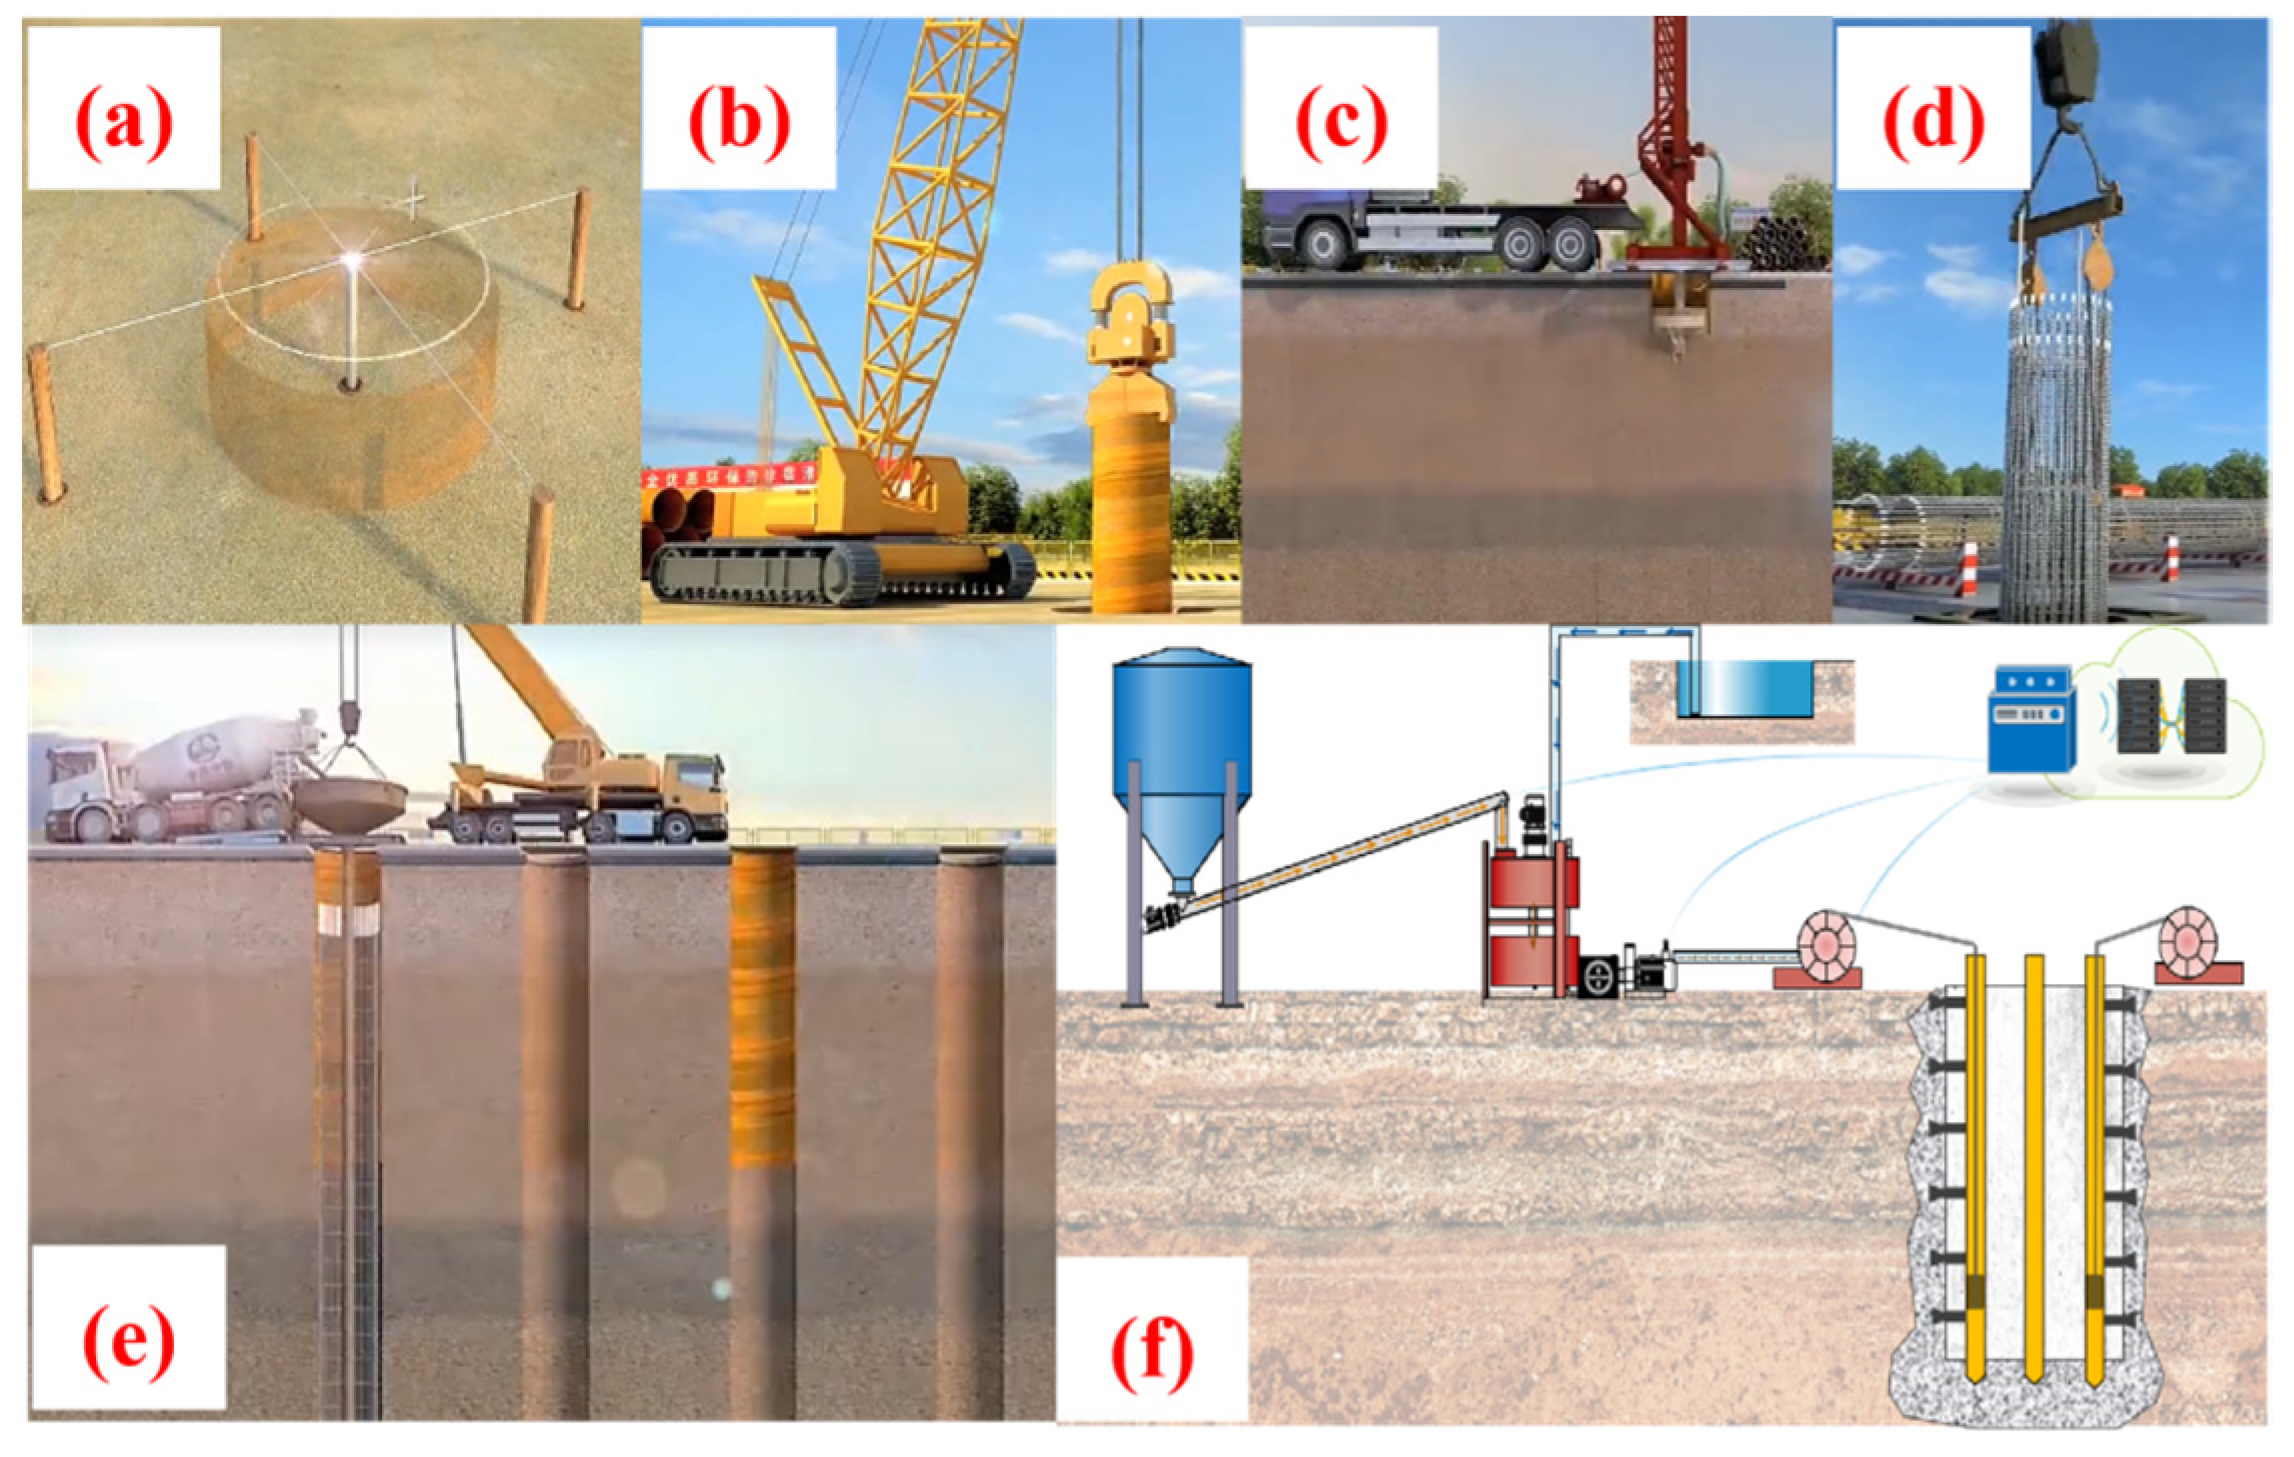
Figure 1. Bored pile formation and post-grouting process: (a) pile hole locating; (b) embedded steel tube; (c) borehole drilling; (d) placement of steel reinforcement cage; (e) pouring concrete; (f) post grouting.
Buildings 15 01121 g001
Figure 2. The preparation and performance testing process of geopolymer grouting materials.
Buildings 15 01121 g002
Figure 3. Grouting material real pictures: (a) traditional cement-based materials, (b) GGMs.
Buildings 15 01121 g003
Figure 4. Mechanical properties testing of geopolymers: (a) the curve of FS with age of maintenance under different maintenance conditions; (b) the curve of UCS with age of maintenance under different maintenance conditions.
Buildings 15 01121 g004
Figure 5. SEM morphology of geopolymer raw materials (magnification 50,000×): (a) fly ash; (b) slag; (c) unconsolidated geopolymer.
Buildings 15 01121 g005
Figure 6. SEM morphology (magnification 10,000×) of GGMs at discrepant ages under YRWIM conditions. (a) 1 d; (b) 3 d; (c) 7 d; (d) 28 d; (e) 28 d other magnifications.
Buildings 15 01121 g006aBuildings 15 01121 g006b
Figure 7. EDS spectra of the points in Figure 6: (a) EDS Spot 1; (b) EDS Spot 2.
Buildings 15 01121 g007
Figure 8. SEM morphology (magnification 10,000×) of GGMs at discrepant ages under WIM conditions. (a) 1 d; (b) 3 d; (c) 7 d; (d) 28 d; (e) 28 d other magnifications.
Buildings 15 01121 g008
Figure 9. SEM morphology (magnification 10,000×) of GGMs at different ages under NDM conditions. (a) 1 d; (b) 3 d; (c) 7 d; (d) 28 d; (e) 28 d other magnifications.
Buildings 15 01121 g009
Figure 10. XRD patterns of GGMs under different maintenance conditions. (a) YRWIM; (b) WIM; (c) NDM.
Buildings 15 01121 g010
Figure 11. FT-IR patterns of GGMs in discrepant maintenance conditions. (a) YRWIM; (b) WIM; (c) NDM.
Buildings 15 01121 g011
Figure 12. Schematic diagram of hydration mechanism of GP-4 geopolymer.
Buildings 15 01121 g012
Figure 13. Field pile–soil interface shear test process.
Buildings 15 01121 g013
Figure 14. Field pile–soil interface shear test model pile.
Buildings 15 01121 g014
Figure 15. The shear load–displacement curve of the pile top under different grouting volume.
Buildings 15 01121 g015
Figure 16. The time-dependent variation curve of grouting diffusion pressure.
Buildings 15 01121 g016
Figure 17. Field pile–soil interface shear test process.
Buildings 15 01121 g017
Table 1. Chemical components of FA, slag, and steel slag.
Raw MaterialsQuality Fraction (%)
SiO2Al2O3CaOMgOFe2O3Na2OK2OMnOTiO2P2O5OthersLOI
FA56.922.17.33.64.10.80.40.111.0-3.692.45
SP32.44.851.33.91.60.50.30.40.6-4.22.14
SS13.214.3548.784.2120.63--3.161.831.252.581.68
Table 2. Mixing proportions of seven geopolymer grouting materials.
TypesFA (%)SP (%)SS (%)NaOH (%)Na2SiO3 (%)L/S
GP-190001050.6
GP-209001050.6
GP-300901050.6
GP-4454501050.6
GP-5450451050.6
GP-6045451050.6
GP-73030301050.6
Table 3. Comparison of the performance test results of different ratios of GGMs.
NumbersFT (s)BR (%)IST (min)FST (min)7 d FS (MPa)7 d UCS (MPa)
GP-115.2 ± 0.40.4 ± 0.05132 ± 3.7293 ± 4.93.23 ± 0.1810.55 ± 1.45
GP-212.3 ± 0.30.2 ± 0.0329 ± 2.493 ± 4.24.01 ± 0.1120.94 ± 2.07
GP-310.5 ± 0.30.4 ± 0.04264 ± 4.9383 ± 12.32.77 ± 0.1512.21 ± 1.32
GP-49.1 ± 0.20.1 ± 0.0295 ± 4.9155 ± 4.14.82 ± 0.1625.51 ± 1.13
GP-513.8 ± 0.50.2 ± 0.0399 ± 4.1156 ± 4.91.22 ± 0.2110.83 ± 1.02
GP-612.9 ± 0.40.3 ± 0.03117 ± 4.1203 ± 7.33.94 ± 0.2618.11 ± 1.82
GP-713.1 ± 0.50.4 ± 0.13132 ± 4.9293 ± 9.83.65 ± 0.3215.12 ± 1.57
Traditional cement-based materials12.1 ± 0.20.3 ± 0.02245 ± 5.7385 ± 10.61.39 ± 0.1319.23 ± 1.63
Zeng and Wang [29]32.35-34-1.5011.84
Table 4. Field pile–soil interface shear test design.
Model Pile NumberGrouting Volume (kg)
LD-10
LD-2100
LD-3150
LD-4200
Table 5. Basic physical and mechanical parameters of silt soil.
Density
(g⋅cm3)
Water
Content
(%)
Cohesion (kPa)Internal Friction Angle (°)Void
Ratio
Constrained
Modulus (MPa)
1.924.88.831.20.8121.2
Table 6. Fitting parameters.
Model Pile NumberModel Parameter aModel Parameter bGoodness of Fitting R2
LD-10.07260.02790.9948
LD-20.03600.00300.9973
LD-30.02880.00290.9980
LD-40.01950.00290.9988
Disclaimer/Publisher’s Note: The statements, opinions and data contained in all publications are solely those of the individual author(s) and contributor(s) and not of MDPI and/or the editor(s). MDPI and/or the editor(s) disclaim responsibility for any injury to people or property resulting from any ideas, methods, instructions or products referred to in the content.