Article

Computer Vision-Based Monitoring of Bridge Structural Vibration During Incremental Launching Construction

1
Road & Bridge International Co., Ltd., Beijing 100027, China
2
College of Civil Engineering, Zhejiang University of Technology, Hangzhou 310014, China
3
Road & Bridge East China Engineering Co., Ltd., Shanghai 201203, China
*
Author to whom correspondence should be addressed.
Buildings 2025, 15(7), 1139; https://doi.org/10.3390/buildings15071139
Submission received: 23 January 2025 / Revised: 14 March 2025 / Accepted: 27 March 2025 / Published: 31 March 2025

Abstract

:
Conducting vibration monitoring during bridge construction is of significance for ensuring the safety of personnel and property and achieving safety risk management and controlling. However, current bridge vibration monitoring faces numerous challenges, including a large number of measurement points, significant frequency differences, vast structural scales, lack of fixed reference points, and difficulties in temporary deployment. This paper proposes a method for bridge structural vibration monitoring based on computer vision. The method utilizes high-definition cameras to capture dynamic images of bridges and incorporates advanced image processing algorithms to automatically identify and track the vibration characteristics of bridge structures, achieving low energy consumption, low cost, and high efficiency in monitoring. For developing this method, experiments were first conducted in an indoor environment using preset templates, where the amplitude error was within 0.5% and the frequency error was within 0.2%, verifying the feasibility and accuracy of the method. Subsequently, the size of the templates was altered, and the experimental results for five different template sizes were compared. The frequency errors were all within 0.2%, and the amplitude errors were all within 0.5%, with minimal differences, demonstrating the adaptability of the method. Subsequently, under the same indoor conditions, monitoring is conducted using the feature-based template matching method and cross-correlation-based method, respectively. The largest amplitude errors measured by the two methods were 5.59% and 14.39%, respectively, while the frequency errors were 1.82% and 1.02%, respectively. Finally, the method was applied to monitor the displacement of the piers during the jacking construction process of the Yongning Bridge.

1. Introduction

In recent years, China has witnessed a continuous surge in the construction of urban viaducts, interchanges, river-crossing bridges, and various types of highway bridges. During bridge construction period, issues such as excessive structural vibration and displacement may be encountered. Therefore, conducting vibration monitoring of bridge structures during the construction period is of significance for ensuring the safety of personnel and property and achieving safety risk management and control [1,2,3,4,5]. However, at present, bridge vibration monitoring faces numerous challenges, including numerous measurement points, significant frequency differences, large structural scales, lack of fixed reference points, and difficulties in temporary deployment [6,7]. To overcome these existing defects, researchers have proposed computer vision-based methods for vibration monitoring of bridge structures. This is an interdisciplinary research field that combines computer vision technology, structural mechanics, and bridge engineering. In recent years, with the rapid development of computer vision technology, this field has achieved significant advancements [8,9,10,11,12,13].
In experiments on bridge structure vibration monitoring based on computer vision, Bao et al. [14] applied computer vision and deep learning to detect abnormal data in structural health monitoring. Busca et al. [15] conducted vibration tests on multiple measurement points on a bridge and compared the characteristics of three different image processing techniques (template recognition, edge detection, and digital image correlation) in dynamic displacement measurement, providing application recommendations for the three techniques. Ji et al. [16] proposed an unmarked image processing technique based on the optical flow method for monitoring the micro-vibrations of stay cables. Chen et al. [17] proposed using digital photogrammetry to detect noise vibration responses and employed multiple cameras to monitor and identify modal shapes of stay cables. Kim et al. [18] developed a visual monitoring software system based on the NCC (normalized cross-correlation) template matching method to test the dynamic characteristics of stay cables. Kohut et al. [19] developed a visual system for three-dimensional vibration displacement measurement of structures and used operational modal analysis algorithms to obtain modal characteristic parameters of the structures. Jian et al. [20] proposed a traffic perception method that combines computer vision technology based on deep learning with the influence line theory. Experimental results showed that this method can accurately measure structural displacement and acceleration and accurately identify the natural frequencies of structural vibrations.
In computer vision-based vibration monitoring of bridge structures, various image processing techniques are utilized to acquire dynamic data of bridges. In terms of image processing techniques, Fukuda et al. [21] proposed an object search OCM algorithm that does not require the installation of traditional target panels on the structure. Instead, it can accurately measure displacement by tracking existing features on the structure. Wang et al. [22] proposed a phase-shifting image matching algorithm for processing interferometric images to measure structural displacement. Feng et al. [23] proposed a robust target search algorithm that ensures the accuracy of displacement measurement by tracking pre-existing feature information on the structure. Lee et al. [24] proposed a path map optimization method for displacement estimation to reduce estimation errors when using a vision-matched servo structured light system for displacement monitoring. Chan et al. [25] integrated image processing techniques of pixel identification and subsequent edge detection into a monitoring method based on CCD cameras to achieve vertical deflection monitoring of bridges and proposed that this method can complement the fiber Bragg grating (FBG) displacement measurement method.
Real-time monitoring of multiple target points on bridges based on computer vision enables multi-point dynamic measurement. In terms of multi-point synchronous measurement, Dong et al. [26] proposed a method for synchronous measurement of structural dynamic displacements at multiple points, providing a new idea for the application of multi-point synchronous measurement in engineering. Ye et al. [27] proposed a multi-point dynamic displacement monitoring method based on template matching. They compared the differences in monitoring accuracy between LED lights and black dot targets and found that the root mean squared error could be less than 1.0 mm for both. Subsequently, they monitored the mid-span dynamic displacement of the Tsing Ma Bridge in Hong Kong at a monitoring distance of 1000 m. Lee et al. [28] monitored the dynamic deformation of a bridge in real-time through image measurement technology and utilized the data for more in-depth structural analysis, evaluating the bridge’s bearing capacity based on the deformation information. Feng et al. [29] demonstrated that a single camera can simultaneously and accurately measure dynamic displacement responses at a series of points, and the identified natural frequencies and mode shapes match well with those measured and identified based on multiple accelerometer sensors. Chang et al. [30] demonstrated that the testing accuracy of photoelectric deflectometers is sufficient to meet the current needs of bridge deflection monitoring, with multi-point monitoring capabilities and certain advantages for bridge alignment monitoring. Li et al. [31] used disk arrays and synchronous signal generators to ensure massive data processing and synchronization between multiple cameras, conducting dynamic displacement monitoring of a four-story steel frame structure on a shaking table, proving that digital image processing technology can achieve synchronous acquisition and processing of multi-channel dynamic two-dimensional displacements. Mas et al. [32] developed an algorithm for synchronous multi-point measurement of vibration frequencies and verified the effectiveness of the algorithm on a steel pedestrian bridge, elevating multi-point synchronous measurement to a new level.
Pixel-level target displacement recognition may not meet the measurement accuracy requirements when dealing with large measurement distances and small displacements to be measured. However, the sub-pixel method can improve measurement accuracy with limited image resolution. Sub-pixel displacement measurement is a technique for measuring minute changes in an object’s position or displacement, with an accuracy range smaller than a single pixel size. Based on a comprehensive analysis of various sub-pixel registration algorithms, Pan et al. [33] proposed an improved method, which further enhanced the sub-pixel accuracy of the digital image correlation method. Debella-Gilo and Kääb [34] evaluated two different methods, grayscale interpolation and correlation interpolation, to improve the measurement accuracy of structural surface displacements. Through mathematical simulations, Mas et al. [35] confirmed the practical upper limit of sub-pixel accuracy and highlighted the important relationship between sub-pixel resolution and the dynamic range of the image sensor. Lee et al. [36] utilized the relationship between structural displacement and rotation angle and obtained structural rotation and tilt angles through machine vision methods. They developed a vision-based system for measuring the rotation angles of large-scale civil engineering structures and used it in practical applications of computer vision-based vibration monitoring of bridge structures.
This article proposes a bridge structure vibration monitoring method based on computer vision that utilizes high-definition cameras to capture dynamic images of bridges. It combines advanced image processing algorithms to automatically identify and track the vibration characteristics of bridge structures, achieving low energy consumption, low cost, and high-efficiency monitoring. For this method, experiments were first conducted in an indoor environment with preset templates to verify the feasibility and accuracy of the method. Then, the size of the templates was changed, and the experimental results for different sizes were compared to verify the adaptability of the method. Subsequently, under the same indoor conditions, monitoring is conducted using the feature-based template matching method and cross-correlation-based method, respectively, and the experimental results of different methods were compared. Finally, the method was applied to monitor the displacement of Yongning Bridge piers during the jacking construction process. This method has brought contributions to the field of bridge structural health monitoring. It investigated the influence of the template sizes, compared different methods, and conducted practical application during the bridge construction period. It can provide a reference for similar scenarios for safety evaluation during bridge construction.

2. Bridge Structure Vibration Monitoring Method Based on Computer Vision
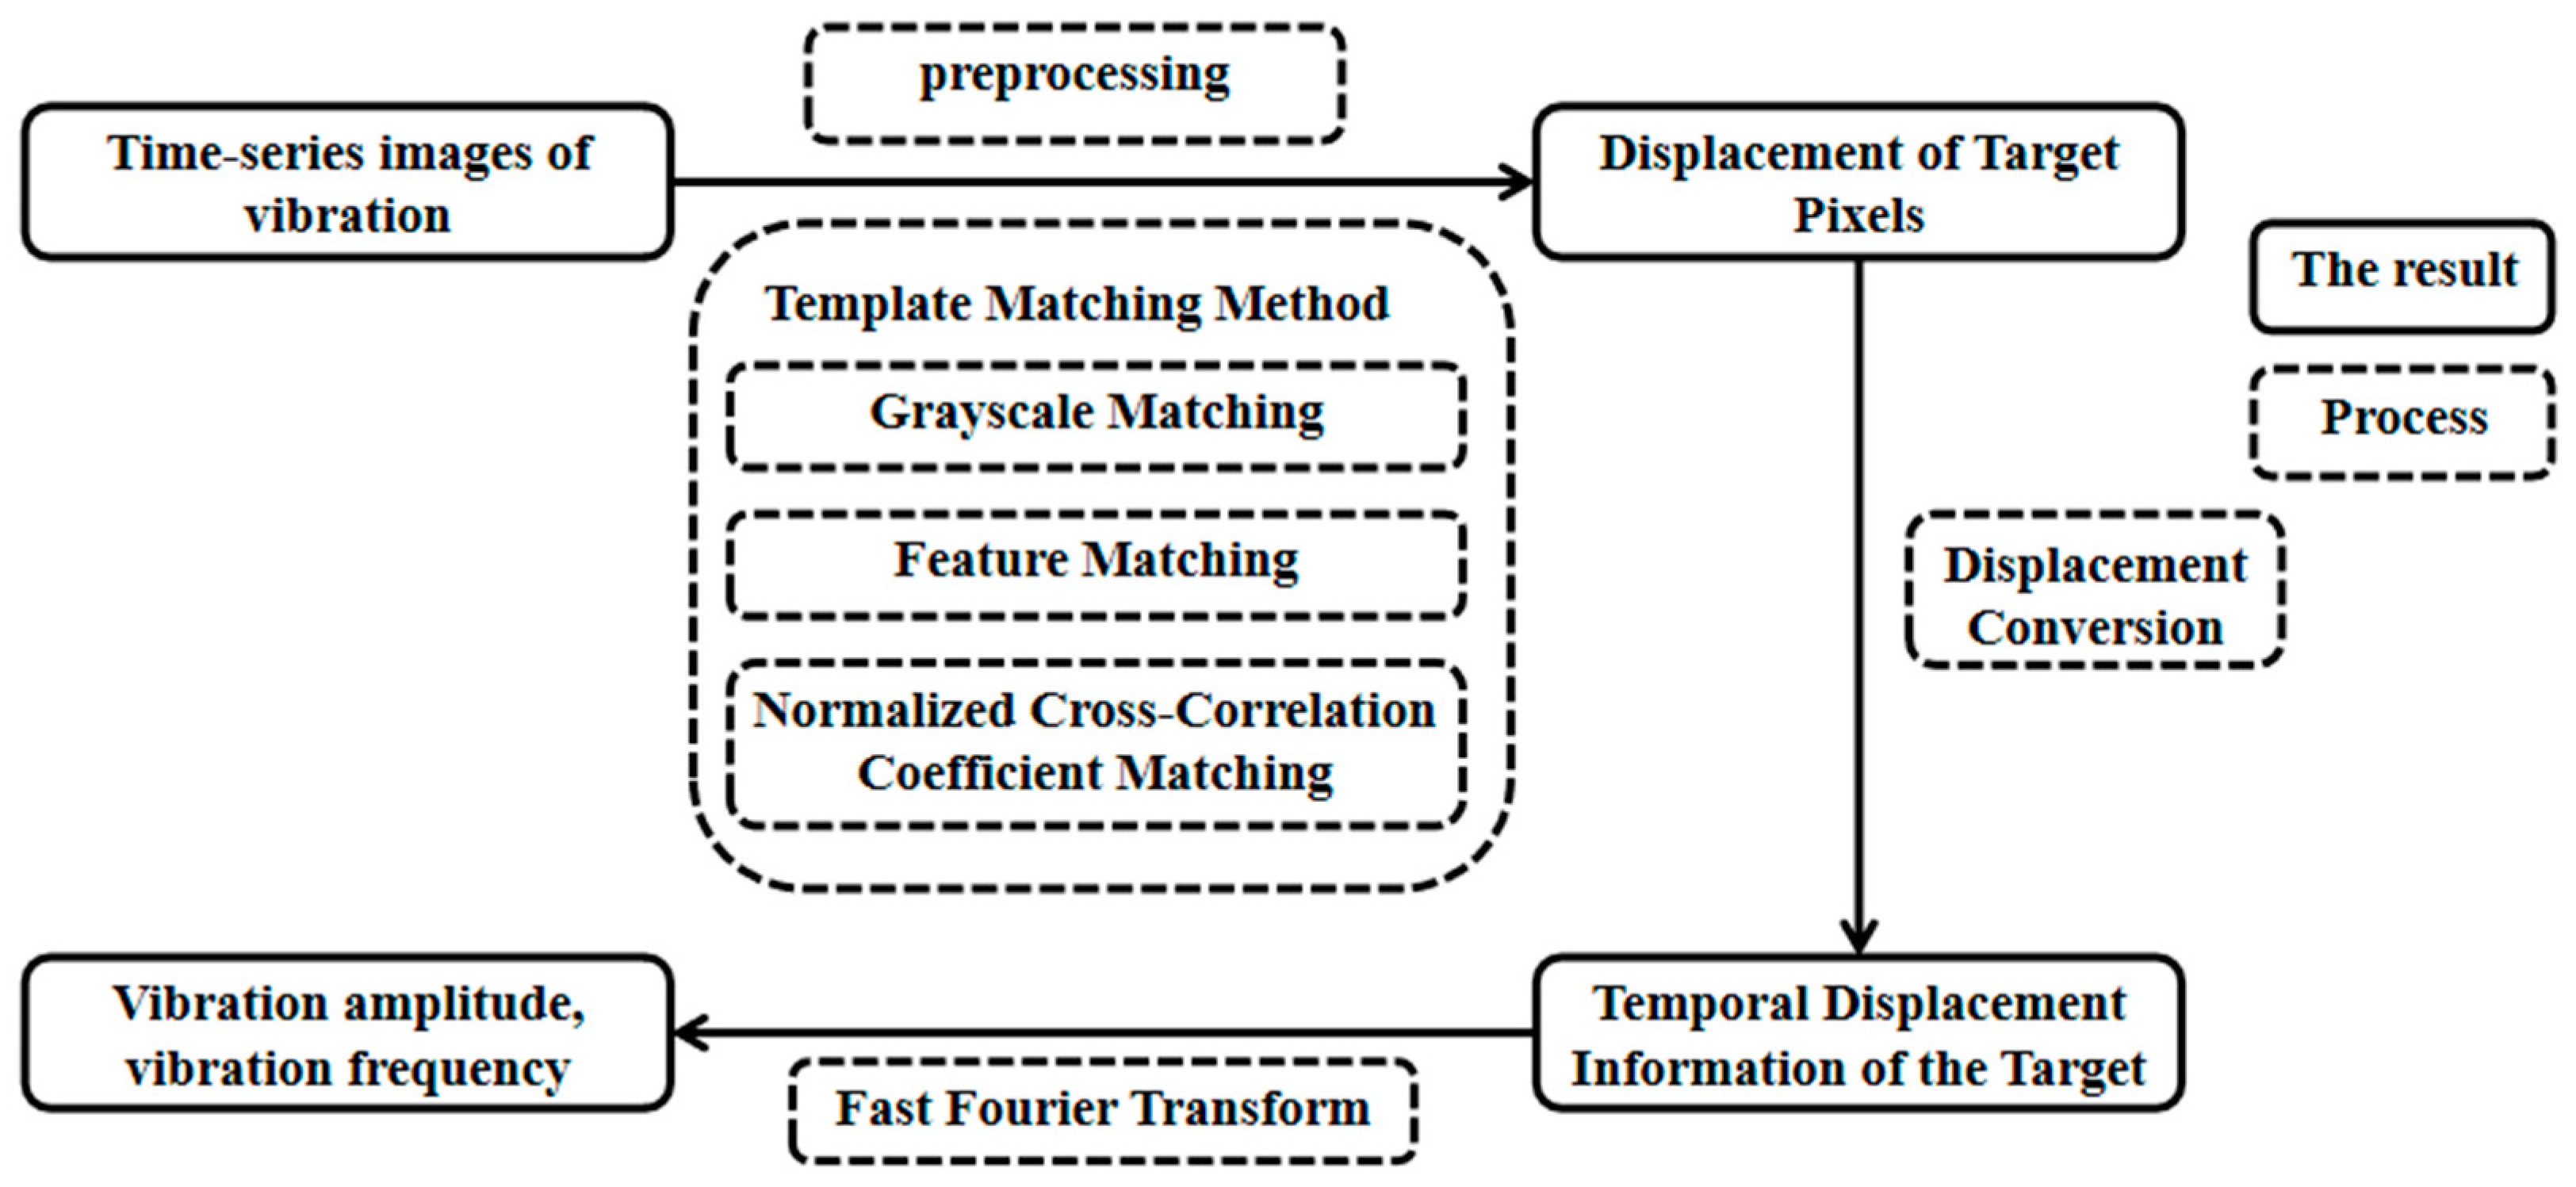
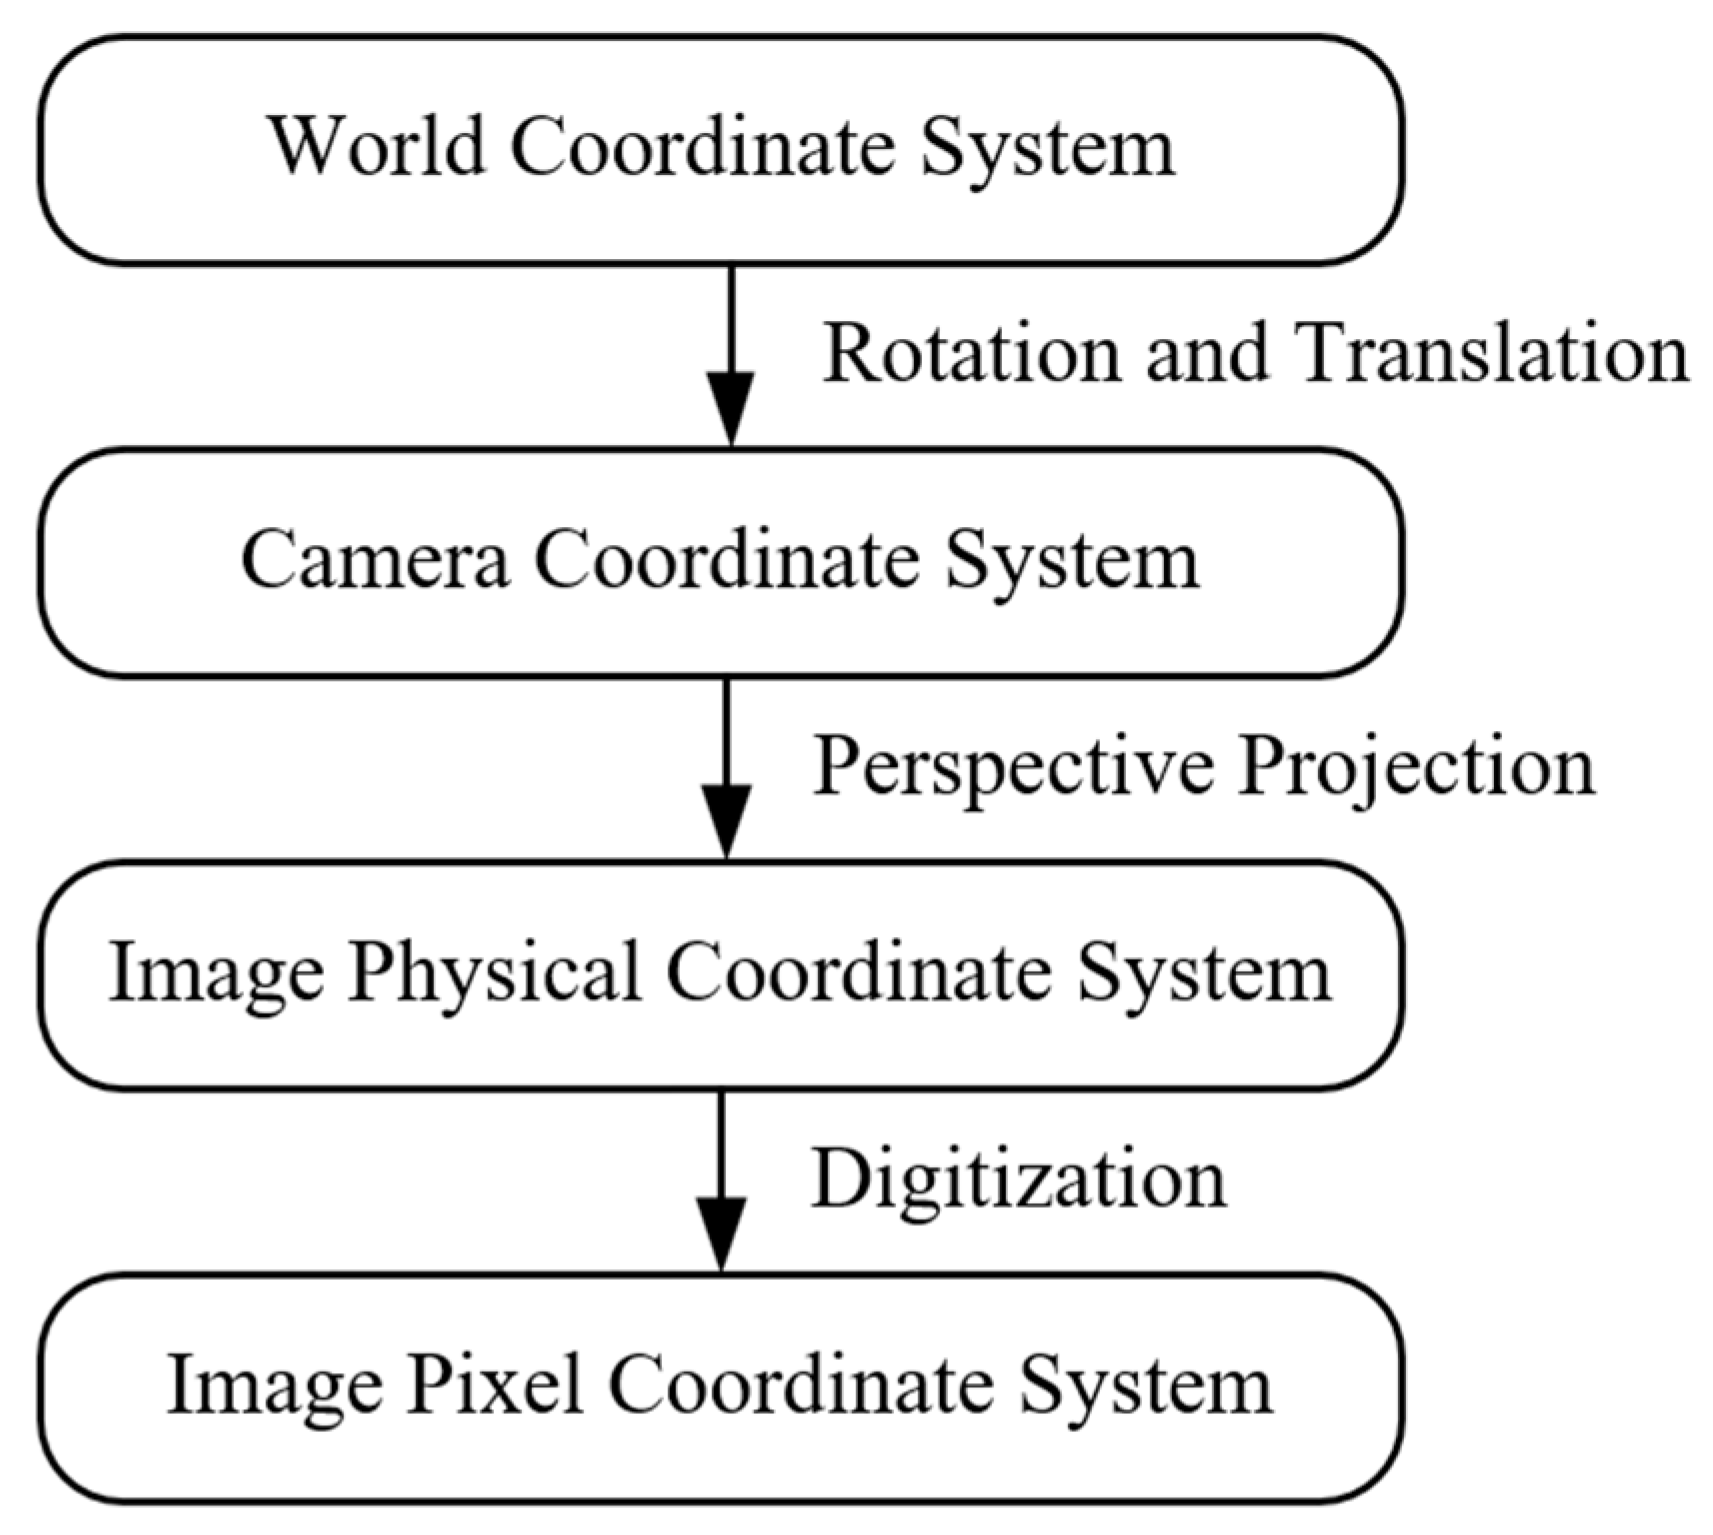
2.1. Basic Process

The implementation of the bridge structure vibration monitoring method based on computer vision is shown in Figure 1. Structural vibration time series imagesare captured using a camera, and the captured images are preprocessed to improve image quality. Subsequently, the template matching method is used to locate image targets based on the correlation and consistency of analyzed textures, gray levels, and features. After completing the tracking of the target points, the pixel displacements are converted into physical displacements to obtain the time–history information of the target displacements. Finally, by converting the time–history information into the frequency domain (using Fast Fourier Transform, FFT, in this paper), the vibration amplitude and vibration frequency of the monitored target can be obtained.

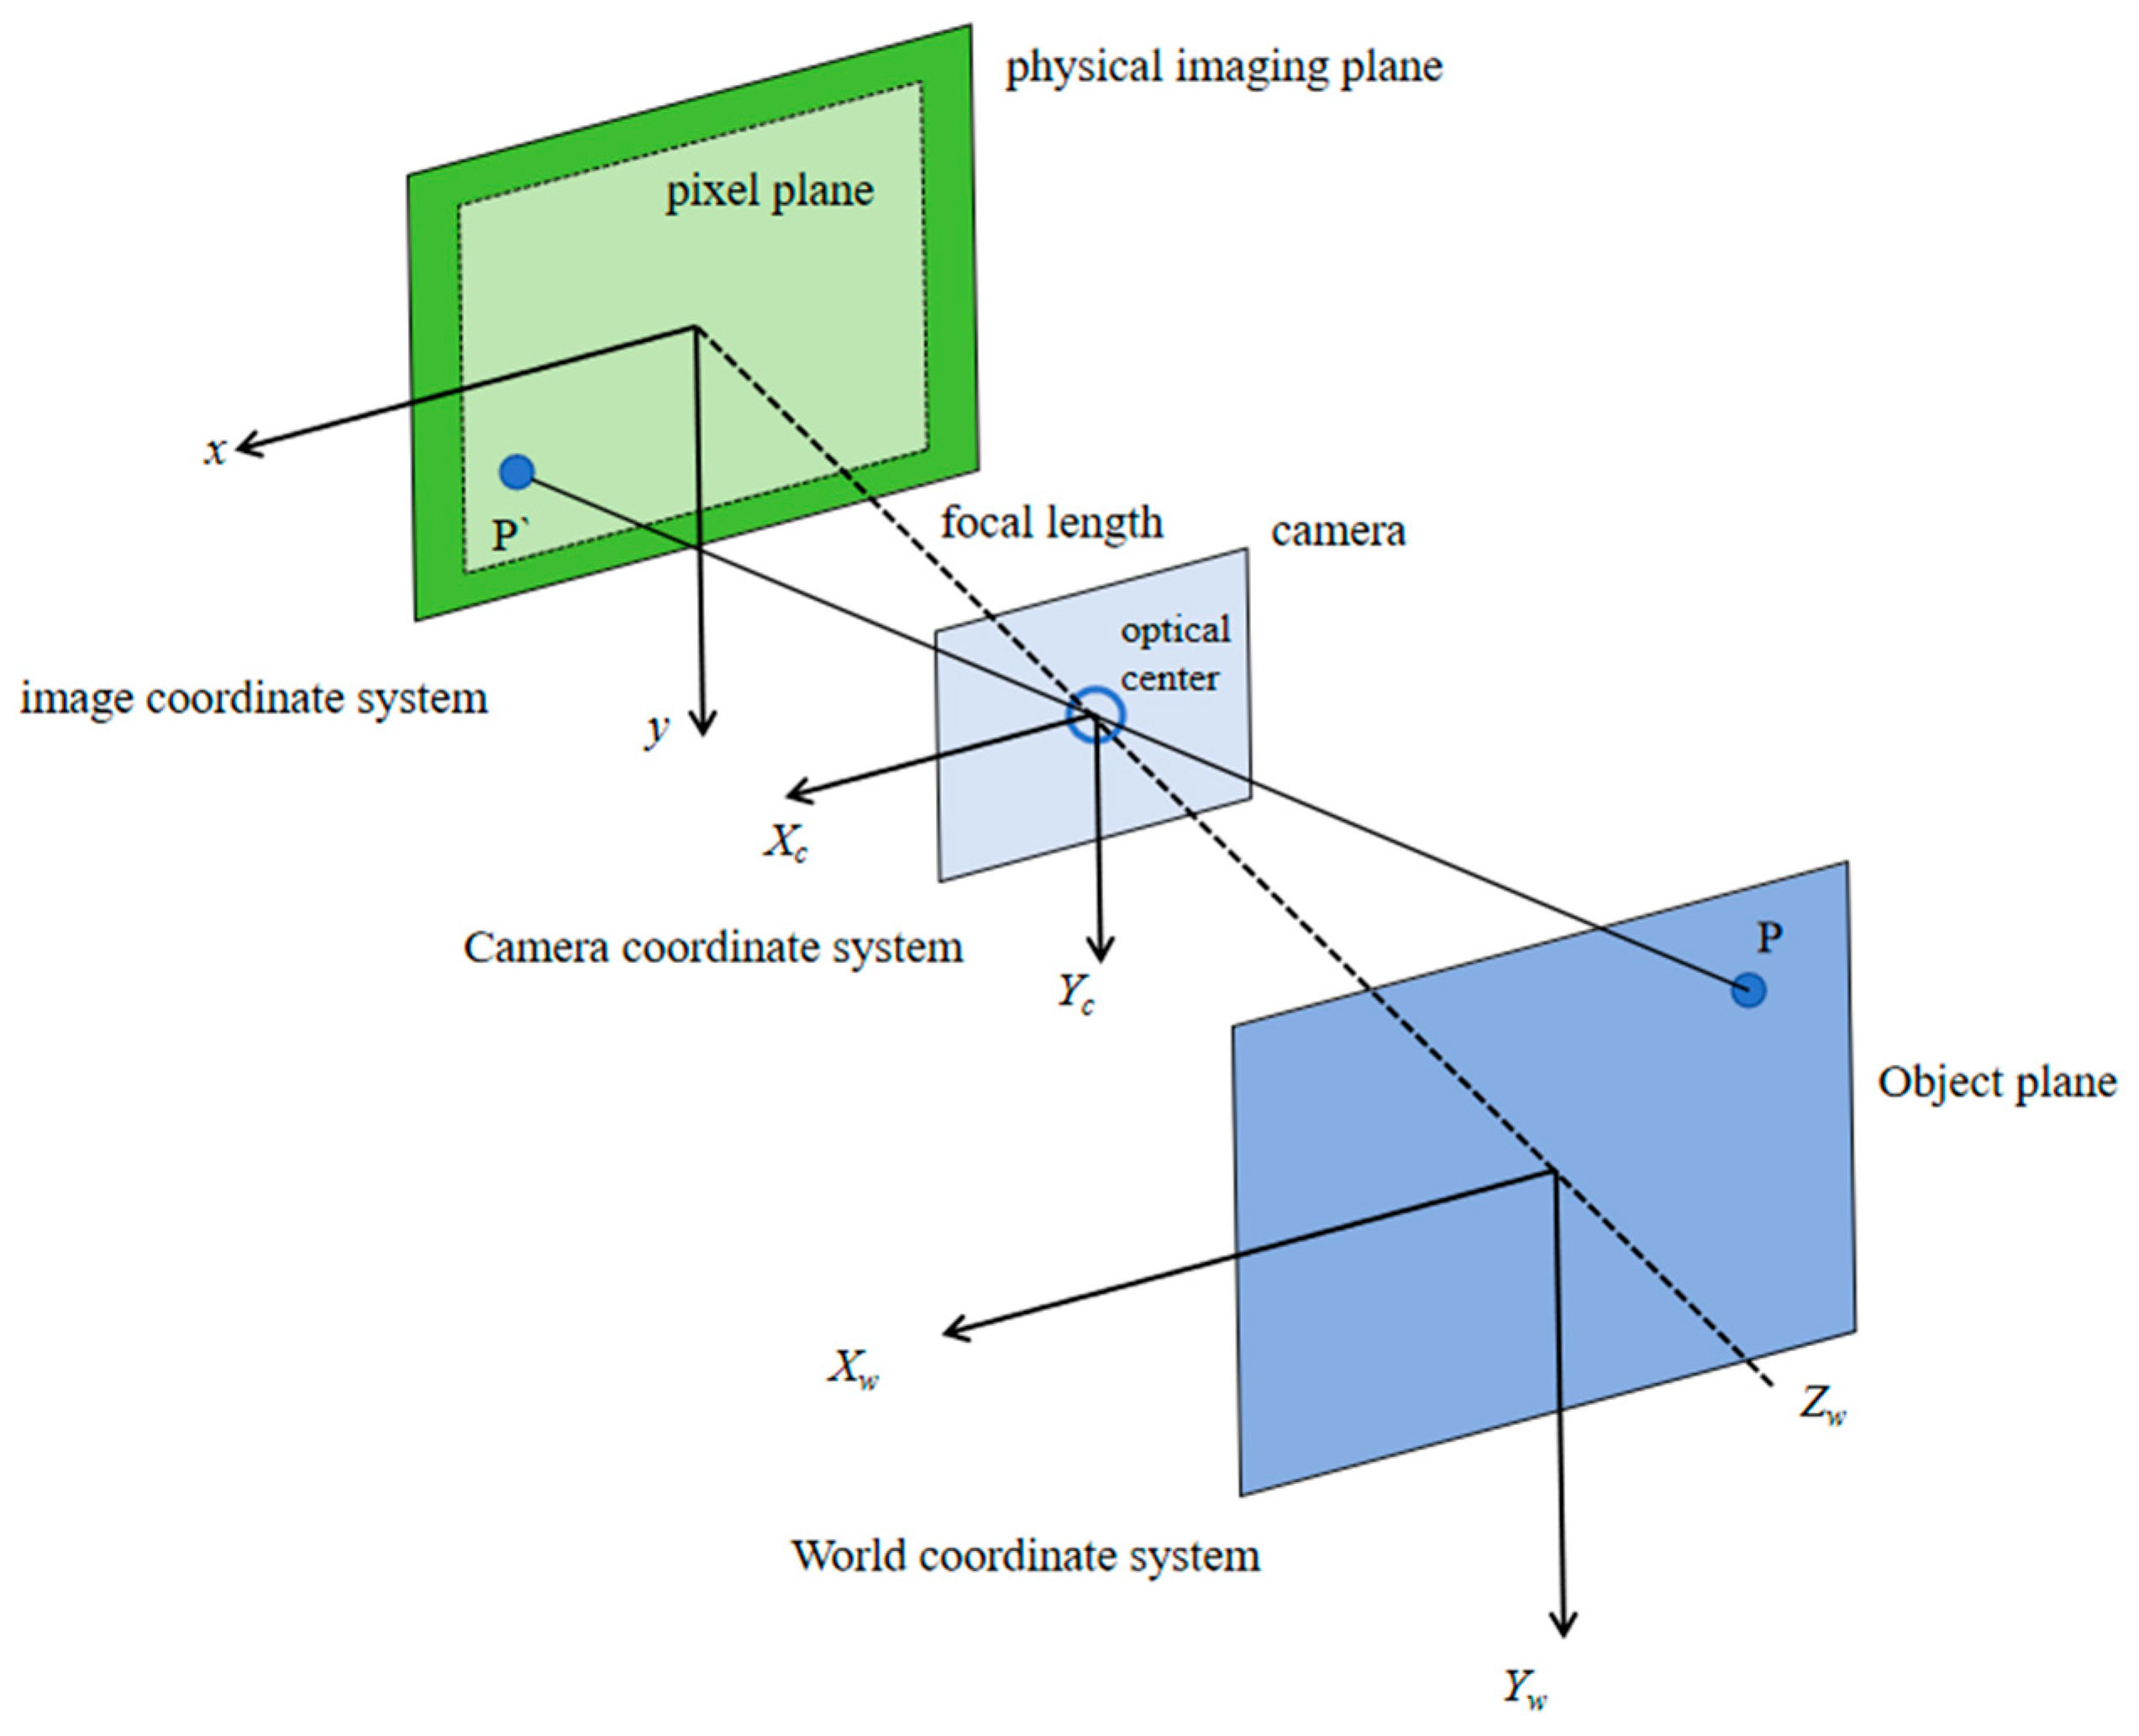
2.2. Template Matching Method

The template matching method is used to find parts in an image or data that match a given template. This method searches for the most similar match by comparing the template with various parts of the image. The template matching method has high efficiency, a flexible application range, good matching accuracy, and robustness. It can be easily integrated into existing computer vision systems and optimized according to specific needs for complex matching tasks.
The basic implementation steps of the template matching methodare shown in Figure 2. Firstly, an image containing the target is captured by a camera, and an area with the monitored target within the image is designated as the template, from which the center pixel coordinates of the template are obtained. Subsequently, the ratio between the actual distance Dk between the target T0k and a calibrated reference point R0 and the pixel distance pk is calculated to derive a scale factor r, which serves as the calibration parameter for all subsequent images captured by the current camera. Then, the preset template from the first image is searched within a designated region of interest (ROI) in subsequent images captured by the camera, and a template matching operation is performed. During the search and matching process of the template, based on image correlation operations, each template matching yields a normalized correlation coefficient. When this normalized correlation coefficient reaches its maximum value, the preset template achieves the best match in the current image, thereby determining the center pixel coordinates of the template containing the monitored target within the image. By calculating the difference between the center pixel value of the matched image area and the center pixel value of the preset template, the pixel coordinate change of the target point can be obtained, which is represented as (xtk-x0k, ytk-y0k) in Figure 2. Finally, the scale factor r obtained from calibration is multiplied by the difference in pixel coordinate changes to obtain the actual displacements of each target point in both horizontal and vertical directions.
When assessing the similarity, six different algorithms [37] can be employed: squared difference matching method, the normalized squared difference matching method, the cross-correlation-based method, the normalized cross-correlation-based method, the correlation coefficient matching method, and the normalized correlation coefficient matching method.
The formula for the method of matching by squared difference is as follows:
R x , y = x , y ( T x , y I ( x + x , y + y ) ) 2
where T is the template image, and I is the matching image; at the position (x, y) of the matching image, the recognition area is delineated by moving right x′ and down y′. The matching is performed by calculating the squared difference between the template and the image area, with the best match value being 0. The worse the match, the larger the match value.
The formula for the normalized squared difference matching method is as follows:
R x , y = x , y ( T x , y I ( x + x , y + y ) ) 2 x , y T ( x , y ) 2 · x , y I ( x + x , y + y ) 2
where R(x, y) represents the degree of normalized squared difference matching between the region centered at (x, y) in the original image and the template. The denominator part normalizes the pixel values of the original image region and the template image, ensuring that the matching result is not affected by the brightness and contrast of the images. This method measures the similarity between the original image and the template image by calculating the normalized squared difference. The best match result is 0, indicating a perfect match between the two images. The worse the match, the larger the match value, but it will not exceed 1.
The formula for the cross-correlation-based method is as follows:
R x , y = x , y ( T x , y · I ( x + x , y + y ) )
where R(x, y) represents the cross-correlation between the region centered at (x, y) in the original image and the template. x′ and y′ traverse all pixel coordinates of the template image. T(x′, y′) denotes the pixel value of the template image at the position (x′, y′), and I(x + x′, y + y′) denotes the pixel value of the original image at the position (x + x′, y + y′). This method measures the similarity between the template and the image region by calculating their inner product. A larger value indicates a better match, while a smaller value indicates a poorer match. The best match position is where the value is the greatest.
The formula for the normalized cross-correlation-based method can be expressed as follows:
R x , y = x , y ( T x , y · I ( x + x , y + y ) ) x , y T ( x , y ) 2 · x , y I ( x + x , y + y ) 2
where R(x, y) represents the normalized cross-correlation between the region centered at (x, y) in the original image and the template. The denominator part normalizes the pixel values of the template image and the original image region. This method measures the similarity between the template and the image by calculating the normalized cross-correlation. The best match result is 1, indicating a perfect match between the two images. The worse the match, the smaller the match value, but it will not be less than 0.
The formula for the correlation coefficient matching method is as follows:
R x , y = x , y ( T x , y · I ( x + x , y + y ) )
T x , y = T x , y 1 / ( w · h ) · x , y T ( x + x , y + y )
I x + x , y + y = I x + x , y + y 1 / w · h · x , y I x + x , y + y
where this method measures the similarity between the original image and the template by calculating their correlation coefficient. A larger value indicates a better match, while a smaller value indicates a poorer match. The best match position is where the value is the greatest.
The formula for the normalized correlation coefficient matching method is as follows:
R x , y = x , y ( T x , y · I ( x + x , y + y ) ) x , y T ( x , y ) 2 · x , y I ( x + x , y + y ) 2
where this method is the normalized version of the correlation coefficient matching method. It utilizes the correlation between the original image and its mean difference, as well as the template and its mean difference for matching, and normalizes the result. The similarity between the original image and the template is measured by calculating the normalized correlation coefficient. The best match result is 1, indicating a perfect match. The worse the match, the smaller the match value, but it will not be less than −1.
The method proposed in this paper adopts the normalized correlation coefficient matching method as the algorithm to assess the similarity between the original image and the template image.

3. Indoor Experimental Verification

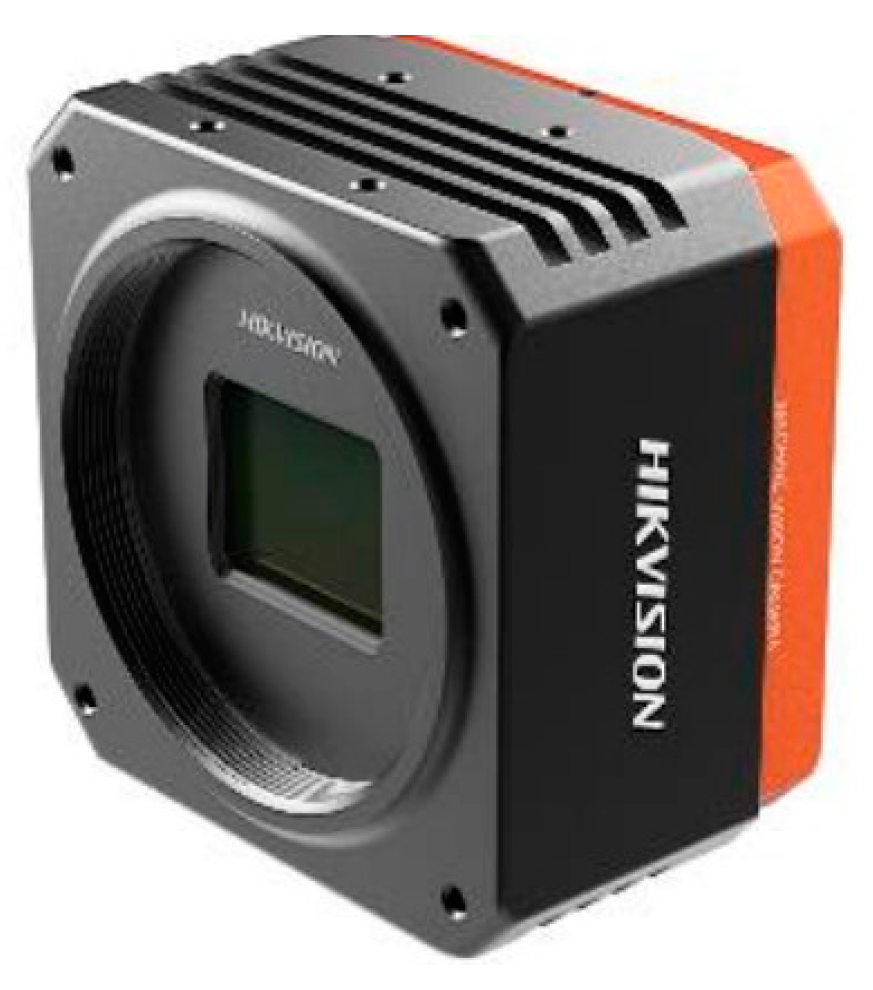
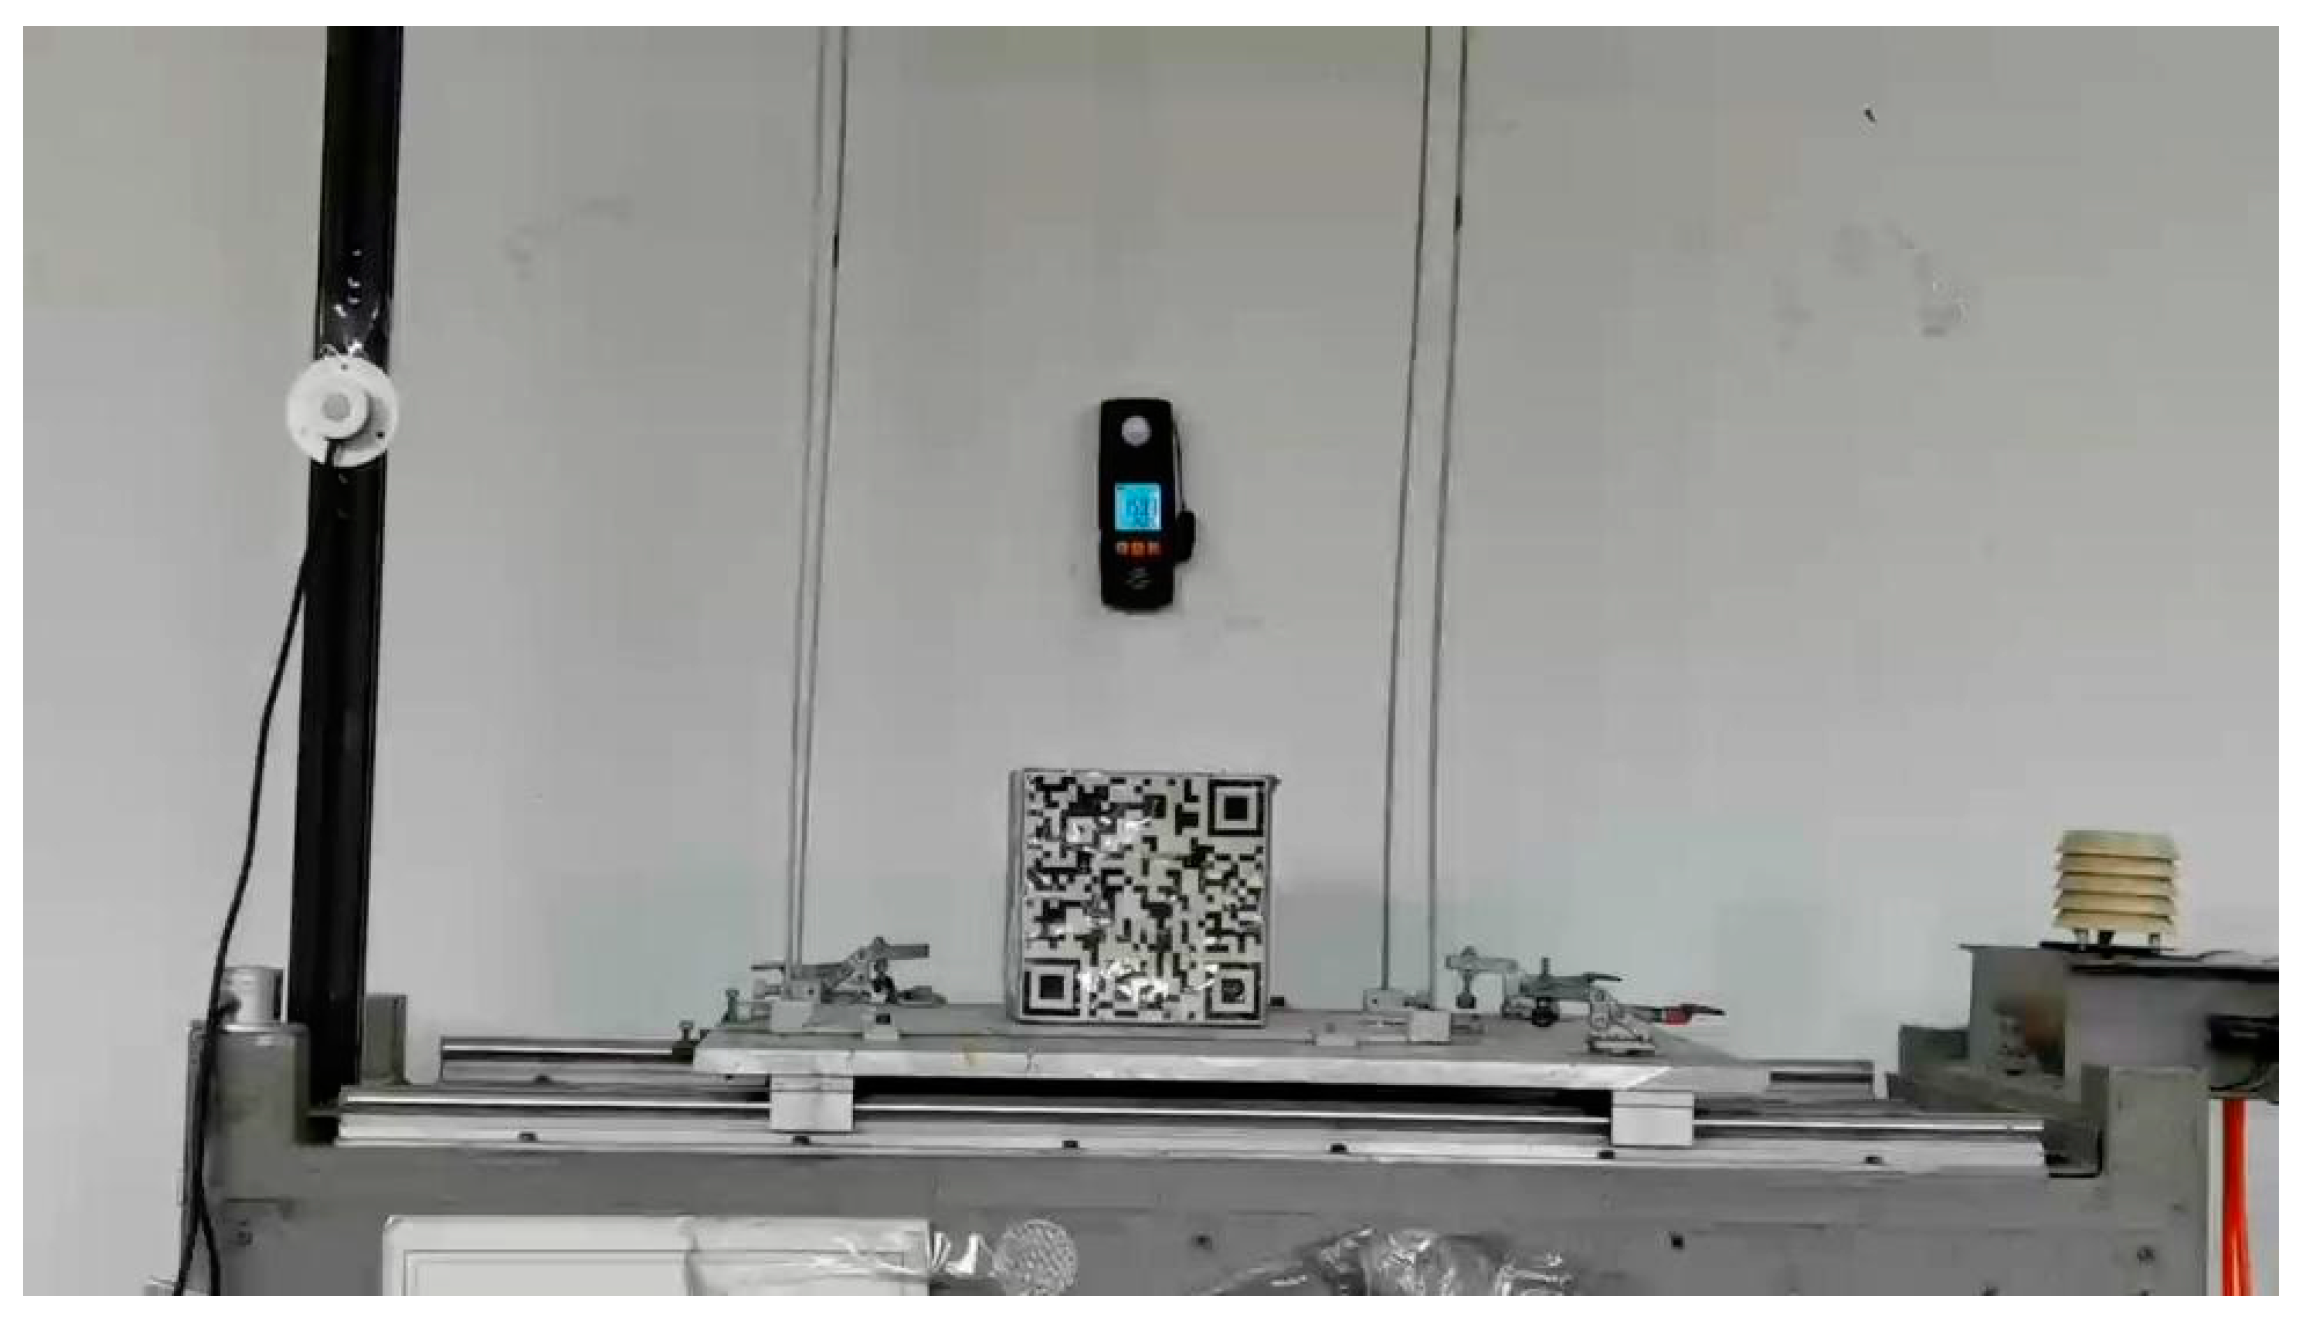
3.1. Hardware System and Test Conditions

The experimental verification utilizes industrial cameras, vision controllers, and other hardware devices. Specifically, the industrial cameras employ the Hikvision black-and-white camera MV-CH080-60GM and the color camera MV-CH080-60GC, with their appearance illustrated in Figure 3. The manufacturer of the industrial cameras is Hikvision Digital Technology Co., Ltd., which is located in Hangzhou, Zhejiang Province, China.
The visual controller employs Hikvision’s VB 2000 series, and its appearance is illustrated in Figure 4. The visual controller is likewise manufactured by Hikvision Digital Technology Co., Ltd. (Hangzhou, China).
The vibration table used for indoor experimental verification is a frequency-modulated vibration table that is driven by a motor to rotate an eccentric wheel, thereby causing the platform to vibrate. The test subject is fixed on the tabletop and vibrates along with it to simulate vibration conditions in real environments. The amplitude of this vibration table is fixed at 11.5 mm, while the vibration frequency can be adjusted by a frequency converter within a range of 0.5 Hz to 15 Hz. In this experiment, the frequency is set at 0.88 Hz, with the vibration direction being horizontal. The vibration table is shown in Figure 5.

3.2. Experimental Research on Vibration Monitoring

The industrial camera is positioned directly in front of the vibration table to capture images, ensuring that the monitoring target and the camera are on the same horizontal plane. The horizontal direction of the presented image corresponds to the direction of the target movement. Figure 6 illustrates the imaging principle of the camera [38]. Light emitted or reflected from an object passes through a pinhole into the dark chamber inside the camera. Due to the limitation of the small hole, only the light rays from a specific point on the object can pass through the pinhole and form a corresponding light spot on the photosensitive medium inside the dark chamber. As these light spots accumulate continuously, they eventually record a complete inverted real image of the object on the photosensitive medium. To obtain the true displacement of the target, it is necessary to perform mutual conversion between the displacement in the image coordinate system and that in the world coordinate system. Figure 7 demonstrates the principle of converting coordinates from the world coordinate system to the image coordinate system [39,40,41]. Initially, the coordinates of points are transformed from the world coordinate system to the camera coordinate system through rigid body transformations, which include rotation and translation. Subsequently, through perspective projection, the coordinates are converted from the camera coordinate system to the physical image coordinate system. Finally, through translation and scaling, the coordinates are transformed into the image pixel coordinate system. For ease of calculation, the video resolution used in indoor experiments is 1920 × 1080, with a frame rate of 30 fps. Figure 8 displays the target object and the region of interest (ROI) selected for template matching. Among them, the preset template has a resolution of 144 × 144.
The calculation results are shown in Figure 9.
The horizontal axis of the curve represents time, while the vertical axis represents horizontal displacement values. As can be seen from the graph, the vibration approximates a sine wave, which is consistent with the data input by the vibration table. The template matching calculation yields an amplitude of 11.495 mm and a period of 1.13 s. After undergoing Fourier Transform, the result is shown in Figure 10.
The horizontal axis of the curve represents frequency, and the vertical axis represents the displacement amplitude. The first-order frequency calculated by template matching is 0.882 Hz, which is approximately consistent with the input frequency of the vibration table.
The amplitude error of the template matching method is within 0.5%, and the frequency error is within 0.2%. Due to the analysis based on whole pixels, the template matching method exhibits a plateau-like increase and decrease in displacement monitoring, especially pronounced in the peak regions, which is the primary source of error in amplitude monitoring. Additionally, the displacement values calculated by template matching are derived from the displacement of the target’s central point position, making them susceptible to errors caused by incorrect selection of the target’s central point.
To evaluate the impact of template size on the accuracy of this method, this paper varies the size of the preset template without altering its central position. Specifically, templates with resolutions of 36 × 36, 54 × 54, 72 × 72, and 108 × 108 are used for tracking, as illustrated in Figure 11. Additionally, the selection of the region of interest (ROI) remains unchanged.
The calculation results are shown in Figure 12.
As observed in the figure, using a template with a resolution of 36 × 36 yields the amplitude of 11.525 mm, a period of 1.14 s, and an amplitude error of 0.22%. With a template resolution of 54 × 54, the amplitude is calculated to be 11.465 mm, the period is 1.12 s, and the amplitude error is 0.3%. Applying a template of 72 × 72 resolution results in an amplitude of 11.475 mm, a period of 1.13 s, and an amplitude error of 0.22%. Using a template with a resolution of 108 × 108, the amplitude is 11.495 mm, the period is 1.12 s, and the amplitude error is 0.04%. These four sets of data align closely with the input data from the shaking table. The Fourier Transforms of the four sets of time–history information are depicted in Figure 13.
As shown in the figure, the first-order frequency calculated using the 36 × 36 template is 0.879 Hz, with a frequency error of 0.11%. The first-order frequency calculated using the 54 × 54 template is 0.881 Hz, also with a frequency error of 0.11%. The first-order frequency calculated using the 72 × 72 template is 0.881Hz, again with a frequency error of 0.11%. The first-order frequency calculated using the 108 × 108 template is 0.879 Hz, with a frequency error of 0.11% as well. These frequencies are highly consistent with the input frequency of 0.88 Hz from the shaking table. When using four templates with different resolutions, the frequency errors obtained by the template matching method are all within 0.2%, and the amplitude errors are all within 0.5%. Therefore, it can be concluded that the accuracy of the method proposed in this paper is relatively high when the selected template size ranges from 36 × 36 to 108 × 108.
In the field of computer vision monitoring, besides the method proposed in this paper, there are other relatively mature methods. Yue et al. [37] utilized the mean of normal vector inner products combined with the ISS algorithm to extract feature points and proposed a point pair feature descriptor to complete coarse registration. Finally, precise registration was achieved through the ICP algorithm. This algorithm exhibits high registration accuracy. Registration methods based on feature point extraction and matching do not require the point cloud to have a good initial position and demonstrate strong robustness. Wu [42] derived the theoretical expression for the image correlation transfer rule based on the normalized cross-correlation coefficient, analyzed the distribution patterns of the upper and lower bounds of local image correlation, proposed a downsampling template matching algorithm to enhance the computational speed of target tracking, and introduced a subpixel displacement refinement method through Gaussian surface fitting of the correlation coefficient to improve the accuracy of the target tracking algorithm. To evaluate the accuracy of the method proposed in this paper, under identical indoor conditions, we also employed the cross-correlation-based method and the feature-based template matching method to monitor the shaking table.
This cross-correlation-based method assesses the similarity between the template and the image region by calculating their inner product. A larger value indicates a better match, while a smaller value indicates a poorer match. The best match position is where the value is the greatest. The feature-based template matching method achieves the localization of the template image within the original image by extracting and analyzing features from the images. Firstly, the ORB algorithm is used to detect key points in the template image and generate binary feature vectors to describe the regions around the key points. Then, the ORB algorithm is applied again to detect key points in the original image and generate binary feature vectors to describe the regions around the key points. Next, the feature vectors of the template image and the target image are matched using the Hamming distance as the metric to find similar key point pairs. The RANSAC algorithm is employed to remove incorrect key point pairs and filter out the best key point pairs. From the coordinates of the best key point pairs, a homography matrix is derived, which describes the perspective transformation relationship between the template image and the original image as a 3 × 3 matrix. The four corner points of the template image are then transformed using the homography matrix to obtain the coordinates of the corner points in the original image. Based on this, the center coordinates of the target in the original image can be determined.
The cross-correlation-based method and the feature-based template matching method were used for comparative study, and the results are shown in Figure 14. The monitoring results of the three methods are generally quite close. However, the maximum amplitude monitored using the cross-correlation-based method is 12.143 mm, with a maximum amplitude error of 5.59%. The maximum amplitude monitored using the feature-based template matching method is 13.155 mm, with a maximum amplitude error of 14.39%. The maximum amplitude errors of both methods are greater than that of the method proposed in this paper.
The monitoring results of the three methods are subjected to Fourier Transform, as shown in Figure 15.
Among them, the first-order frequency calculated using the feature-based template matching method is 0.864 Hz, with a frequency error of 1.82%. The first-order frequency calculated using the cross-correlation-based method is 0.871 Hz, with a frequency error of 1.02%. The frequency errors of both methods are greater than 0.2%. This is because the cross-correlation-based method does not incorporate normalization operation. Thus, when the lighting in the original image is uneven, areas with high brightness may be mistakenly identified as the best matching locations, making the matching results susceptible to interference. The feature-based template matching method requires the detection of key points, and the presence of reflective regions in the template image selected for the experiment may disrupt the optimal matching. Additionally, these two methods are pixel-level target displacement identification methods which accuracy is limited by the resolution of the image, with the smallest unit being one pixel, making it impossible to capture changes smaller than a single pixel. The method proposed in this paper incorporates normalization, reducing the impact of uneven lighting and enhancing the accuracy and robustness of the method. Moreover, this method is a sub-pixel target displacement identification method. Sub-pixel target displacement identification methods improve measurement accuracy to a fractional level of a pixel through interpolation, fitting, or optimization algorithms, significantly enhancing the precision of the measurement results and enabling the identification and measurement of tiny displacements, deformations, or feature changes.
In summary, it can be seen that the frequency calculation error of the method proposed in this paper is relatively small, within 0.2%, indicating its high accuracy. When using templates of different sizes, the displacement amplitude, period, and vibration frequency measured by this method show little variation, which proves that this method has great adaptability in template selection. Furthermore, under the same conditions, the accuracy of the monitoring results obtained by this method is superior to that of two other commonly used methods. Therefore, this method can be employed as an effective means for monitoring bridge vibrations.

4. Field Bridge Vibration Monitoring

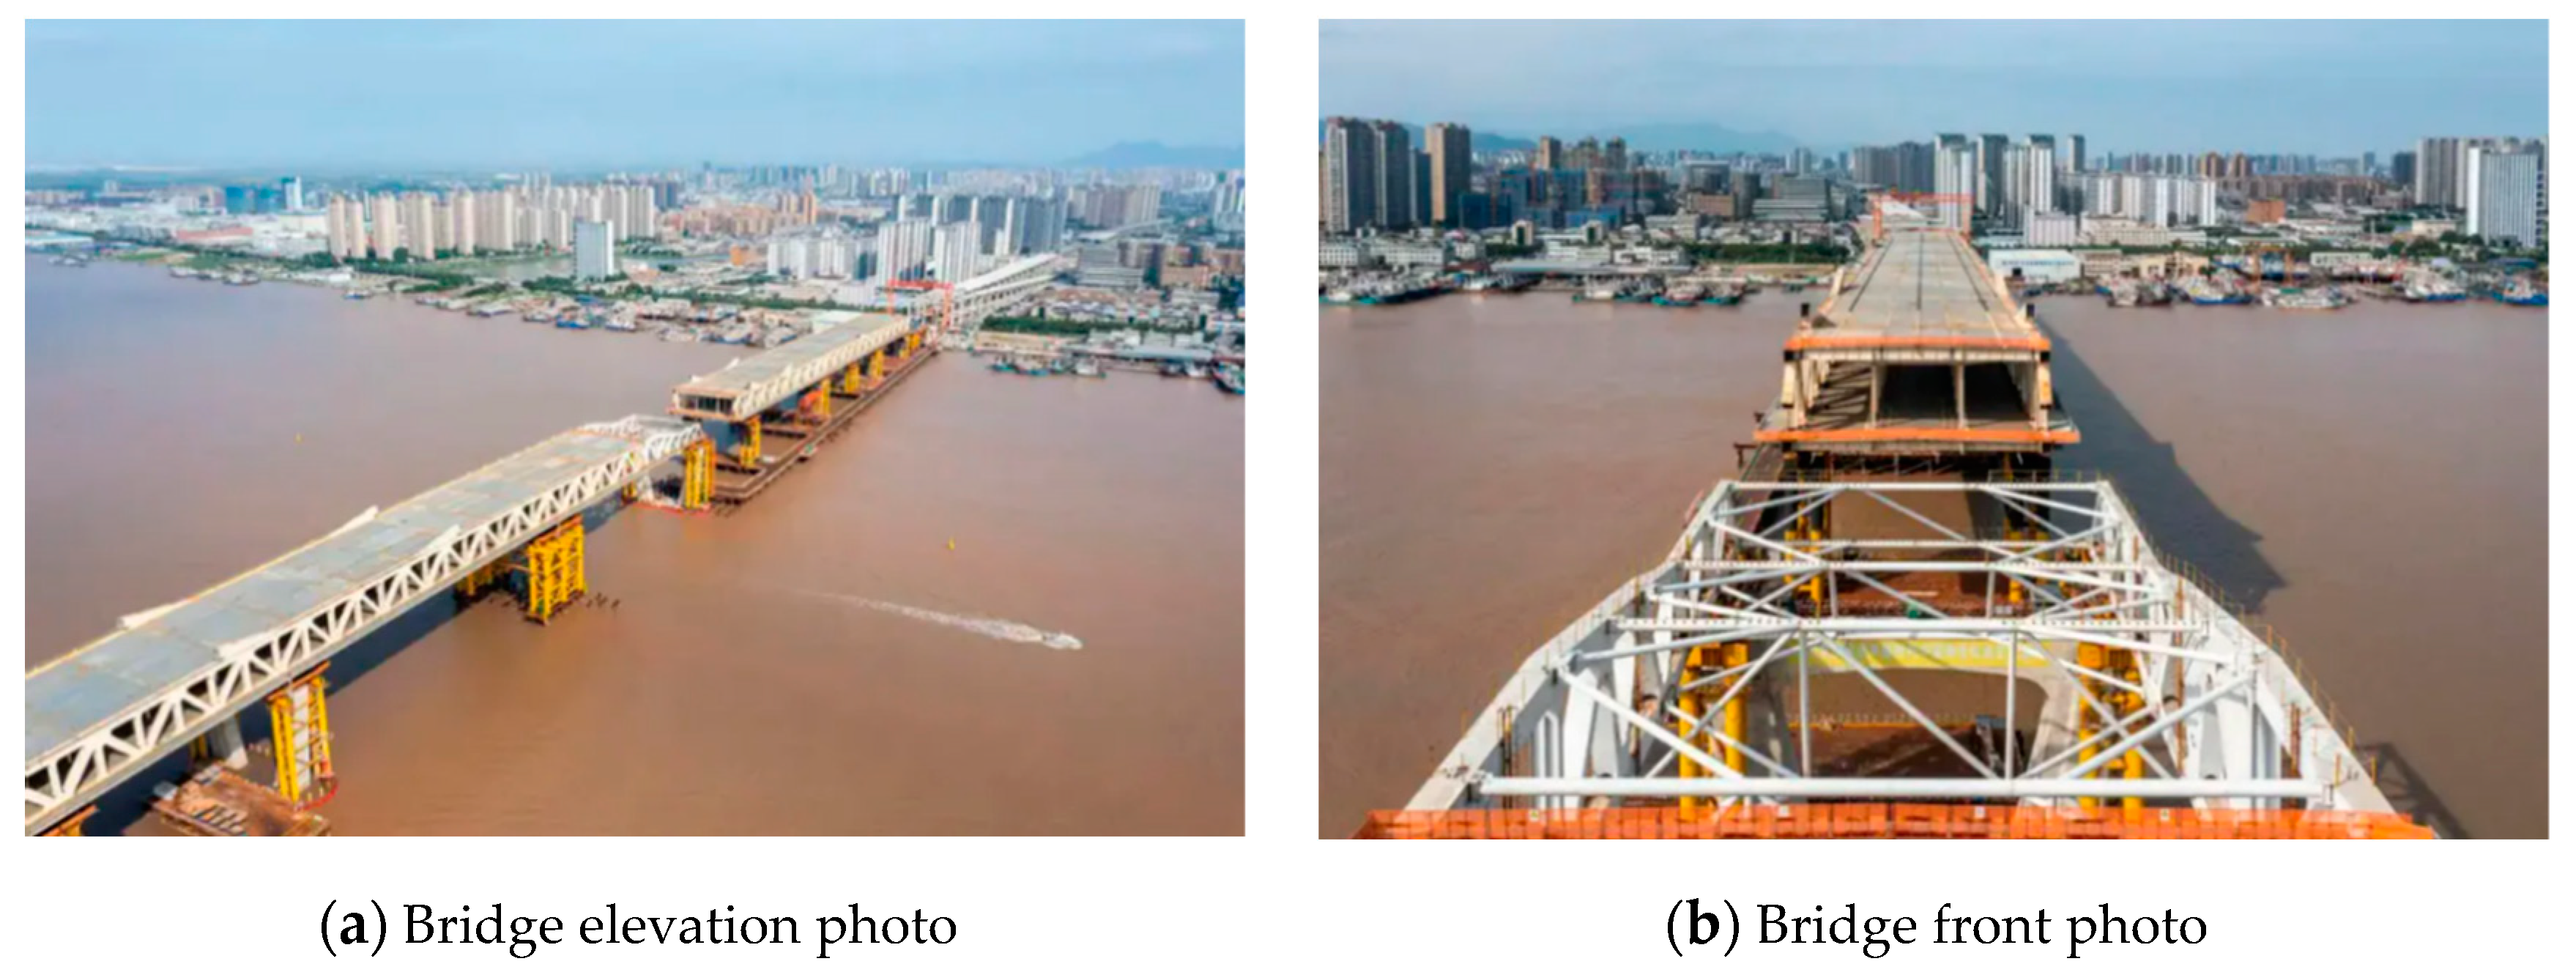
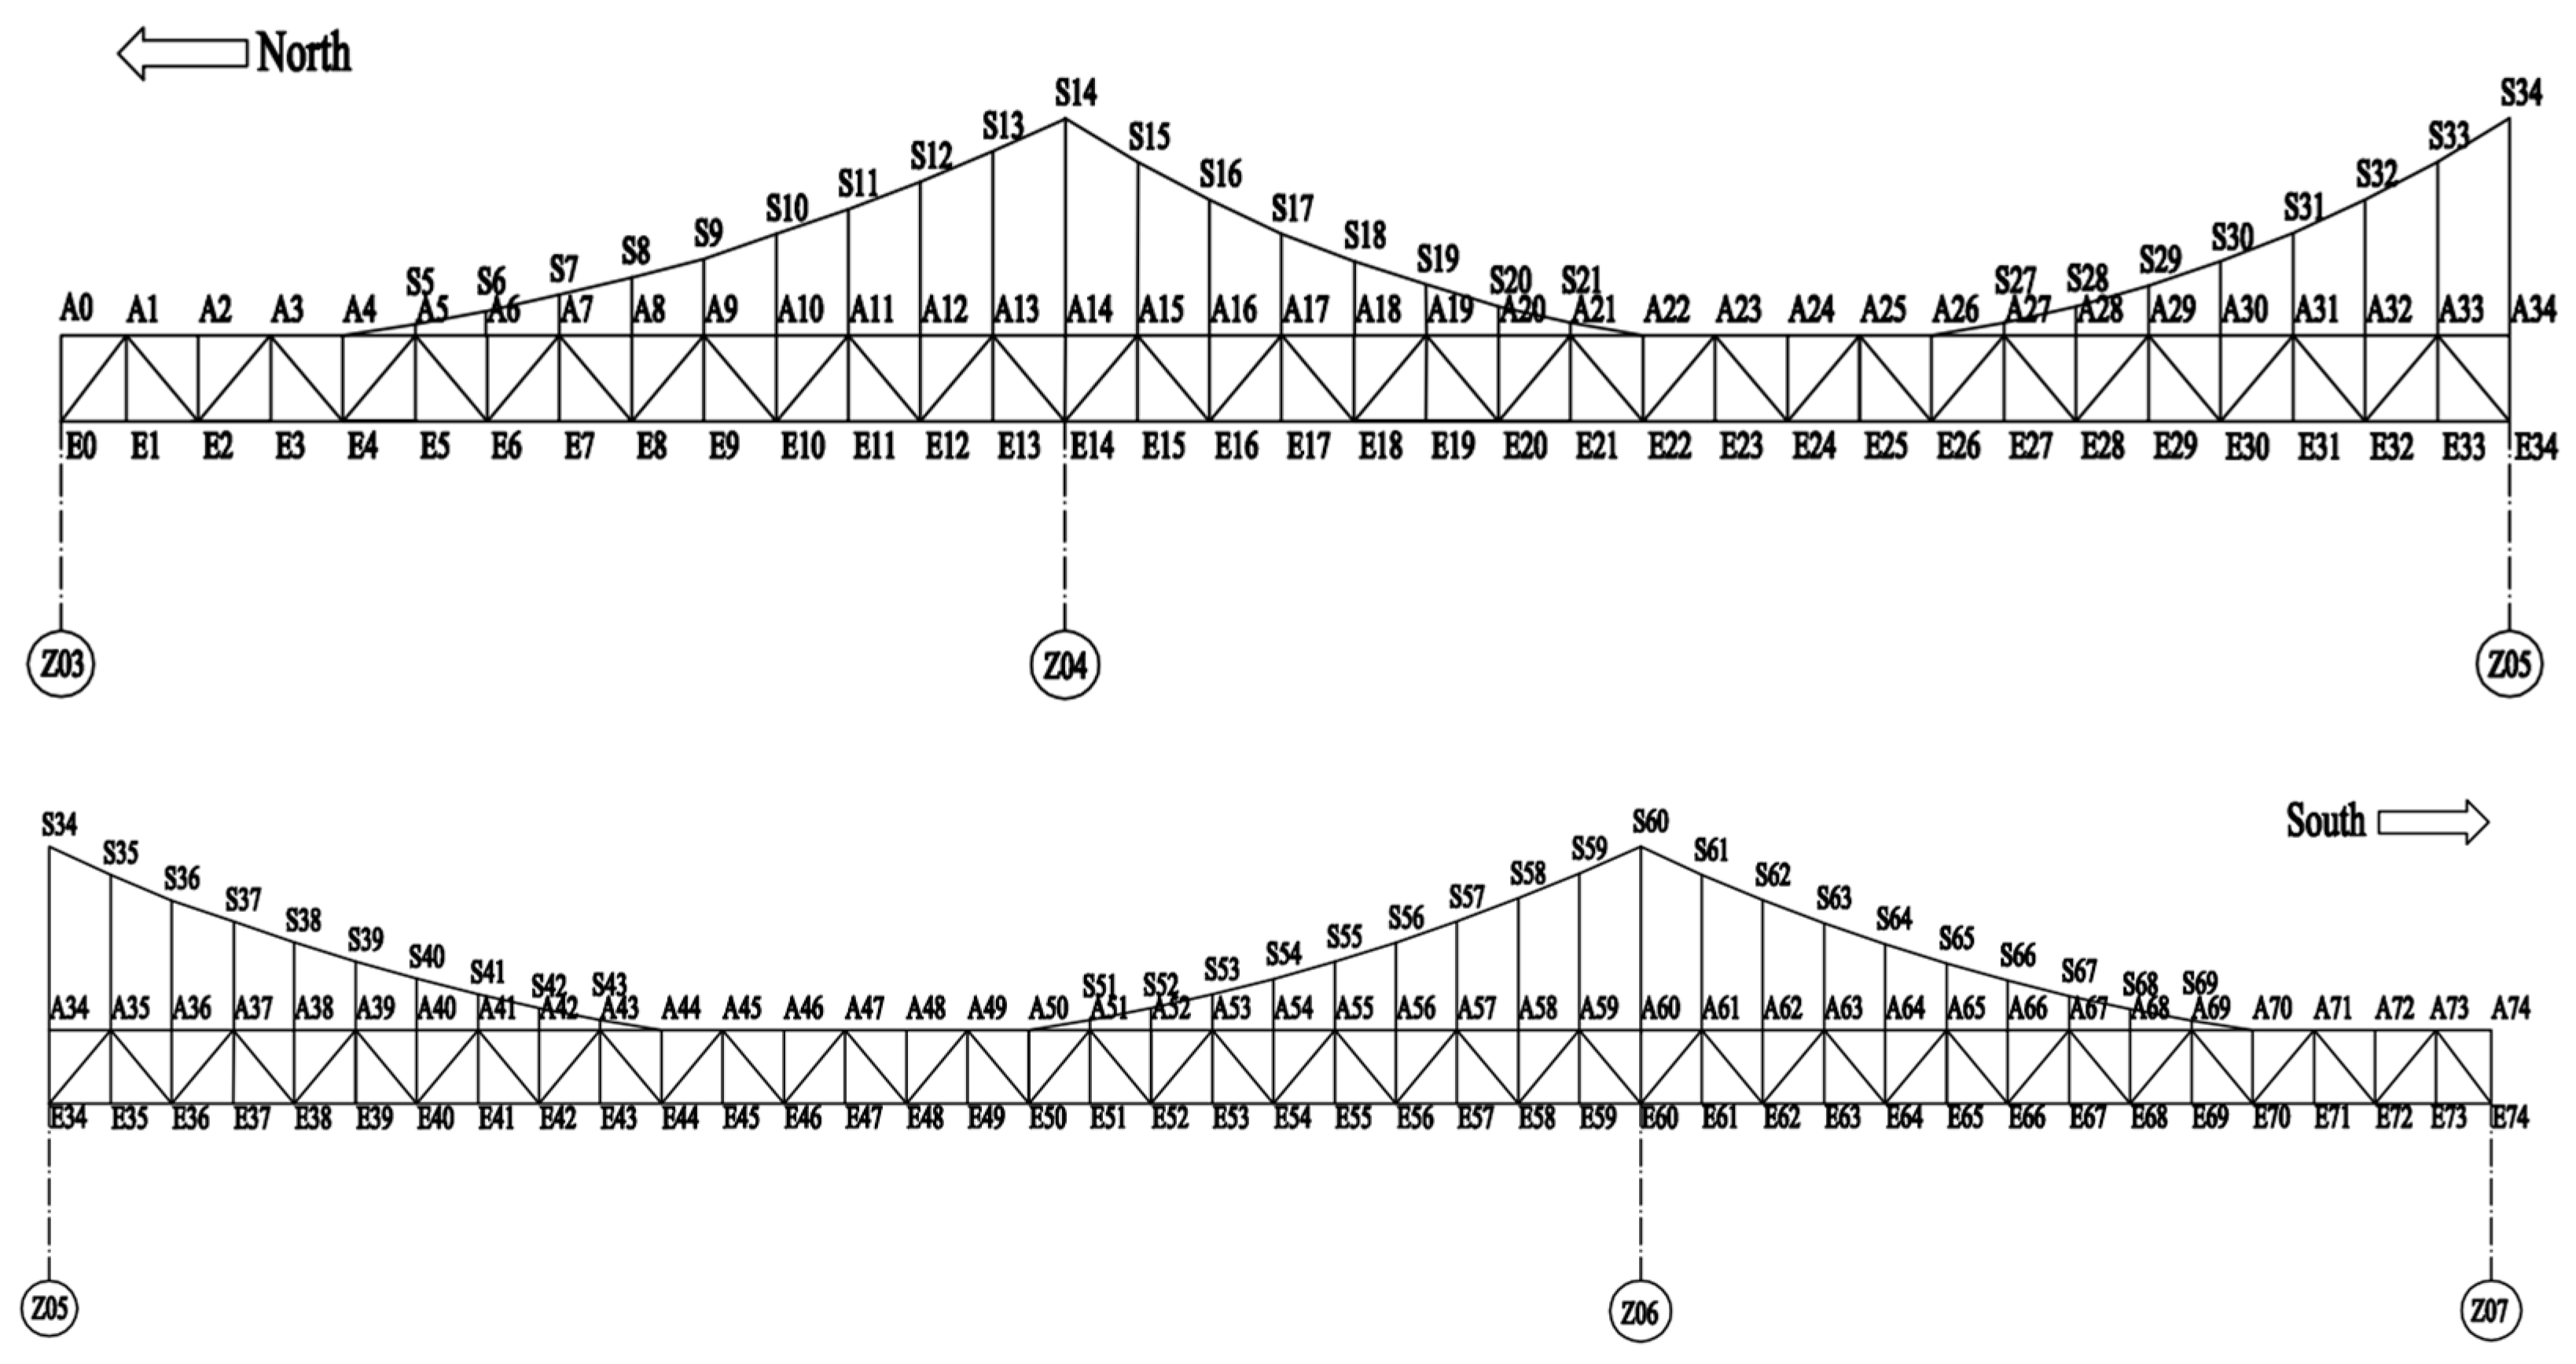
4.1. Introduction to Yongning Bridge Background

Yongning Bridge is a jointly constructed bridge spanning the Feiyun River, connecting the first phase of the Wenzhou City Railway S3 Line and the southern section of Wenrui Avenue Expressway. The bridge features a double-deck layout, with the upper deck serving as an urban expressway designed for two-way six-lane traffic at a speed of 80 km/h. The middle of the lower deck accommodates the S3 Line of the city’s railway, designed for a speed of 140 km/h, while the two sides are designated as Class I highways with a design speed of 60km/h. Upon completion and opening, the S3 Line trains will traverse the lower deck of the bridge simultaneously with vehicles traveling on both sides and the upper deck. The bridge is illustrated in Figure 16.

4.2. Vibration Monitoring of the Incremental Launching Construction of Yongning Bridge

The steel truss girders of the second, third, and fourth spans of the main bridge of Yongning Bridge were constructed using the incremental launching method, which involved “synchronous pushing from both banks, assembly section by section, and incremental launching into position”, ultimately achieving closure at the A29–A30 segment joint. The incremental launching of steel truss girders employs a multi-point traction and dragging process. The launching system comprises four parts: a horizontal traction system, a jacking system, a sliding system, and a deviation correction system. After assembling the steel truss girder segments, the jacking system activated to lift the girders shims is installed above the sliding shoes, which then support the steel truss girders. The horizontal traction system then pushes the girders forward by one stroke, with real-time deviation correction provided by the deviation correction system throughout the process. During the launching operation, the temporary piers mainly undergo vertical displacement with negligible horizontal displacement. Specifically, the length of the main girder pushed from the north bank was 342.75 m, while that from the south bank was 536.25 m. The schematic diagram of the steel beam joints is shown in Figure 17. A total of 26 temporary structures were set up for the incremental launching construction of the main bridge, including three temporary piers on each bank, as illustrated in Figure 18. After the completion of temporary pier construction, with the incremental launching of the main girder, the pier loads and horizontal forces continually increase, which may lead to excessive settlement, uneven force distribution, and other safety hazards on the temporary piers, affecting the accuracy of the incremental launching closure. To ensure the safety of personnel and property, it is particularly important to conduct safety monitoring and dynamic assessment of the health status of temporary piers during the incremental launching process. For the incremental launching process of the steel truss girder of Yongning Bridge, real-time monitoring of displacement and settlement of temporary structures was conducted to evaluate the structural safety status and achieve safety risk control, thereby enabling precise control over the girder pushing process.
During the entire incremental launching construction process of Temporary Pier L03 of Yongning Bridge in June 2024, the method proposed in this paper was adopted for continuous displacement monitoring onsite. The visual monitoring area and the layout of the monitoring equipment are shown in Figure 19. The monitoring equipment used was an industrial camera equipped with a CMOS sensor featuring a resolution of 1920 × 1080, where the diagonal length of the sensor is 1/1.8 inches, and it offers a measurement accuracy of 1 mm within a distance of 100 m. The industrial camera was mounted on a steel bracket, which was securely fastened to the cap beam of the permanent pier using bolts. In the monitoring area, two targets were installed, each measuring 40 cm × 40 cm in size. Based on the conclusion drawn during the experimental phase that the template had a size between 36 × 36 and 108 × 108 and achieved better monitoring results, considering the resolution of the targets in the camera, the template size was set to 54 × 54. The industrial camera was connected to the network, allowing for real-time upload of the monitoring data. When excessive displacement of the temporary pier was detected, it could trigger an alarm in a timely manner, thereby assessing the structural safety status of the temporary pier and achieving safety risk management and control. Furthermore, due to the dim lighting at night and the proximity of the construction site to the city center, no construction activities took place during the night. Therefore, the industrial camera was turned off at night, and no displacement monitoring of the temporary pier was conducted.
During June 2024, Yongning Bridge underwent multiple incremental launching operations. Figure 20 presents the vertical displacement–time history curves for two piles of the L03 temporary pier during two construction operations. In Figure 20a, when the jacking system was activated, the settlement of the left pile of the temporary pier decreased by 0.5 mm. During the horizontal traction process, the settlement remained almost constant. After the launching operation was completed and the beams were lowered, the settlement increased by 0.6 mm. In Figure 20b, upon activation of the jacking system, the settlement of the right pile of the temporary pier decreased by 0.5 mm. Throughout the horizontal traction, the settlement remained nearly unchanged. Upon completion of the launching and lowering of the beams, the settlement increased by 0.7 mm. In Figure 20c, when the jacking system was initiated, the settlement of the left pile of the temporary pier decreased by 0.35 mm. During horizontal traction, the settlement remained virtually constant. After the launching and beam lowering, the settlement increased by 0.45 mm. In Figure 20d, upon activation of the jacking system, the settlement of the right pile of the temporary pier decreased by 0.4 mm. During the horizontal traction, the settlement hardly changed. After the launching was finished and the beams were lowered, the settlement increased by 0.55 mm. The displacement–time history curves for these two launching operations exhibited trends consistent with actual construction conditions. When the jacking system was activated, the weight of the steel truss girder was transferred to the structure supporting the jacking system, reducing the load on the temporary pier and thus decreasing its settlement. During horizontal traction, the settlement remained almost constant. Upon completion of the launching and subsequent beam lowering, the increased load on the temporary pier led to an increase in settlement. Therefore, the method proposed in this paper can be effectively applied to practical engineering scenarios.

5. Conclusions and Prospects

This paper proposes a vibration monitoring method for bridge structures based on computer vision. Initially, indoor experiments were conducted to verify the feasibility, accuracy, and adaptability of the method. Subsequently, it was applied to Yongning Bridge for vibration monitoring. The main conclusions are as follows:
(i) The amplitude error of template matching is within 0.5%. Specifically, the frequency calculated by the template matching method matches the actual value with a degree of 99.8%. Meanwhile, the calculated frequency error is within 0.2%, making it effective for vibration monitoring. When using different template sizes, the displacement amplitude, period, and vibration frequency measured by this method show little variation, which proves this method has satisfactory performance. Furthermore, the accuracy of the monitoring results obtained by this method is compared with the other two algorithms. While most of the monitoring results are close, the feature-based method has the largest error of 5.59% and that of the cross-correlation-based method is 14.39%. Thus, the proposed method is better, thanks to the sub-pixel strategy. Therefore, this method can be employed as an effective means for monitoring bridge vibration.
(ii) The method proposed in this paper is applied to the displacement monitoring of the L03 temporary pier of Yongning Bridge during the construction period. The template is 54 × 54, and the image dimensions are 1920 × 1080. The duration of each incremental launching operation is approximately 5 h. Two typical displacement–time history curves show that, when the jacking system was activated, the weight of the steel truss girder was transferred to the structure supporting the jacking system, reducing the load on the temporary pier and thus decreasing its settlement. The settlement value decreases in the range of about 0.35–0.5 mm. During horizontal traction, the settlement remained almost constant. Upon completion of the launching and subsequent beam lowering, the increased load on the temporary pier led to an increase in settlement. The settlement value increases in the range of about 0.45–0.7 mm. This provides a basis for ensuring construction safety.
The main prospect is as follows: During field monitoring, the cameras are affected by environmental factors.
(i) During field testing, variations in testing locations, durations, and subjects can cause the image acquisition device to encounter different lighting conditions. This results in changes in the information at each pixel of the images captured by the camera. During template matching, the quality of the target search may vary, potentially leading to measurement errors in the system.
(ii) In field measurement environments, the camera may not be perfectly aligned with the measurement object. When light passes through the lens, refraction can occur, causing image distortion. Even with calibration, this distortion cannot be entirely corrected. As a result, when the target moves, mismatches may occur, introducing measurement errors.
(iii) During field measurements, adverse weather conditions such as rain, snow, or fog can cause occlusion issues, leading to partially or fully obscured targets in the captured images. Additionally, refraction or diffuse reflection caused by these weather conditions can distort the images, further contributing to measurement errors.
(iv) Environmental vibration during field testing may cause random vibrations in the camera itself. When the camera vibrates, the relative motion between the camera and the target is reflected in the images. While target tracking and matching might not be directly affected, the errors caused by this relative motion can accumulate in the final measurement results.
To tackle the problem of environmental vibrations causing camera movement and resulting errors, subsequent research could involve installing displacement sensors on the cameras or setting up multiple spatial reference points to quantify and mitigate such effects. To address the issues of poor lighting conditions and adverse weather, subsequent research could incorporate visible light sources as visual target points to enhance the brightness of the visual measurement points and their visibility in the environment.

Author Contributions

Conceptualization, T.J. and H.S.; methodology, H.S. and M.Z.; validation, M.Z. and X.S.; formal analysis, H.S., T.J. and J.Z.; investigation, T.J., X.C. and X.G.; resource, T.J., X.C. and X.G.; data curation, M.Z. and X.C.; writing—original draft preparation, H.S. and M.Z.; writing—review and editing, T.J. and Y.X.; visualization, T.J. and W.P.; supervision, X.C. and H.S. All authors have read and agreed to the published version of the manuscript.

Funding

The work described in this paper was jointly supported by the National Natural Science Foundation of China (No. 52308332) and the China Postdoctoral Science Foundation (Grant No. 2022M712787).

Data Availability Statement

The data that support the findings of this study are available from the corresponding author upon reasonable request.

Conflicts of Interest

Authors Hong Shi, Min Zhang, Xiufeng Shi and Jian Zhang were employed by the company Road & Bridge International Co., Ltd. Authors Yixiang Xu and Xinyi Guo were employed by the company Road & Bridge East China Engineering Co., Ltd. The remaining authors declare that the research was conducted in the absence of any commercial or financial relationships that could be construed as a potential conflict of interest.

References

  1. Niyirora, R.; Ji, W.; Masengesho, E.; Munyaneza, J.; Niyonyungu, F.; Nyirandayisabye, R. Intelligent damage diagnosis in bridges using vibration-based monitoring approaches and machine learning: A systematic review. Results Eng. 2022, 16, 100761. [Google Scholar]
  2. Koganezawa, S.; Terai, S.; Tani, H.; Lu, R.; Kawada, S. Vibration based Scour-Detection for Bridge-Piers Using a Self-Powered Magnetostrictive Vibration Sensor. IEEE Sens. Lett. 2024, 8, 6011604. [Google Scholar]
  3. Gonen, S.; Erduran, E. A Hybrid Method for Vibration-Based Bridge Damage Detection. Remote Sens. 2022, 14, 6054. [Google Scholar] [CrossRef]
  4. Kalizhanova, A.; Kunelbayev, M.; Kozbakova, A. Bridge Vibration Analysis Using Fiber-Optic Bragg Sensors with an Inclined Grid. IEEE Instrum. Meas. Mag. 2024, 27, 43–48. [Google Scholar]
  5. Guo, J.; Shen, Y.F.; Weng, B.W.; Zhong, C.J. Characteristic parameter analysis for identification of vortex-induced vibrations of a long-span bridge. J. Civ. Struct. Health Monit. 2024, 15, 127–150. [Google Scholar] [CrossRef]
  6. Saidin, S.S.; Jamadin, A.; Kudus, S.A.; Amin, N.M.; Anuar, M.A. An Overview: The Application of Vibration-Based Techniques in Bridge Structural Health Monitoring. Int. J. Concr. Struct. Mater. 2022, 16, 69. [Google Scholar]
  7. Hou, R.R.; Xia, Y. Review on the new development of vibration-based damage identification for civil engineering structures: 2010–2019. J. Sound Vibr. 2021, 491, 115741. [Google Scholar]
  8. Pan, Y.; Zhang, L.M. Roles of artificial intelligence in construction engineering and management: A critical review and future trends. Autom. Constr. 2021, 122, 103517. [Google Scholar]
  9. Chen, F.L.; Zhou, W.; Chen, C.F.; Ma, P.F. Extended D-TomoSAR Displacement Monitoring for Nanjing (China) City Built Structure Using High-Resolution TerraSAR/TanDEM-X and Cosmo SkyMed SAR Data. Remote Sens. 2019, 11, 2623. [Google Scholar] [CrossRef]
  10. Shang, Z.Q.; Sun, L.M.; Xia, Y.; Zhang, W. Vibration-based damage detection for bridges by deep convolutional denoising autoencoder. Struct. Health Monit. 2021, 20, 1880–1903. [Google Scholar]
  11. Xu, H.Y.; Su, X.; Wang, Y.; Cai, H.Y.; Cui, K.R.; Chen, X.D. Automatic Bridge Crack Detection Using a Convolutional Neural Network. Appl. Sci. 2019, 9, 2867. [Google Scholar] [CrossRef]
  12. Bae, H.; Jang, K.; An, J.Y. Deep super resolution crack network (SrcNet) for improving computer vision–based automated crack detectability in in situ bridges. Struct. Health Monit. 2020, 20, 1428–1442. [Google Scholar]
  13. Chen, L.F.; Weng, T.; Xing, J.; Pan, Z.H.; Yuan, Z.H.; Xing, X.M.; Zhang, P. A New Deep Learning Network for Automatic Bridge Detection from SAR Images Based on Balanced and Attention Mechanism. Remote Sens. 2020, 12, 441. [Google Scholar] [CrossRef]
  14. Bao, Y.Q.; Tang, Z.Y.; Li, H.; Zhang, Y.F. Computer vision and deep learning-based data anomaly detection method for structural health monitoring. Struct. Health Monit. 2019, 18, 401–421. [Google Scholar]
  15. Busca, G.; Cigada, A.; Mazzoleni, P.; Zappa, E. Vibration monitoring of multiple bridge points by means of a unique vision-based measuring system. Exp. Mech. 2014, 54, 255–271. [Google Scholar]
  16. Ji, Y.; Chang, C.C. Nontarget image-based technique for small cable vibration measurement. J. Bridge Eng. 2008, 13, 34–42. [Google Scholar]
  17. Chen, C.C.; Wu, W.H.; Tseng, H.Z.; Chen, C.H.; Lai, G. Application of digital photogrammetry techniques in identifying the mode shape ratios of stay cables with multiple camcorders. Measurement 2015, 75, 134–146. [Google Scholar]
  18. Kim, S.W.; Jeon, B.G.; Cheung, J.H.; Kim, S.D.; Park, J.B. Stay Cable Tension Estimation Using a Vision-based Monitoring System under Various Weather Conditions. J. Civ. Struct. Health Monit. 2017, 7, 343–357. [Google Scholar]
  19. Kohut, P.; Kurowski, P. Application of modal analysis supported by 3D vision-based measurements. J. Theor. Appl. Mech. 2009, 47, 855–870. [Google Scholar]
  20. Jian, X.D.; Xia, Y.; Lozano-Galant, J.; Sun, L.M. Traffic Sensing Methodology Combining Influence Line Theory and Computer Vision Techniques for Girder Bridges. J. Sens. 2019, 2019, 3409525. [Google Scholar]
  21. Fukuda, Y.; Feng, M.; Narita, Y.; Kaneko, S.; Tanaka, T. Vision-based displacement sensor for monitoring dynamic response using robust object search algorithm. IEEE Sens. J. 2013, 13, 4725–4732. [Google Scholar]
  22. Wang, Z.B.; Graca, M.S.; Bryanston-Cross, P.J.; Whitehouse, D.J. Phase-shifted image matching algorithm for displacement measurement. Opt. Eng. 1996, 35, 2327–2332. [Google Scholar]
  23. Feng, D.M.; Feng, M.Q.; Ozer, E.; Fukuda, Y. A Vision-Based Sensor for Noncontact Structural Displacement Measurement. Sensors 2015, 15, 16557–16575. [Google Scholar] [CrossRef] [PubMed]
  24. Lee, D.H.; Jeon, H.M.; Myung, H. Pose-graph optimized displacement estimation for structural displacement monitoring. Smart Struct. Syst. 2014, 14, 943–960. [Google Scholar]
  25. Chan, T.; Ashebo, D.; Tam, H.Y.; Yu, Y.L.; Chan, T.F.; Lee, P.C.; Gracia, E.P. Vertical displacement measurements for bridges using optical fiber sensors and CCD cameras-a preliminary study. Struct. Health Monit. 2009, 8, 243–249. [Google Scholar]
  26. Dong, C.Z.; Ye, X.W.; Jin, T. Identification of structural dynamic characteristics based on machine vision technology. Measurement 2018, 126, 405–416. [Google Scholar]
  27. Ye, X.W.; Ni, Y.Q.; Wai, T.T.; Wong, K.Y.; Zhang, X.M.; Zhang, F.X. A vision-based system for dynamic displacement measurement of long-span bridges: Algorithm and verification. Smart Struct. Syst. 2013, 12, 363–379. [Google Scholar]
  28. Lee, J.J.; Cho, S.; Shinozuka, M.; Yun, C.; Lee, C.G.; Lee, W. Evaluation of bridge load carrying capacity based on dynamic displacement measurement using real-time image processing techniques. Int. J. Steel Struct. 2006, 6, 377–385. [Google Scholar]
  29. Feng, D.M.; Feng, M.Q. Experimental validation of cost-effective vision-based structural health monitoring. Mech. Syst. Signal Proc. 2017, 88, 199–211. [Google Scholar]
  30. Chang, C.C.; Ji, Y.F. Flexible videogrammetric technique for three-dimensional structural vibration measurement. J. Eng. Mech. 2007, 133, 656–664. [Google Scholar]
  31. Li, Z.H.; Chen, L.F.; Long, F.Q.; Li, Z.Q.; Jina, H.X. Automatic Bridge Detection of SAR Images Based on Interpretable Deep Learning Algorithm. In Proceedings of the 2023 3rd International Conference on Artificial Intelligence and Industrial Technology Applications, Suzhou, China, 24–26 March 2023. [Google Scholar]
  32. Mas, D.; Ferrer, B.; Acevedo, P.; Espinosa, J. Method sand algorithms for video based multi-point frequency measuring and mapping. Measurement 2016, 85, 164–174. [Google Scholar] [CrossRef]
  33. Pan, B.; Qian, K.; Xie, H.; Asundi, A. Two-dimensional digital image correlation for in-plane displacement and strain measurement: A review. Meas. Sci. Technol. 2009, 20, 062001. [Google Scholar] [CrossRef]
  34. Debella-Gilo, M.; Kääb, A. Sub-pixel precision image matching for measuring surface displacements on mass movements using normalized cross-correlation. Remote Sens. Environ. 2011, 115, 130–142. [Google Scholar] [CrossRef]
  35. Mas, D.; Perez, J.; Ferrer, B.; Espinosa, J. Realistic limits for subpixel movement detection. Appl. Opt. 2016, 55, 4974–4979. [Google Scholar] [CrossRef]
  36. Lee, J.H.; Ho, H.N.; Shinozuka, M. An advanced vision-based dynamic rotational angle measurement system for large civil structures. Sensors 2012, 12, 7326–7336. [Google Scholar] [CrossRef]
  37. Yue, X.F.; Liu, Z.Y.; Zhu, J.; Gao, X.L.; Yang, B.J.; Tian, Y.S. Coarse-fine point cloud registration based on local point-pair features and the iterative closest point algorithm. Appl. Intell. 2022, 52, 12569–12583. [Google Scholar] [CrossRef]
  38. Lydon, D.; Lydo, M.; Kromanis, R.; Dong, C.Z.; Catbas, N.; Taylor, S. Bridge Damage Detection Approach Using a Roving Camera Technique. Sensors 2021, 21, 1246. [Google Scholar] [CrossRef] [PubMed]
  39. Ye, X.; Jian, X.D.; Yan, B.; Su, D. Infrastructure Safety Oriented Traffic Load Monitoring Using Multi-Sensor and Single Camera for Short and Medium Span Bridges. Remote Sens. 2019, 11, 2651. [Google Scholar] [CrossRef]
  40. Lin, S.; Wang, S.; Liu, T.; Liu, X.Q.; Liu, C. Accurate Measurement of Bridge Vibration Displacement via Deep Convolutional Neural Network. IEEE Trans. Instrum. Meas. 2023, 72, 5020016. [Google Scholar] [CrossRef]
  41. Zhang, C.; Wan, L.; Wan, R.Q.; Yu, J.; Li, R. Automated fatigue crack detection in steel box girder of bridges based on ensemble deep neural network. Measurement 2022, 202, 111805. [Google Scholar] [CrossRef]
  42. Wu, T. Research on Holographic Dynamic Displacement Monitoring and Damage Identification Methods for Bridges by Integrating Measurement Point Accelerations. Master’s Thesis, Chongqing Jiaotong University, Chongqing, China, 2024. (In Chinese). [Google Scholar]
Figure 1. Basic process.
Buildings 15 01139 g001
Figure 2. Template matching method.
Buildings 15 01139 g002
Figure 3. Industrial camera form factor.
Buildings 15 01139 g003
Figure 4. Appearance of the visual controller.
Buildings 15 01139 g004
Figure 5. Vibration table.
Buildings 15 01139 g005
Figure 6. Imaging principle of the camera.
Buildings 15 01139 g006
Figure 7. Principle of the coordinate transformation.
Buildings 15 01139 g007
Figure 8. Template matching for indoor experiments.
Buildings 15 01139 g008
Figure 9. Displacement–time history curve.
Buildings 15 01139 g009
Figure 10. Fourier Transform of the indoor test results.
Buildings 15 01139 g010
Figure 11. Selection of templates with different sizes.
Buildings 15 01139 g011
Figure 12. Comparison chart of monitoring results using templates of different sizes.
Buildings 15 01139 g012
Figure 13. Results of Fourier Transform for templates of different sizes.
Buildings 15 01139 g013
Figure 14. Displacement–time history curves of monitoring results obtained by different methods.
Buildings 15 01139 g014
Figure 15. Monitoring results using the cross-correlation-based method.
Buildings 15 01139 g015
Figure 16. Yongning Bridge.
Buildings 15 01139 g016
Figure 17. Schematic diagram of steel beam joints.
Buildings 15 01139 g017
Figure 18. Schematic diagram of temporary structures.
Buildings 15 01139 g018
Figure 19. Visual monitoring area.
Buildings 15 01139 g019
Figure 20. Typical vertical displacement–time history of the L03 temporary pier during two different incremental launching operations.
Buildings 15 01139 g020
Disclaimer/Publisher’s Note: The statements, opinions and data contained in all publications are solely those of the individual author(s) and contributor(s) and not of MDPI and/or the editor(s). MDPI and/or the editor(s) disclaim responsibility for any injury to people or property resulting from any ideas, methods, instructions or products referred to in the content.

