Article

Simulated Research on Dynamic Mechanical Properties and Crack Evolution Laws of Fractured Red Sandstone

1
School of Resources and Environmental Engineering, Jiangxi University of Science and Technology, Ganzhou 341000, China
2
Jiangxi Provincial Key Laboratory of Low-Carbon Processing and Utilization of Strategic Metal Mineral Resource, Jiangxi University of Science and Technology, Ganzhou 341000, China
*
Authors to whom correspondence should be addressed.
Buildings 2025, 15(7), 1147; https://doi.org/10.3390/buildings15071147
Submission received: 25 February 2025 / Revised: 29 March 2025 / Accepted: 30 March 2025 / Published: 1 April 2025
(This article belongs to the Section Building Materials, and Repair & Renovation)

Abstract

:
Using the two-dimensional Particle Flow Code (PFC2D), a model of red sandstone containing fractures with different inclination angles under impact load was established to study the influence of fracture inclination angles on the dynamic compressive strength, stress wave attenuation, and crack evolution laws of the model. The results indicate that, under the same impact load, the dynamic compressive strength of the cracked specimens exhibits a “V”-shaped variation, with the specimen at a 45° inclination angle showing the lowest strength. The influence of inclination angles on strength is most significant in the 30° to 45° inclined specimens. As the inclination angle increases, the reflection coefficient rises, the transmission coefficient decreases, stress wave attenuation intensifies, and the time for specimen penetration shortens, making the specimen more prone to failure. The location of crack initiation shifts toward the middle of the fracture as the inclination angle increases, and the cracks tend to develop parallel to the impact load. When the inclination angle is ≥45°, stress concentration at fracture tips prolongs the shear-dominated phase during failure progression. However, the tensile ratio k consistently exceeds 0.7 at ultimate failure, indicating tensile mechanisms remain the dominant failure mode. Both absorbed energy and total crack number generally decrease with increasing inclination angle, while no clear correlation exists between absorbed energy and fragment number. Large fragments are distributed on both sides of the fracture during the fragmentation process. In contrast, small fragments concentrate near the through cracks. Specimens with 45° and 60° inclination angles exhibit a higher number of fragments and more significant fragmentation. In the initial loading stage, the specimen with a 90° inclination angle shows the weakest resistance to failure, while the 0° inclination angle specimen exhibits the strongest resistance. The research findings contribute to elucidating the dynamic failure mechanisms of fractured red sandstone, analyzing slope stability, and optimizing blasting designs.

1. Introduction

After undergoing long-term and complex geological processes, rocks develop many randomly distributed fractures within their interiors. The presence of these fractures leads to significant variations in the fracture characteristics of rocks. The difference in fracture profoundly impacts rocks’ mechanical properties and the cracks’ evolution. In reality, rocks containing fractures are not only affected by static loads but also experience exacerbated fracture propagation and coalescence under dynamic loads, thereby influencing the stability of fractured rocks. Most dynamic loads, in reality, originate from blasting and impact. Therefore, analyzing the influence laws of dynamic compressive strength, stress wave propagation, crack initiation, development, and coalescence in rocks under impact load can provide valuable support for the stability analysis of rock masses in underground engineering construction [1,2,3].
Researchers have extensively studied the mechanical and failure characteristics of prefabricated fractured rock masses and rock-like materials. Hu et al. [4] conducted uniaxial compression tests on two types of layered rock-like specimens with prefabricated parallel fractures. The results showed that as the fracture inclination angle increased, the specimens’ peak strength first decreased and then increased. The DEM software PFC demonstrates significant applications across multiple engineering disciplines [5,6,7,8]. Zheng et al. [9] employed both experimental and numerical simulation methods to investigate crack initiation and evolution characteristics in sandstone specimens with non-parallel fractures at different inclination angles. Yao et al. [10] used PFC2D to simulate uniaxial tests on rock specimens with fractures at different angles around a hole. They found that the peak stress, elastic modulus, crack initiation stress, and other properties of rock specimens with fractures at different angles around a hole were lower than those of intact rock. Haeri et al. [11] investigated the relationship between tensile strength and fracture toughness of specimens using PFC. Li et al. [12] conducted uniaxial compression tests and numerical simulation experiments on rock-like specimens with a single prefabricated fracture at different angles. They found that the specimens’ peak strength exhibited a V-shaped distribution as the prefabricated fracture’s inclination angle increased. Stress concentration occurred at the two tips of the prefabricated fracture, and wing cracks extended symmetrically. To monitor the development of cracks, some scholars utilized acoustic emission (AE) technology to record acoustic signals during the compression of fractured specimens. They employed AE information to describe the initiation, development, and coalescence of internal fractures within the specimens [13,14]. Other scholars investigated the influence of laws of mechanical parameters and failure characteristics in specimens containing defects such as non-straight fractures [15], double fractures [16], cracks and pores [17], and double circular holes [18].
Rocks with fractures in nature are subject to the impacts of earthquakes and blasting, making it essential to study the effects of dynamic loading on rocks. Ping et al. [19,20] conducted impact compression experiments on sandstone specimens with prefabricated fractures of different thicknesses and inclination angles, investigating the influence of fracture thickness and inclination angle on dynamic mechanical properties, crack development, and energy dissipation. Yan et al. [21] employed the split-Hopkinson pressure bar (SHPB) system to conduct dynamic impact tests on multi-cracked rocks with different geometric shapes, analyzing the effects of strain rate and geometric cracks on the rock specimens’ dynamic mechanical response and cracking behavior. Uxía et al. [22] utilized PFC3D to simulate intact and fractured granite specimens, proposing a calibration procedure. Wang et al. [23] utilized PFC2D to simulate cyclic impacts on sandstone, analyzing the dynamic damage and failure processes of sandstone from a mesoscopic perspective. Lu et al. [24] conducted cyclic impact tests on sandstone treated at different temperatures using the SHPB and simultaneously applied the digital image correlation (DIC) method to study the mechanical behavior of sandstone. They found that DIC technology can effectively explain the formation and propagation of cracks. Zhang et al. [25] used the SHPB system and DIC equipment to conduct combined static and dynamic loading tests on granite with different surrounding rock conditions and fractures at various angles, studying the deformation and failure characteristics as well as the variation of strength during the failure process. Su et al. [26] employed 3D printing technology to fabricate rock-like material specimens with rough joints and conducted dynamic impact tests. It was discovered that the strain rate and joint roughness have a notable impact on the dynamic mechanical parameters of the jointed specimens. Imani et al. [27] employed PFC2D to simulate the Brazilian disk specimens, demonstrating excellent consistency between the numerical simulation and experimental results. Sun et al. [28] conducted dynamic impact tests on coal rock, investigating its dynamic mechanical properties and crack evolution characteristics. Yang et al. [29] combined the discrete element method (DEM) and the finite difference method (FDM) to develop a numerical model for a true triaxial SHPB system. They compared it with experimental results to validate the effectiveness of the numerical model. Yan et al. [30] used DEM to simulate dynamic impact tests on single-fractured rock specimens at different strain rates, studying the influence of strain rate on the cracking behavior of the specimens. Fakhimi et al. [31] developed a numerical model of the SHPB using the DEM-FEM and introduced a rock strength enhancement factor to increase the bonding strength between particles. Patel et al. [32] employed the DEM to investigate the influence of initial cracks on the mechanical properties of rocks. Saadat et al. [33] proposed a novel cohesive DEM framework within PFC2D. Wu et al. [34] investigated the fracture mechanics characteristics and crack evolution laws of sandstone with a single fracture under dynamic loading, finding that the fracture angle plays a crucial role in the failure mode of sandstone.
Rocks are also affected by water, temperature, and cyclic impacts, and scholars have conducted research in this area. Jin et al. [35] investigated coal-rock specimens’ dynamic mechanical properties and crack evolution behavior under multiple loading conditions. Chen et al. [36] conducted constant-amplitude, low-cycle impact tests on red sandstone at different temperatures and fracture angles. They used the response surface method (RSM) to establish a multivariate regression model among the response variables. You et al. [37] employed an improved SHPB system to conduct triaxial tests on sandstone with parallel defects under different strain rates and hydrostatic confining pressures, studying the failure modes of specimens with different fractures.
As mentioned above, the scholars conducted static and dynamic compression tests on specimens with single fractures, multiple fractures, and pores using techniques such as acoustic emission, DIC, and numerical simulations. However, laboratory tests cannot guarantee the uniqueness of the specimens nor provide real-time observation of the entire crack initiation, growth, and coalescence process during specimen fragmentation. Furthermore, few scholars have researched the whole crack propagation process in fractured specimens during dynamic impact tests. Based on this, the present paper employs the PFC2D to investigate red sandstone’s dynamic mechanical properties and crack evolution laws with fractures of different inclination angles in impact load tests. The study explores the influence of fracture inclination angle on dynamic compressive strength, stress wave propagation, and cracks’ initiation, development, and coalescence.

2. SHPB Test and Numerical Model Establishment
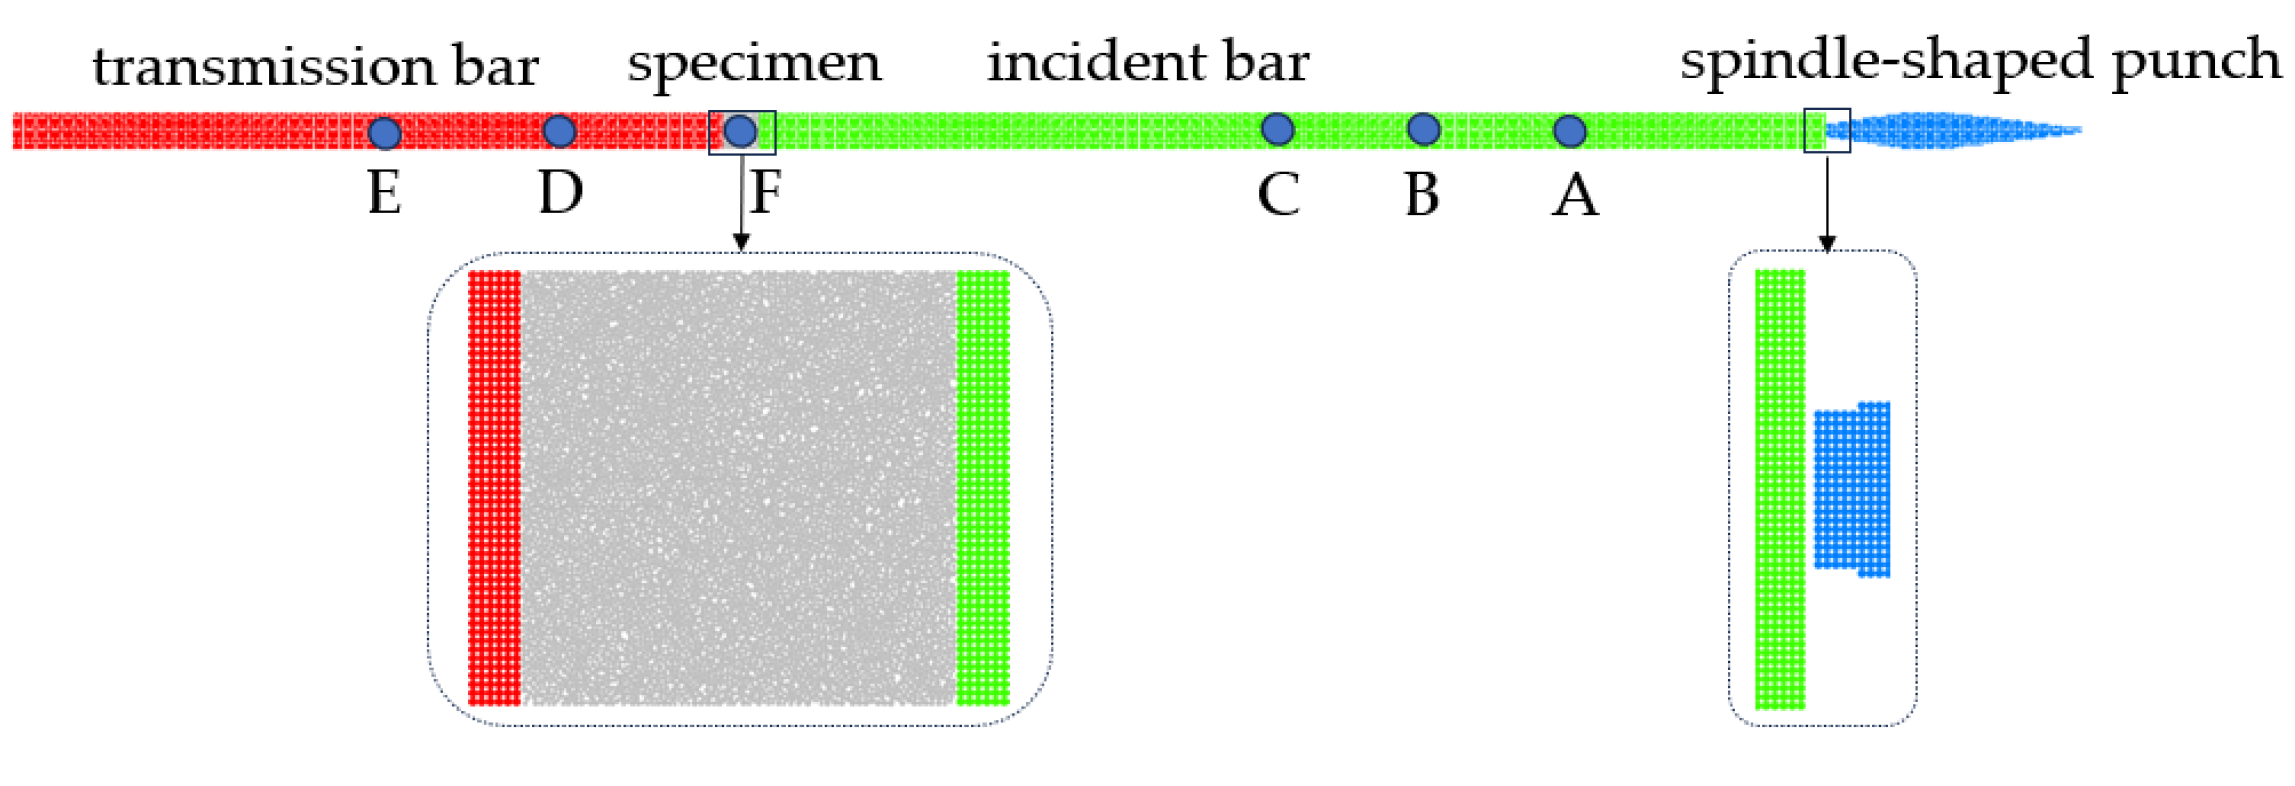
2.1. SHPB Test

The SHPB system has universal applicability for studying the dynamic properties of rocks [38]. The schematic diagram of the SHPB system used in the experiment, illustrating the interaction of stress waves at the interface between the specimen and the elastic bars, is shown in Figure 1. High-pressure nitrogen is first compressed in the pressure control chamber using a pressurization device. When the pressure in the chamber reaches a predetermined value, the launch button is activated, causing the high-pressure nitrogen to release and propel a spindle-shaped punch rapidly. Subsequently, the punch impacts the incident bar, generating an incident stress wave within it. When the incident stress wave ( σ I ) reaches the interface of the specimen, due to the difference in wave impedance, a portion is reflected to form a reflected stress wave ( σ R ), while the remaining portion transmits through the specimen into the transmission bar, forming a transmitted stress wave ( σ T ). In the SHPB system, the spindle-shaped punch measures 360.1 mm in length, while the incident and transmission bars are 2000 mm and 1500 mm long, respectively, with a diameter of 50 mm. The elastic modulus of the bars is 210 GPa, and the density is 7850 kg/m3;. The longitudinal wave speed is 5200 m/s. A laser velocimeter is used to measure the speed of the spindle-shaped punch, and dynamic strain sensors are attached to the midpoints of the incident and transmission bars. An ultra-dynamic strain gauge is employed to capture the stress wave signals, which are then displayed on an oscilloscope.
The red sandstone is widely distributed in the southern Jiangxi Province, China, and its safety and stability are greatly affected by the disturbance of dynamic loads. Therefore, red sandstone is selected as the research object. The specimen size of the red sandstone is Φ 50 mm × h 50 mm. The spindle-shaped punch is driven by high-pressure nitrogen, and the impact velocity of the punch is measured at 11.2 m/s using a laser velocimeter. Based on the “three-wave method” theory [36], the strain rate, stress, and strain of the specimen are calculated using the following formulas:
ε ˙ t = C e L s ε I ( t ) ε R ( t ) ε T ( t )
σ t = A e E e 2 A S ε I ( t ) + ε R ( t ) + ε T ( t )
ε t = C e L s 0 t ε I ( t ) ε R ( t ) ε T ( t ) d t
where A e , C e , E e represent the cross-sectional area, longitudinal wave velocity, and elastic modulus of the incident and transmission bar, respectively; A s and L s represent the cross-sectional area and height of the specimen, respectively; ε I ( t ) , ε R ( t ) , ε T ( t ) represent the incident, reflected, and transmitted strain at time t, respectively.

2.2. Model Establishment

The Particle Flow Code in 2D (PFC2D Ver. 7.0) treats the subject of study as an assembly composed of randomly distributed, independently moving rigid discrete circular disks. The motion of these particles follows Newton’s second law. Rock formations are considered aggregations of inflexible particles that are capable of moving separately from one another yet interact solely at points of contact [39].
In this study, the PFC2D model was employed to establish the primary components of the SHPB system, including the spindle-shaped punch, incident bar, transmission bar, specimen, and measurement circles (A through F), as illustrated in Figure 2. A gap is maintained between the spindle-shaped punch and the incident bar, with their end faces being free surfaces. The spindle-shaped punch is given an impact velocity along the incident bar to simulate the impact of a bullet in the SHPB test. The specimen and the bar boundaries are ensured to be in close contact. To prevent stress waves from reflecting at the free end of the transmission bar and re-entering the specimen, which could potentially affect the test results, the right end of the transmission bar is set as a transmission boundary. The damping coefficient of the rightmost particle is set to 1 to absorb the transmitted wave energy, simulating an infinite medium. The impact velocity of the spindle-shaped punch in the model was also set to match the experimental velocity. The dimensions of the punch, bars, and red sandstone specimens were modeled according to the laboratory test specifications. To enhance stress wave propagation and reduce dispersion effects [40], the particles of the spindle-shaped punch, incident bar, and transmission bar were arranged in a regular pattern. Measurement circles with a radius of 20 mm were established at the center of the incident bar, transmission bar, and specimen, labeled sequentially as A~F. These measurement circles enable the measurement of parameters such as coordination number, stress, and strain rate, with the strain being obtained through conversion using a self-programmed FISH language script. The rock damage and failure characteristics can be observed effectively using a self-programmed FISH language script to record the number of cracks, fragments, and crack development maps.
The punch and bar components employed the linear contact bond model with a particle radius of 0.5 mm. In actual experiments, the punch and bars remain in the elastic stage throughout. Therefore, the bonding strength of the bars was set to 10100 MPa, and the other parameters were matched to those of the actual bars. Numerous researchers have employed the parallel bond model to investigate the mechanical behavior of rock materials [41,42,43]. The red sandstone specimen utilized the linear parallel bond model, which can transmit both forces and moments and is similar to the role of mineral grains and cementing materials in rock materials [44].

2.3. Calibration of Meso-Scale Parameters

An iterative trial-and-error [45] approach is employed to calibrate the meso-scale parameters, ensuring the numerical simulation accurately reproduces the actual mechanical behavior of red sandstone with high consistency between simulated and experimental results. Key parameters include:
(1) Particle deformation modulus—characterizes the intrinsic stiffness of individual particles and their resistance to deformation under load;
(2) bond deformation modulus—describes the stiffness of parallel bonds between particles;
(3) bond tensile strength—defines the maximum tensile stress the bonds can sustain before failure;
(4) bond cohesion—represents the maximum shear stress capacity of the bonds;
(5) stiffness ratio—the proportion between tangential and normal stiffness components;
These parameters collectively govern the mechanical response of the model, enabling accurate simulation of red sandstone’s deformation and fracture behavior under various loading conditions.
The calibration of meso-scale parameters involves a systematic approach to ensure the numerical model accurately captures the mechanical properties of red sandstone. The process is divided into three key steps:
(1) Uniaxial compression test simulation
The elastic modulus and Poisson’s ratio of the red sandstone specimen are derived through uniaxial compression test simulations. The particle deformation modulus, bond deformation modulus, and stiffness ratio primarily govern these properties.
(2) SHPB test simulation
In the split-Hopkinson pressure bar (SHPB) test, the dynamic compressive strength is matched by adjusting the bond tensile strength and cohesion. This step ensures that the model accurately reflects the material’s behavior under high-strain-rate loading conditions.
(3) Validation and analysis
The simulation results are rigorously compared with experimental data to validate the model’s accuracy and applicability. This step ensures that the calibrated parameters effectively reproduce the mechanical response of red sandstone under various loading scenarios [46].
The particle radius of the specimen ranged from 0.25 mm to 0.42 mm. The final parameters for the punch and bars are presented in Table 1. The final mesoscopic parameters for the red sandstone specimen are shown in Table 2.

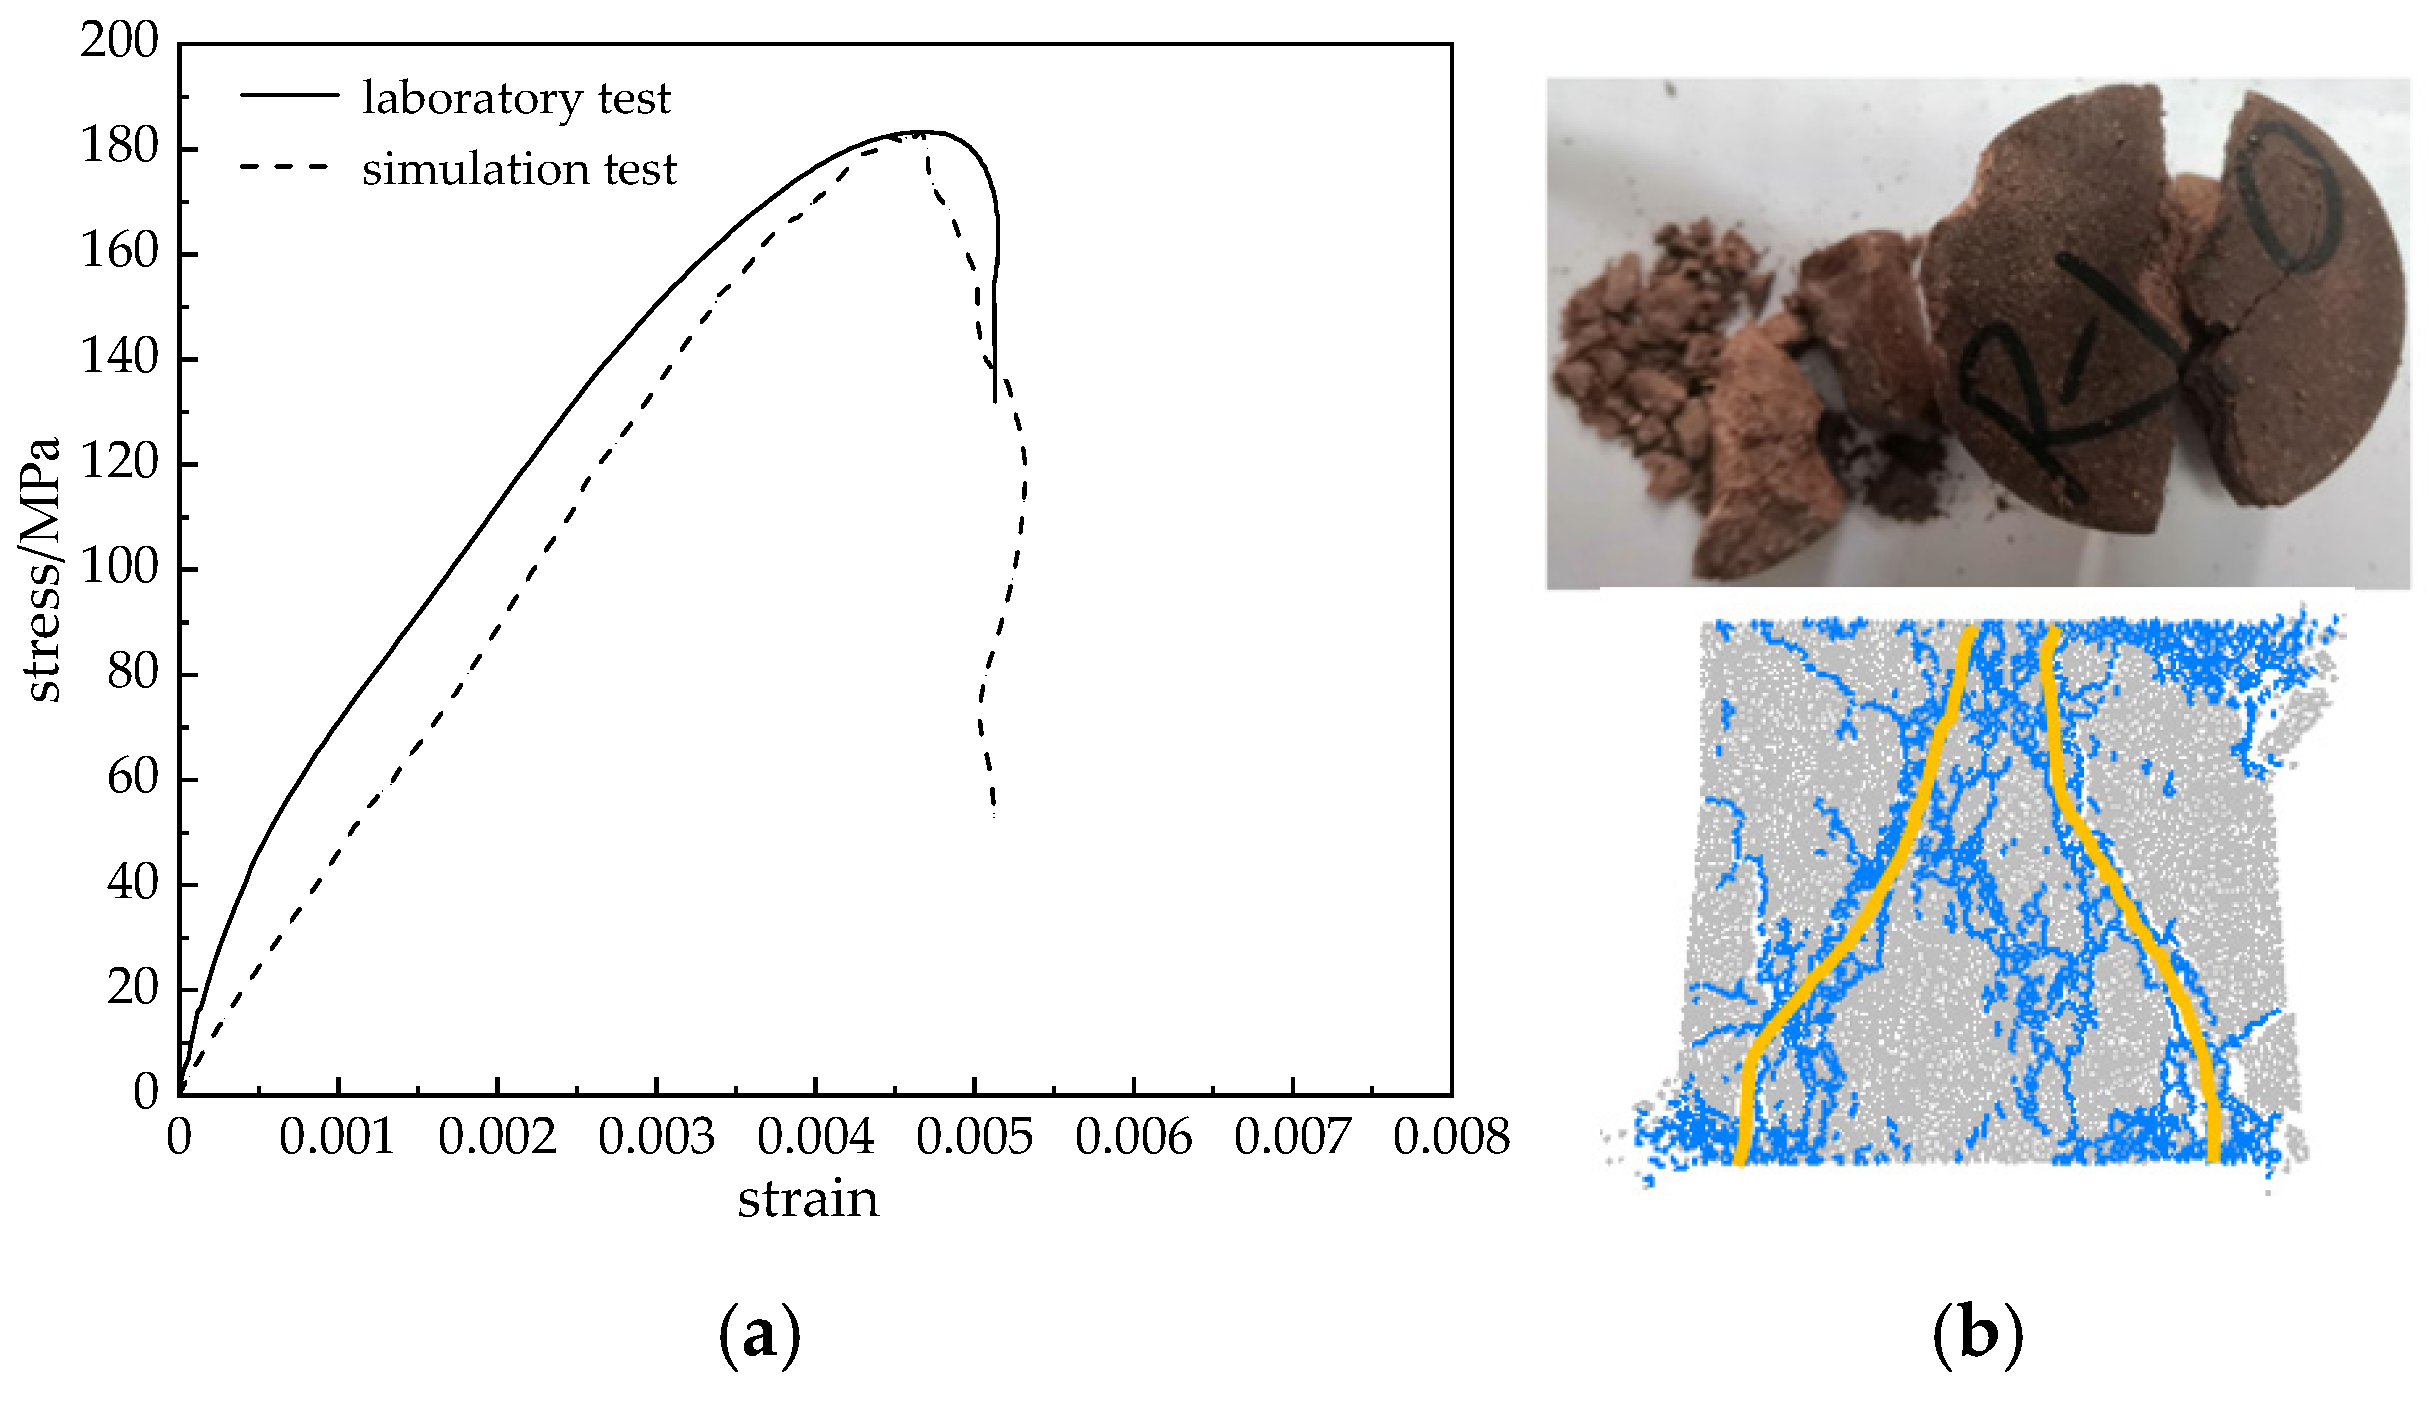
2.4. Validation of Numerical Models

The numerical simulation of SHPB tests is based on two fundamental assumptions: one-dimensional stress wave propagation in the bars and dynamic stress equilibrium in the specimen. In the numerical simulation, the incident, reflected, and transmitted stresses can be derived from the measurement circles located at the midpoints of the incident and transmission bars. Figure 3 presents the stress–time histories monitored by measurement circles A through E. The figure shows that the stress waves recorded at different measurement circles exhibit nearly identical amplitudes and waveforms, indicating negligible attenuation and dispersion of the stress waves. This observation confirms the assumption of one-dimensional stress wave propagation [46]. The stress equilibrium at both ends of the specimen is a critical factor influencing the validity of dynamic impact testing [47]. Figure 4 shows the results of the stress equilibrium test, where it can be observed that the sum of σ I and σ R waves coincides with σ T wave, consistent with the assumption of stress uniformity in the SHPB impact test. This validates the effectiveness of the numerical model.
Figure 5 presents a comparison of the results from experiments and numerical simulations. It can be observed from the figure that the stress–strain curves from both simulations and experiments exhibit similar shapes. The failure patterns observed in both experiments and numerical simulations exhibited similar characteristics, featuring two fully developed fracture bands. The root mean square error (RMSE) of the dynamic stress between experimental and simulated data was calculated to be 15.64 MPa. The dynamic compressive strength obtained from the experiment was 183.2 MPa, while the simulation yielded a value of 182.9 MPa, resulting in a relative error of approximately 0.16%. Similarly, the peak strain measured in the experiment was 0.00472, compared to 0.00467 from the simulation, with a relative error of about 1.06%. The similarity between the numerical results and experimental outcomes validates the model’s applicability, indicating that numerical simulations can be utilized to observe the fracture behavior of specimens [48].

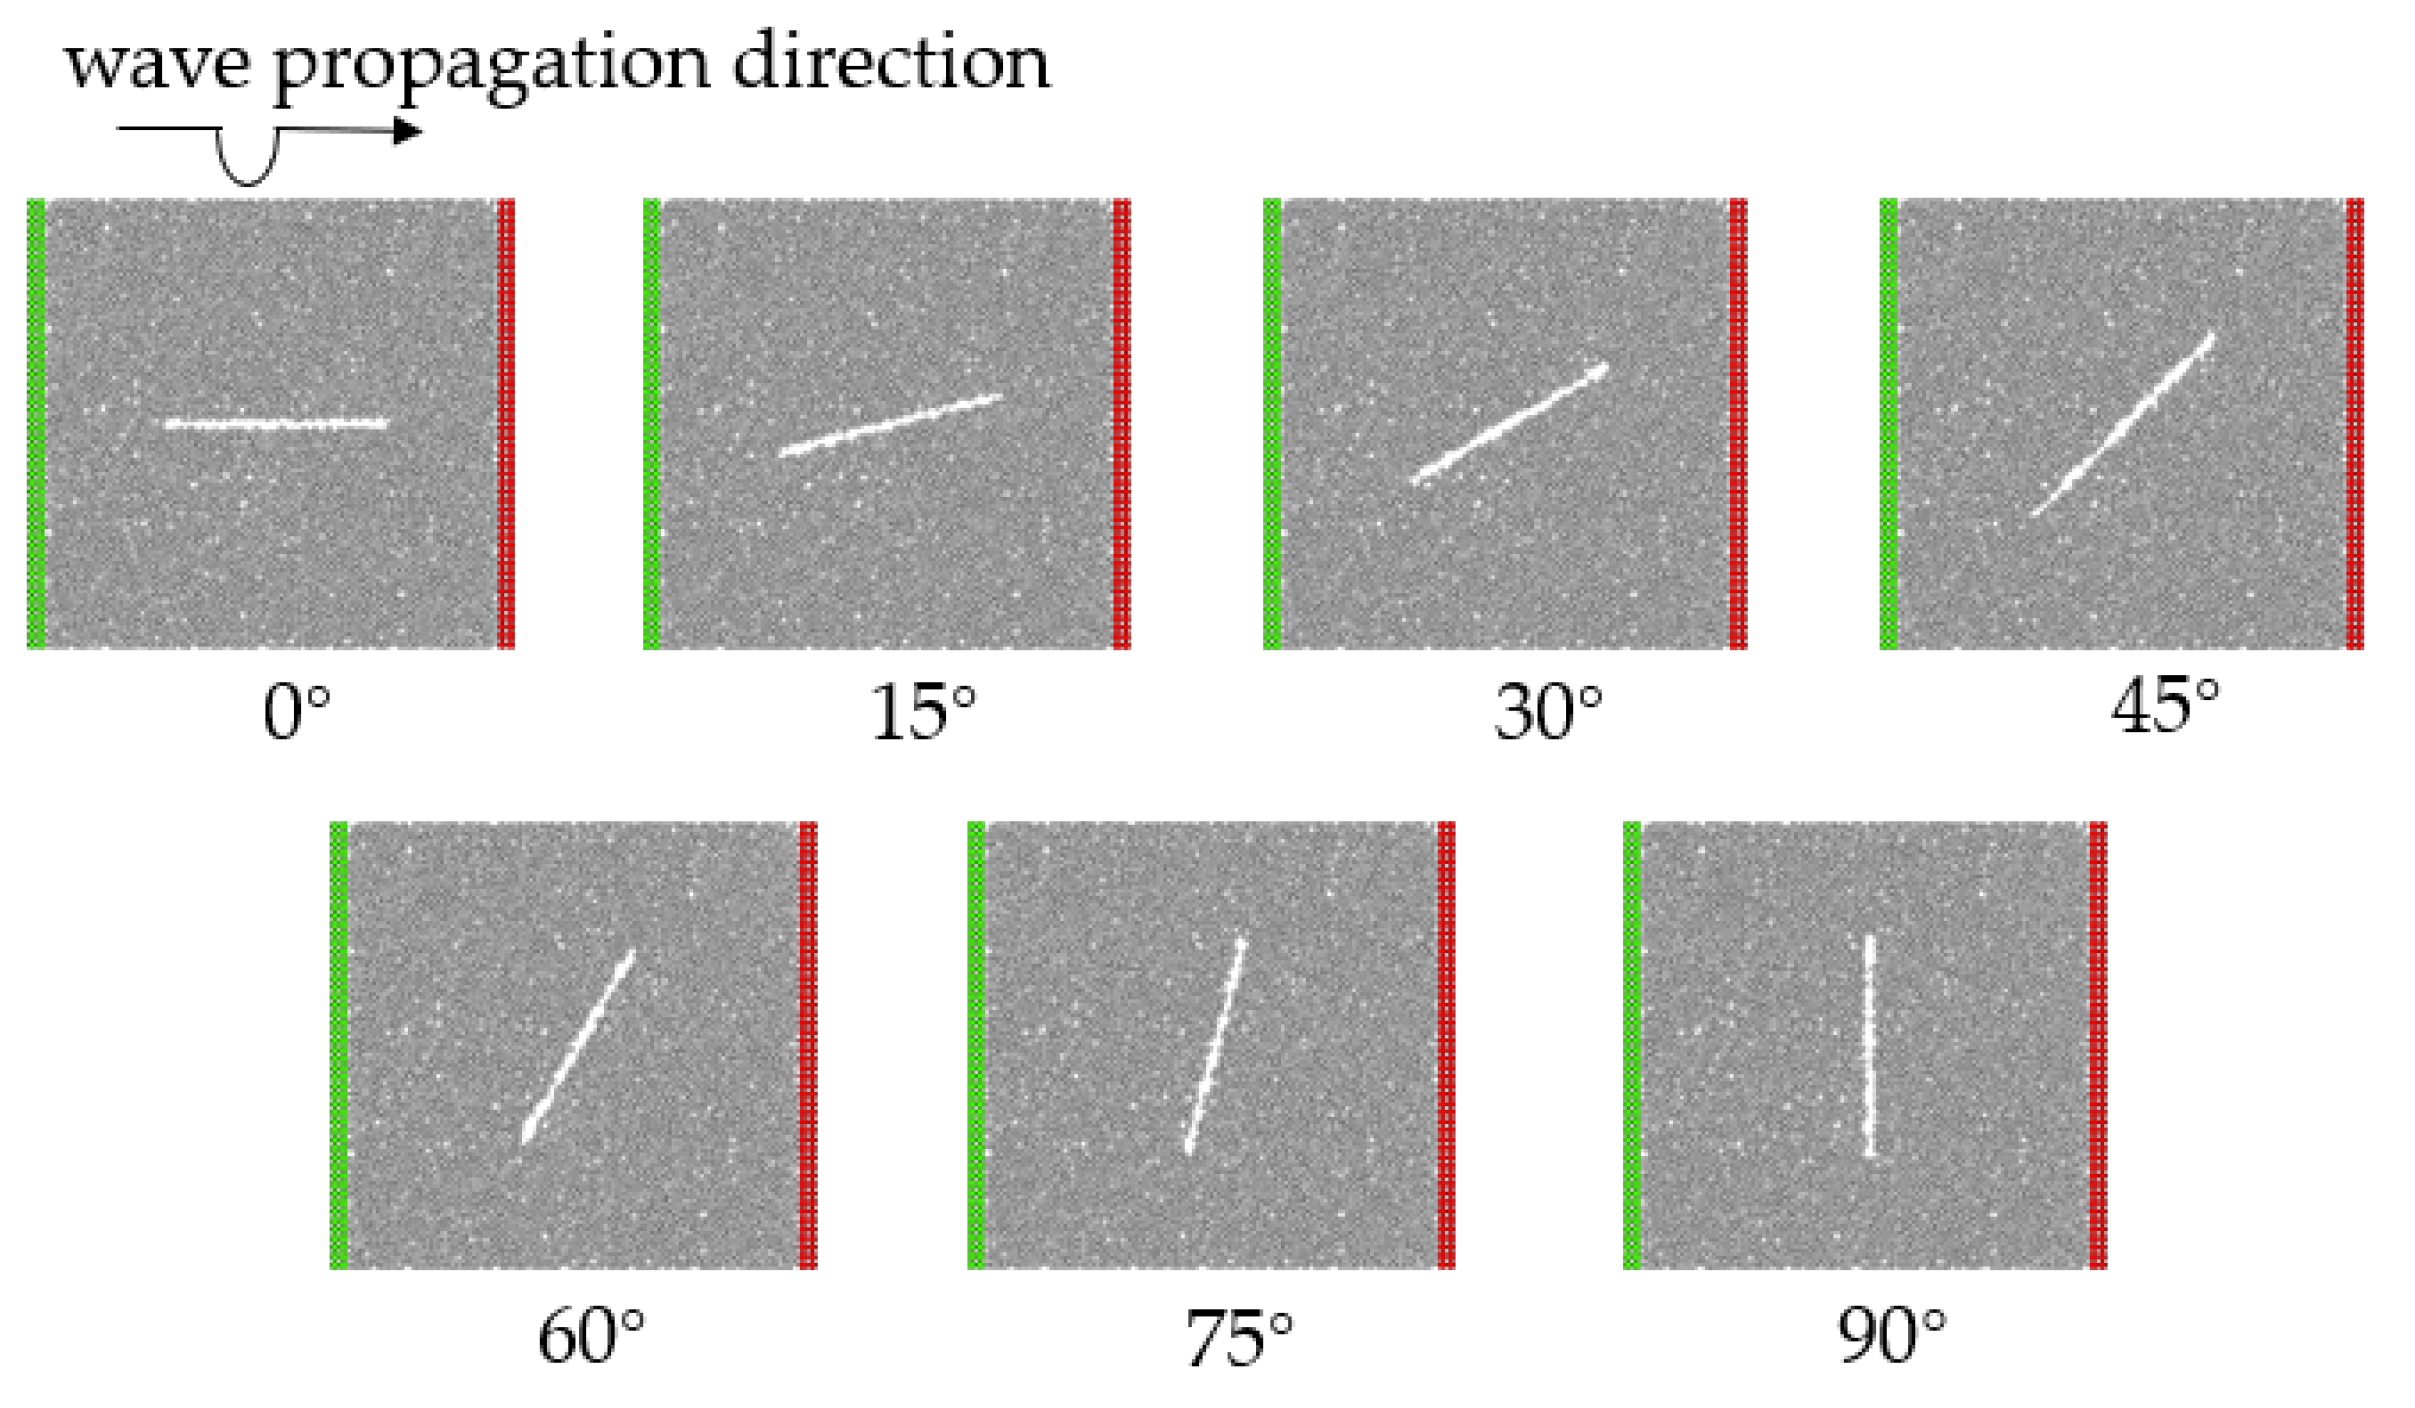
2.5. Establishment of Fractures

In nature, rock masses contain fractures at various inclination angles, which hold significant practical importance in geotechnical engineering, mining engineering, disaster prevention, and the development of construction materials and structures. In this study, the inclination angles were selected from 0° to 90° (where 0° is parallel to the wave propagation direction), with an interval of 15°, resulting in seven fracture inclination angles. This range comprehensively covers the entire spectrum from horizontal to vertical orientations, with intermediate angles such as 15°, 30°, 45°, 60°, and 75° being commonly observed, thereby effectively reflecting the influence of fracture inclination angles on the material’s mechanical behavior. Using the FISH language, pre-existing fractures with a length of 25 mm and a width of 1 mm were created in the specimen, as illustrated in Figure 6.

3. Results Analysis and Discussion

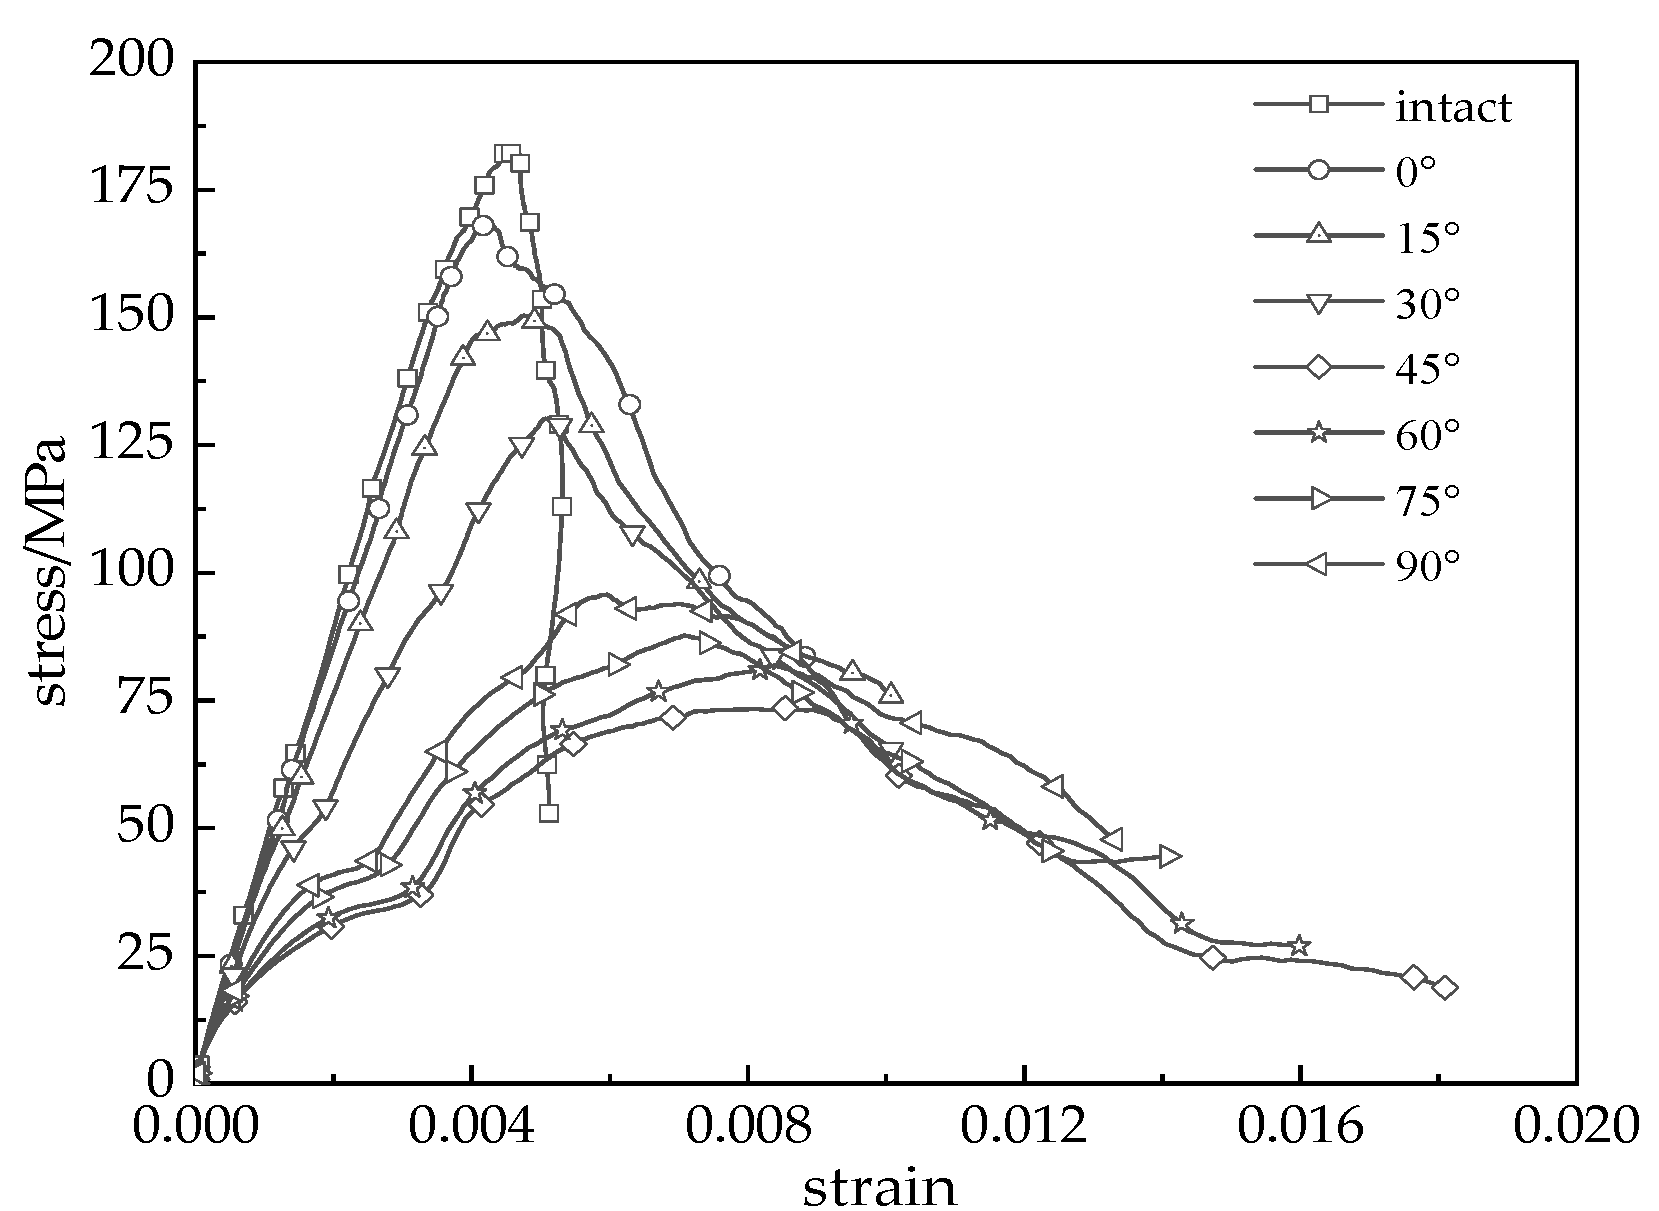
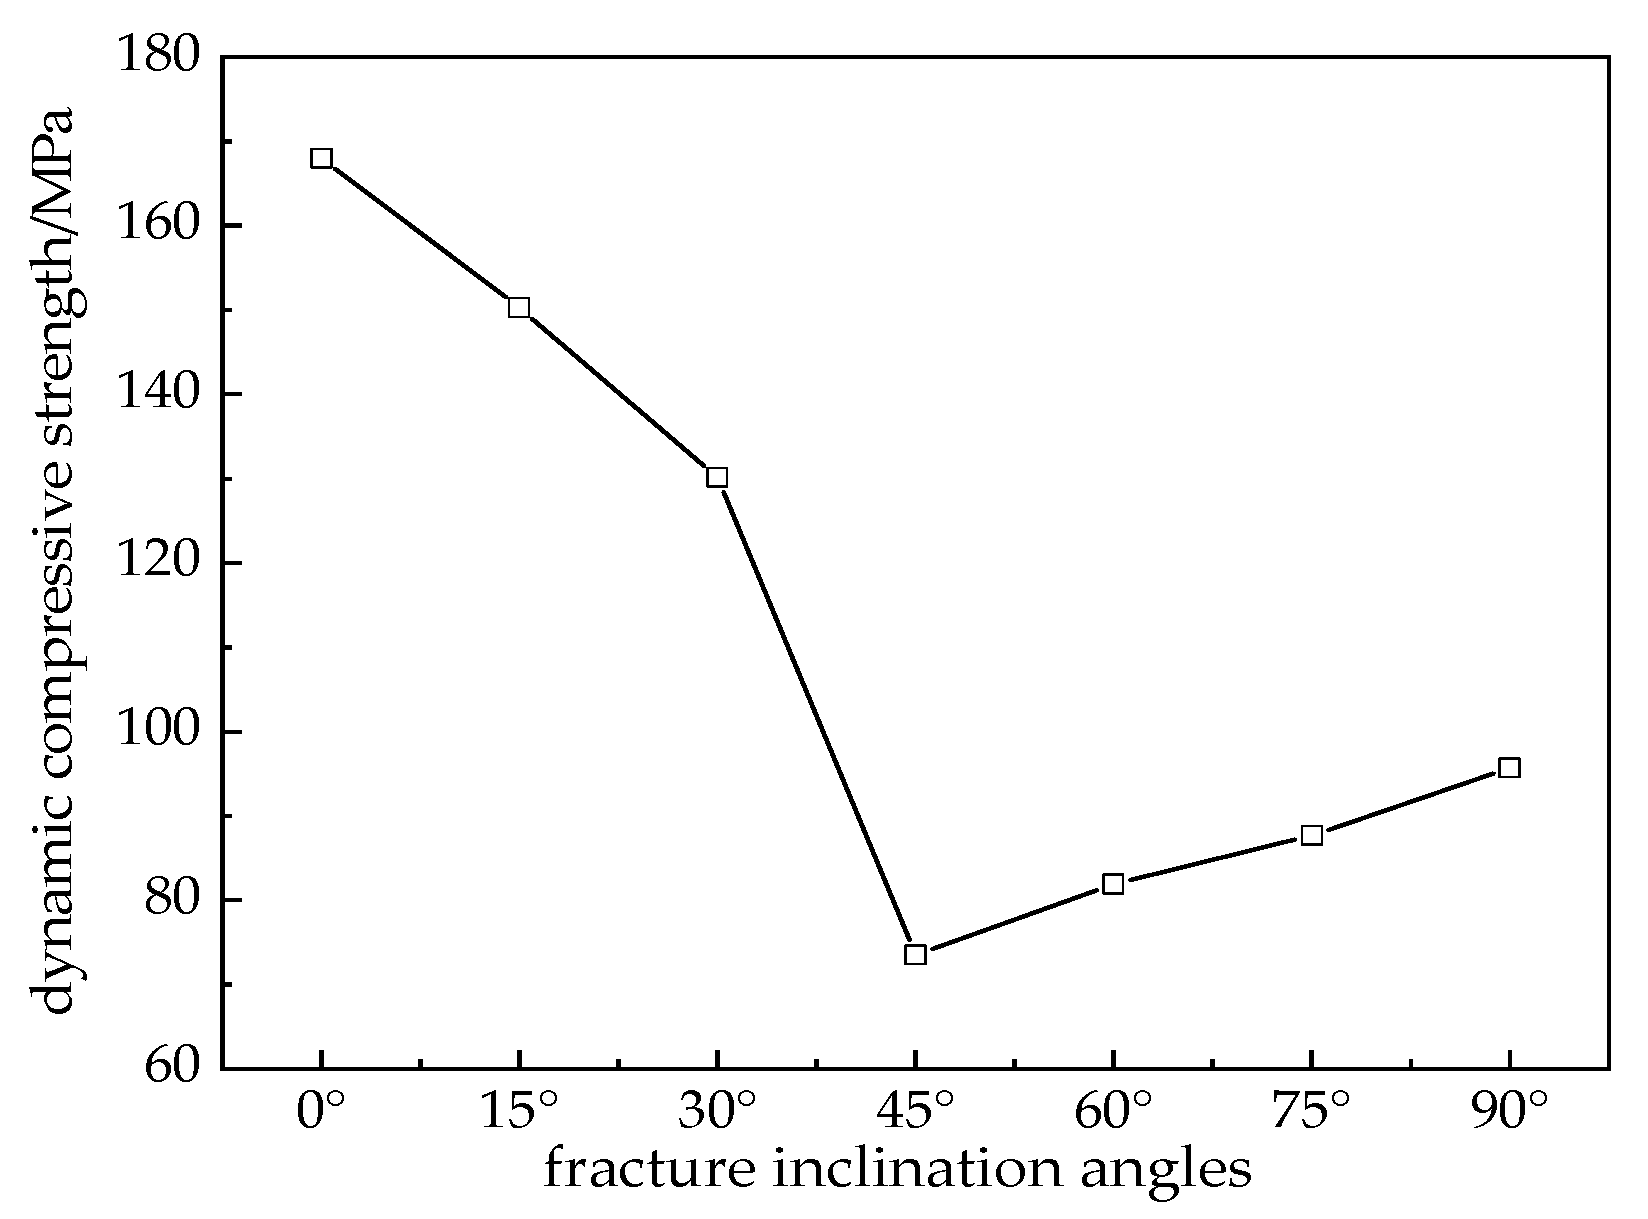
3.1. Dynamic Mechanical Properties

Figure 7 displays the dynamic stress–strain curves for specimens with fractures at different inclination angles. It is evident from the figure that the curves lack a distinct compaction stage. This is because, in the numerical simulations, besides the prefabricated fractures, there are no pores or defects within the specimens, causing the curves to bypass the compaction stage and directly enter the linear elastic phase. In laboratory tests, this phenomenon also occurs when the impact velocity of the punch is very high. This is due to the rapid compression and closure of internal voids and defects within the specimen in a short period when the impact velocity is excessively fast. Furthermore, Figure 7 also reveals that the intact specimen exhibits the highest strength at the same impact velocity, with a rapid decline in strength after reaching its peak stress. As the fracture inclination angle increases from 0° to 45°, the peak stress decreases. Notably, the most significant drop in peak stress occurs when the fracture inclination angle increases from 30° to 45°, indicating that this stage has the most critical influence on the dynamic compressive strength of the specimen. The smallest peak stress is observed at a fracture inclination angle of 45°. Subsequently, as the fracture inclination angle continues to increase, the peak stress recovers slightly. Still, the increase is modest, suggesting that the fracture inclination angle has a relatively smaller impact on the dynamic compressive strength at this stage. Therefore, it can be concluded that when the fracture inclination angle is 45°, the prefabricated fracture weakens the mechanical properties of the red sandstone model to the greatest extent [12].
The relationship between dynamic compressive strength and fracture inclination angle is illustrated in Figure 8. The figure shows that the dynamic compressive strength exhibits an overall “V”-shaped trend. The dynamic compressive strengths of the intact specimen and the specimens with fractures at angles ranging from 0° to 90° are 183.3 MPa, 168.5 MPa, 150.3 MPa, 130.2 MPa, 73.5 MPa, 81.9 MPa, 87.7 MPa, and 95.7 MPa, respectively. Compared to the intact specimen, the dynamic compressive strengths of the specimens with fractures at angles from 0° to 90° decrease by 8.1%, 18.0%, 29.0%, 60.0%, 55.3%, 52.2%, and 47.8%, respectively, indicating that the fracture inclination angle has a significant impact on the dynamic compressive strength. Among the specimens with fractures at angles from 0° to 90°, the impact varies in magnitude. Specifically, there is a 10.8% change between the 0° and 15° fracture specimens, a 13.4% change between the 15° and 30° fracture specimens, and similarly, the changes for the 30° to 45°, 45° to 60°, 60° to 75°, and 75° to 90° fracture specimens are 43.5%, 11.4%, 7.1%, and 9.1%, respectively. Therefore, it can be inferred that the fracture inclination angle in the range of 30° to 45° has the most significant influence on the dynamic compressive strength.

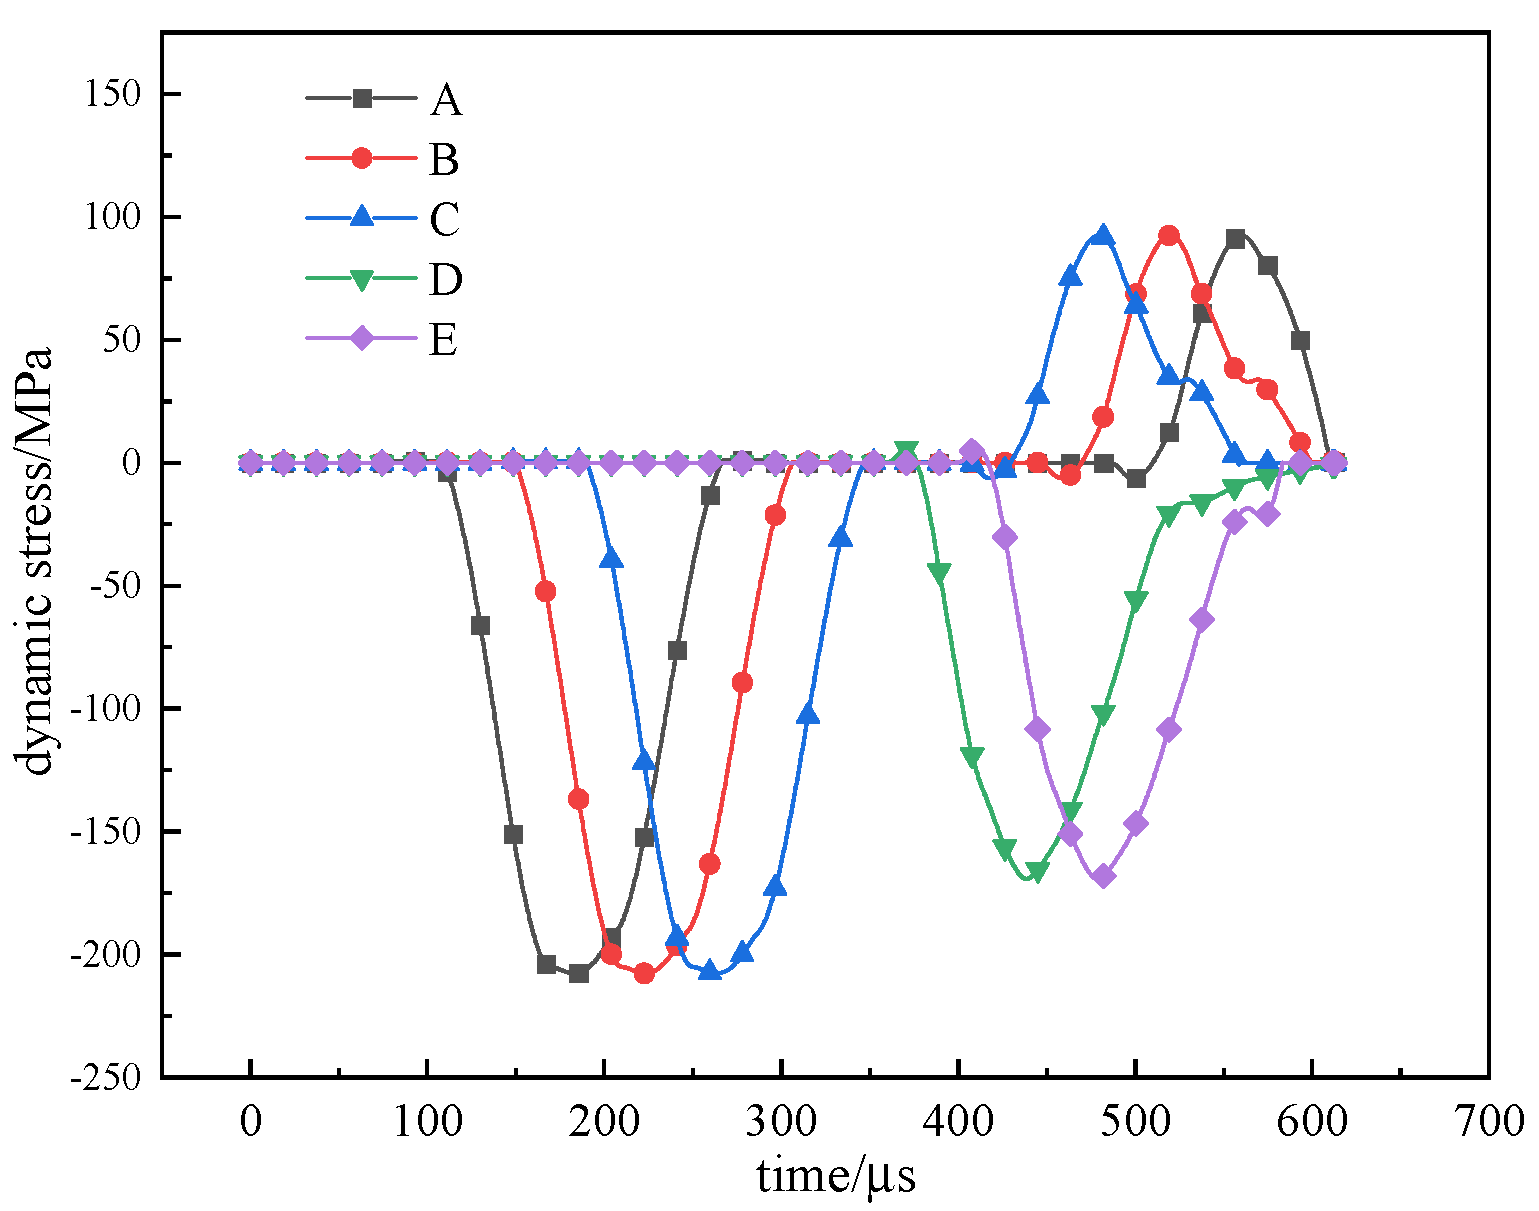
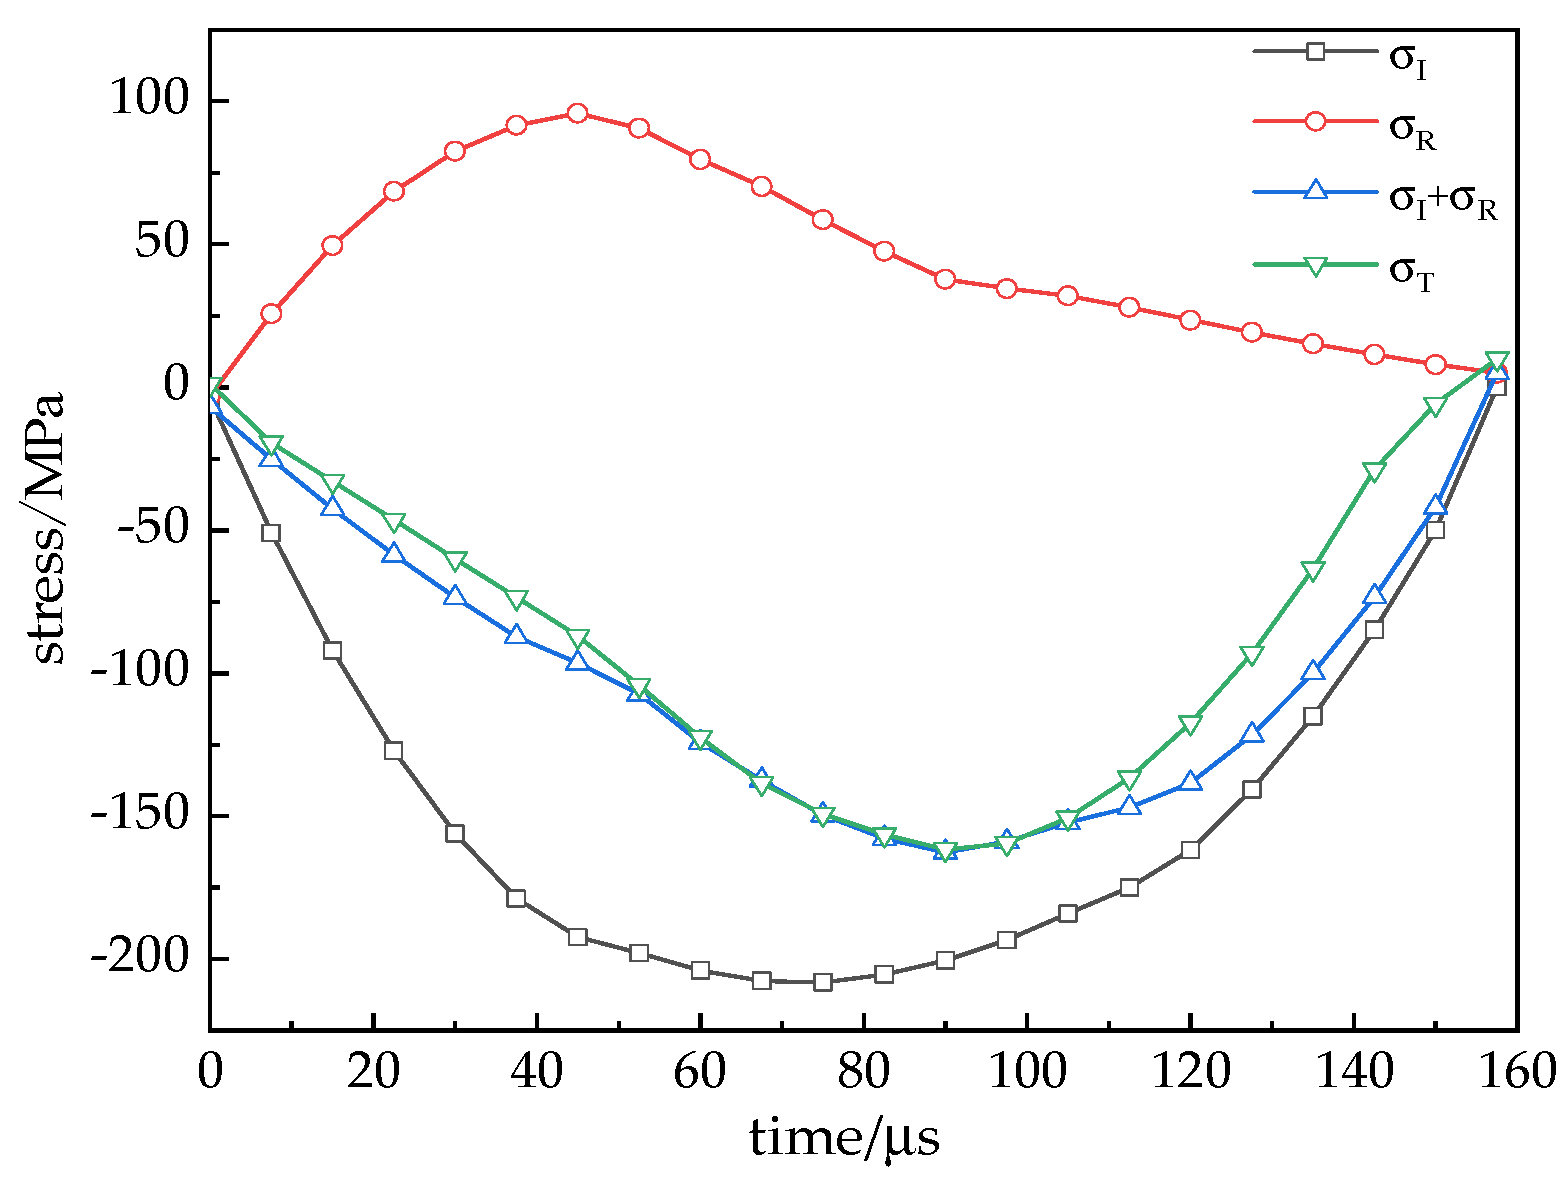
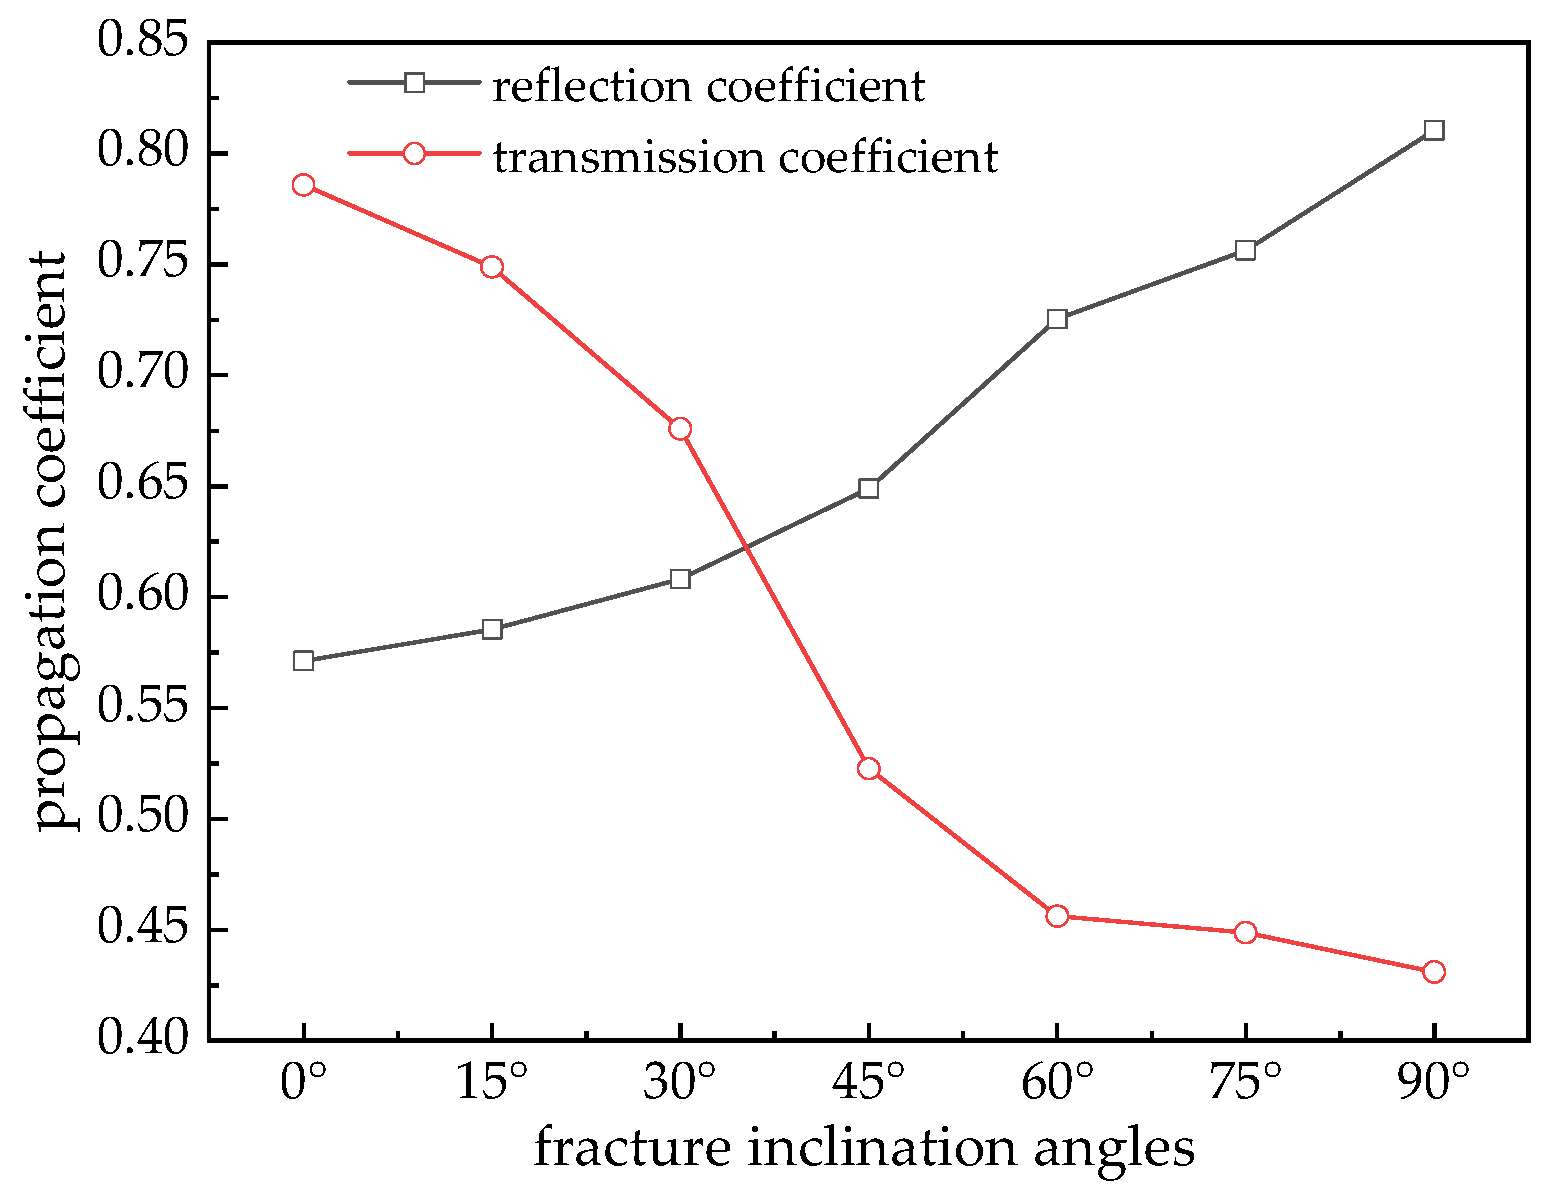
3.2. Reflection and Transmission Laws

The propagation of stress waves in a specimen can be affected by the angle of internal fractures within the specimen. To analyze the influence of fracture inclination angle on the propagation coefficients of stress waves, according to reference [49], the reflection coefficient R c and transmission coefficient T c can be determined by the following equations:
R c = max ε R t max ε I t
T c = max ε T t max ε I t
The reflection and transmission coefficients for red sandstone models with different fracture inclination angles were calculated using Formulas (4) and (5). The relationship between the propagation coefficients and fracture inclination angle is shown in Figure 9. It can be observed from the figure that the fracture inclination angle has a significant impact on both the reflection coefficient and transmission coefficient. As the fracture inclination angle increases, the reflection coefficient gradually increases, and the transmission coefficient decreases, indicating a significant attenuation of the stress wave. This suggests that a larger fracture inclination angle has a stronger weakening effect on the propagation of stress waves. This is because a larger fracture inclination angle results in a larger projected area in the direction of impact, which poses a greater obstacle to the propagation of stress waves.

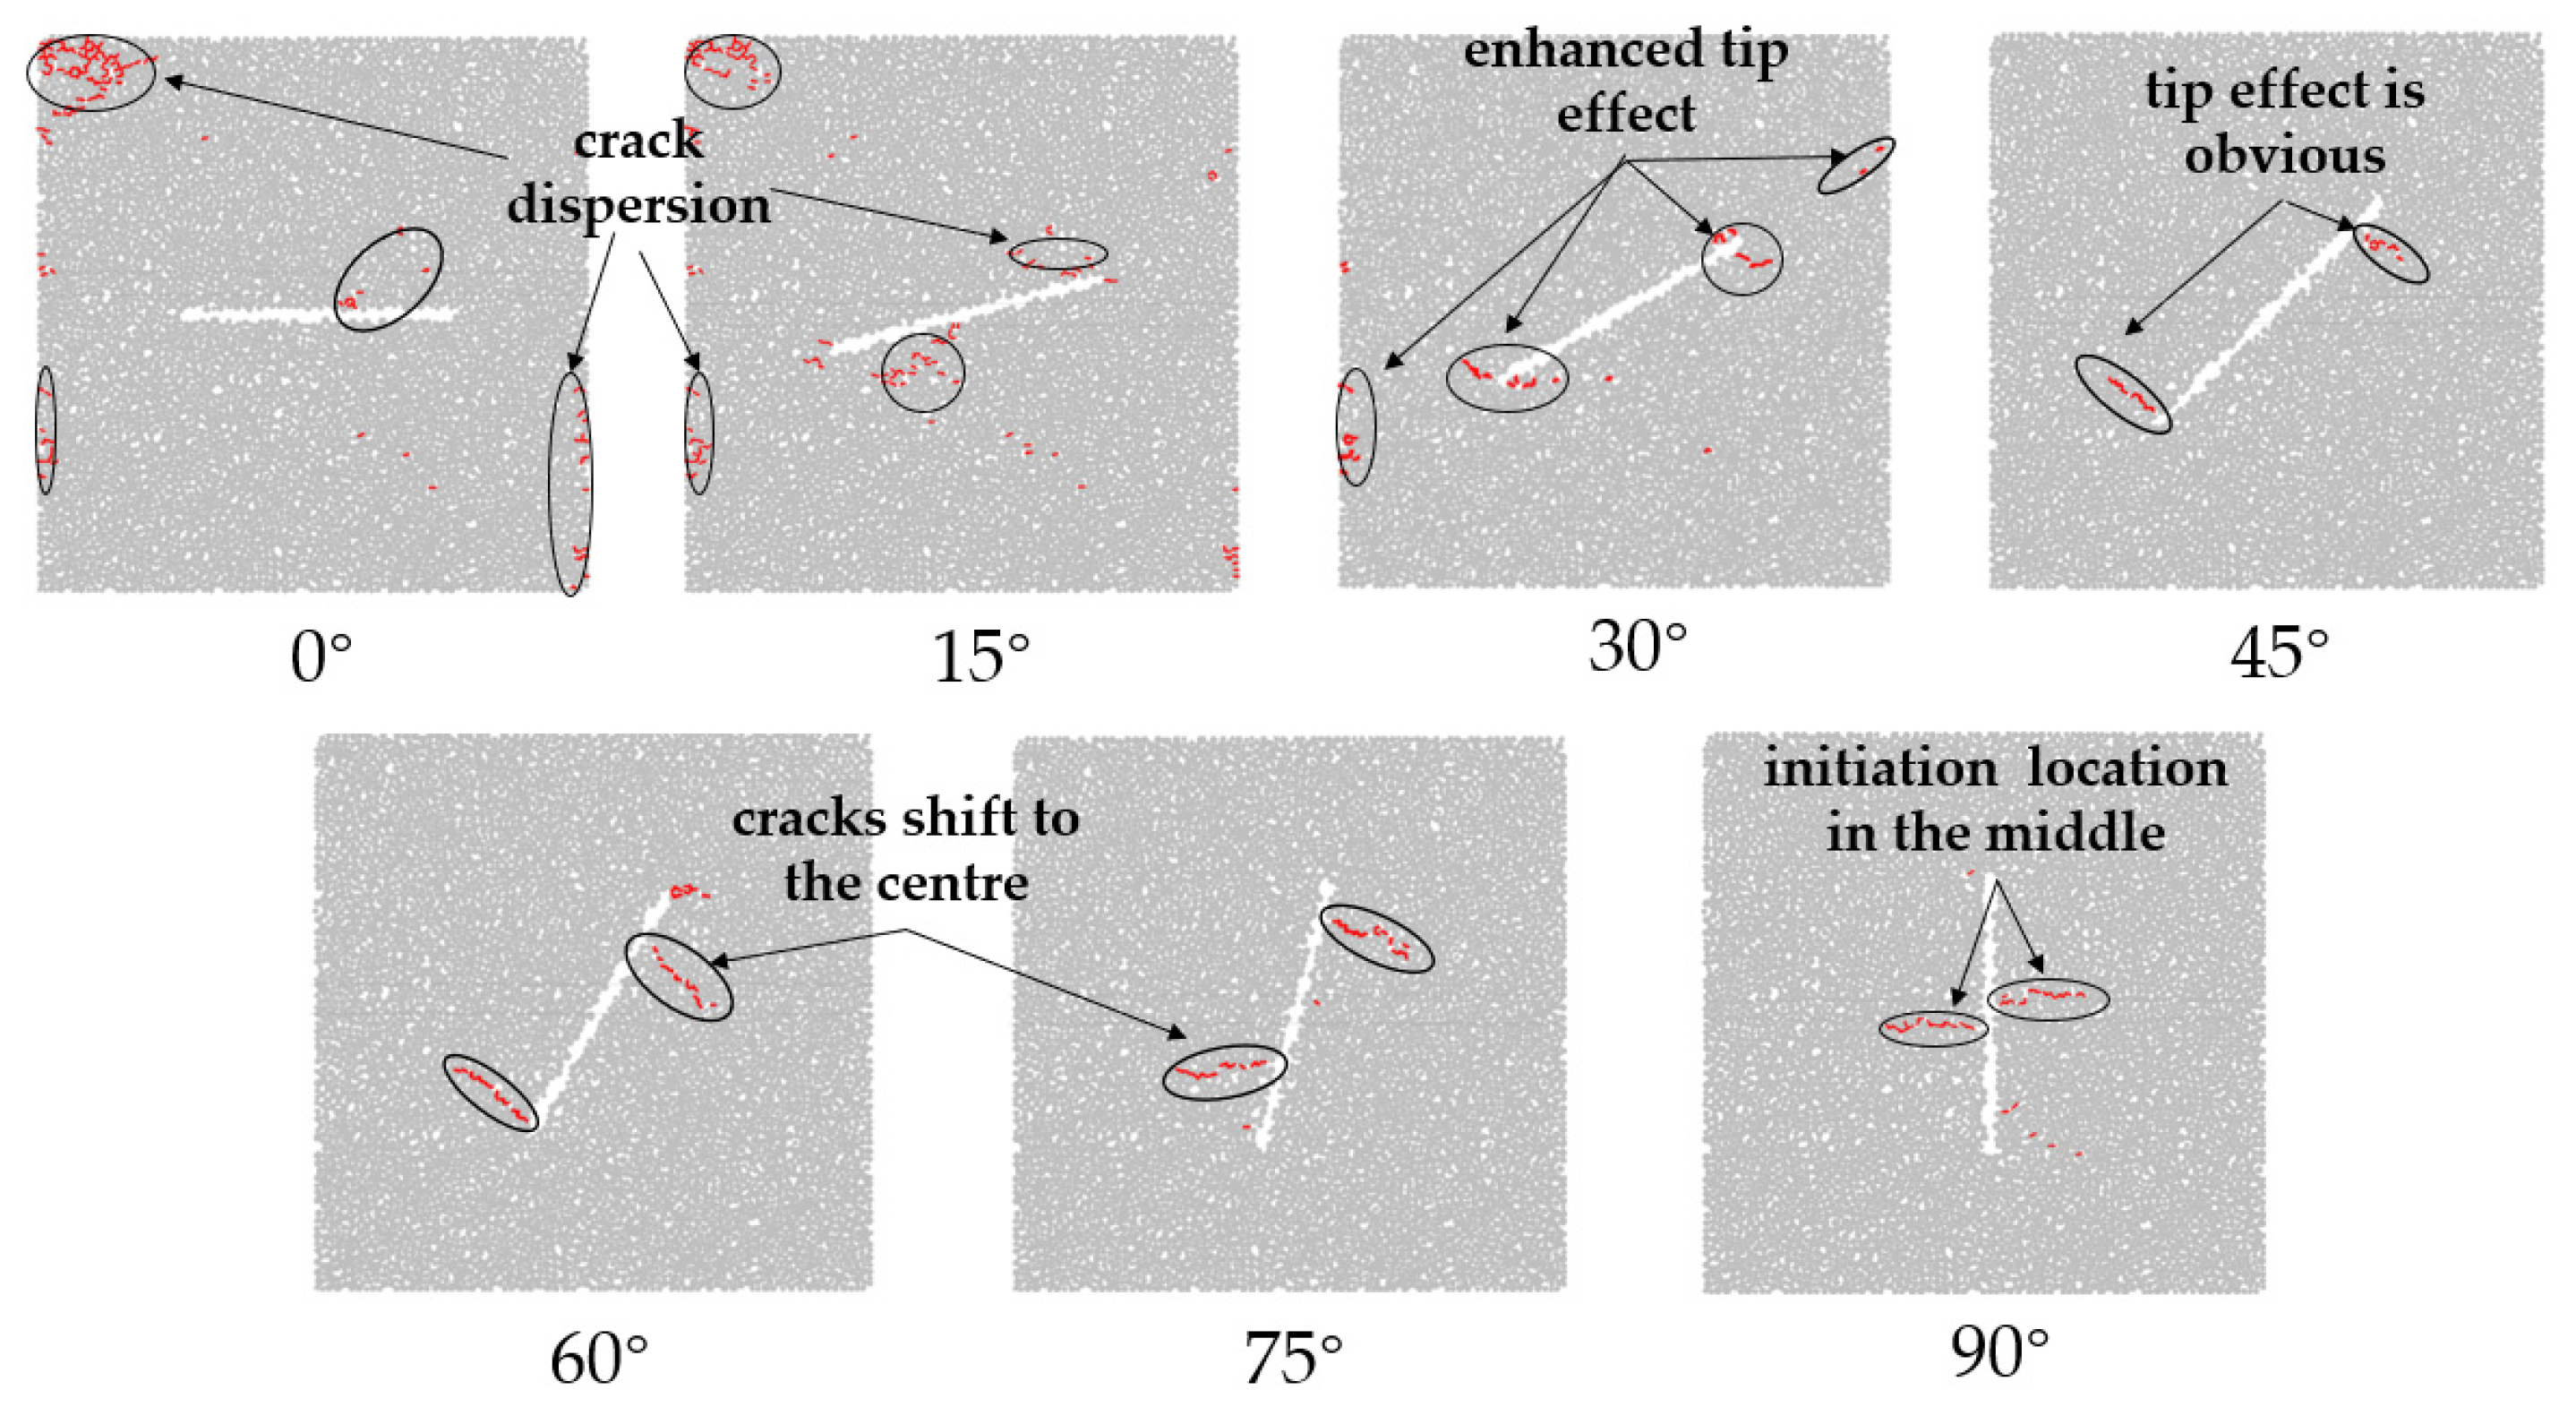
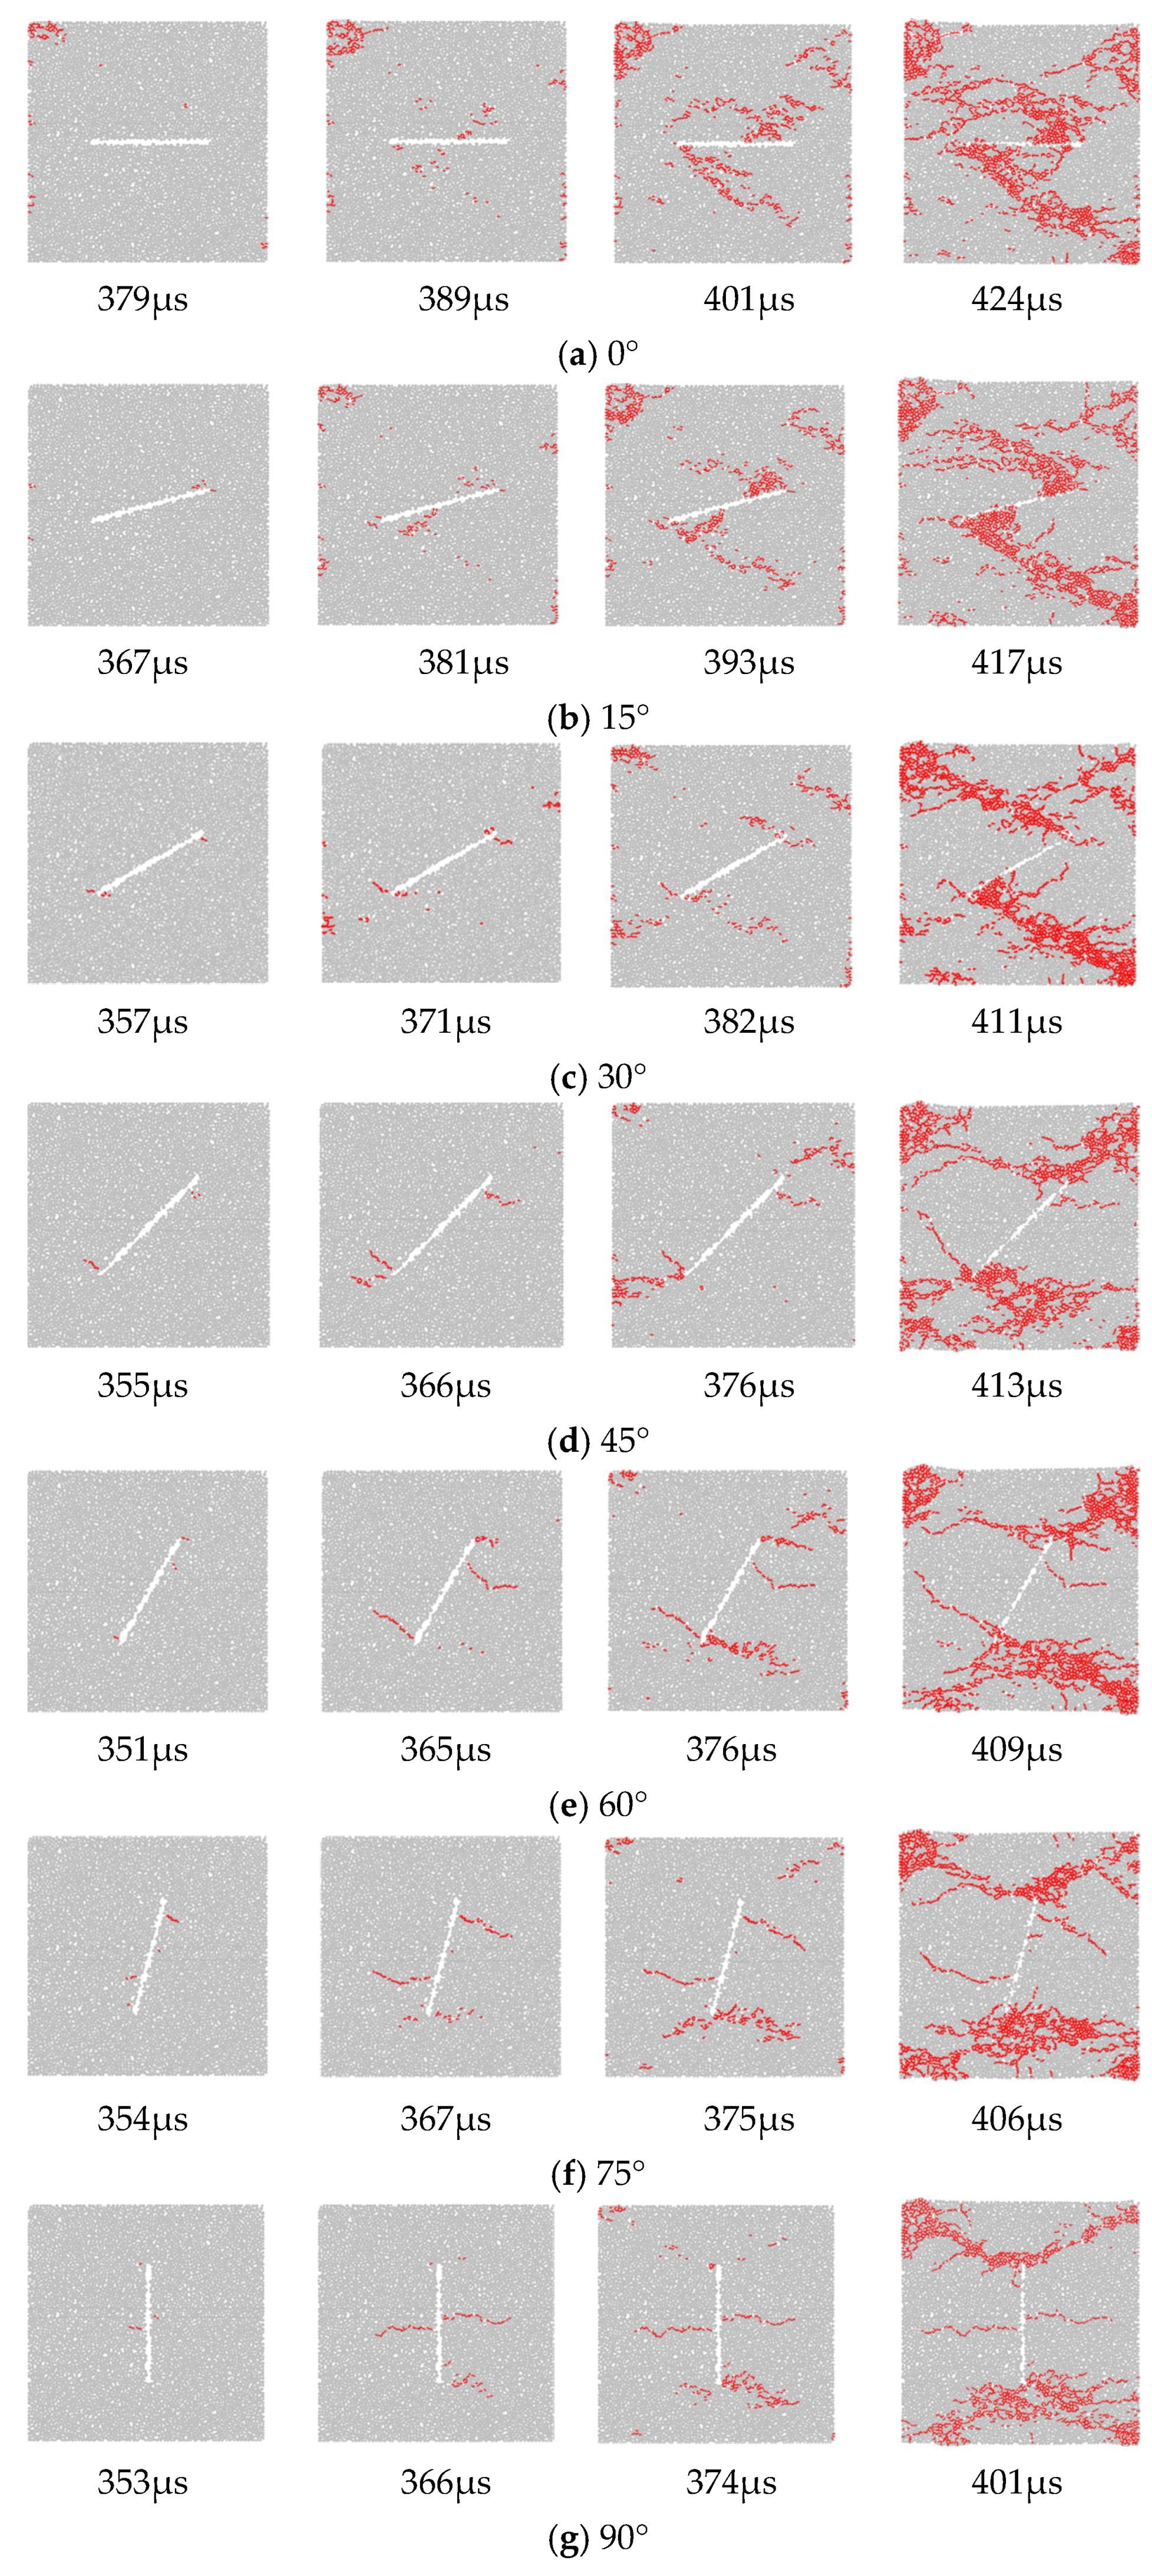
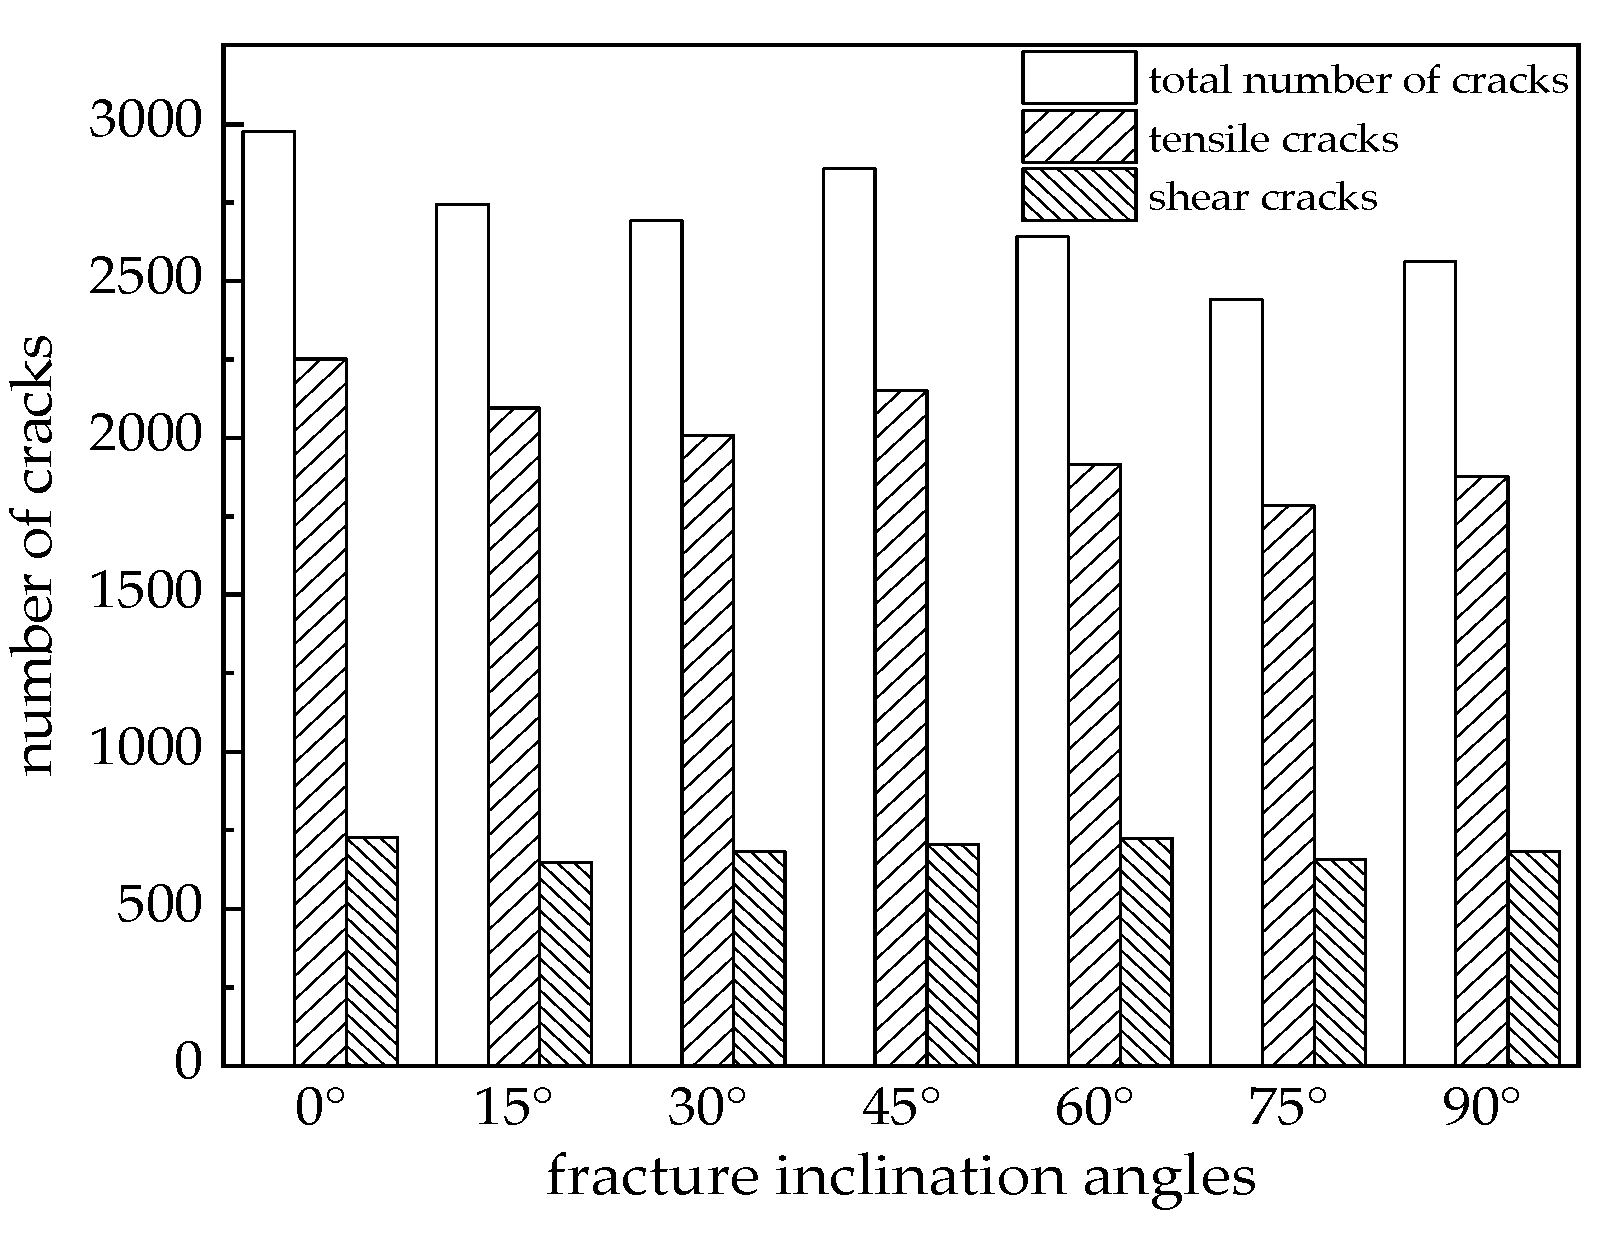
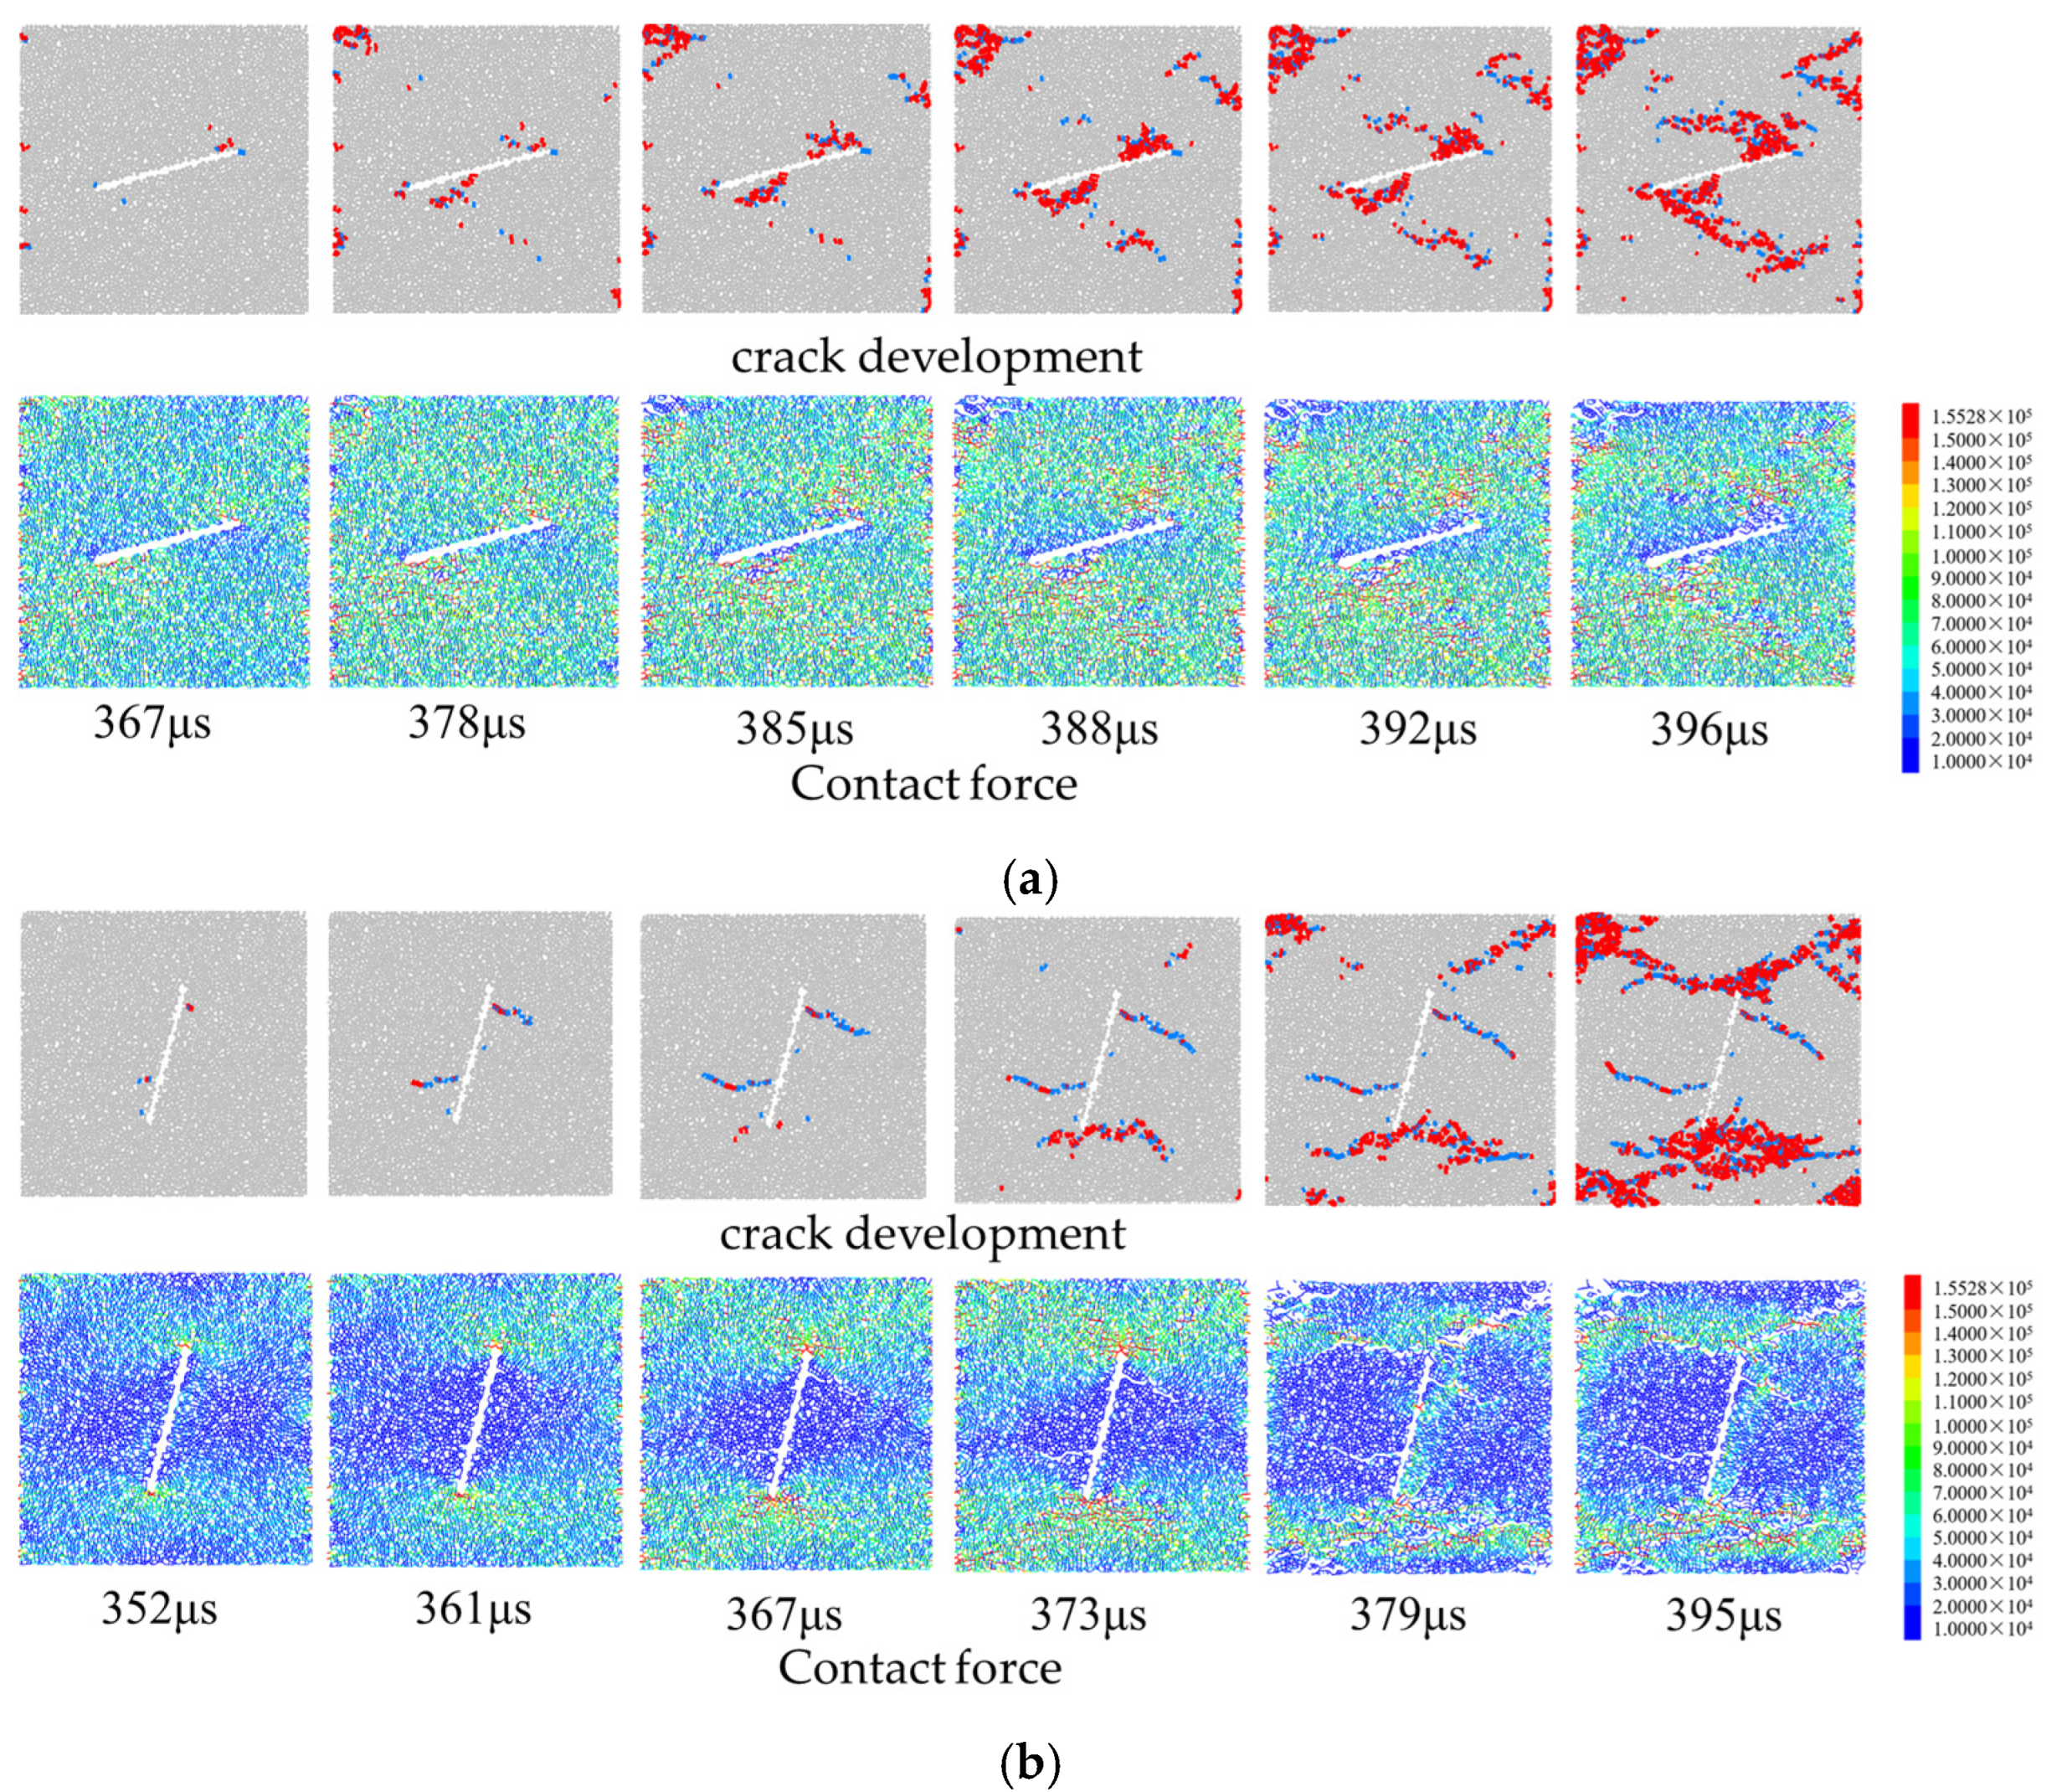
3.3. The Influence Laws of Fracture Inclination Angle on Cracks

Impact tests were conducted on specimens with fractures of different inclination angles at the same velocity, and crack initiation information was recorded. Figure 10 presents the crack initiation laws for specimens with various fracture inclination angles. As shown in Figure 10, when the fracture inclination angle is 0°, irregular cracks appear inside the specimen, and the tip effect is not pronounced at this time. Similar phenomena occur when the fracture angle is 15°, but there is an increase in cracks near the fracture, and the tip effect intensifies. When the fracture angle reaches 30°, the number of cracks near the fracture increases, and the tip effect continues to strengthen. For fracture inclination angles between 45° and 75°, cracks initiate only near the fracture tips, and there is a trend for the crack initiation locations to shift toward the middle of the fracture. When the fracture angle reaches 90°, cracks initiate in the middle of the fracture and develop axially. This demonstrates that as the fracture inclination angle increases, the crack initiation locations gradually shift towards the middle of the fracture, and there is a tendency for cracks to develop in a direction parallel to the impact load.
Figure 11 illustrates the crack development laws in fractured specimens under impact load. The figure shows that the failure of specimens with fractures of different inclination angles consists of both wing and secondary cracks. Wing cracks typically initiate near the prefabricated fracture and propagate through the specimen along the loading direction, while secondary cracks generally emerge after the appearance of wing cracks. From Figure 11a–c, it can be seen that once the cracks initiate, the cracks that emerge inside the specimen all develop towards the fracture tip.
In Figure 11d, at 355 µs, wing cracks initiate at the fracture tip and propagate along the loading direction. By 376 µs, secondary cracks appear on the upper part of the fracture and rapidly develop, concurrent with the rapid propagation of wing cracks. Ultimately, at 413 µs, the wing cracks penetrate the entire specimen. The same phenomenon also occurs in Figure 11e,f. In Figure 11g, secondary cracks appear above and below the main fracture at 366 microseconds, and these secondary cracks rapidly develop within the subsequent 35 microseconds, forming an “X”-shaped failure pattern. From the perspective of the time taken for complete penetration of the specimen, as the fracture inclination angle increases, the time required for specimen penetration gradually decreases, indicating that it is more difficult for failure to occur when the fracture angle is parallel to the direction of the impact load. The reason is that, under the same energy, cracks randomly emerge inside the specimen in Figure 11a, with relatively fewer cracks participating in the specimen’s penetration. Since crack development requires energy, more energy is needed for specimen penetration.
The statistical results of crack information in specimens with different fracture inclination angles are shown in Figure 12. It can be observed from the figure that the dynamic cracks in the fractured specimens are dominated by tensile cracks, with shear cracks playing a secondary role. As the fracture inclination angle increases, the total number of cracks in the specimens fluctuates between 2441 and 2977, with a variation amplitude accounting for approximately 18% of the maximum crack count. The number of tensile cracks in the specimens fluctuates between 1785 and 2251, with a variation amplitude accounting for about 20.7% of the maximum tensile crack count. The number of shear cracks in the specimens fluctuates between 648 and 726, with a variation amplitude accounting for approximately 10.7% of the maximum shear crack count. Changes in the fracture inclination angle of the specimens under impact have the greatest influence on tensile cracks, followed by the total number of cracks, with the least influence on shear cracks.
To analyze the variation of tensile crack count during the impact failure process of fractured red sandstone models, the ratio of tensile crack count to the total crack count, denoted as k, is defined as the tensile failure ratio. Figure 13 illustrates the evolution of the tensile ratio k for red sandstone models with different fracture inclination angles. Before 350 μs, the stress wave had not yet reached the specimen interface; thus, no cracks were observed. After 500 μs, the specimen is entirely fragmented and loses its load-bearing capacity, at which point the tensile ratio k remains unchanged. Therefore, the study focuses on the variation of k within the time interval of 350~500 μs. From the figure, it can be observed that when the fracture inclination angle is 0°, 15°, and 30°, the tensile ratio k of the fractured red sandstone models is greater than 0.5 throughout the impact process, indicating that tensile failure dominates the entire failure process. When the inclination angle is 45°, during the initial stage of the impact, the tensile ratio k is less than 0.5, indicating that shear failure dominates at this stage, while tensile failure prevails for the remainder of the process. When the fracture inclination angle is 60°, a shear crack first initiates at the onset of fracture in the red sandstone model, followed by a continuous increase in the number of tensile cracks surpassing that of shear cracks. This results in the k value curve rapidly increasing from 0 to above 0.5 and remaining above 0.5 thereafter. When the fracture inclination angle is 75° and 90°, the k value is less than 0.5 during the initial and middle stages of the impact failure process, indicating that shear failure dominates during these stages. However, in the later stages, tensile cracks rapidly form, causing the k value to increase and eventually stabilize near 0.7.
Figure 14 compares the crack development patterns and corresponding contact forces for fracture inclination angles of 15° and 75°. In the crack development diagrams, red and blue cracks represent tensile and shear cracks, respectively. At a 15° inclination angle, tensile cracks dominate with smaller stress concentration in the contact force distribution. At a fracture inclination angle of 75°, shear cracks dominate the crack propagation before 373 μs, accompanied by pronounced stress concentration. This indicates that the duration of shear-dominated failure increases with larger inclination angles, which is attributable to stress concentration at the fracture tips. In Figure 14b, stress redistribution between 373 μs and 379 μs triggers extensive tensile crack formation, causing the tensile ratio k to progressively exceed 0.5.
Figure 15 presents the relationship curve between the tensile failure ratio k and the fracture inclination angles at the final failure stage of the fractured model. As observed from the figure, with the increase in the fracture inclination angle, the tensile failure ratio k generally exhibits a downward trend, indicating that the role of tensile failure gradually becomes less significant during the final failure stage of the specimen. When the fracture inclination angle is 60°, the tensile failure ratio reaches its minimum value of 0.725, at which point tensile failure plays the smallest role. Within the range of fracture inclination angle from 0° to 90°, the tensile failure ratio k is greater than 0.7, suggesting that tensile failure dominates the failure process.

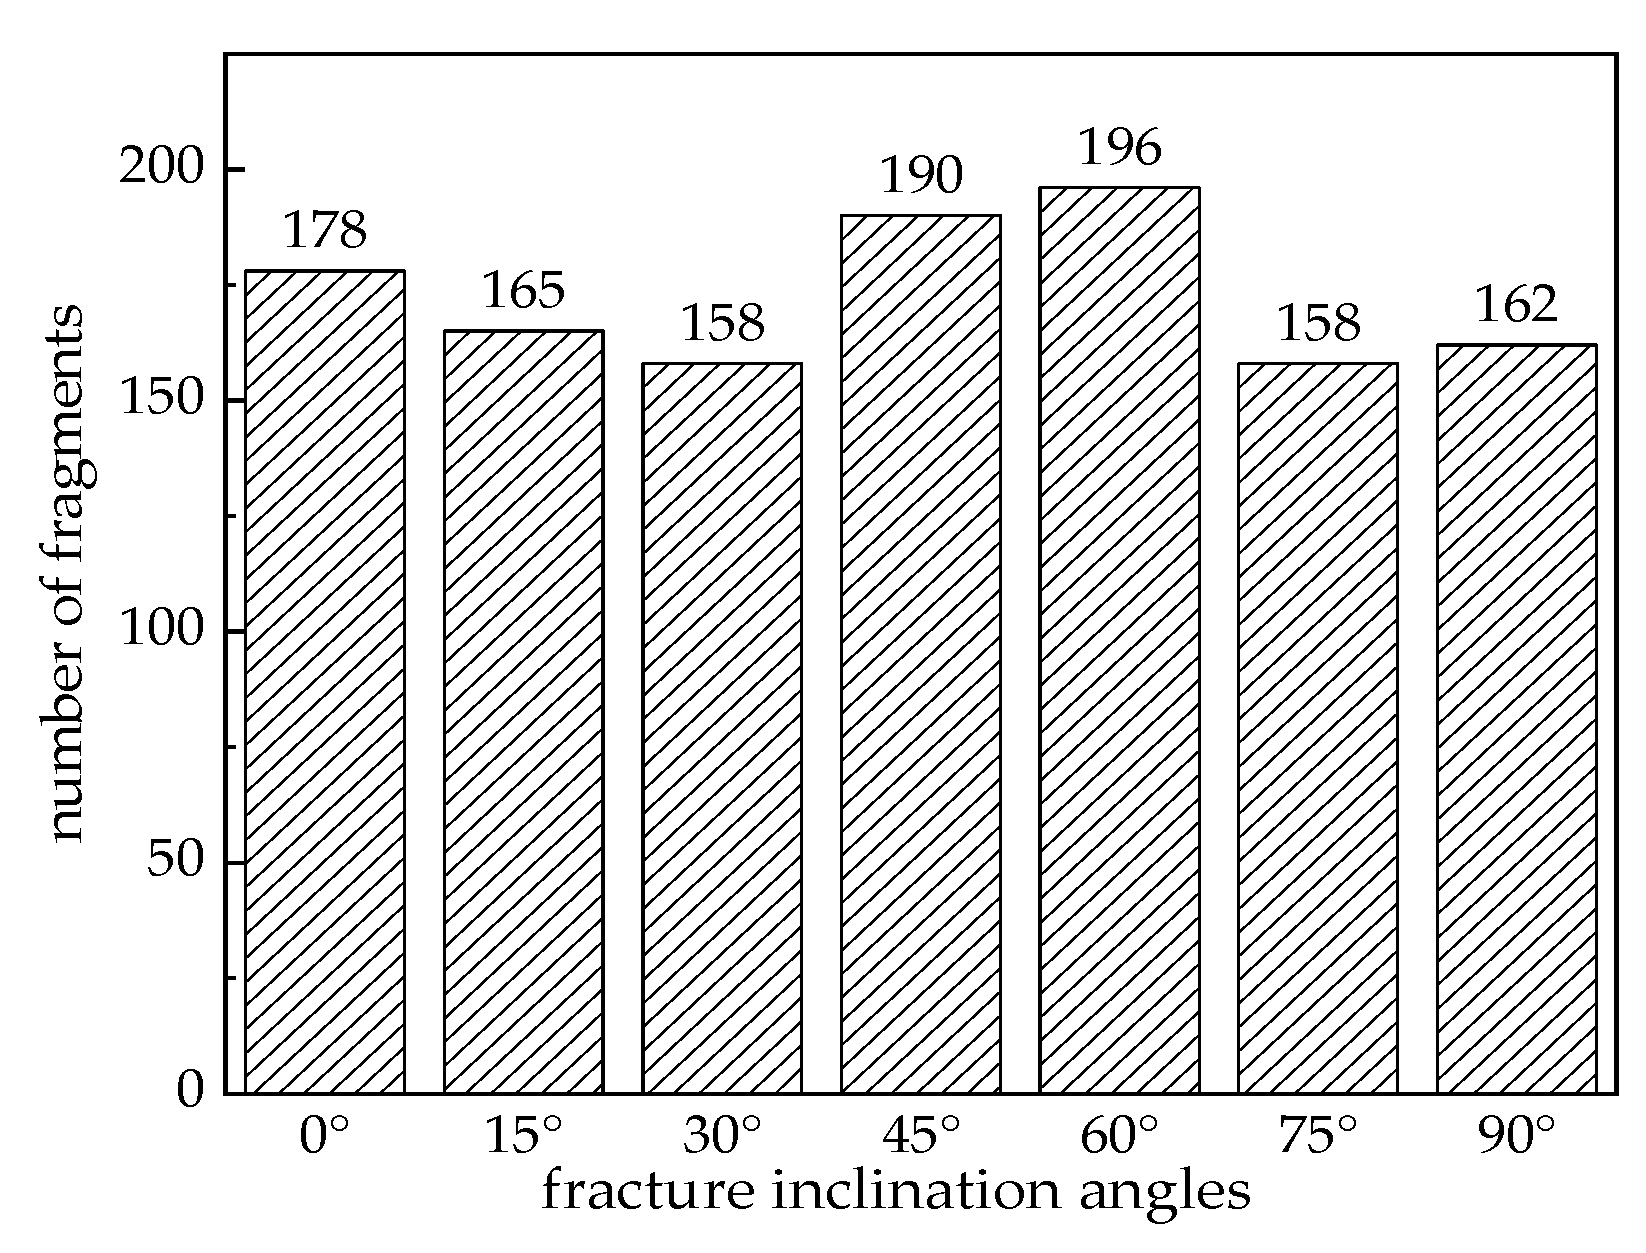
3.4. The Influence of Fracture Inclination Angle on Fragmentation

The fragment information was recorded using the FISH command to investigate the influence of fracture inclination angle on the number of fragments generated during the failure of specimens under impact. Figure 16 presents the final failure states of specimens with fractures of different inclination angles. It can be observed from the figure that, except for the specimens with 0° and 15° fracture inclinations, the failure zones of the other specimens are located near one end of the fracture and at the end of the specimen. The large fragments in the failure diagrams are mainly concentrated around the left and right sides of the fracture, while small pieces are mainly produced near the through cracks as they develop. With the increase in fracture inclination, the degree of fragmentation at the top and bottom of the specimen increases.
To further investigate the influence of fracture inclination angles on the number of fragments generated during the final failure of specimens, the number of fragments produced by the final failure of the specimens was recorded, as shown in Figure 17. It can be observed from the figure that the number of fragments generated by the final failure of the specimen is the highest when the fracture inclination is 60°, followed by the specimen with a 45° fracture inclination.
Figure 18 presents the curves of the cumulative number of fragments over time for specimens with fractures of different inclinations. It can be observed from the figure that the curves of cumulative fragment count for specimens with different fracture inclination angles share a similar shape. During the initial loading stage, before 408 microseconds, the specimen with a 90° fracture inclination produced the highest number of fragments compared to other specimens, indicating the most significant degree of fragmentation and the weakest resistance to failure. Conversely, before 425 microseconds, the specimen with a 0° fracture inclination produced the fewest fragments compared to others, showing the least degree of fragmentation and the strongest resistance to failure.

3.5. Energy Evolution

Rock damage is fundamentally an energy-driven process. Analyzing the energy evolution laws of fractured rock holds scientific significance for underground engineering design and construction. Energy evolution is a critical indicator for crack initiation and propagation in fractured rock, making the study of the influence of fracture inclination angle on energy evolution particularly consequential. The formulas for calculating incident energy ( E I ), reflected energy ( E R ), transmitted energy ( E T ), and absorbed energy ( E A ) during the failure process of fractured red sandstone are as follows [50]:
E I = A e ρ e C e 0 t σ 2 I ( t ) d t
E R = A e ρ e C e 0 t σ 2 R ( t ) d t
E T = A e ρ e C e 0 t σ 2 T ( t ) d t
E A = E I E R E T
σ I t , σ R t and σ T t represent the stress–time histories of the incident, reflected, and transmitted waves, respectively, while parameters C e and ρ e denote the longitudinal wave speed and density of the elastic bar.
Table 3 presents the incident, reflected, transmitted, and absorbed energies of specimens with fractures at various inclination angles. The fracture inclination angle has a minimal influence on the absorbed energy, with most energy being dissipated as incident and transmitted components.
Figure 19 illustrates the variation curves of absorbed energy, total crack count, and fragment number versus fracture inclination angle. The absorbed energy and total crack count curves demonstrate similar trends, both generally decreasing with increasing inclination angle, indicating that absorbed energy facilitates crack propagation. In contrast, no clear correlation exists between the absorbed energy and the number of fragments.

4. Conclusions

This study employs particle flow software to simulate dynamic impact load tests on red sandstone with fractures at different inclination angles under the same impact condition. The tensile ratio k is introduced to systematically analyze the evolution characteristics of tensile and shear failure mechanisms throughout the fracture process while investigating the relationship between energy dissipation and both the number of cracks and fragments. The following conclusions are drawn from the study:
(1)
Under the same impact load, the dynamic compressive strength of the fractured specimens exhibits an overall “V”-shaped trend, with the specimen having a 45° fracture inclination exhibiting the minimum dynamic compressive strength. When the fracture inclination is within the 30° to 45° range, its influence on the dynamic compressive strength is most significant.
(2)
With increasing fracture inclination, the reflection coefficient increases while the transmission coefficient decreases, leading to greater stress wave attenuation and a more pronounced weakening effect on wave propagation. Additionally, an increase in the fracture inclination angle results in a shortened failure time of the specimen, making it more susceptible to damage.
(3)
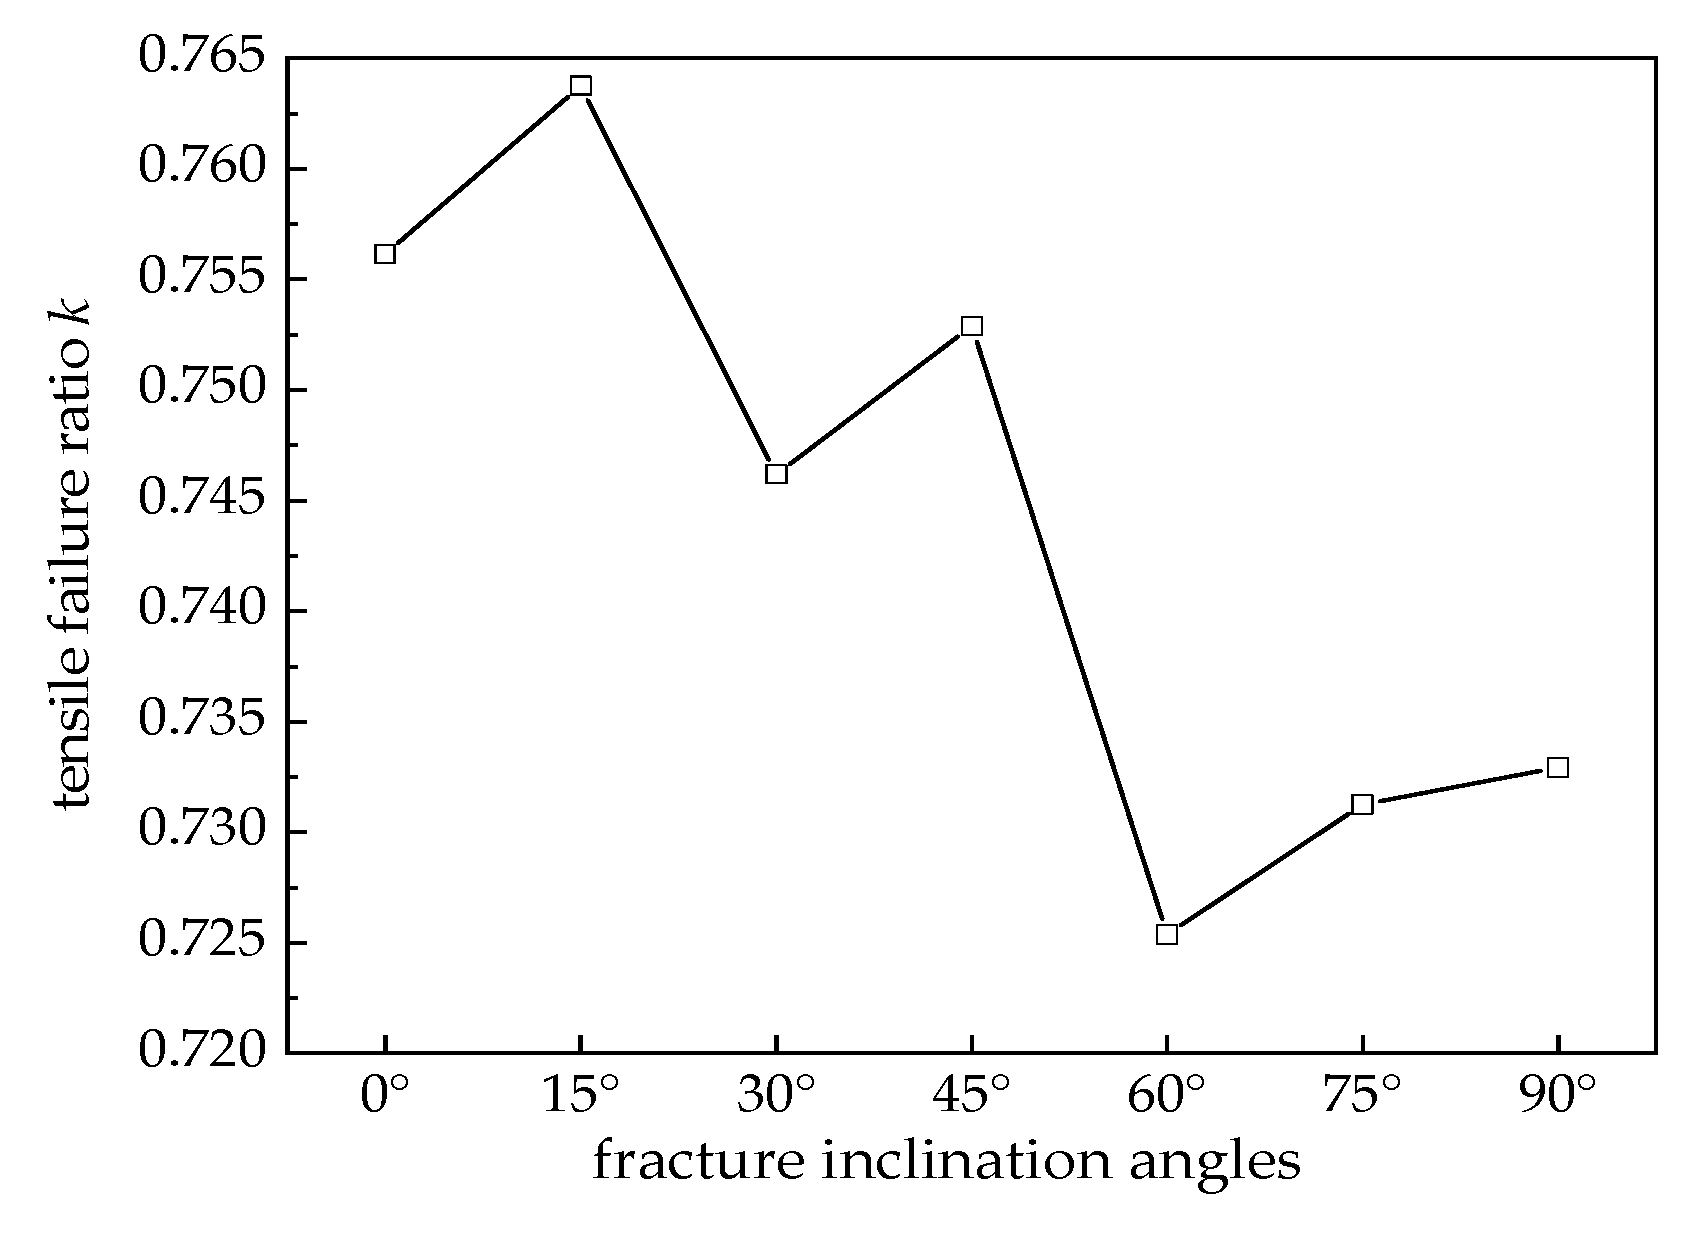
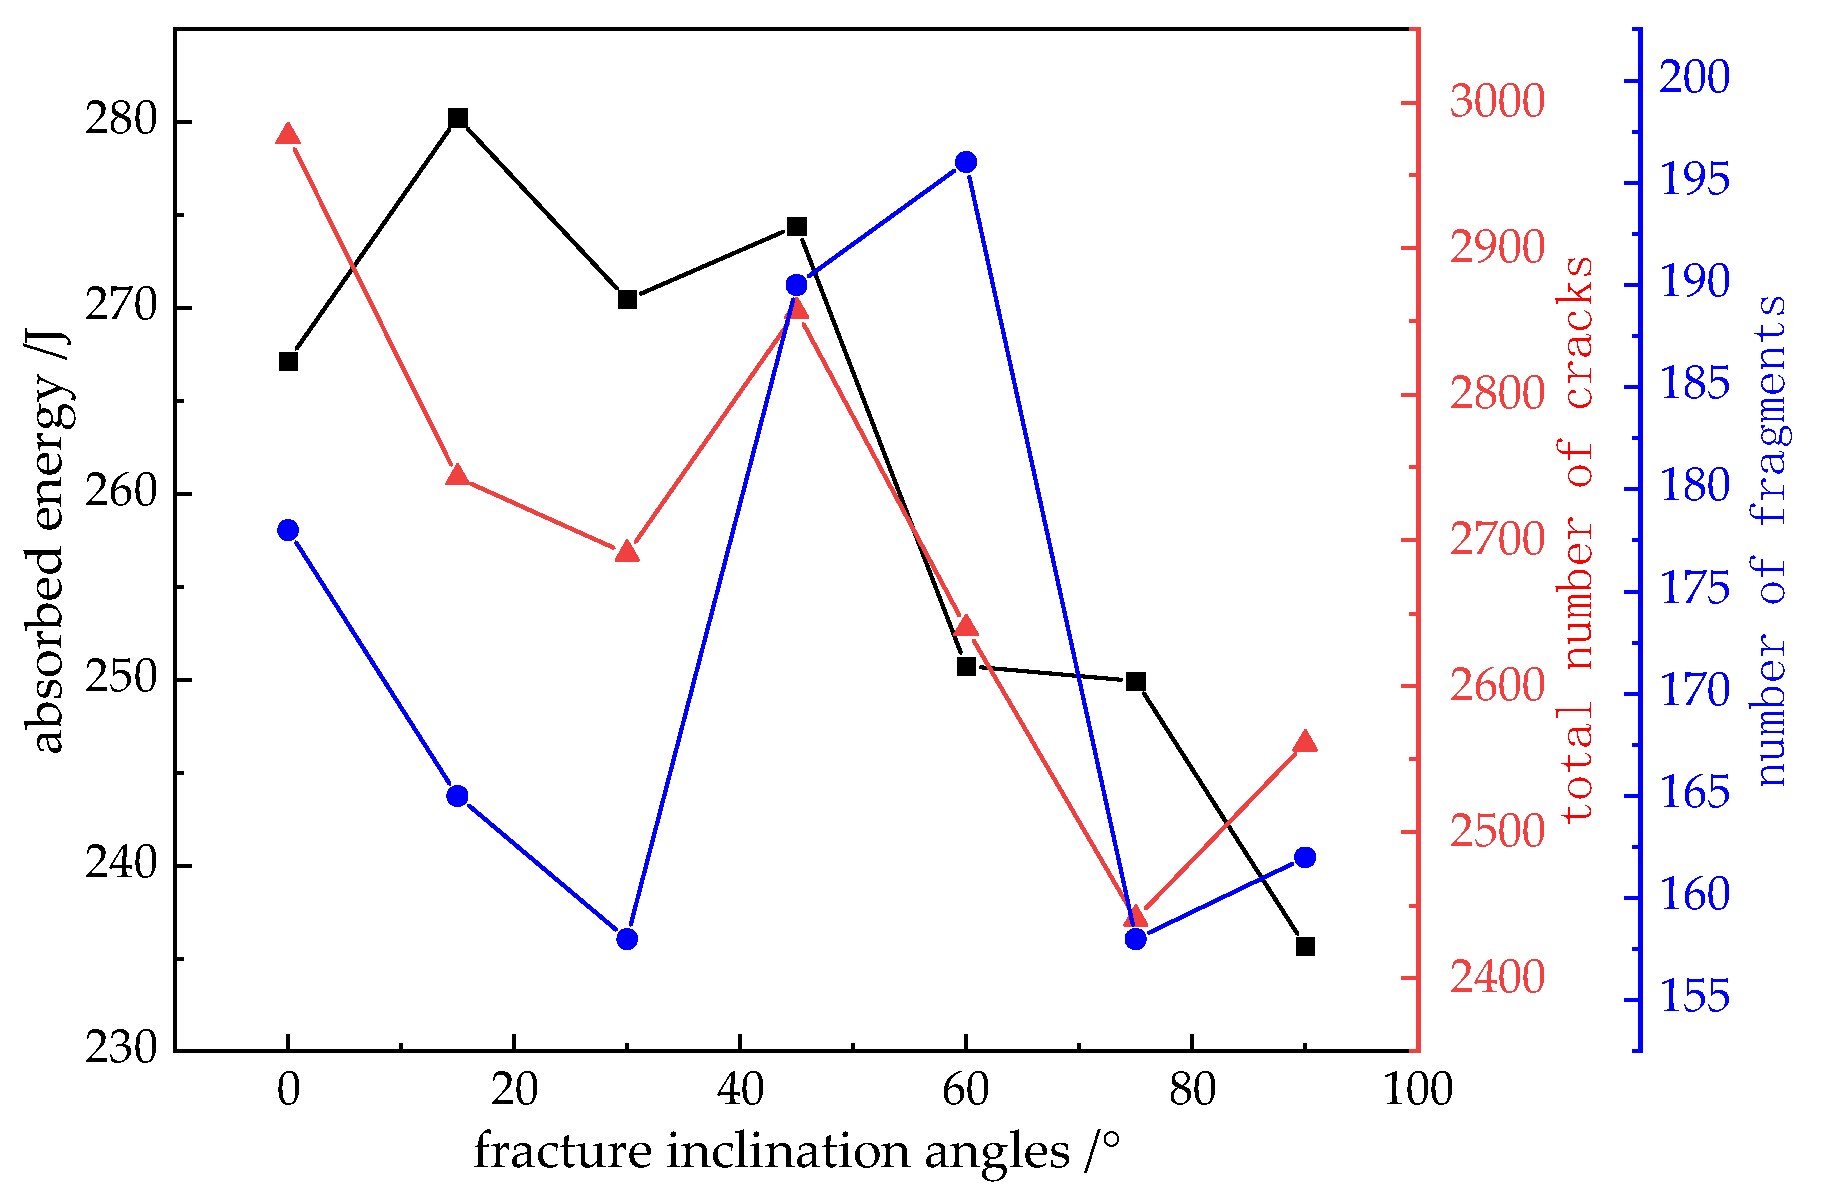
As the fracture inclination angle increases, the initiation location of cracks in the specimen gradually shifts towards the middle of the fracture, exhibiting a tendency to develop in a direction parallel to the impact load. When the inclination angle is ≥45°, stress concentration at fracture tips prolongs the shear-dominated phase during failure progression. However, the tensile ratio k consistently exceeds 0.7 at ultimate failure, indicating tensile mechanisms remain the dominant failure mode. Both absorbed energy and total crack number generally decrease with increasing inclination angle, while no clear correlation exists between absorbed energy and fragment number.
(4)
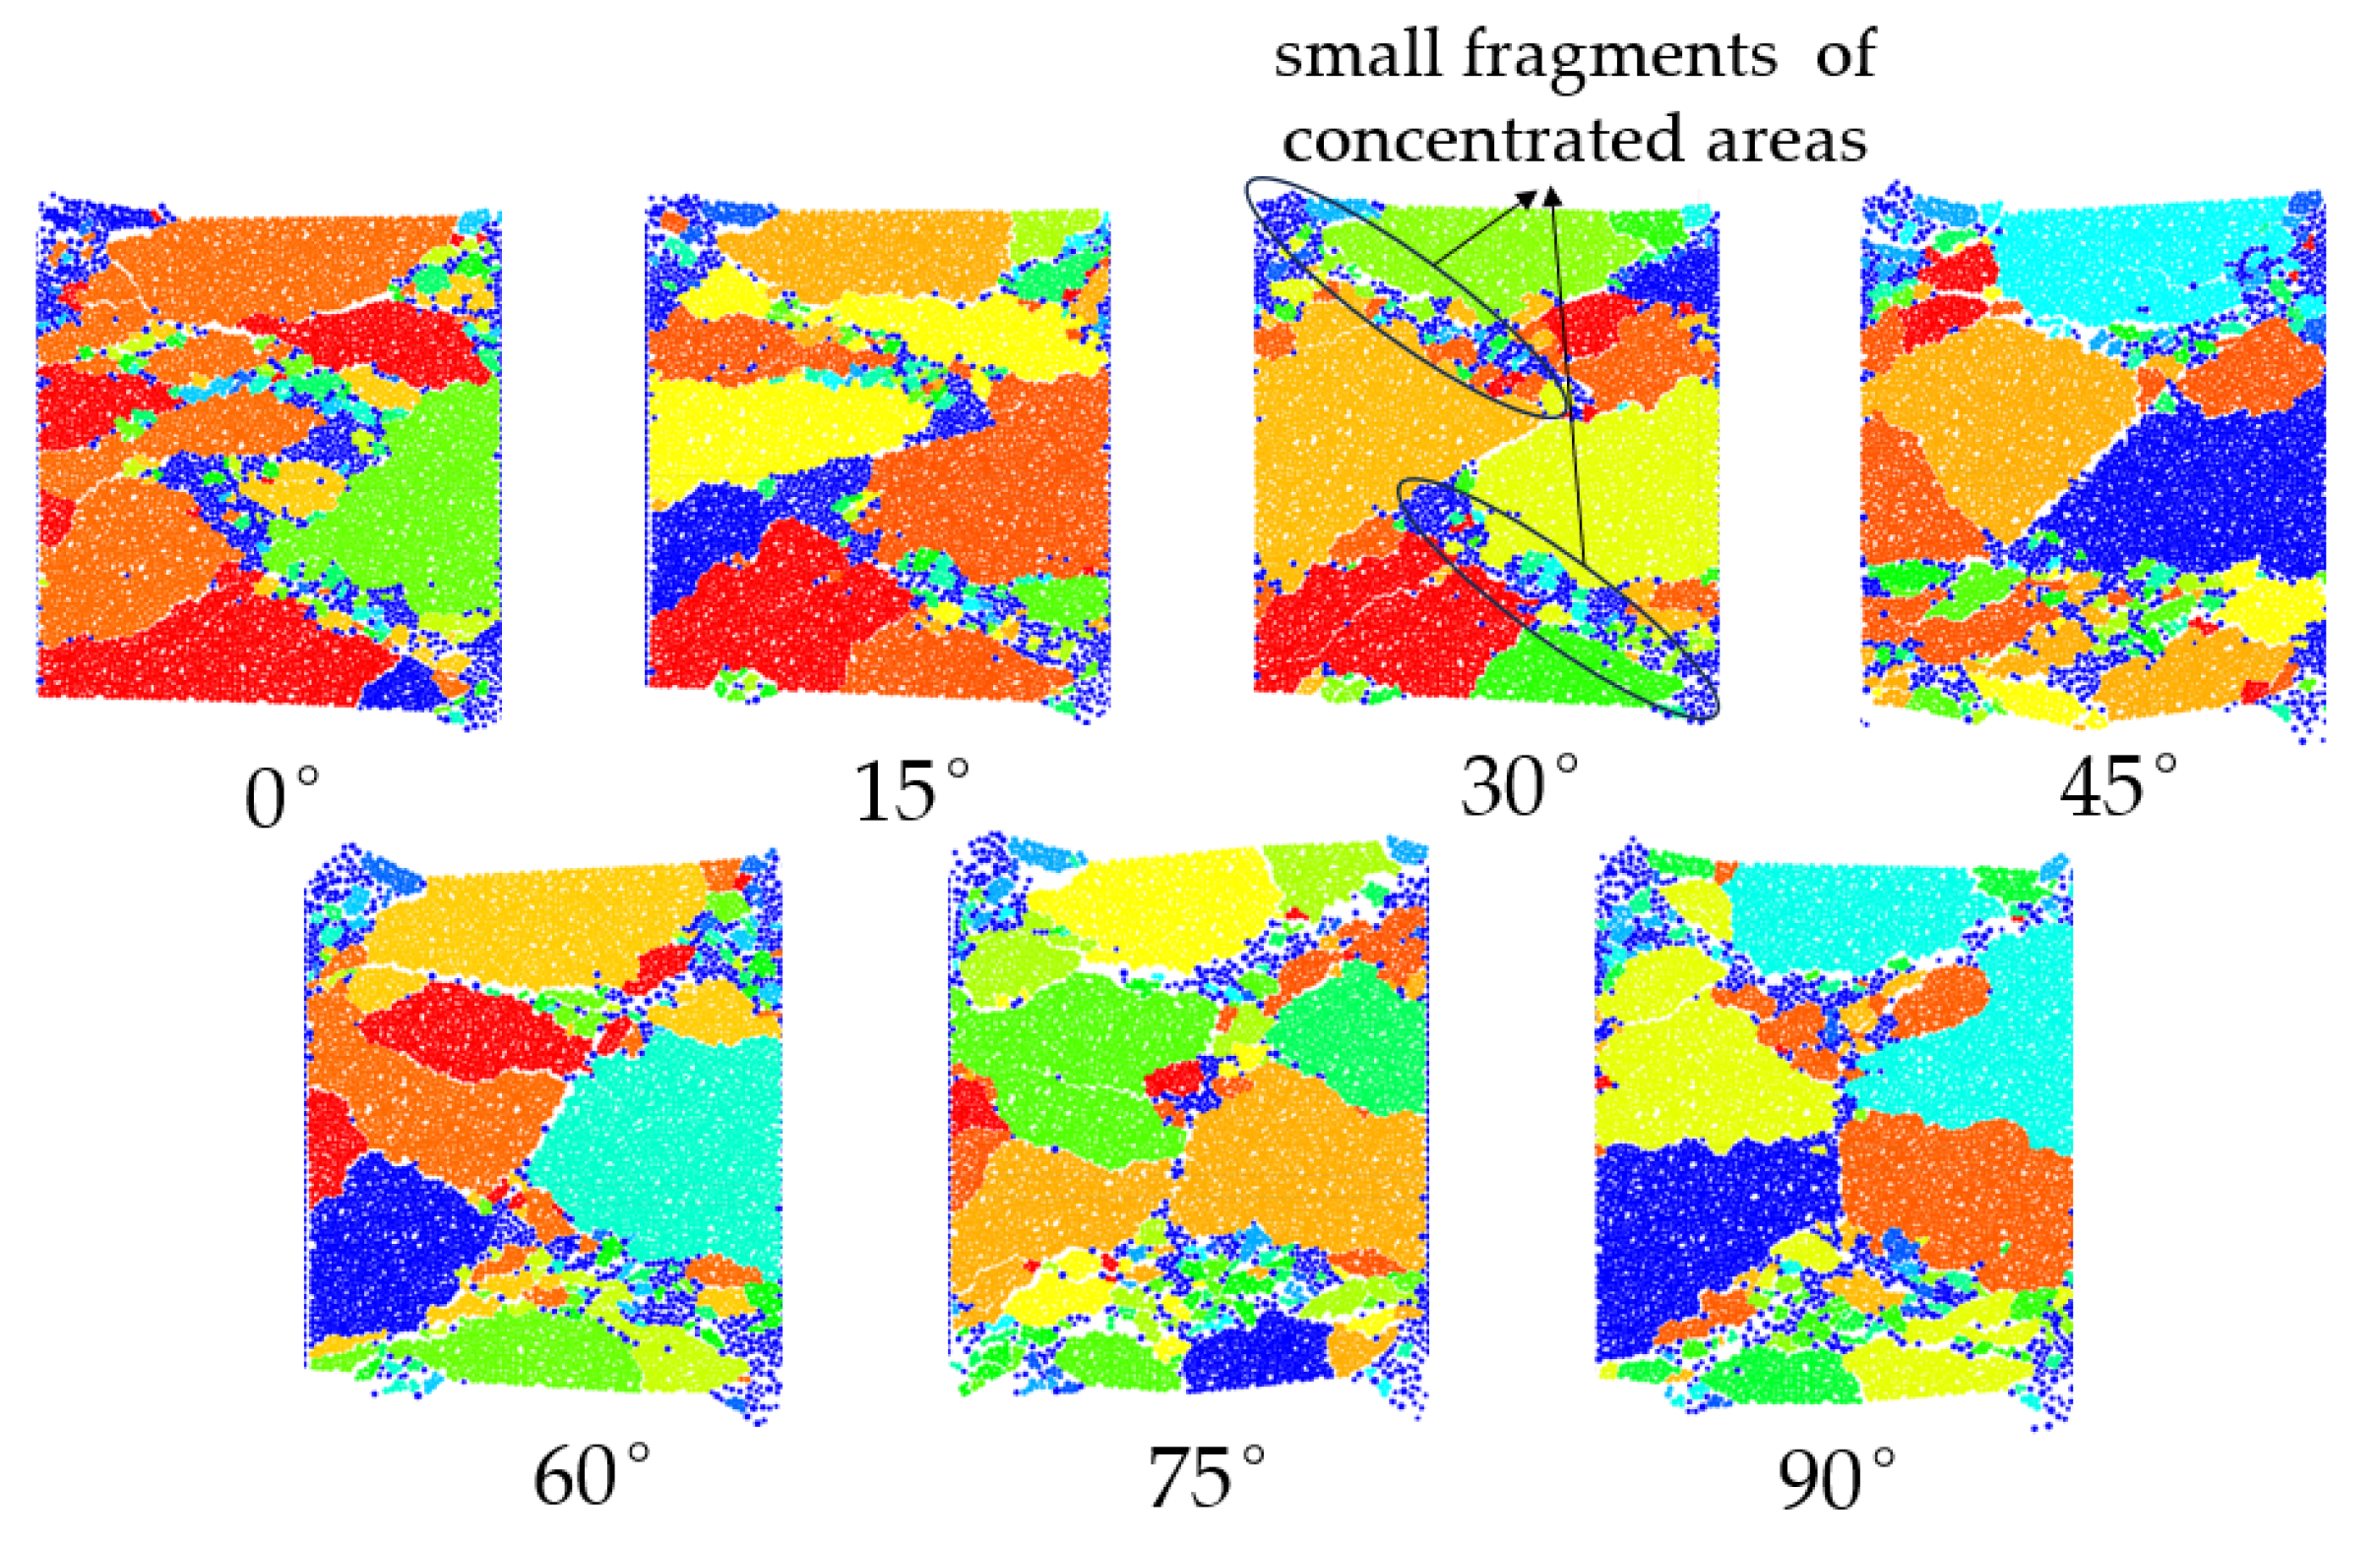
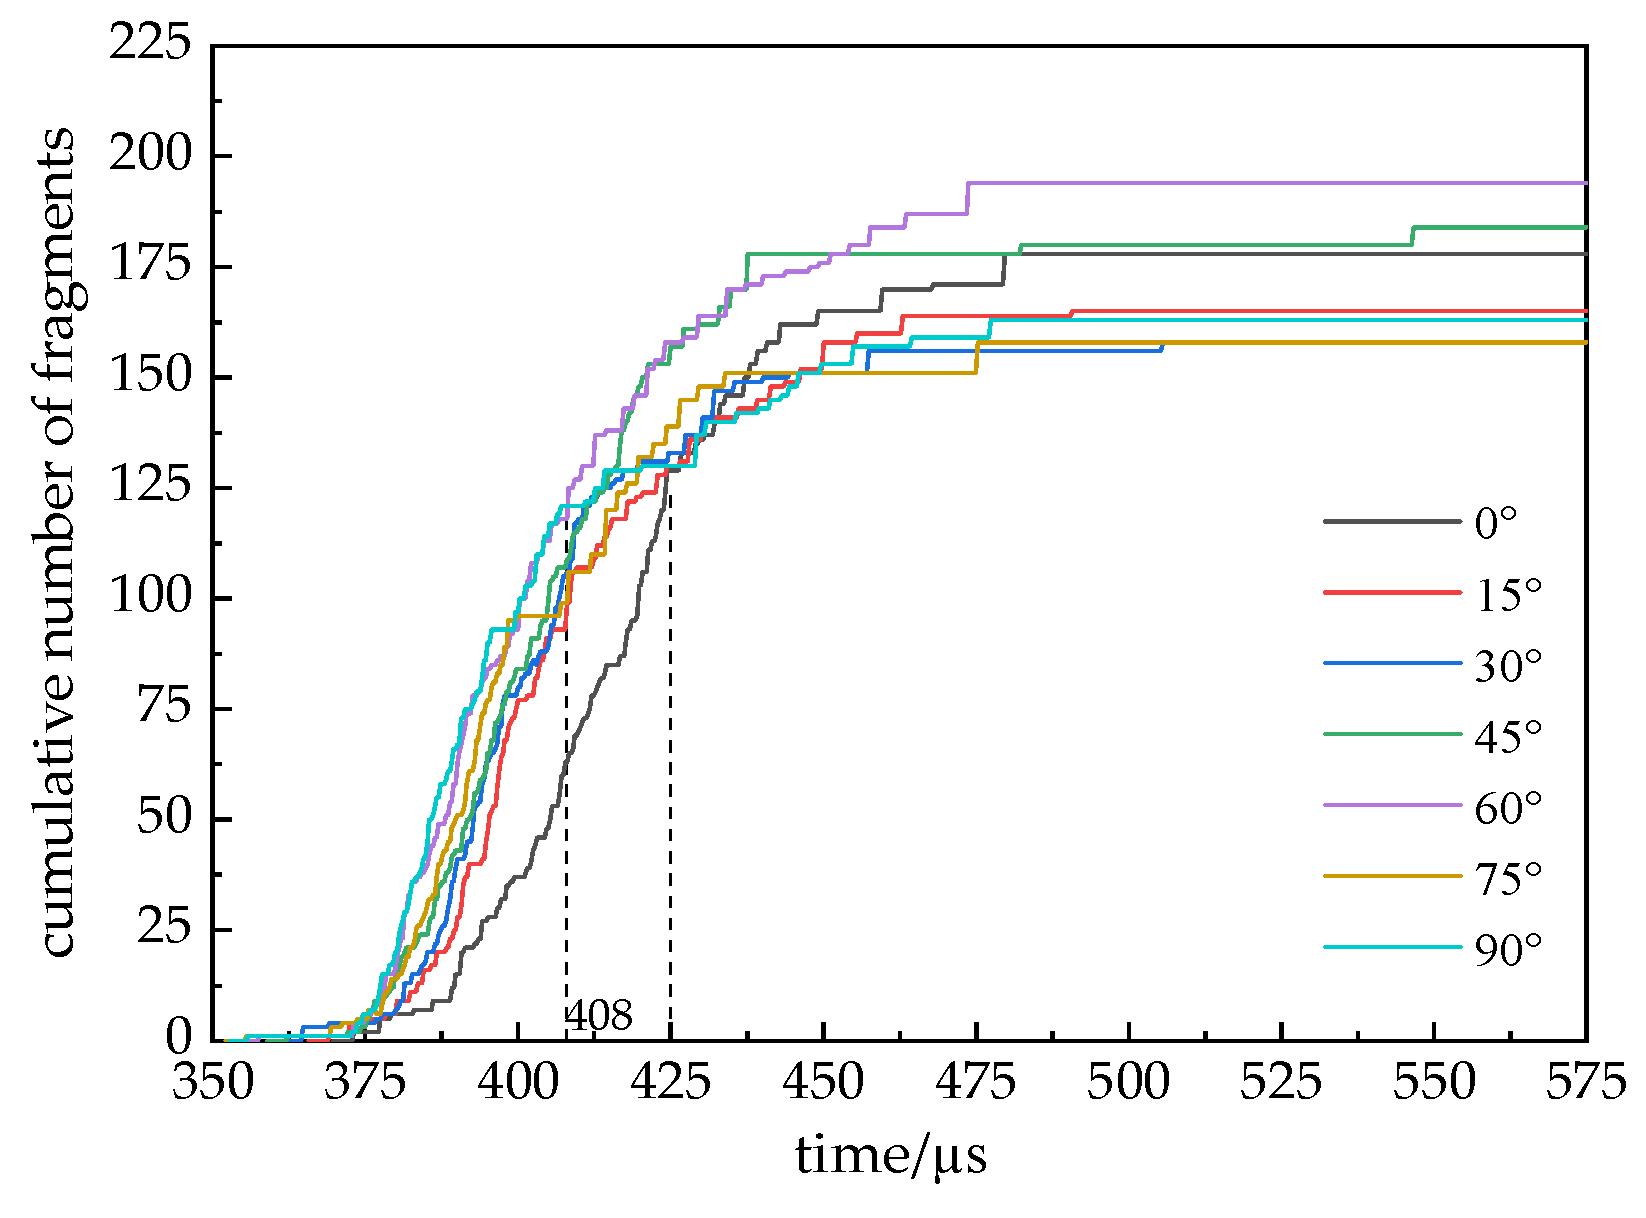
Throughout the entire fragmentation process, large fragments are primarily distributed on the left and right sides of the fracture, while smaller fragments concentrate near the through cracks. When the fracture inclination angle is 45° and 60°, the cumulative number of fragments produced during the specimen’s failure is higher, indicating a more significant degree of fragmentation under these two inclination angles. During the initial loading stage, the specimen with a 90° inclination angle exhibits the weakest resistance to failure. In contrast, the specimen with a 0° inclination angle demonstrates the strongest resistance to failure.
The study primarily focuses on analyzing the influence of single fracture inclination angles on the dynamic mechanical properties, stress wave attenuation, and crack evolution of red sandstone. However, certain limitations remain in the research. The effects of the number, width, and geometric configurations of fractures in red sandstone cannot be overlooked. Additionally, incorporating triaxial and Brazilian splitting test simulations can significantly expand the research depth and scope. It is recommended that future research explore these two aspects in greater detail.

Author Contributions

Y.Z.: software, data curation and writing—original draft; C.Z.: supervision, funding acquisition; W.H.: resources and writing—review and editing. All authors have read and agreed to the published version of the manuscript.

Funding

This work was supported by the Program of the National Natural Science Foundation of China (51604127) and the Ganzhou Science and Technology Programme of China (202101094905).

Data Availability Statement

Additional data will be available upon request.

Conflicts of Interest

The authors declare no conflicts of interest.

References

  1. Fan, D.R.; Liu, X.S.; Tan, Y.L.; Li, X.B.; Yang, S.L. Energy mechanism of bolt supporting effect to fissured rock under static and dynamic loads in deep coalmines. Int. J. Min. Sci. Technol. 2024, 34, 371–384. [Google Scholar]
  2. Jiang, X.D.; Xue, Y.G.; Ren, X.T.; Kong, F.M.; Liao, X.M. Dynamic response characteristics and damage calculation method of fractured rock mass under blasting disturbance. Int. J. Impact Eng. 2024, 192, 105036. [Google Scholar] [CrossRef]
  3. Feng, P.; Dai, F.; Liu, Y.; Xu, N.W.; Du, H.B. Coupled effects of static-dynamic strain rates on the mechanical and fracturing behaviors of rock-like specimens containing two unparallel fissures. Eng. Fract. Mech. 2019, 207, 237–253. [Google Scholar]
  4. Hu, J.; Wang, H.K.; Xia, Z.G.; Chen, B.; Gu, Q.H.; Wang, X.R.; Cao, J.P.; Liu, X. Mechanical properties and acoustic emission characteristics of two dissimilar layers of rock-like specimens with prefabricated parallel fissures. Geomech. Geophys. Geo-Energy Geo-Resour. 2024, 10, 19. [Google Scholar]
  5. Ayawah, P.E.A.; Kaba, A.G.A.; Gertsch, L.S. A novel approach for determining cutting geometry for TBM using full-scale laboratory linear rock cutting and PFC3D-based numerical simulations. Tunn. Undergr. Space Technol. Inc. Trenchless Technol. Res. 2024, 144, 105559. [Google Scholar]
  6. Jafri, T.H.; Yoo, H. REV Application in DEM Analysis of Non-Vibrational Rock Splitting Method to Propose Feasible Borehole Spacing. Appl. Sci. 2018, 8, 335. [Google Scholar] [CrossRef]
  7. Su, O. Numerical Modeling of Cuttability and Shear Behavior of Chisel Picks. Rock Mech. Rock Eng. 2019, 52, 1803–1817. [Google Scholar]
  8. Gutiérrez-Ch, J.G.; Senent, S.; Melentijevic, S.; Jimenez, R. Distinct element method simulations of rock-concrete interfaces under different boundary conditions. Eng. Geol. 2018, 240, 123–139. [Google Scholar] [CrossRef]
  9. Zheng, M.H.; Liang, Y.P.; Staat, M.; Li, Q.G.; Li, J.B. Discontinuous fracture behaviors and constitutive model of sandstone specimens containing non-parallel prefabricated fissures under uniaxial compression. Theor. Appl. Fract. Mech. 2024, 131, 104373. [Google Scholar]
  10. Yao, D.H.; Jiang, N.; Wang, X.J.; Jia, X.D.; Lu, K. Mechanical behaviour and failure characteristics of rocks with composite defects of different angle fissures around hole. Bull. Eng. Geol. Environ. 2022, 81, 290. [Google Scholar] [CrossRef]
  11. Haeri, H.; Sarfarazi, V.; Hedayat, A.; Tabaroei, A. Effect of tensile strength of rock on tensile fracture toughness using experimental test and PFC2D simulation. J. Min. Sci. 2016, 52, 647–661. [Google Scholar]
  12. Li, K.S.; Zhao, Z.; Ma, D.P.; Liu, C.X.; Zhang, J.P. Acoustic Emission and Mechanical Characteristics of Rock-Like Material Containing Single Crack Under Uniaxial Compression. Arab. J. Sci. Eng. 2022, 47, 4749–4761. [Google Scholar]
  13. Wang, C.Y.; Chang, X.K.; Liu, Y.L. Experimental Study on Fracture Patterns and Crack Propagation of Sandstone Based on Acoustic Emission. Adv. Civ. Eng. 2021, 2021, 8847158. [Google Scholar]
  14. Wang, Z.H.; Li, Y.; Cai, W.B.; Zhu, W.S.; Kong, W.Q.; Dai, F.; Wang, C.; Wang, K. Crack propagation process and acoustic emission characteristics of rock-like specimens with double parallel flaws under uniaxial compression. Theor. Appl. Fract. Mech. 2021, 114, 102983. [Google Scholar]
  15. Wu, S.Y.; Huang, Y.H. Macro and meso crack evolution of granite specimens with non-straight fissures: A comparison between two bond models. Theor. Appl. Fract. Mech. 2023, 125, 103890. [Google Scholar]
  16. Zhou, D.; Ye, Y.C.; Hu, N.Y.; Wang, W.Q.; Wang, X.H. Crack evolution of soft-hard composite layered rock-like specimens with two fissures under uniaxial compression. Front. Struct. Civ. Eng. 2021, 15, 1372–1389. [Google Scholar]
  17. Wasantha, P.L.P.; Bing, D.; Yang, S.Q.; Xu, T. Numerical modelling of the crack-pore interaction and damage evolution behaviour of rocklike materials with pre-existing cracks and pores. Int. J. Damage Mech. 2021, 30, 720–738. [Google Scholar]
  18. Ma, W.B.; Chen, Y.L.; Yi, W.; Guo, S.C. Investigation on crack evolution behaviors and mechanism on rock-like specimen with two circular-holes under compression. Theor. Appl. Fract. Mech. 2022, 118, 103222. [Google Scholar]
  19. Ping, Q.; Li, X.Y. Analysis of the Fracture Characteristics and Crack Propagation Mechanism of Fractured Sandstone under Dynamic Loading. Appl. Sci. 2024, 14, 2042. [Google Scholar] [CrossRef]
  20. Ping, Q.; Wang, S.; Wu, Y.L.; Sun, S.J.; Shen, K.F.; Wang, C.; Gao, Q.; Fang, C.L. Study on Mechanical Properties and Energy Consumption of Fissured Sandstone with Different Dip Angles under Impact Load. Shock Vib. 2022, 2022, 1–9. [Google Scholar]
  21. Yan, Z.L.; Wu, W.; Dai, F.; Liu, Y. Dynamic Mechanical Response and Damage Constitutive Model of Multi-flawed Rocks Under High Strain Rates. Rock Mech. Rock Eng. 2023, 56, 4405–4425. [Google Scholar] [CrossRef]
  22. Uxía, C.F.; Leandro, R.A.; Diego, M.I. Particle flow code simulation of intact and fissured granitic rock samples. J. Rock Mech. Geotech. Eng. 2020, 12, 960–974. [Google Scholar]
  23. Wang, G.; Luo, Y.; Li, X.P.; Liu, T.T.; Xu, M.N.; Qu, D.X. Study on Dynamic Mechanical Properties and Meso-Deterioration Mechanism of Sandstone Under Cyclic Impact Load. Arab. J. Sci. Eng. 2020, 45, 3863–3875. [Google Scholar] [CrossRef]
  24. Lu, H.; Chen, Q.L.; Ma, X.T. Investigation into Dynamic Behaviors of High-Temperature Sandstone under Cyclic Impact Loading Using DIC Technology. Appl. Sci. 2022, 12, 9247. [Google Scholar] [CrossRef]
  25. Zhang, L.; Zhang, Z.J.; Chen, Y.; Dai, B.; Wang, B. Crack development and damage patterns under combined dynamic-static loading of parallel double fractured rocks based on DIC technique. Acta Geotech. 2023, 18, 877–901. [Google Scholar] [CrossRef]
  26. Su, H.J.; Jiang, Y.; Yu, L.Y.; Wang, W.B.; Guo, Q.Z. Dynamic fracture and deformation responses of rock mass specimens containing 3D printing rough joint subjected to impact loading. Geomech. Geophys. Geo-Energy Geo-Resour. 2022, 8, 186. [Google Scholar] [CrossRef]
  27. Imani, M.; Nejati, R.H.; Goshtasbi, K. Dynamic response and failure mechanism of Brazilian disk specimens at high strain rate. Soil Dyn. Earthq. Eng. 2017, 100, 261–269. [Google Scholar] [CrossRef]
  28. Sun, X.Y.; Jin, T.X.; Li, J.H.; Xie, J.L.; Li, C.T. Dynamic characteristics and crack evolution laws of coal and rock under split Hopkinson pressure bar impact loading. Meas. Sci. Technol. 2023, 34, 075601. [Google Scholar] [CrossRef]
  29. Yang, J.H.; Yu, T.; Ye, Z.W.; Zou, Y.; Zhou, C.B. Numerical and experimental investigation into dynamic fracture and energy dissipation of red sandstone under multi-axial confining pressure. Tunn. Undergr. Space Technol. 2025, 158, 106446. [Google Scholar] [CrossRef]
  30. Yan, Z.L.; Dai, F.; Liu, Y.; Li, A.; Du, H.B. Numerical assessment of the rate-dependent cracking behaviours of single-flawed rocks in split Hopkinson pressure bar tests. Eng. Fract. Mech. 2021, 247, 107656. [Google Scholar] [CrossRef]
  31. Fakhimi, A.; Azhdari, P.; Kimberley, J. Physical and numerical evaluation of rock strength in Split Hopkinson Pressure Bar testing. Comput. Geotech. 2018, 102, 1–11. [Google Scholar]
  32. Patel, S.; Martin, C.D. Impact of the initial crack volume on the intact behavior of a bonded particle model. Comput. Geotech. 2020, 127, 103764. [Google Scholar]
  33. Saadat, M.; Taheri, A. Effect of Contributing Parameters on the Behaviour of a Bolted Rock Joint Subjected to Combined Pull-and-Shear Loading: A DEM Approach. Rock Mech. Rock Eng. 2020, 53, 383–409. [Google Scholar]
  34. Wu, J.H.; Du, Y.X.; Wang, C.B.; Zong, Q. Experimental Study on Dynamic Tensile Mechanical Behavior and Fracture Mechanical Characteristics of Sandstone with a Single Prefabricated Fissure. Adv. Civ. Eng. 2024, 2024, 5501703. [Google Scholar] [CrossRef]
  35. Jin, T.X.; Sun, X.Y.; Liu, K.; Lin, S.R.; Yang, S.Q.; Xie, J.L. Experimental study of the multiple fractalisation of coal and rock failure subjected to the coupled effects of water, temperature and dynamic loads. Appl. Sci. 2023, 13, 13004. [Google Scholar] [CrossRef]
  36. Chen, Y.J.; Yin, T.B.; Ranjith, P.G.; Li, X.B.; Li, Q.; Zhuang, D.D. Performances of fissured red sandstone after thermal treatment with constant-amplitude and low-cycle impacts. J. Rock Mech. Geotech. Eng. 2024, 16, 561–587. [Google Scholar] [CrossRef]
  37. You, W.; Dai, F.; Liu, Y.; Li, Y.Z. Dynamic mechanical responses and failure characteristics of fractured rocks with hydrostatic confining pressures: An experimental study. Theor. Appl. Fract. Mech. 2022, 122, 103570. [Google Scholar]
  38. Sun, B.; Chen, R.; Ping, Y.; Zhu, Z.D.; Wu, N.; He, Y.X. Dynamic response of rock-like materials based on SHPB pulse waveform characteristics. Materials 2022, 15, 210. [Google Scholar]
  39. Haeri, H.; Sarfarazi, V.; Fatehi Marji, M. Static and dynamic response of rock engineering models. Iran. J. Sci. Technol. Trans. Civ. Eng. 2022, 46, 327–341. [Google Scholar]
  40. Luo, Y.; Wang, G.; Li, X.P.; Liu, T.T.; Mandal, A.K.; Xu, M.N.; Xu, K. Analysis of energy dissipation and crack evolution law of sandstone under impact load. Int. J. Rock Mech. Min. Sci. 2020, 132, 104359. [Google Scholar]
  41. Francisco, R.B.; Fredrik, J.; Diego, M.I.; Abel, S.J.; Axel, B. Using PFC2D to simulate the shear behaviour of joints in hard crystalline rock. Bull. Eng. Geol. Environ. 2022, 81, 381. [Google Scholar]
  42. Mehranpour, M.H.; Kulatilake, P.H.S.W. Comparison of six major intact rock failure criteria using a particle flow approach under true-triaxial stress condition. Geomech. Geophys. Geo-Energy Geo-Resour. 2016, 2, 203–229. [Google Scholar]
  43. Saadat, M.; Taheri, A. A cohesive discrete element based approach to characterizing the shear behavior of cohesive soil and clay-infilled rock joints. Comput. Geotech. 2019, 114, 103109. [Google Scholar]
  44. Zhou, Z.L.; Zhao, Y.; Jiang, Y.H.; Zou, Y.; Cai, X.; Li, D.Y. Dynamic behavior of rock during its post failure stage in SHPB tests. Trans. Nonferrous Met. Soc. China 2017, 27, 184–196. [Google Scholar]
  45. Guner, D.; Ozturk, H. Experimental and Numerical Analysis of the Effects of Curing Time on Tensile Mechanical Properties of Thin Spray-on Liners. Rock Mech. Rock Eng. 2016, 49, 3205–3222. [Google Scholar]
  46. You, W.; Dai, F.; Liu, Y. Experimental and numerical investigation on the mechanical responses and cracking mechanism of 3D confined single-flawed rocks under dynamic loading. J. Rock Mech. Geotech. Eng. 2022, 14, 477–493. [Google Scholar]
  47. Yuan, G.T.; Zhang, M.W.; Zhang, K.; Wei, J.; Tian, Z.C.; Liu, B.L. Dynamic mechanical response characteristics and cracking behavior of randomly distributed cracked sandstone. Comput. Part. Mech. 2023, 11, 119–139. [Google Scholar]
  48. Ozturk, H.; Altinpinar, M. The estimation of uniaxial compressive strength conversion factor of trona and interbeds from point load tests and numerical modeling. J. Afr. Earth Sci. 2017, 131, 71–79. [Google Scholar]
  49. Li, J.C.; Li, N.N.; Li, H.B.; Zhao, J. An SHPB test study on wave propagation across rock masses with different contact area ratios of joint. Int. J. Impact Eng. 2017, 105, 109–116. [Google Scholar]
  50. Li, D.Y.; Han, Z.H.; Sun, X.L.; Zhou, T.; Li, X. Dynamic Mechanical Properties and Fracturing Behavior of Marble Specimens Containing Single and Double Flaws in SHPB Tests. Rock Mech. Rock Eng. 2019, 52, 1623–1643. [Google Scholar]
Figure 1. SHPB system and stress wave propagation diagram.
Buildings 15 01147 g001
Figure 2. Numerical model of SHPB.
Buildings 15 01147 g002
Figure 3. The stress–time histories monitored by measurement circles A through E.
Buildings 15 01147 g003
Figure 4. Stress equilibrium verification.
Buildings 15 01147 g004
Figure 5. Validation of experimental and numerical simulation results: (a) stress–strain curve comparison; (b) comparison of damage maps.
Buildings 15 01147 g005
Figure 6. Specimen with fractures.
Buildings 15 01147 g006
Figure 7. Dynamic stress–strain curves of specimens with fractures of different inclination angles.
Buildings 15 01147 g007
Figure 8. Relationship between dynamic compressive strength and fracture inclination angles.
Buildings 15 01147 g008
Figure 9. Relationship between propagation coefficient and fracture inclination angles.
Buildings 15 01147 g009
Figure 10. Crack initiation maps of specimens with fractures of different inclination angles.
Buildings 15 01147 g010
Figure 11. Crack development in specimens with fractures at different inclination angles.
Buildings 15 01147 g011
Figure 12. Number of cracks in specimens with fractures at different inclination angles.
Buildings 15 01147 g012
Figure 13. Tensile failure ratio k versus time curves for red sandstone models with different inclination angles.
Buildings 15 01147 g013
Figure 14. Crack development patterns and corresponding contact force distributions in fractured specimens: (a) fracture inclination angle of 15°; (b) fracture inclination angle of 75°.
Buildings 15 01147 g014
Figure 15. The relationship between the tensile failure ratio k and the fracture inclination at the final failure stage of the specimen.
Buildings 15 01147 g015
Figure 16. Final failure states of specimens with fractures of different inclination angles.
Buildings 15 01147 g016
Figure 17. The number of fragments produced by the final failure of specimens with fractures of different inclination angles.
Buildings 15 01147 g017
Figure 18. The cumulative number of fragments over time for specimens with fractures of different inclination angles.
Buildings 15 01147 g018
Figure 19. Variation curves of absorbed energy, total number of cracks, and number of fragments versus fracture inclination angles.
Buildings 15 01147 g019
Table 1. Main microscopic parameters of punch and rod components.
Density/
(kg·m−3)
Particle Stiffness RatioParticle Deformation Modulus/GPaBond Stiffness RatioBond Deformation Modulus/GPaBond Tensile Strength/MPaBond Shear Strength/MPa
7850121012101010010100
Table 2. Main microscopic parameters of red sandstone specimens.
Density/
(kg·m−3)
Particle Stiffness RatioParticle Deformation Modulus/GPaBond Stiffness RatioBond Deformation Modulus/GPaBond Tensile Strength/MPaCohesion/MPa
28901.5281.528135115
Table 3. Energy properties of red sandstone specimens.
Fracture Inclination Angles/°Incident Energy/JReflected Energy/JTransmitted Energy/JAbsorbed Energy/J
0624.67125.26232.25267.16
15624.67171.54172.89280.24
30624.67229.63124.56270.48
45624.67255.5794.69274.41
60624.67304.8869.06250.73
75624.67303.6971.05249.93
90624.67326.2162.78235.68
Disclaimer/Publisher’s Note: The statements, opinions and data contained in all publications are solely those of the individual author(s) and contributor(s) and not of MDPI and/or the editor(s). MDPI and/or the editor(s) disclaim responsibility for any injury to people or property resulting from any ideas, methods, instructions or products referred to in the content.

