
Bearing Capacity and Deformation of Micropiles Considering Plastic Hinge


Abstract
:1. Introduction
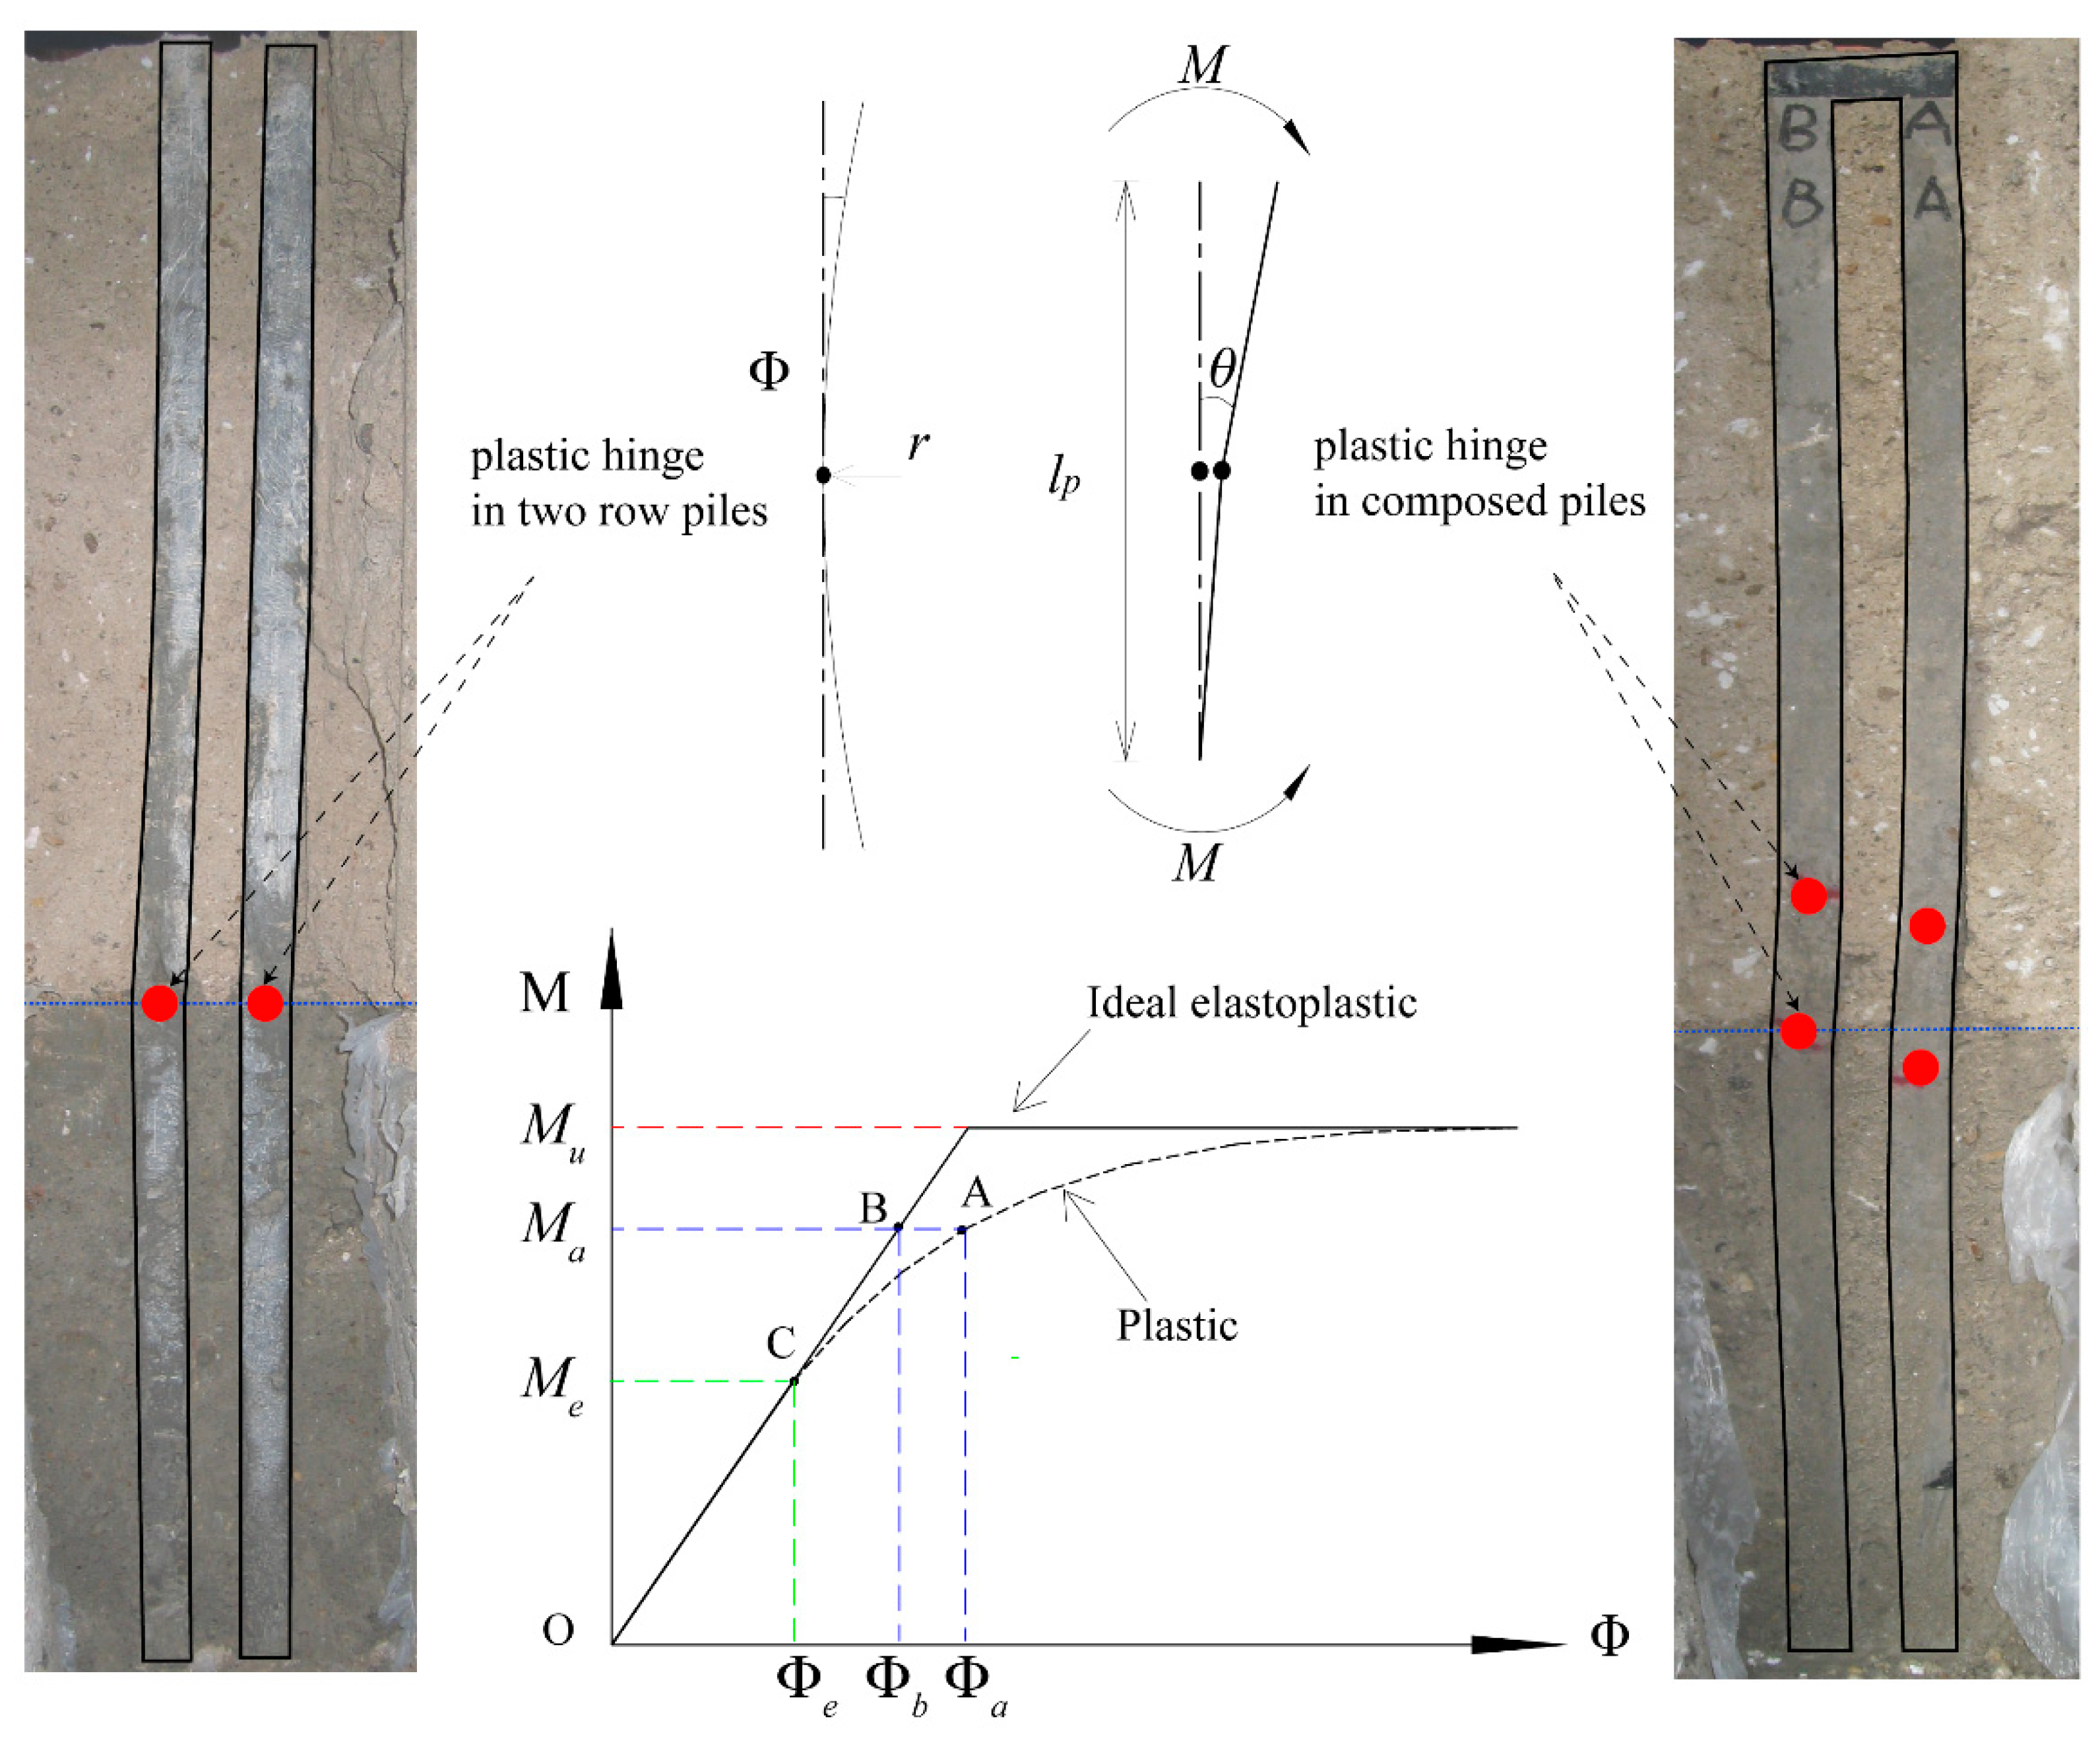
2. Plastic Hinge
2.1. The Definition of Plastic Hinge
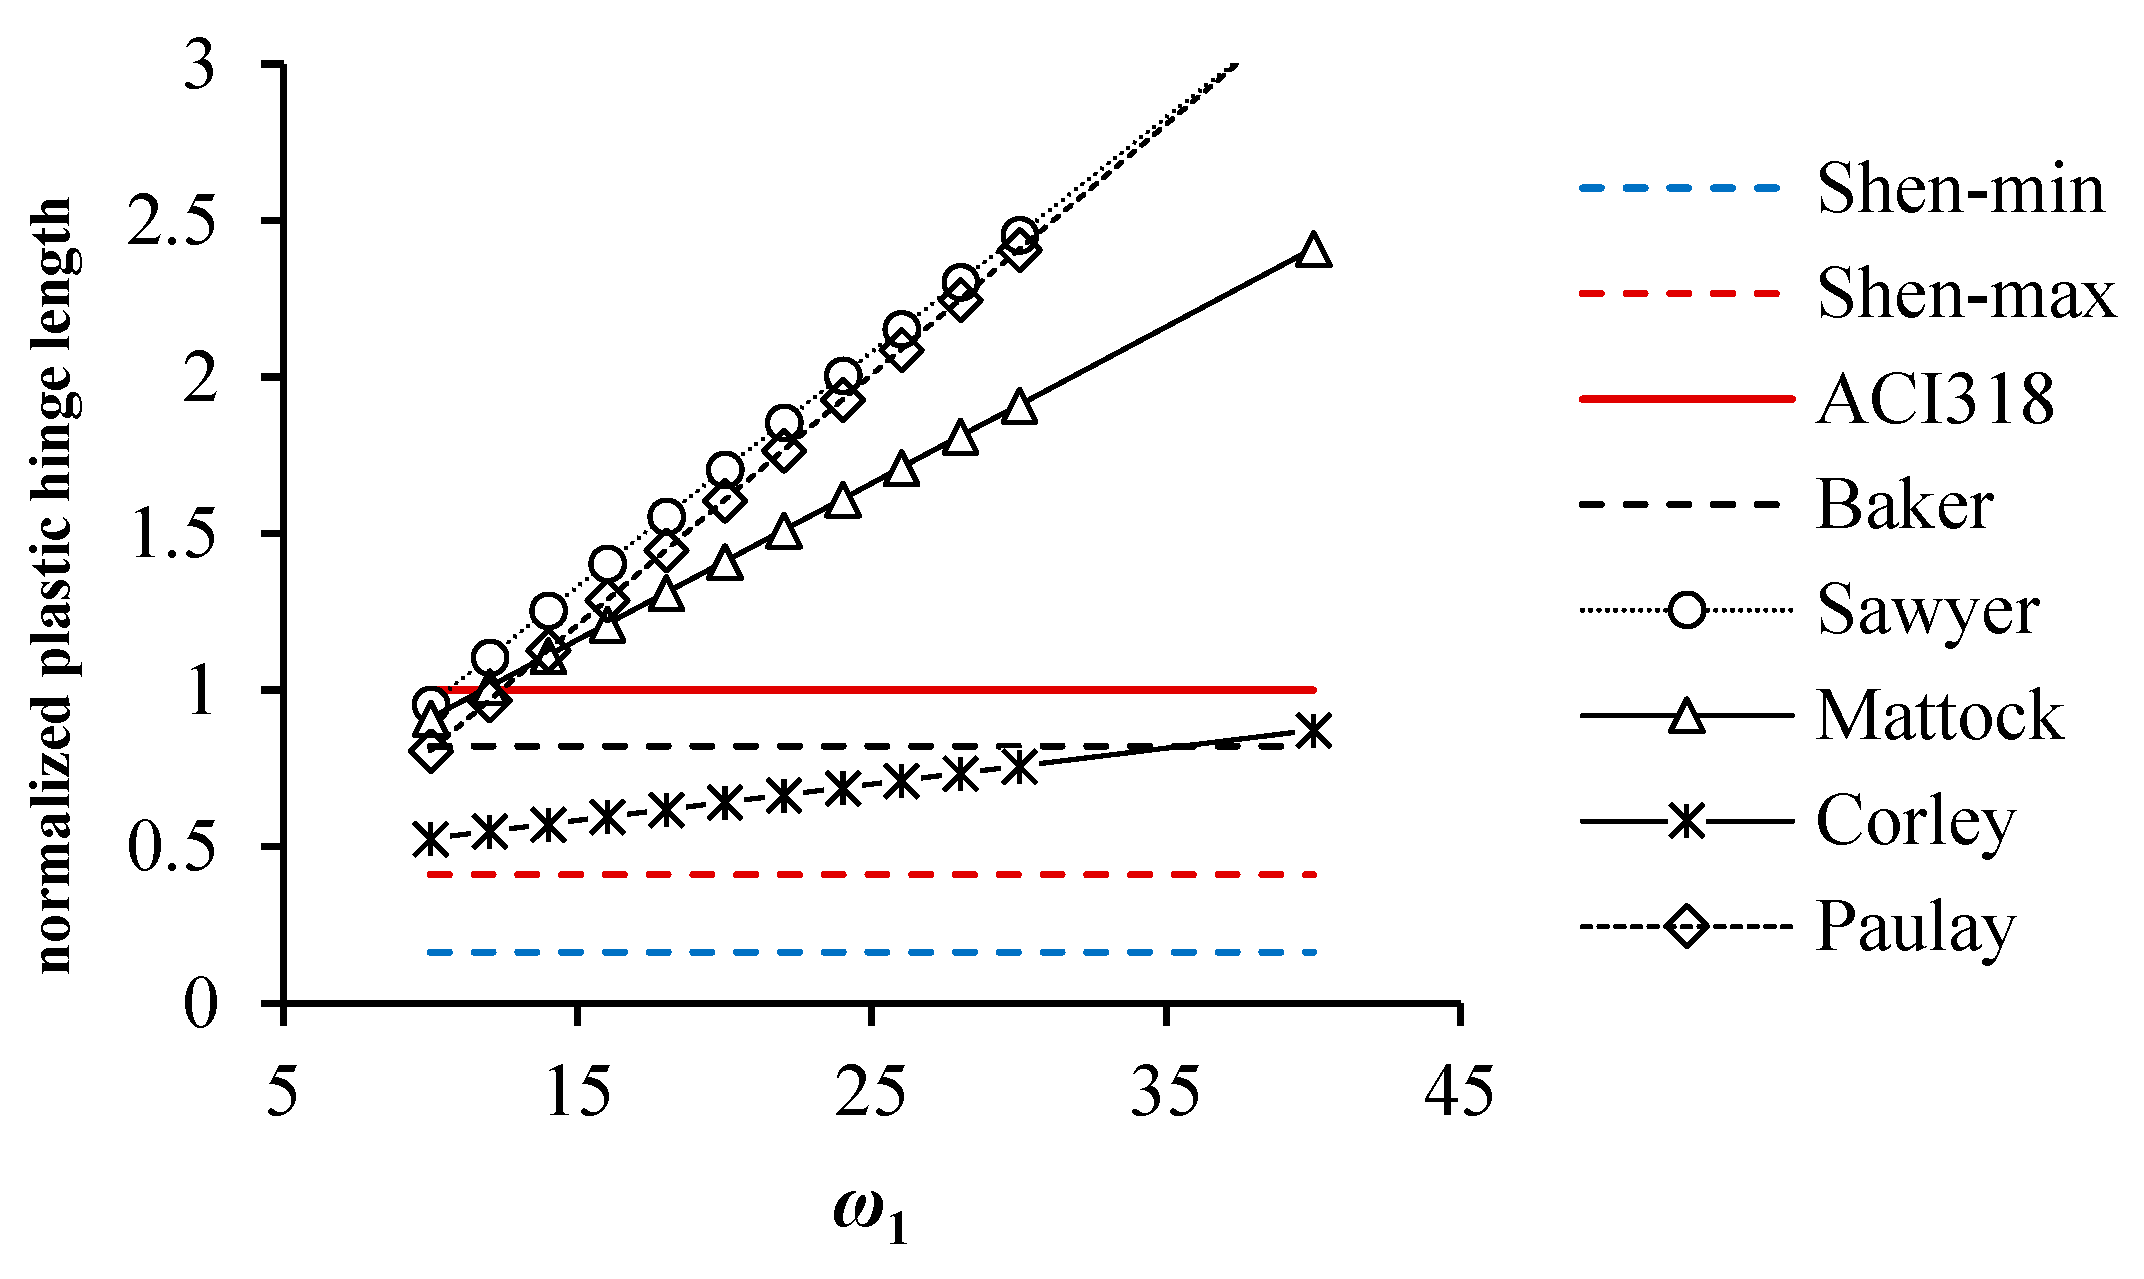
2.2. Plastic Hinge Length Calculation

| Academia | Structure | Note | ||
|---|---|---|---|---|
| Sawyer [23] | (4a) | Beam | —Longitudinal reinforcement ratio | |
| Mattock [24] | (4b) | Beam | —Concrete compressive strength, MPa | |
| Corley [25] | (4c) | Beam | —Yield strength of longitudinal reinforcement, MPa | |
| Shen [26] | (4d) | Beam and pillar | d—Longitudinal reinforcement diameter, mm | |
| Baker [27] | (4e) | Beam and pillar | —Axial load | |
| ACI-318 [28] | (4f) | Beam and pillar | —Compressive load capacity | |
| Paulay [29] | (4g) | Bridge pier column | —Area of longitudinal reinforcement | |
| Bae [30] | (4h) | Pillar | —Total area of concrete |
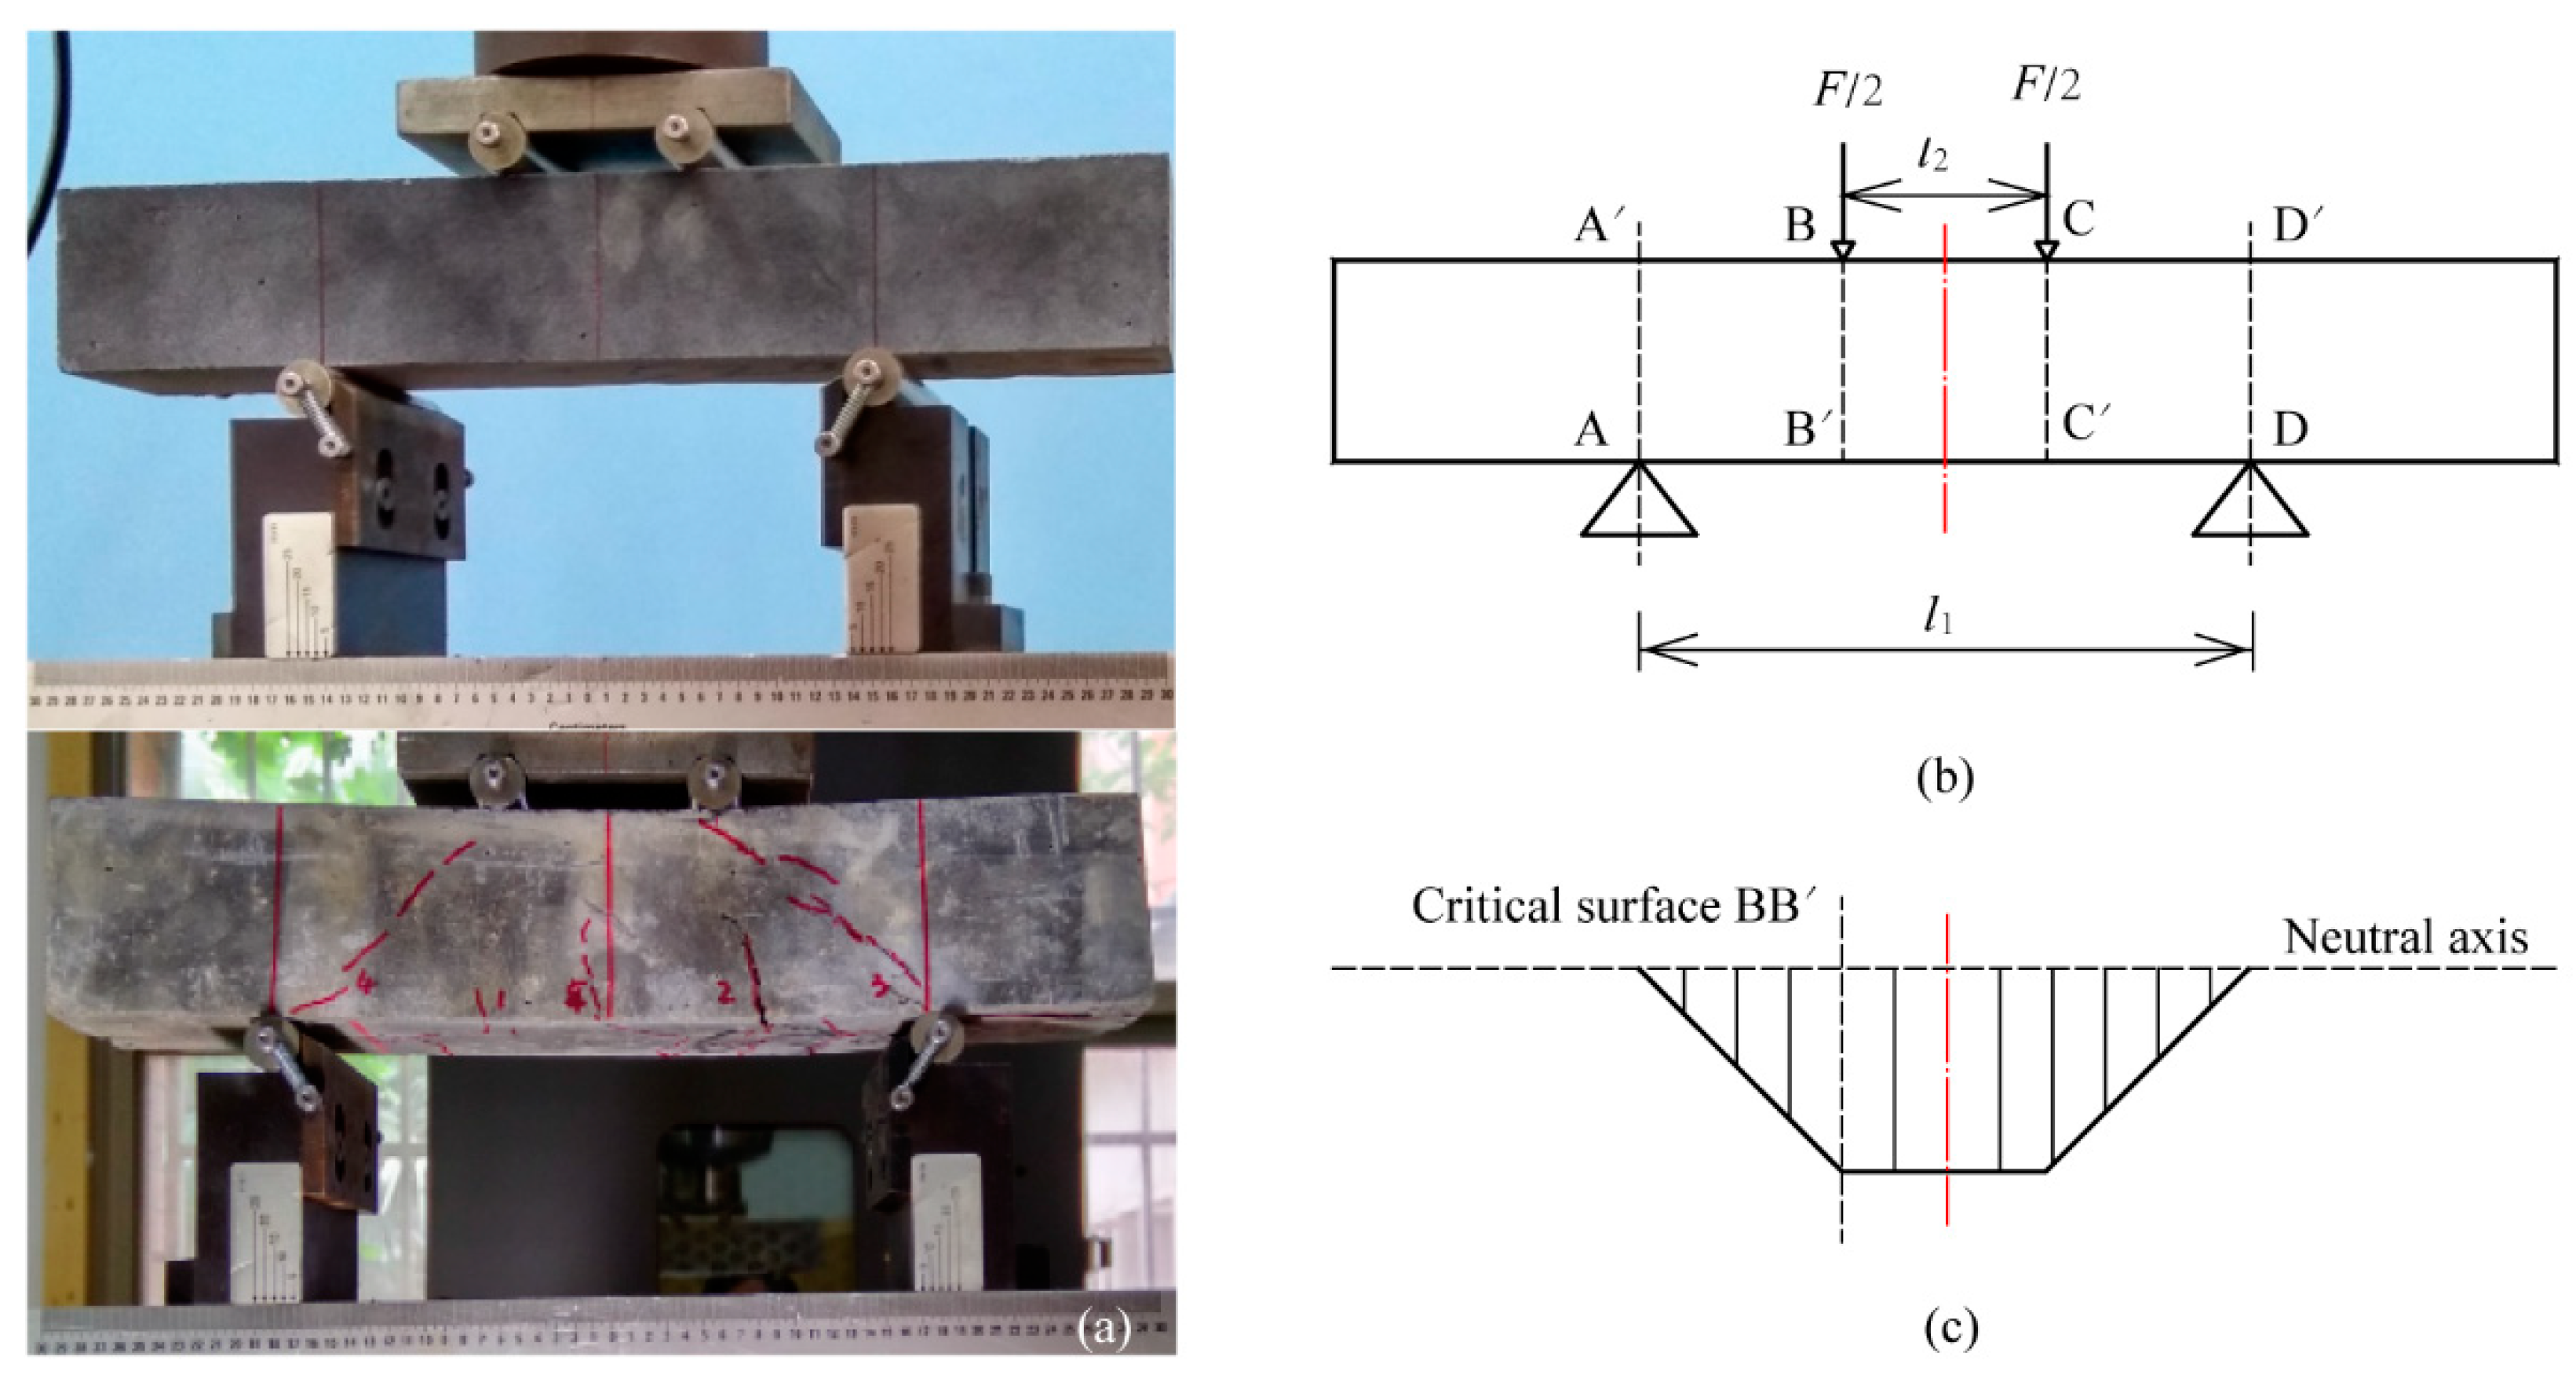
3. Experimental Model
3.1. Materials
3.2. Test Scheme
3.3. Numerical Calculation
4. Results
4.1. Failure of Micropiles
4.2. Plastic Hinge Length of Micropiles
5. Discussion
- (1)
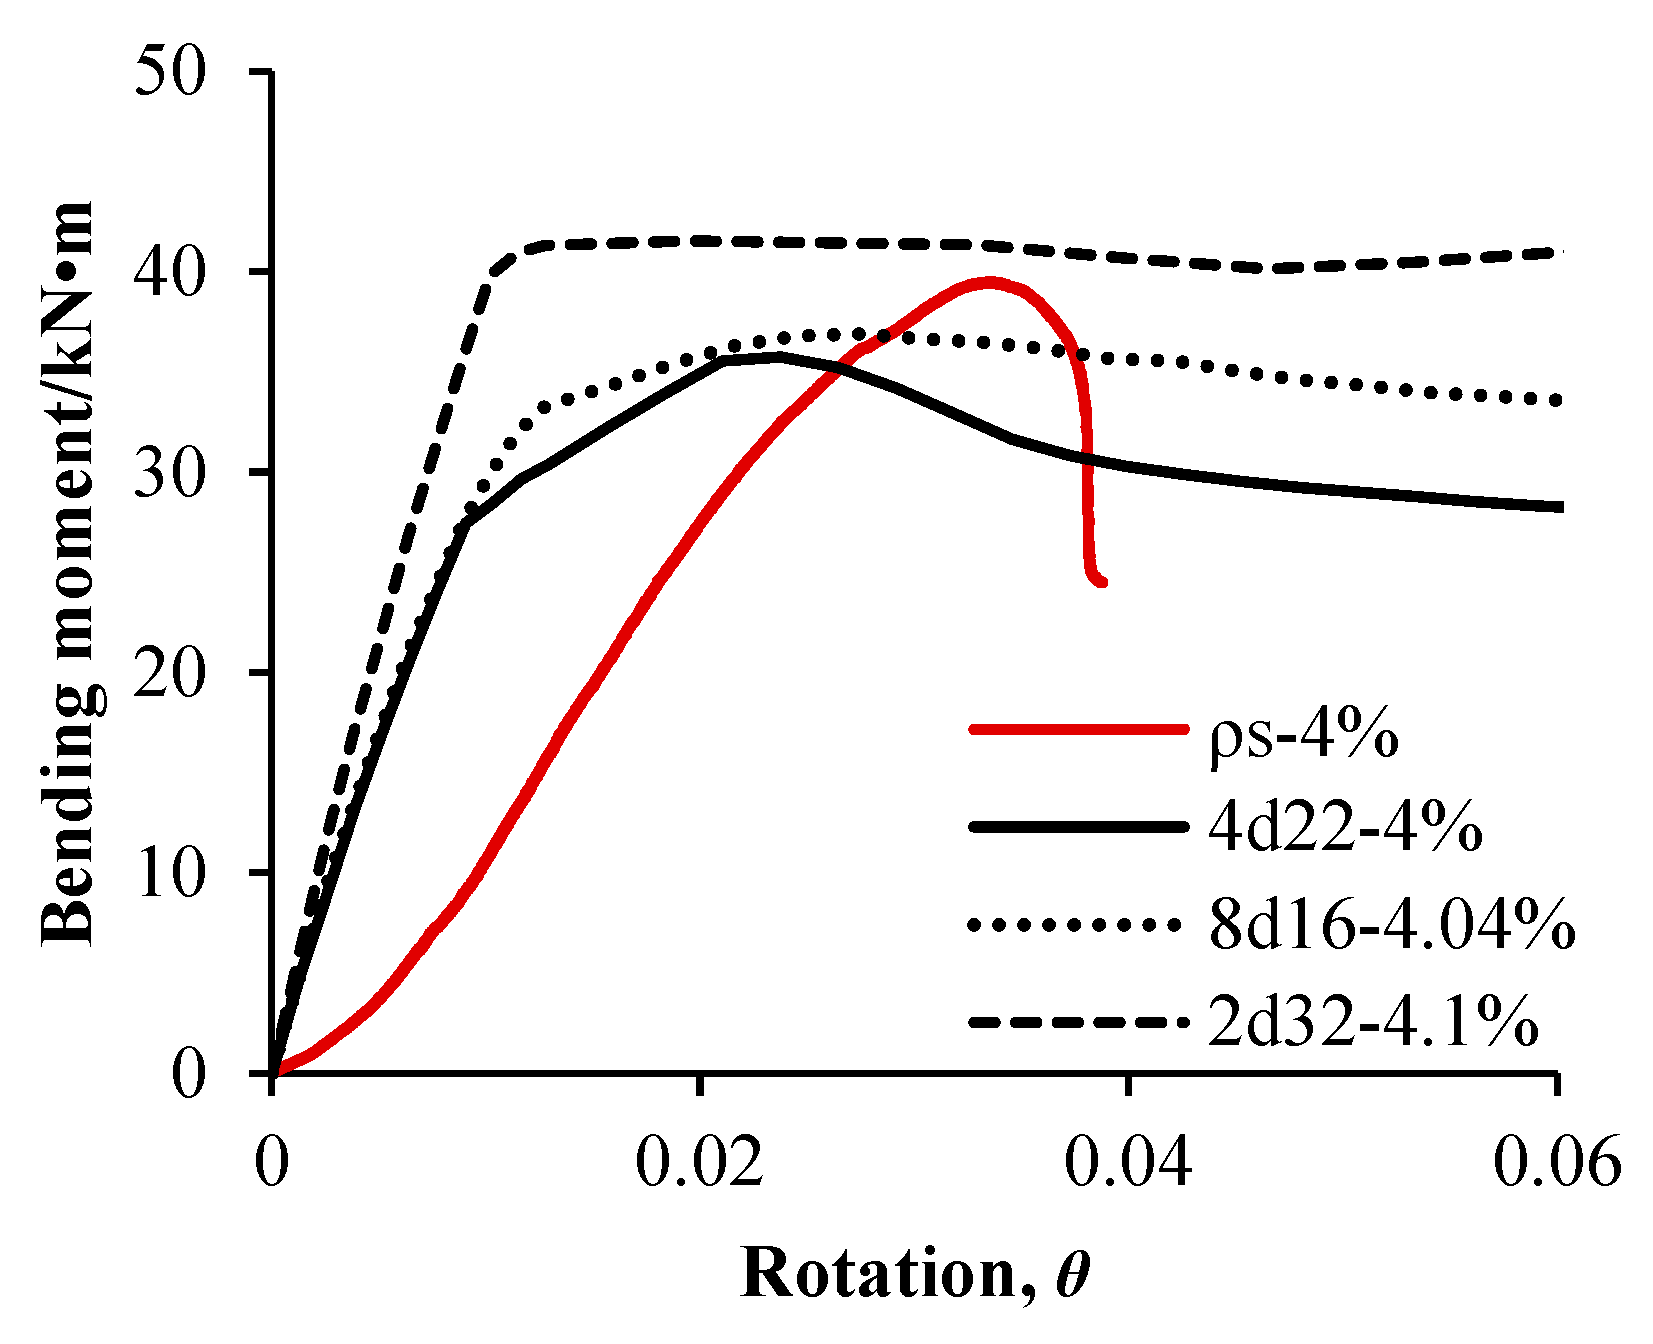
- Reinforcement Ratio: In the design of longitudinal reinforcement for pile shafts, variations in nominal steel area may lead to discrepancies between actual and designed reinforcement ratios. This study conducted sensitivity analyses on reinforcement configurations through numerical simulations under a target reinforcement ratio of 4%. The measured core reinforcement of test piles and the theoretical reinforcement cage (comprising 4 × 22 mm, 8 × 16 mm, and 2 × 32 mm bars) exhibited actual reinforcement ratios deviating within ±0.1% of the target value. Structural parameters, such as reinforcement type and layout, induced fluctuations in the reinforcement ratio within the target range. Despite identical target ratios, variations in bar diameter selection, quantity, and spatial arrangement resulted in bending capacity differences among micropiles, with reinforcement ratio errors up to 1%. As shown in Figure 9, when the deviation between actual and target reinforcement ratios was ≤0.1%, the error in the section’s ultimate bending moment remained within ±5%. This demonstrates that minor deviations in reinforcement ratios (≤0.1%) have negligible practical impacts on ultimate bending capacity, provided the actual ratio closely approximates the design target.
- (2)
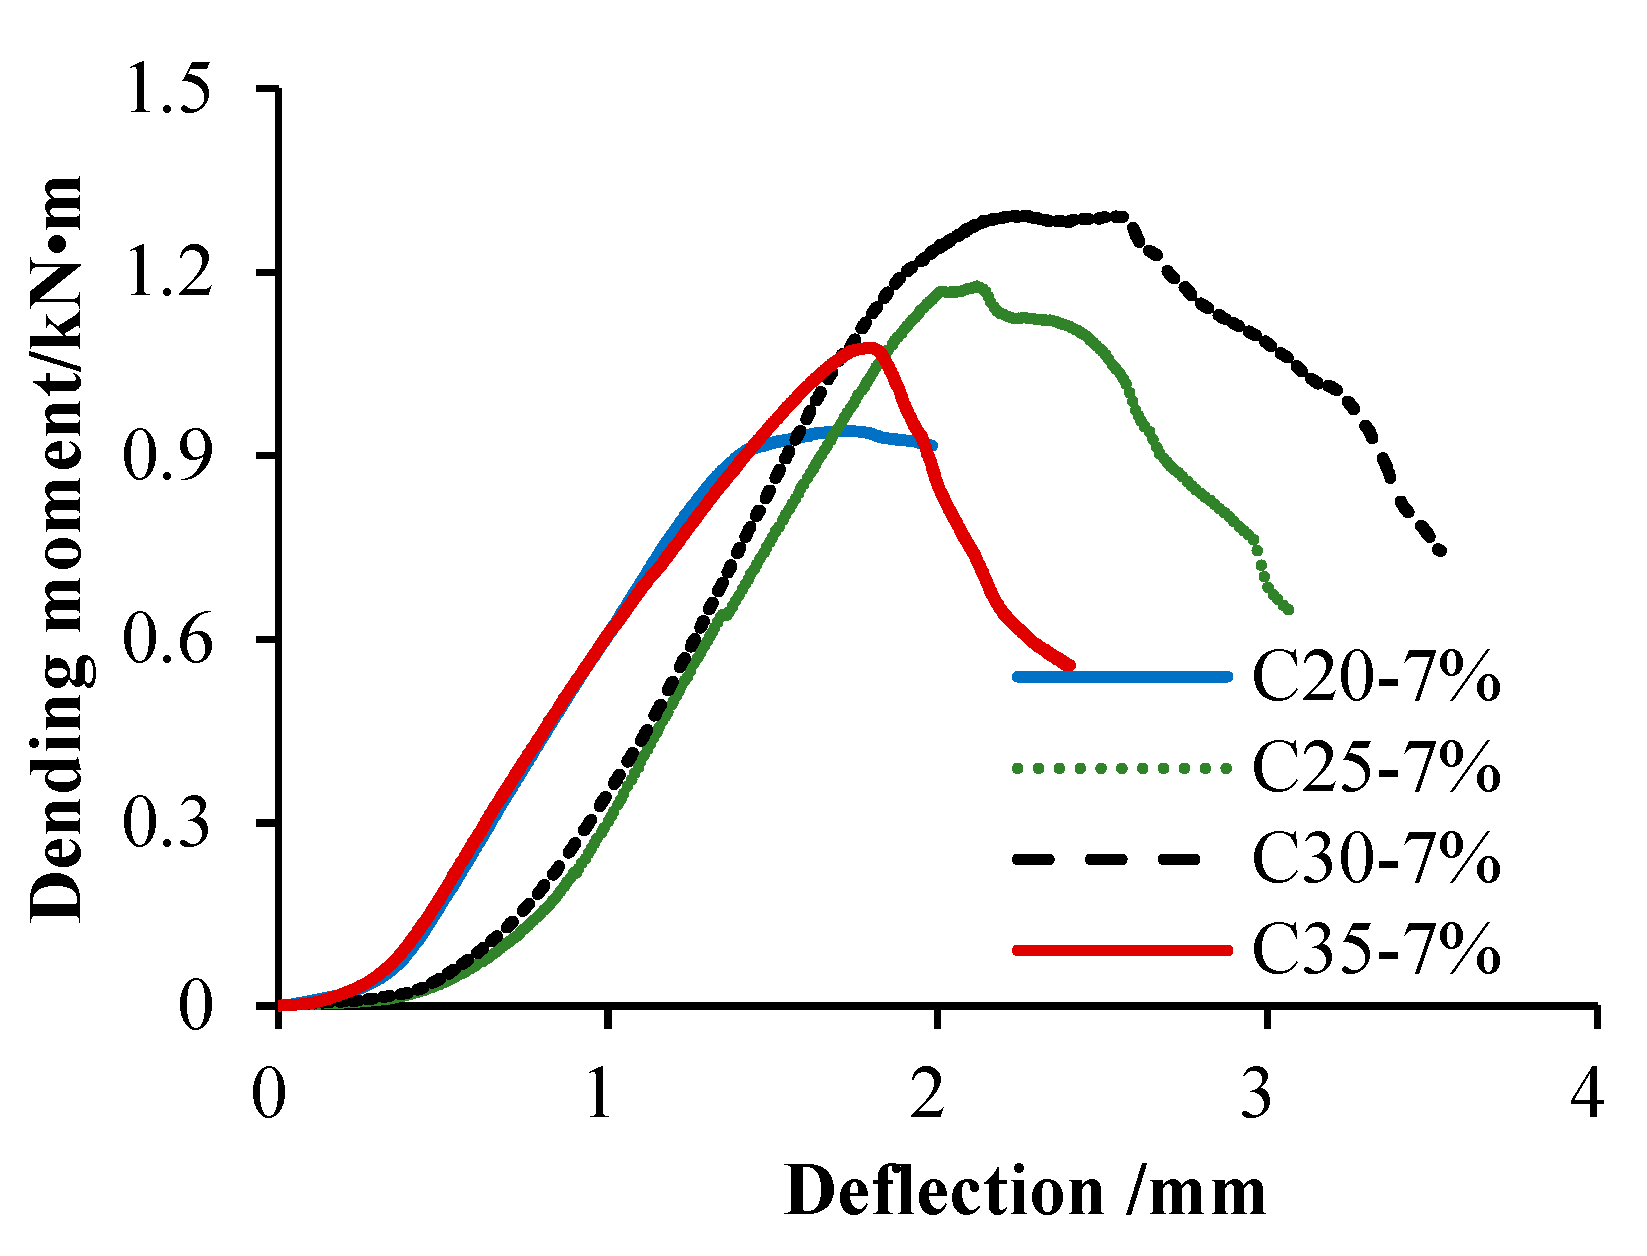
- Concrete Material Strength: Traditional theory suggests that improvements in compressive strength are often accompanied by reductions in structural ductility. Li et al. [39] demonstrated that for every 10 MPa increase in concrete strength, the section modulus of resistance increases by 8–12%, while the ductility coefficient decreases by 0.15, indicating that pursuing high strength alone may exacerbate the risk of brittle structural failure. The experiments in this study revealed that for every 5 MPa increase in strength, the peak bending resistance of the section increased by 6.8–9%. However, test results showed maximum performance at C30 concrete strength, exhibiting nonlinear characteristics in the low-to-medium strength range. Simply increasing concrete strength cannot effectively enhance load-bearing capacity of flexible piles, it is recommended to optimize strength matching based on the synergistic performance between steel reinforcement and concrete materials. This can be achieved through material parameter selection to ensure balanced development of structural performance.
- (3)
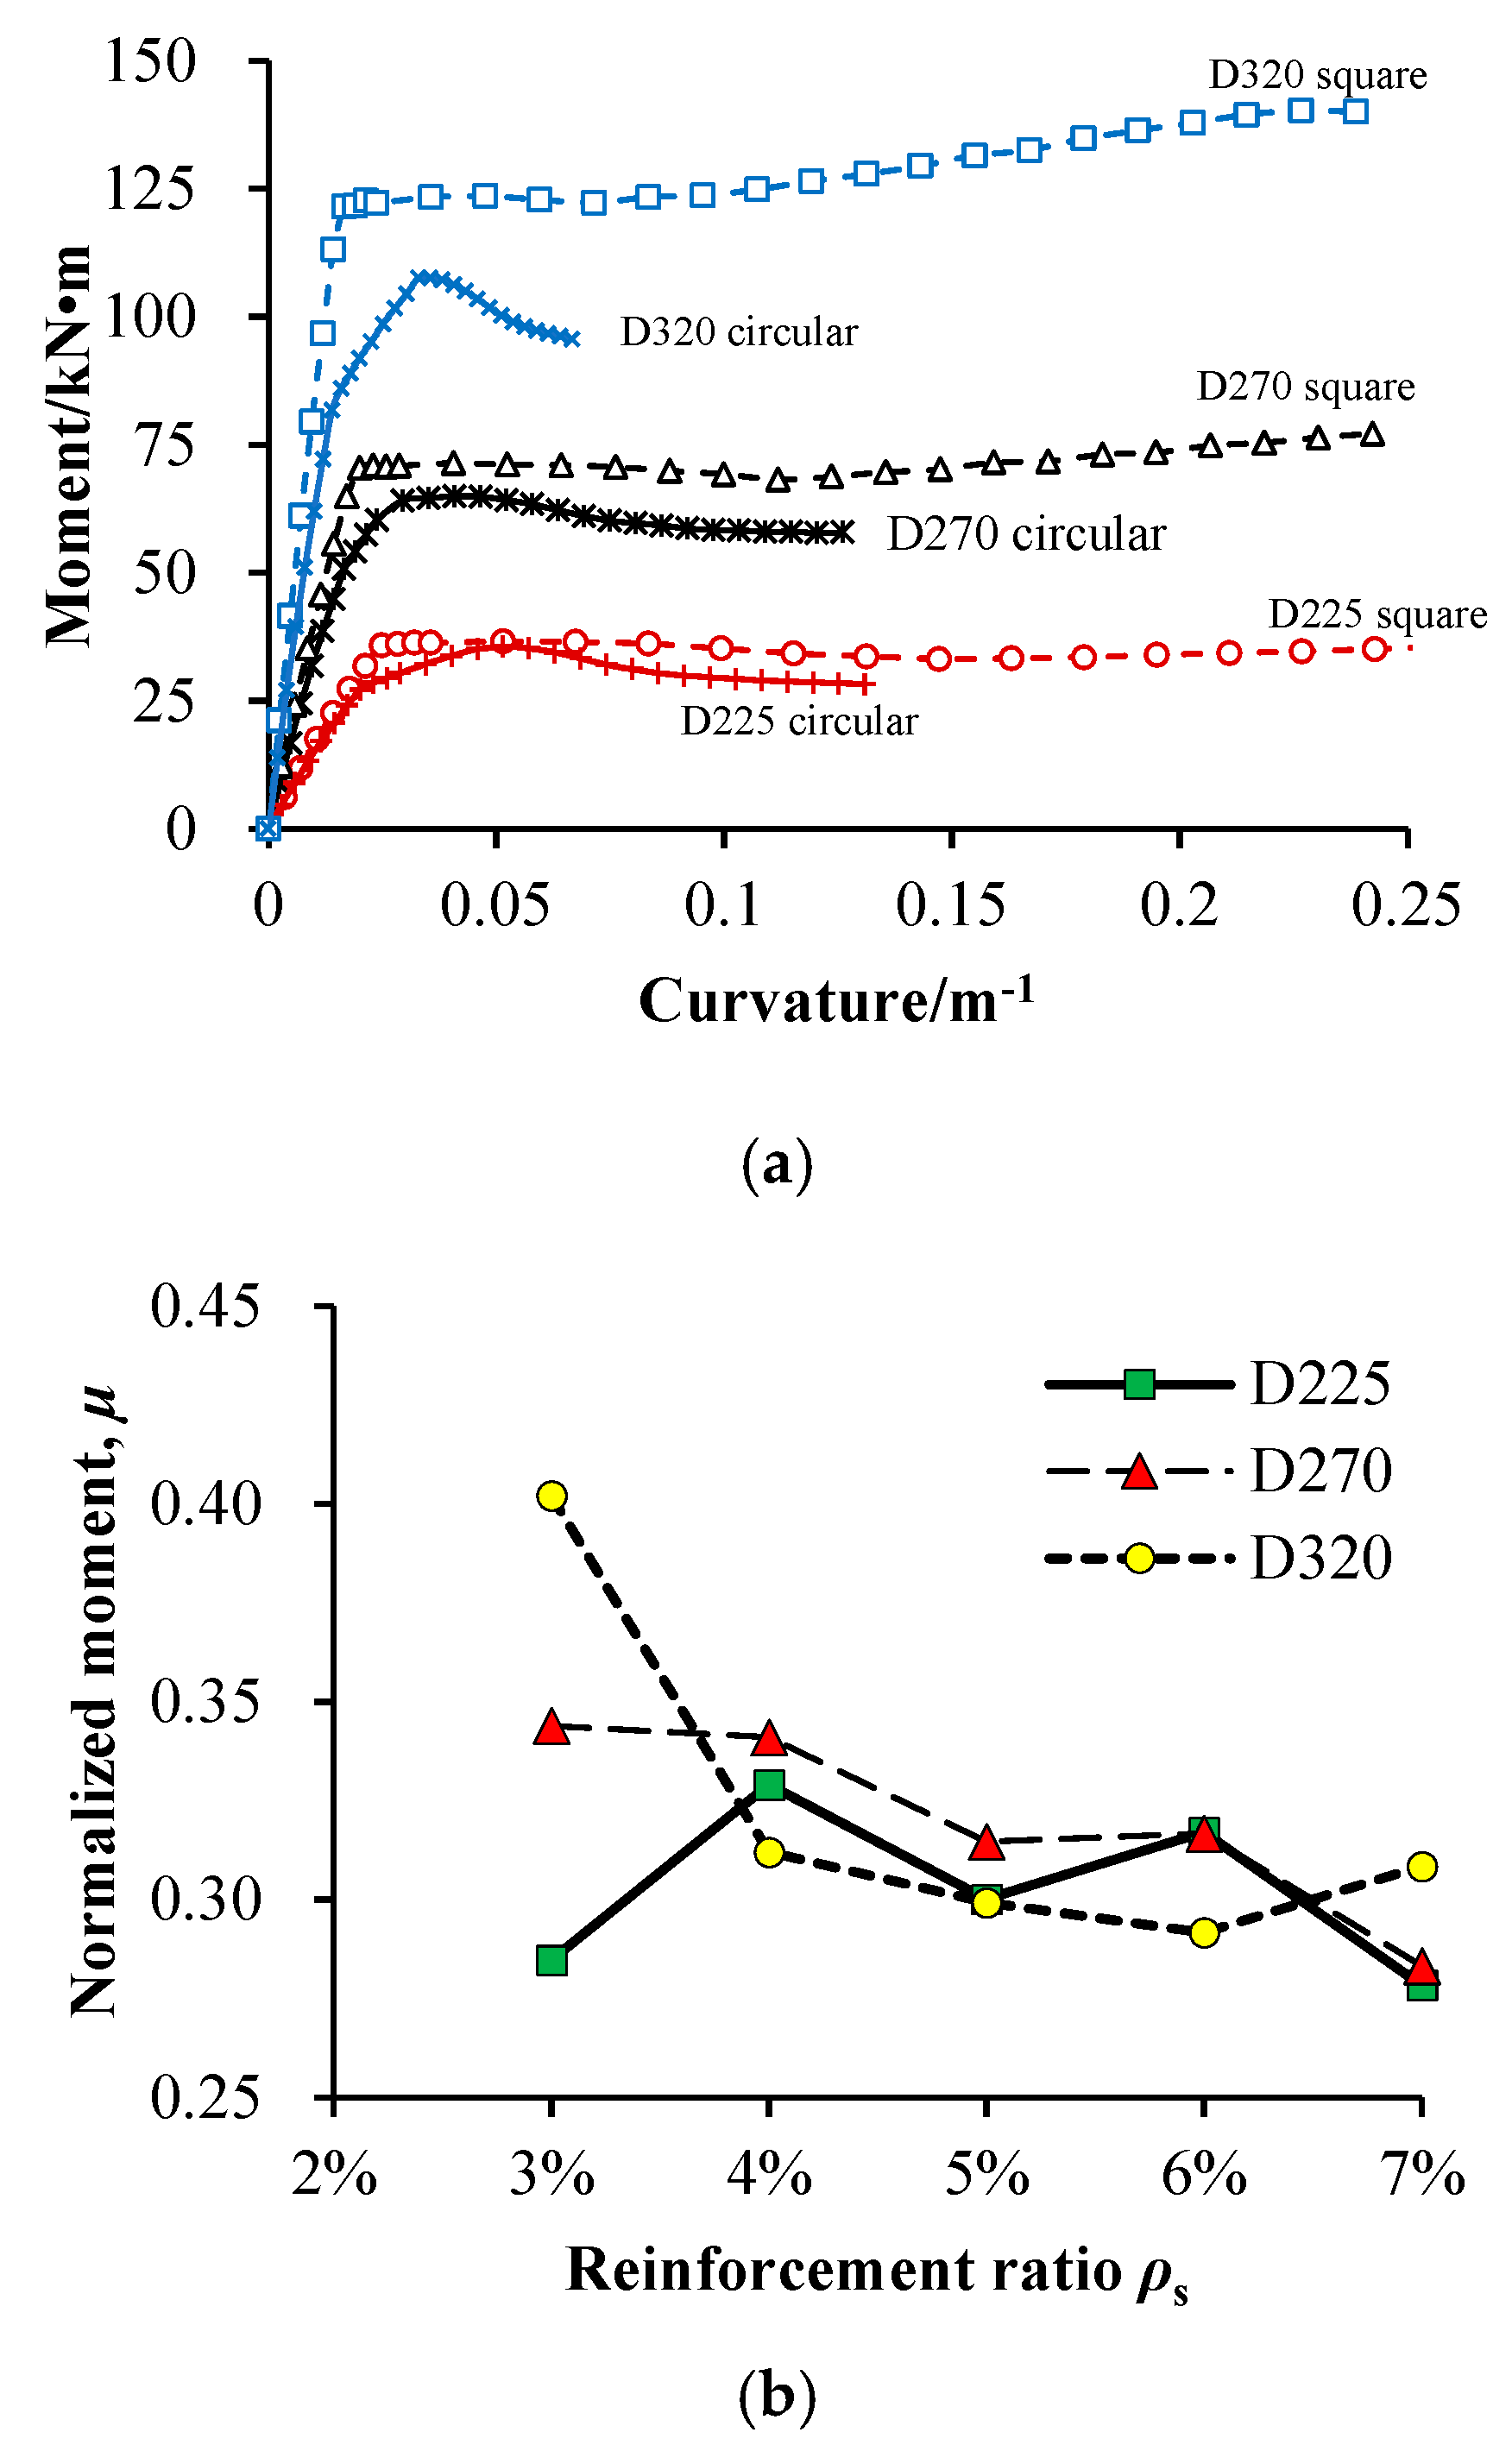
- Geometric Features: Physical model experiments were conducted on prototype piles with area equivalence and scaled-down conversion to meet the test apparatus requirements and improve operability. This allows for examining the sensitivity of the pile’s moment–curvature curve to two factors, namely the size and shape of the pile cross-section. The calculation results are shown in Figure 10.
6. Conclusions
- (1)
- Micropile failure predominantly manifests as shear failure and tension-shear failure along slip surfaces. Shear resistance enhancement can be achieved through three strategic interventions, namely (1) implementation of high-strength concrete materials, (2) optimization of reinforcement ratios, and (3) localized reinforcement at critical slip zones. Mechanical analysis demonstrates that targeted strengthening within plastic hinge regions effectively mitigates risks of premature structural collapse.
- (2)
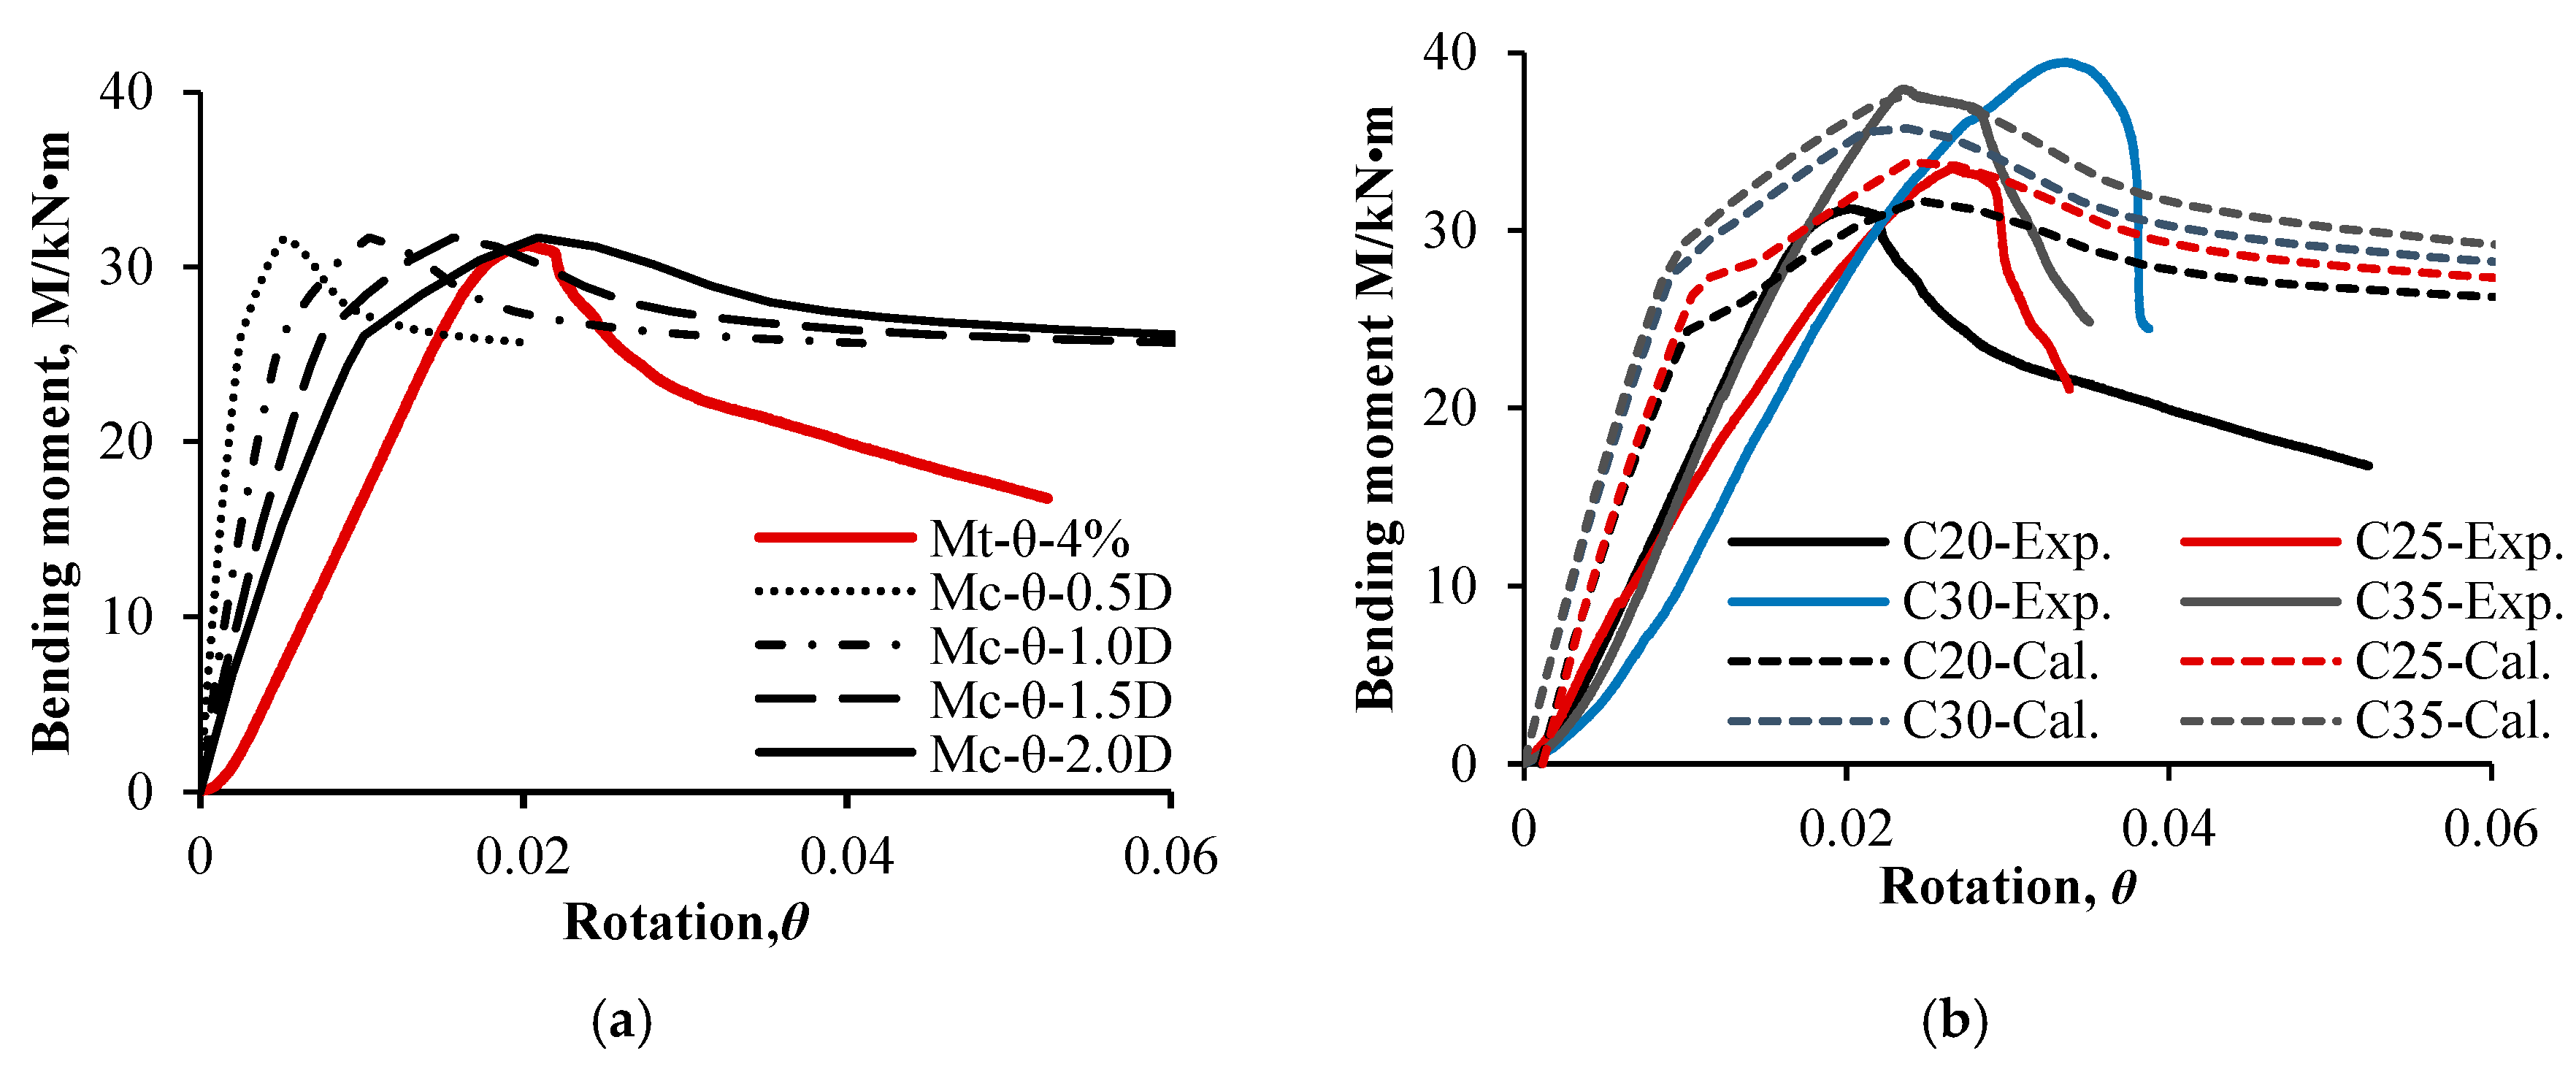
- The plastic hinge length in reinforced concrete flexural members serves as an indicator of plastic zone development. While existing empirical formulas derived from beam–column damage tests provide initial estimates, their applicability to micropile structures requires further validation. Comparative analysis of physical tests and numerical simulations reveals that a plastic hinge length assumption of 2D (where D represents pile diameter) optimally predicts peak load capacity when considering cross-sectional dimensions and longitudinal reinforcement conditions. Notably, soil–pile interaction reduces this length proportionally to soil stiffness characteristics.
- (3)
- Reinforcement configuration variations induce minimal deviations in longitudinal reinforcement ratios (<0.1%) and pile capacity calculation errors (<5%). However, concrete strength variations combined with insufficient stirrups in physical models compromise core concrete confinement, resulting in up to 15% measurement discrepancies in ultimate load predictions.
- (4)
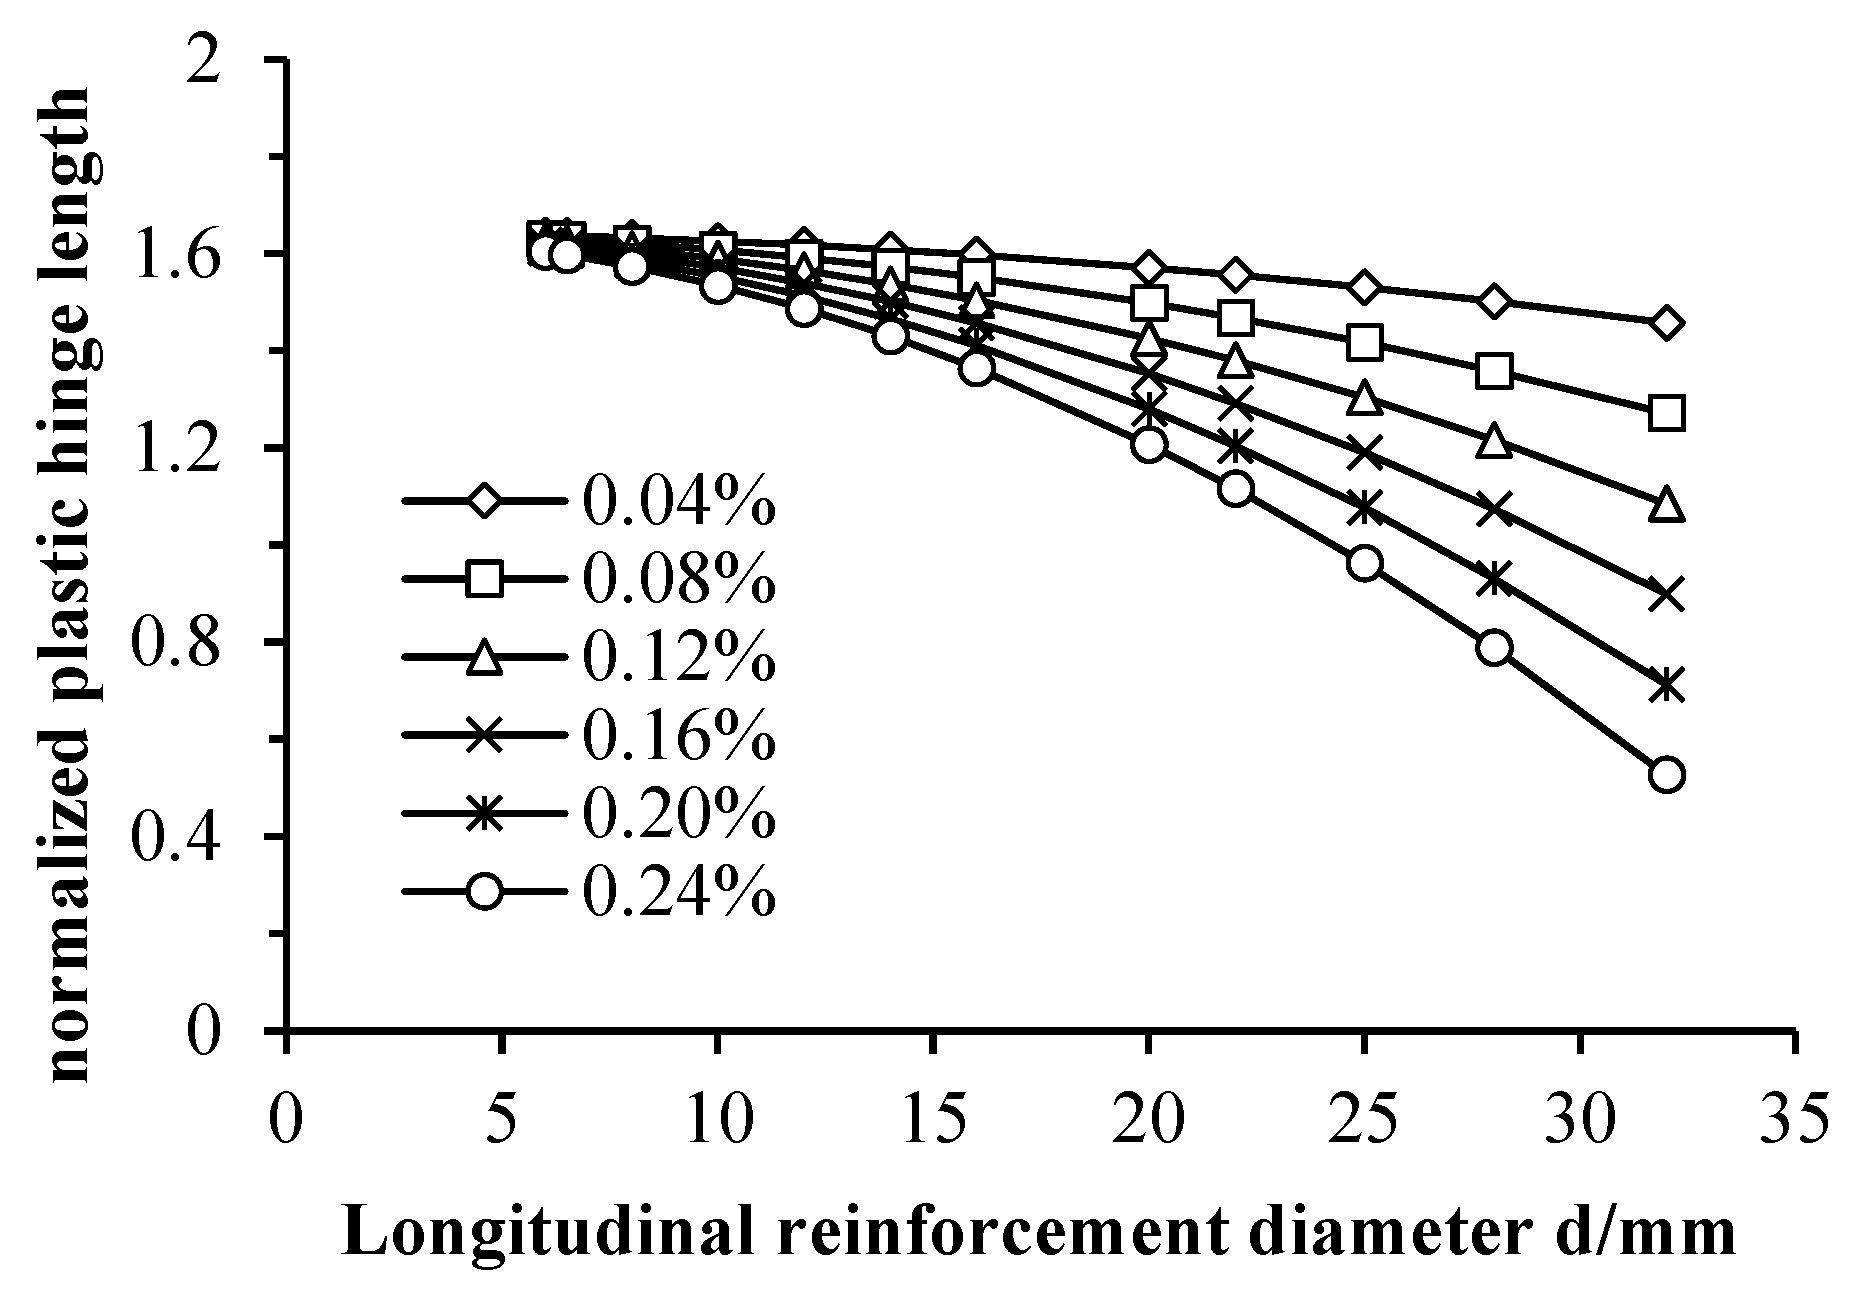
- Finite element modeling incorporating stirrup confinement effects demonstrates that micropile’s geometric characteristics significantly influence ultimate load capacity under a 2.0 h plastic hinge assumption. Diameter increases amplify cross-sectional shape impacts, while empirical formulas reveal an inverse relationship between plastic hinge length and reinforcement ratio. Both experimental measurements and numerical results indicate that pile size effects modify this correlation through cross-sectional scaling mechanisms.
Author Contributions
Funding
Data Availability Statement
Conflicts of Interest
References
- Sadek, M.; Shahrour, I. Influence of the head and tip connection on the seismic performance of micropiles. Soil. Dyn. Earthq. Eng. 2006, 26, 461–468. [Google Scholar] [CrossRef]
- Choi, W.; Kim, G.; Kim, I.; Kyung, D.; Lee, J. Compressive load-carrying behavior of inclined micropiles installed in soil and rock layers. Int. J. Geomech. 2020, 20, 04020147. [Google Scholar]
- Gupta, R.K.; Chawla, S. Performance evaluation of micropiles as a ground improvement technique for existing railway tracks: Finite-element and genetic programming approach. Buildings 2022, 22, 04021287. [Google Scholar]
- Yan, J.K.; Yin, Y.P.; Ma, J. Large scale model test study on single micropile in landslide reinforcement. Hydrogeol. Eng. Geol. 2012, 39, 55–60. [Google Scholar]
- Viggiani, C. Ultimate Lateral Load on Piles Used to Stabilize Landslides. In Proceedings of the 10th International Conference on Soil Mechanics and Foundation Engineering, Stockholm, Sweden, 15–19 June 1981; Volume 3, pp. 555–560. [Google Scholar]
- Han, M.; Jia, J.Q.; Li, Z.; Zhu, Z.G.; Tu, B.X.; Liu, L.L. Improved analytical method for stabilizing piles in loess slope considering nonlinear pile-soil interactions. Int. J. Geomech. 2024, 24, 04024002. [Google Scholar]
- Li, N.; Men, Y.; Yuan, L.; Gao, H.; Li, J.; Wang, B. Study on the mechanical characteristic of micropiles supporting landslide under step-loadings. Geotech. Geol. Eng. 2020, 38, 2761–2771. [Google Scholar]
- Sun, S.W.; Zhu, B.Z.; Feng, M.Q. Research on the ultimate resistance of antislide micropile in slope stabilization. J. Railw. Eng. Soc. 2017, 34, 36–41. [Google Scholar]
- Sun, S.W.; Zhu, B.Z. Numerical simulation study of the ultimate resistance of micropiles in earth slope stabilization. J. Railw. Eng. Soc. 2018, 35, 1–5. [Google Scholar]
- Xing, H.F.; Meng, M.H.; Luo, Y.; Ye, G.B.; He, W.Y. Load transfer mechanism and failure characteristics of piles embedded in soft rock. Chin. J. Geotech. Eng. 2011, 33, 355–361. [Google Scholar]
- Pei, Z.W.; Zhang, Y.J.; Nian, T.K.; Song, X.L.; Zhao, W. Performance investigation of micropile groups in stabilizing unstable talus slopes via centrifuge model tests. Can. Geotech. J. 2023, 60, 351–365. [Google Scholar]
- Rostami, R.; Hytiris, N.; Bhattacharya, S.; Giblin, M. Seismic analysis of pile in liquefiable soil and plastic hinge. Geotech. Res. 2017, 4, 203–213. [Google Scholar] [CrossRef]
- Potini, F.; Conti, R. Horizontal bearing capacity of RC piles in cohesive soil: Numerical and theoretical modelling. Comp. Geotech. 2024, 175, 106638. [Google Scholar] [CrossRef]
- Chang, B.J.; Hutchinson, T.C. Experimental investigation of plastic demands in piles embedded in multi-layered liquefiable soils. Soil Dyn. Earthq. Eng. 2013, 49, 146–156. [Google Scholar] [CrossRef]
- Choi, S.W.; Kimwoo, W. Evaluation of plastic rotational capacity based on material characteristics in reinforced concrete flexural members. J. Korea Concr. Inst. 2010, 22, 825–832. [Google Scholar] [CrossRef]
- Wang, D.S.; Bingjun, S.I.; Sun, Z.G.; Li, X.L.; Ai, Q.H. Experiment on shear strength of reinforced concrete bridge column in plastic hinge zone under seismic effect. China J. Highw. Transp. 2011, 24, 34–41. [Google Scholar]
- Mortezaei, A.; Ronagh, A.H.R. Plastic hinge length of reinforced concrete columns subjected to both far-fault and near-fault ground motions having forward directivity. Struct. Des. Tall Spec. Build. 2013, 22, 903–926. [Google Scholar]
- Mehraein, M.; Saiidi, S. Seismic performance and design of bridge column-to-pile shaft pipe-pin connections in precast and cast-in-place bridges. Earthq. Eng. Struct. Dyn. 2019, 48, 1471–1490. [Google Scholar]
- GB/T 50010-2010; Code for Design of Concrete Structures. China Architecture & Building Press: Beijing, China, 2010.
- Scott, M.H.; Fenves, G.L. Plastic Hinge Integration Methods for Force-Based Beam–Column Elements. J. Struct. Eng. 2006, 132, 244–252. [Google Scholar] [CrossRef]
- Souza Junior, O.D.A.; Oliveira, D.R.C. Numerical simulation and experimental analysis of plastic hinge length of reinforced concrete columns under monotonic flexure and constant axial load. Struct. Concr. 2024, 25, 1919–1937. [Google Scholar] [CrossRef]
- Onoufriou, T. Numerical study of the nonlinear soil–pile–structure interaction effects on the lateral response of marine jetties. J. Mar. Sci. Eng. 2024, 12, 2075. [Google Scholar] [CrossRef]
- Herbert, A.; Sawyer, J.R. Design of concrete frames for two failure stages. ACI Struct. J. 1965, 12, 405–437. [Google Scholar]
- Mattock, A.H. Discussion of “Rotational Capacity of Hinging Regions in Reinforced Concrete Beams”. J. Struct. Div. 1967, 93, 519–522. [Google Scholar] [CrossRef]
- Corley, W.G. Rotational Capacity of Reinforced Concrete Beams. J. Struct. Div. 1966, 92, 121–146. [Google Scholar] [CrossRef]
- Shen, J.M.; Weng, Y.J. Deformation and ductility of reinforced concrete members. J. Build. Struct. 1980, 2, 47–58. [Google Scholar]
- Baker, A.L.L.; Amarakone, A.M.N. Inelastic hyperstatic frame analysis. ACI Struct. J. 1964, 12, 85–142. [Google Scholar]
- ACI 318-08; Building Code Requirements for Structural Concrete and Commentary. American Concrete Institute: Farmington Hills, MI, USA, 2008.
- Paulay, T.; Priestley, M.J.N. Seismic Design of Reinforced Concrete and Masonry Buildings; John Wiley and Sons: New York, NY, USA, 1992. [Google Scholar]
- Bae, S.J.; Bayrak, O. Plastic hinge length of reinforced concrete columns. ACI Struct. J. 2008, 105, 290–300. [Google Scholar]
- JTG/T B02-01-2008; Guidelines for Seismic Design of Highway Bridges. Ministry of Transport of the People’s Republic of China: Beijing, China, 2008.
- Zhu, B.L.; Wu, M.S. Research on the ductility coefficient of reinforced concrete flexural members—One of the studies on the seismic performance of reinforced concrete. J. Tongji Univ. Nat. Sci. 1978, 107–119. [Google Scholar]
- GB/T 50080-2016; Standard for Test Methods of Performance of Ordinary Fresh Concrete. China Architecture & Building Press: Beijing, China, 2016.
- Chadwell, C.B.; Imbsen, R.A. XTRACT: A Tool for Axial Force—Ultimate Curvature Interactions. In Proceedings of the Structures 2004: Building on the Past, Securing the Future, Nashville, Tennessee, 22–26 May 2004; ASCE: Reston, VA, USA, 2004; pp. 1–9. [Google Scholar]
- Karthik, M.M.; Mander, J.B.; Hurlebaus, S. Asr/def related expansion in structural concrete: Model development and validation. Constr. Build. Mater. 2016, 128, 238–247. [Google Scholar] [CrossRef]
- Chen, Y.; Dong, M.; Cheng, C.; Han, J.; Zhao, Y.; Jia, P. Experimental and analytical study on the bearing capacity of caisson foundation subjected to V–H combined load. Mar. Georesour. Geotechnol. 2025, 1–13. [Google Scholar] [CrossRef]
- Liu, T.F.; Ye, A.J.; Wang, X.W. Confinement effect of soil on plastic hinge length in extended pile-shafts. J. Tongji Univ. (Nat. Sci.) 2016, 44, 1490–1496. [Google Scholar]
- Sun, Z.G.; Wang, D.S.; Guo, X.; Li, X.L. Research on Equivalent Plastic Hinge Length of Reinforced Concrete Bridge Column. Chin. J. Highw. Transp. 2011, 24, 5664. [Google Scholar]
- Li, W.; Fan, H.T.; Jiang, H.M.; Chen, Y. Seismic behavior of demountable reinforced concrete (rc) beam-to-column joints with damage-control fuses. Buildings 2024, 14, 20. [Google Scholar]
- Chen, Y.M.; Ma, Y.Y.; Xu, Y.P.; Chen, W.Y.; Xia, T.D. Comparative analysis of precast square piles and PHC piles for flood protection work in soft soil areas. Chin. J. Geotech. Eng. 2013, 35, 986–989. [Google Scholar]
- Makki, R.O.; Fakhraldin, M.K. Modeling and analysis variable cross section pile driven in sandy soil using finite element. E3S Web. Conf. 2021, 318, 01005. [Google Scholar]

| Prototype Circular Pile Diameter/cm | Prototype Pile Cross-Section S/cm2 | Equivalent Square Sectional Dimension/mm | Scaled Factor | Model Pile Cross-Sectional Dimension/mm | Area-Similarity Ratio |
|---|---|---|---|---|---|
| 22.5 | 393.9 | 49.95 × 49.95 | 4 | 50 × 50 | 15.8 |
| 27.0 | 572.3 | 59.82 × 59.82 | 4 | 60 × 60 | 15.9 |
| 32.0 | 803.8 | 70.896 × 70.896 | 4 | 70 × 70 | 16.4 |
| Variable | Density | Length | Area | Force | Stress | Strain | Elastic Modulus | Shear Modulus | Bending Stiffness | Shear Rigidity | Time | Internal Friction Angle | Cohesion | |
|---|---|---|---|---|---|---|---|---|---|---|---|---|---|---|
| Notation | ρ | L | A | F | σ | ε | E | Gs | EI | Gs A | t | c | ||
| Basic dimension | M | 1 | 0 | 0 | 1 | 1 | 0 | 1 | 1 | 1 | 1 | 0 | 0 | 1 |
| L | −3 | 1 | 2 | 1 | −1 | 0 | −1 | −1 | 3 | 1 | 0 | 0 | −1 | |
| T | 0 | 0 | 1 | −2 | −2 | 0 | −2 | −2 | −2 | 0 | 1 | 0 | −2 | |
| ni | 1 | 4 | 16 | 16 | 1 | 1 | 1 | 1 | 256 | 16 | 1 | 1 | 1 | |
Disclaimer/Publisher’s Note: The statements, opinions and data contained in all publications are solely those of the individual author(s) and contributor(s) and not of MDPI and/or the editor(s). MDPI and/or the editor(s) disclaim responsibility for any injury to people or property resulting from any ideas, methods, instructions or products referred to in the content. |
© 2025 by the authors. Licensee MDPI, Basel, Switzerland. This article is an open access article distributed under the terms and conditions of the Creative Commons Attribution (CC BY) license (https://creativecommons.org/licenses/by/4.0/).
Share and Cite
Abuduweili, Y.; Ma, L.; Shi, K.; Zhu, X. Bearing Capacity and Deformation of Micropiles Considering Plastic Hinge. Buildings 2025, 15, 1168. https://doi.org/10.3390/buildings15071168
Abuduweili Y, Ma L, Shi K, Zhu X. Bearing Capacity and Deformation of Micropiles Considering Plastic Hinge. Buildings. 2025; 15(7):1168. https://doi.org/10.3390/buildings15071168
Chicago/Turabian StyleAbuduweili, Yipaliya, Li Ma, Kaixin Shi, and Xinlin Zhu. 2025. "Bearing Capacity and Deformation of Micropiles Considering Plastic Hinge" Buildings 15, no. 7: 1168. https://doi.org/10.3390/buildings15071168
APA StyleAbuduweili, Y., Ma, L., Shi, K., & Zhu, X. (2025). Bearing Capacity and Deformation of Micropiles Considering Plastic Hinge. Buildings, 15(7), 1168. https://doi.org/10.3390/buildings15071168