Abstract
Vibration modal parameters are widely used in structural damage identification due to their ease of measurement, facilitating rapid structural damage assessment in engineering practice. However, traditional vibration-based methods impose stringent requirements on data volume and accuracy, leaving room for improvement in computational efficiency and precision. To address this issue, a damage identification method combining the Sparrow Search Algorithm (SSA) and natural frequency sensitivity analysis is proposed. This method employs the SSA to solve the linear equations of frequency sensitivity to obtain structural damage parameters, thereby enabling structural damage assessment. The advantages of the proposed method are as follows: firstly, the SSA, compared to other swarm intelligence algorithms, can more accurately solve for damage parameters; secondly, sensitivity analysis is used to predefine the search area, thereby enhancing computational efficiency; furthermore, a conversion formula is applied to enhance computational accuracy in cases of significant damage. Three numerical cases and two experimental examples are used to validate the proposed algorithm, which is also compared with other swarm intelligence algorithms. The research results indicate that this method has significant advantages in locating damage and accurately assessing damage severity, with minimal misjudgment of undamaged units. The calculated damage parameters are closer to the true values compared to those obtained by other methods.
1. Introduction
Over the years, assessing structural damage has emerged as a critical concern in numerous fields, given its direct implications for structural safety. By monitoring alterations in vibration parameters, changes in dynamic response parameters induced by structural damage can be promptly detected, thereby facilitating the timely identification of such damage. When compared to other dynamic characteristics of structures, variations in the natural frequency are both simpler and more precise to measure. This attribute renders damage detection methods based on frequency more practical and feasible to implement. Consequently, frequency-based damage detection approaches have been among the earliest subjects of research. Based on a few natural frequencies, a method for damage identification of frame structures is proposed by Bicanic and Chen [1], which does not need knowledge of the modal shape of the damaged structures. Yang and Wang [2] introduced a novel damage detection approach that utilizes the natural frequency vector along with a natural frequency vector guarantee criterion. Hassiotis [3] proposed an optimization algorithm for damage identification based on the natural frequency, which was used to determine the degree of damage location through the relationship between the stiffness of the structure and its natural frequency and the introduction of Markov parameters. Based on the frequency method for damage identification, Liu et al. [4] located the damage using the ratio of the frequency change rates of different modal orders; however, this method is only effective for single damage. Zhong et al. [5] suggested a damage identification approach utilizing generalized inverse, which is used for the situation where the first few natural frequencies and corresponding modal displacements of the lossy structure are available, and verified it through numerical simulation. Based on the natural frequency and static displacement, Wang et al. [6] introduced a new interval analysis approach aimed at identifying the structural damage of truss structures and steel cantilever plates. Kim et al. [7] proposed a non-destructive method based on a few natural frequencies or a few vibration modes of the structure. Liu et al. [8] presented a technique for identify the damage of breathing cracked beams based on natural frequency. Du et al. [9] developed a second-order perturbation formula for natural frequency and demonstrated that it is possible to successfully identify the location and severity of damage by utilizing only the measured natural frequency of the structure.
Analyzing natural frequencies does not require highly detailed finite element models or sophisticated theoretical reasoning. It is responsive to changes in a structure’s overall stiffness and mass distribution, which makes it a valuable tool for identifying global damage or deterioration in various types of structures. However, the natural frequency method has limitations when applied to nonlinear systems and may not be sensitive enough to detect damage that only slightly affects the structural stiffness. In these instances, frequency indicators should be used in conjunction with other dynamic indicators, such as mode shapes and damping, to achieve more accurate damage detection. Casas and Aparicio [10] proposed a structural damage detection method that requires only a single non-first mode. Ditommaso and Ponzo [11] automatically assessed the variable fundamental frequency and damping factor of nonlinear structures under strong motion phases by combining nonlinear interference analysis with the Fourier Transform. Xiang et al. [12] proposed a method for bridge damage identification that integrates modal strain energy, frequency, and information entropy. Ren et al. [13] utilized the response of structures under seismic loading to identify the damage location by comparing the energy ratio of the first intrinsic mode function characteristics before and after the damage occurred. Time-frequency analysis can better identify dynamic feature changes caused by damage, such as those resulting from seismic events, and accurately determine the location and timing of the damage. However, this analysis often involves complex algorithms and substantial computations, leading to low computational efficiency, which makes it challenging to meet real-time processing requirements. For high-dimensional or complex systems, as well as strongly nonlinear systems, combined input-response dynamics methods may entail substantial computational demands and are difficult to achieve [14,15]. To address the computational challenges in damage detection, swarm intelligence optimization algorithms have been introduced to leverage their advantages in seeking optimal solutions and resisting data noise. Krishnanunni et al. [16] evaluated the position and degree of damage according to vibration data and static displacement, and solved the defined objective function based on Cuckoo algorithm. Liu [17] constructed an objective function according to the natural frequency and vibration mode, and established a wavelet-particle swarm genetic optimization algorithm to identify the damage position and extent. Xie et al. [18] improved the gray Wolf algorithm from the aspects of population initialization, convergence factor and location update, and used the proposed objective function to identify structural damage. Mohebian et al. [19] applied the Pathfinder algorithm (PFA) to assess the extent of potential damage in an area by optimizing an objective function related to natural frequency and modal shape. Based on the frequency and curvature mode of a bridge, Qin et al. [20] proposed a multi-label classification method based on convolutional neural networks (CNN-MLC), which can accurately identify multiple damaged locations. Chen et al. [21] proposed a two-stage damage identification method for beam structures based on the Particle Swarm Optimization (PSO) algorithm and the mean damage probability. Begambre and Laier [22] proposed a damage identification method based on the PSO model using frequency domain data and successfully determined the location and severity of the damage. Huang et al. [23] proposed a method that integrates substructure analysis, unit relative modal strain energy, and the enhanced Whale Optimization Algorithm (LWOA), enabling precise identification of the location and severity of various structural damages. Zenzen et al. [24] used Genetic algorithms (GA) and Bat algorithms (BA) for estimating damage location and severity. Their findings indicate that BA outperforms GA in terms of both accuracy and computational efficiency. Zhang and Ma [25] employed an enhanced BP neural network for damage localization and identification in concrete bridges, with effectiveness validated through examples. Hao et al. [26] considered three criteria—frequency change, modal change, and their combination—and employed Genetic Algorithms (GA) to detect damage units, even with an inaccurate analytical model. Xiong and Lian [27] developed an Improved Fruit Fly Optimization Algorithm (IFOA) to boost convergence speed and algorithmic precision. Li et al. [28] proposed a method that includes secondary optimization of objective functions, using the Whale Optimization Algorithm (WOA) to tackle dual objectives. Numerical simulations indicate that the second objective function is more effective in identifying multiple damages in complex structures.
In summary, it is widely recognized that frequency can be measured more accurately and easily than mode shapes and damping, thus making frequency-based damage detection more feasible in practical applications. However, the tested frequency data are limited and susceptible to contamination, leaving substantial room for improving the computational accuracy of damage detection. Swarm intelligence optimization algorithms can help resolve the computational accuracy issues encountered during damage detection. Consequently, this paper proposes a frequency-based damage assessment method that employs only a small number of natural frequencies and the Sparrow Search Algorithm (SSA) [29]. The SSA is an emerging swarm intelligence optimization algorithm inspired by the foraging and anti-predation behaviors of sparrows. It simulates the roles of producers, scroungers, and vigilant sparrows in the population to continuously optimize individual positions to determine the optimal solution. The SSA boasts a simple structure, few tuning parameters, and is easy to implement. Compared to other swarm intelligence optimization methods, the SSA exhibits better search accuracy and stability for unimodal and multimodal problems, with strong global exploration capabilities and fast convergence speed. Additionally, the SSA is robust and versatile, making it suitable for various optimization tasks. This work represents the first attempt to apply the SSA in combination with a sensitivity analysis of vibration parameters to address the problem of structural damage identification. Therefore, only vibration frequency parameters were utilized in this work, taking advantage of their ease of measurement and high accuracy. Subsequent research will also explore the use of other types of vibration parameters, such as mode shapes or damping. The innovations of the proposed method are highlighted as follows: Firstly, the SSA is combined with frequency sensitivity analysis for the first time to find the optimal solution to the damage identification equations. This approach fully leverages the rapid and precise capabilities of the SSA. Secondly, through sensitivity analysis, the search range is pre-defined, thereby enhancing the computational efficiency of the SSA. Thirdly, for cases of significant damage, a conversion formula is employed to compensate for the deficiencies of the sensitivity methods, significantly improving the computational accuracy under large damage conditions. The remainder of this paper is organized as follows. Section 2 briefly reviews the theory of natural frequency sensitivity and proposes a damage identification method that combines natural frequencies with SSA intelligent algorithms. In Section 3 and Section 4, two numerical examples and two experimental cases are employed to demonstrate the effectiveness of the proposed method. The results indicate that the proposed method can effectively determine damage locations and assess damage severity. Section 5 summarizes the main findings and conclusions of this research.
2. Theoretical Development
As stated previously, the natural frequency is a widely utilized parameter in structural model updating and damage detection. In engineering practice, the low-order natural frequencies of structural vibrations can be measured both conveniently and precisely. For a structure with degrees of freedom (DOFs), the structural free vibration modes can be theoretically deduced by solving the specific eigenvalue problem as:
where and represent the mass matrix and stiffness matrix of the structure, respectively, and are the -th eigenvalue and eigenvector. The relationship between the eigenvalue and the corresponding natural frequency is given by the following equation as:
where is the -th natural frequency. During model updating or damage detection, the mass matrix is generally regarded as a constant. According to the theory of modal sensitivity analysis [30], the first-order sensitivity of the -th eigenvalue can be calculated as:
where is the stiffness disturbance parameter of the -th unit, and is the -th elementary stiffness matrix. The objective of model updating or damage detection is to ascertain the modified values of the stiffness parameters by analyzing the discrepancies between the measured and theoretically calculated eigenvalues. If represents the -th measured eigenvalue, then the eigenvalue change can be computed as follows:
Using the Taylor series expansion, when the finite element model consists of elements, the eigenvalue change can be approximated as follows:
Utilizing the measured eigenvalues, one can facilitate damage assessment by deriving the first-order sensitivity equation as follows:
The unknown stiffness disturbance parameter can be obtained by solving the linear Equation (6), which can be used for model updating or damage assessment. The solution methods for Equation (6) include the traditional least squares method, genetic algorithm (GA), particle swarm optimization (PSO) algorithm, and cuckoo search (CS). In this work, the SSA is utilized for the first time to solve the frequency sensitivity Equation (6) in order to obtain the damage parameters of each unit. The main rationale for adopting this innovation lies in the SSA’s demonstrated superior performance compared to existing swarm intelligence optimization algorithms in addressing other optimization problems [29]. Therefore, applying the SSA to solve the frequency sensitivity equation is expected to yield better results than other methods. The SSA is an innovative swarm optimization algorithm that draws inspiration from the collective intelligence, foraging strategies, and anti-foraging tactics exhibited by sparrows. In the SSA, the role classification and main behaviors of sparrows include: (1) Foraging. Sparrows engaged in hunting are categorized as explorers and followers. Sparrows that can find better food (with higher fitness function values) are explorers, while the remaining sparrows are followers influenced by the direction of the explorers. (2) Anti-foraging. A certain proportion of sparrows in the population, upon detecting the arrival of foraging sparrows, will conduct reconnaissance and take corresponding actions. These sparrows can be referred to as investigators. In order to design the mathematical formulas for the algorithm, the SSA idealizes the behaviors and actions of sparrows to establish the following behavioral rules. (1) Explorers usually have higher energy reserves and are responsible for searching for areas with abundant food within the entire population, providing foraging areas and directions for all the followers. In model establishment, the level of energy reserves depends on the fitness value of each individual sparrow. (2) Once a sparrow detects a predator, individuals start to emit chirps as an alarm signal. When the alarm value exceeds the safety value, explorers lead the followers to other safe areas for foraging. (3) The identities of explorers and followers are dynamically changing. As long as a sparrow can find a better food source, it can become an explorer. However, the proportions of explorers and followers in the entire population remain constant. In other words, if one sparrow becomes an explorer, the other must become a follower. (4) The lower the energy of a follower, the worse their foraging position within the entire population. Some hungry followers are more likely to fly to other places to forage in order to obtain more energy. (5) During the foraging process, followers can always search for the explorer that provides the best food and then obtain food from the best source or forage around the explorer. Meanwhile, some followers may continuously monitor the explorer to compete for food resources in order to increase their predation rate. (6) When aware of danger, sparrows at the edge of the group will quickly move to safe areas to obtain better positions, while sparrows in the middle of the population will move randomly to get closer to other sparrows. Based on the aforementioned behavioral rules, the specific operational steps and main mathematical formulas used in the SSA are as follows:
- Step 1.
- Group location initialization is done by
- Step 2.
- Explorer location update is done by
- Step 3.
- The follower location update is performed as follows:
- Step 4.
- Investigator location updates are performed as follows:
Group intelligence optimization algorithms generally require numerous iterations to converge to the optimal solution, which is a common drawback of these methods. The SSA method also shares this limitation. One of the reasons for this flaw is that the search space is often set too large, resulting in an excessively high initial objective function value, which in turn increases the number of iterations and may even hinder convergence. To reduce the number of iterations in the SSA method, a feasible approach is to narrow the search range beforehand. However, the search interval cannot be arbitrarily narrowed down, as it may exclude the correct solution. For structural damage assessment problems, theoretically, the range of values for the damage parameters of each unit should be within the interval [0, 1]. Specifically, a damage parameter of 0 indicates that the unit is undamaged, while a damage parameter of 1 signifies that the unit is completely destroyed. However, when applying the SSA method to solve the frequency sensitivity Equation (6), the search interval for each damage parameter cannot be set to [0, 1]. This is because the frequency sensitivity equation is only a linear approximation of the frequency difference before and after damage, and the sensitivity equation is accurate only when the damage level is relatively low. A more reasonable search interval needs to be constructed to achieve the dual purpose of reducing the number of iterations and covering a wider range of damage scenarios. The linear approximation in the sensitivity equation, which neglects higher-order terms of second order and above, results in calculated damage parameters that are consistently larger than their actual values. The greater the actual extent of damage, the larger the discrepancy between the calculated damage parameters derived from the sensitivity equation and their true values. To compensate for the deviations caused by the linear approximation, higher-order sensitivity methods or iterative algorithms are commonly used [31], but both approaches incur significant computational expenses. Reference [32] discusses a straightforward method to address the linear approximation by combining the Sherman–Morrison–Woodbury formula and the Neumann series expansion. Reference [33] uncovers the fundamental relationship between stiffness disturbance parameters (i.e., damage parameters) and flexibility disturbance parameters from the physical perspective. The research findings indicate that the link between stiffness disturbance parameters and structural vibration eigenvalues is primarily facilitated by flexibility disturbance parameters. The damage parameters obtained through the first-order sensitivity equation should actually be interpreted as flexibility disturbance parameters, and the conversion relationship between them is as follows:
Equation (14) can also be rewritten as:
In Equations (14) and (15), represents the true damage parameter, while essentially represents the flexibility disturbance parameter. Therefore, the value range of is [0, 1], and the value range of can be calculated using Equation (15). Accordingly, the search interval for the SSA method is determined by calculating based on the value range of the damage parameters through Equation (15). For example, if the value range of the damage parameters is [0, 0.75], then the corresponding search interval is [0, 3]. If the value range of the damage parameters is [0, 0.99], then the corresponding search interval is [0, 99]. Therefore, a reasonable search interval can be predetermined based on specific damage conditions to accelerate the convergence of the SSA and obtain the optimal solution quickly. Generally, the interval [0, 99] can be used for most damage identification scenarios. In practice, based on a rough estimate of the damage condition, a narrower search interval can also be predetermined using Equation (15) to further enhance the computational efficiency. The second innovation of this work is the adoption of the aforementioned pre-defined search region. Furthermore, based on the aforementioned illustration, the optimal solution obtained by the SSA is essentially a flexibility disturbance parameter rather than the true damage parameter. Based on the solution obtained by the SSA, Equation (14) should be used to obtain the true damage parameter, especially for scenarios involving large damage; otherwise, the error would be significant. Generally, for damage parameters obtained through SSA calculations, if the value exceeds 0.15, Equation (14) should be used to calculate a more precise degree of damage. The third innovation point of this study is utilizing Equation (14) to improve the results of the SSA.
In the following case studies, the metrics used to measure the performance of various swarm intelligence optimization algorithms include the error rate, computation time, accuracy, and number of false positives and false negatives. The error rate is defined as the percentage of the number of incorrectly identified damages to the total number of damages identified by the algorithm, that is,
where is the error rate, represents the number of incorrectly identified damages, and represents the total number of damages identified by the algorithm. In terms of computation time, if various algorithms achieve very similar objective function values after iterations, the computer time consumed by each algorithm can be recorded for a comparison. Recognition accuracy is defined as the degree of closeness between the calculated damage parameter and the actual damage parameter. The accuracy is calculated as follows:
where is the recognition accuracy, and represent the true value and the calculated value of the damage parameter, respectively.
3. Numerical Examples
3.1. A Space Truss Structure
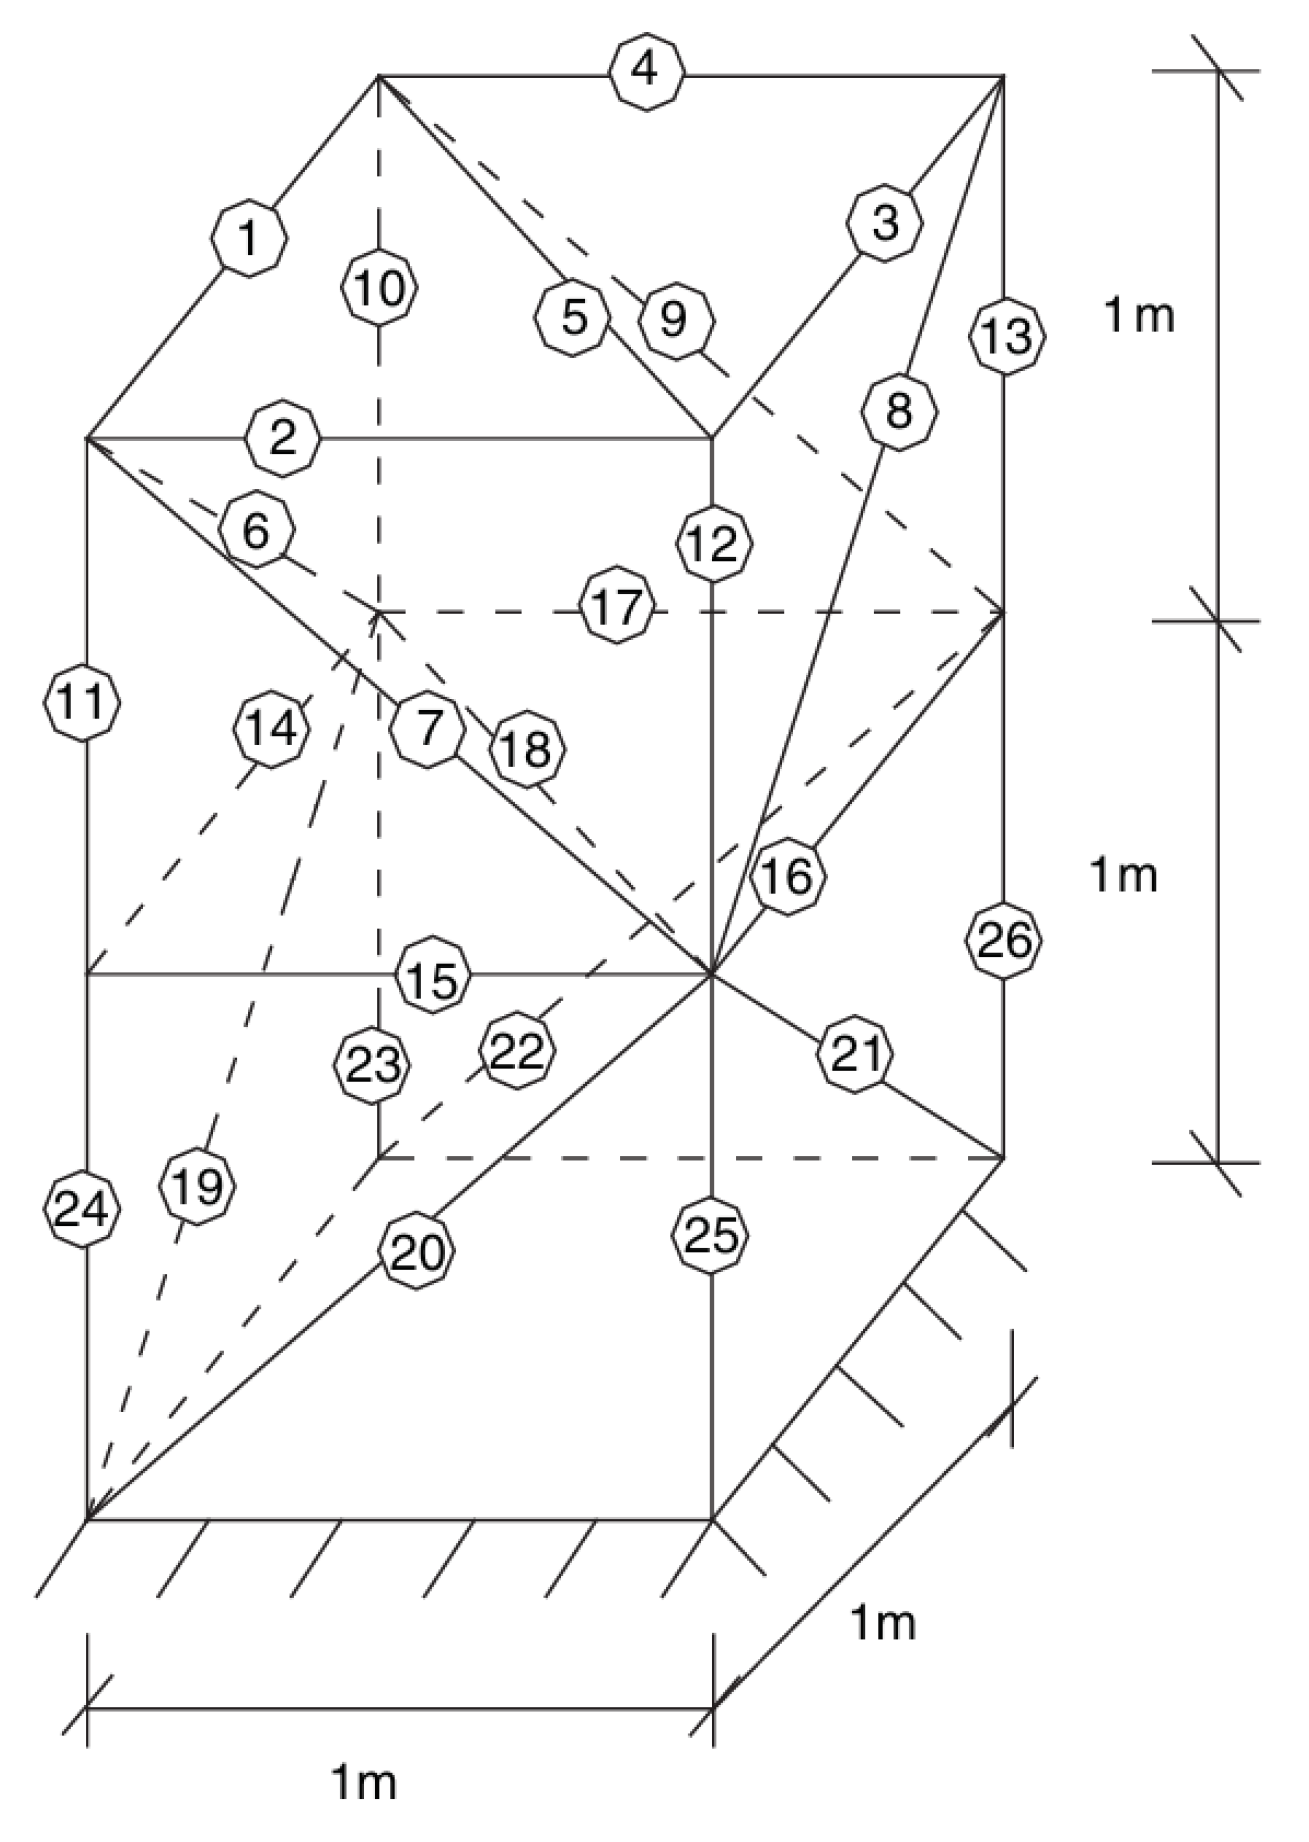
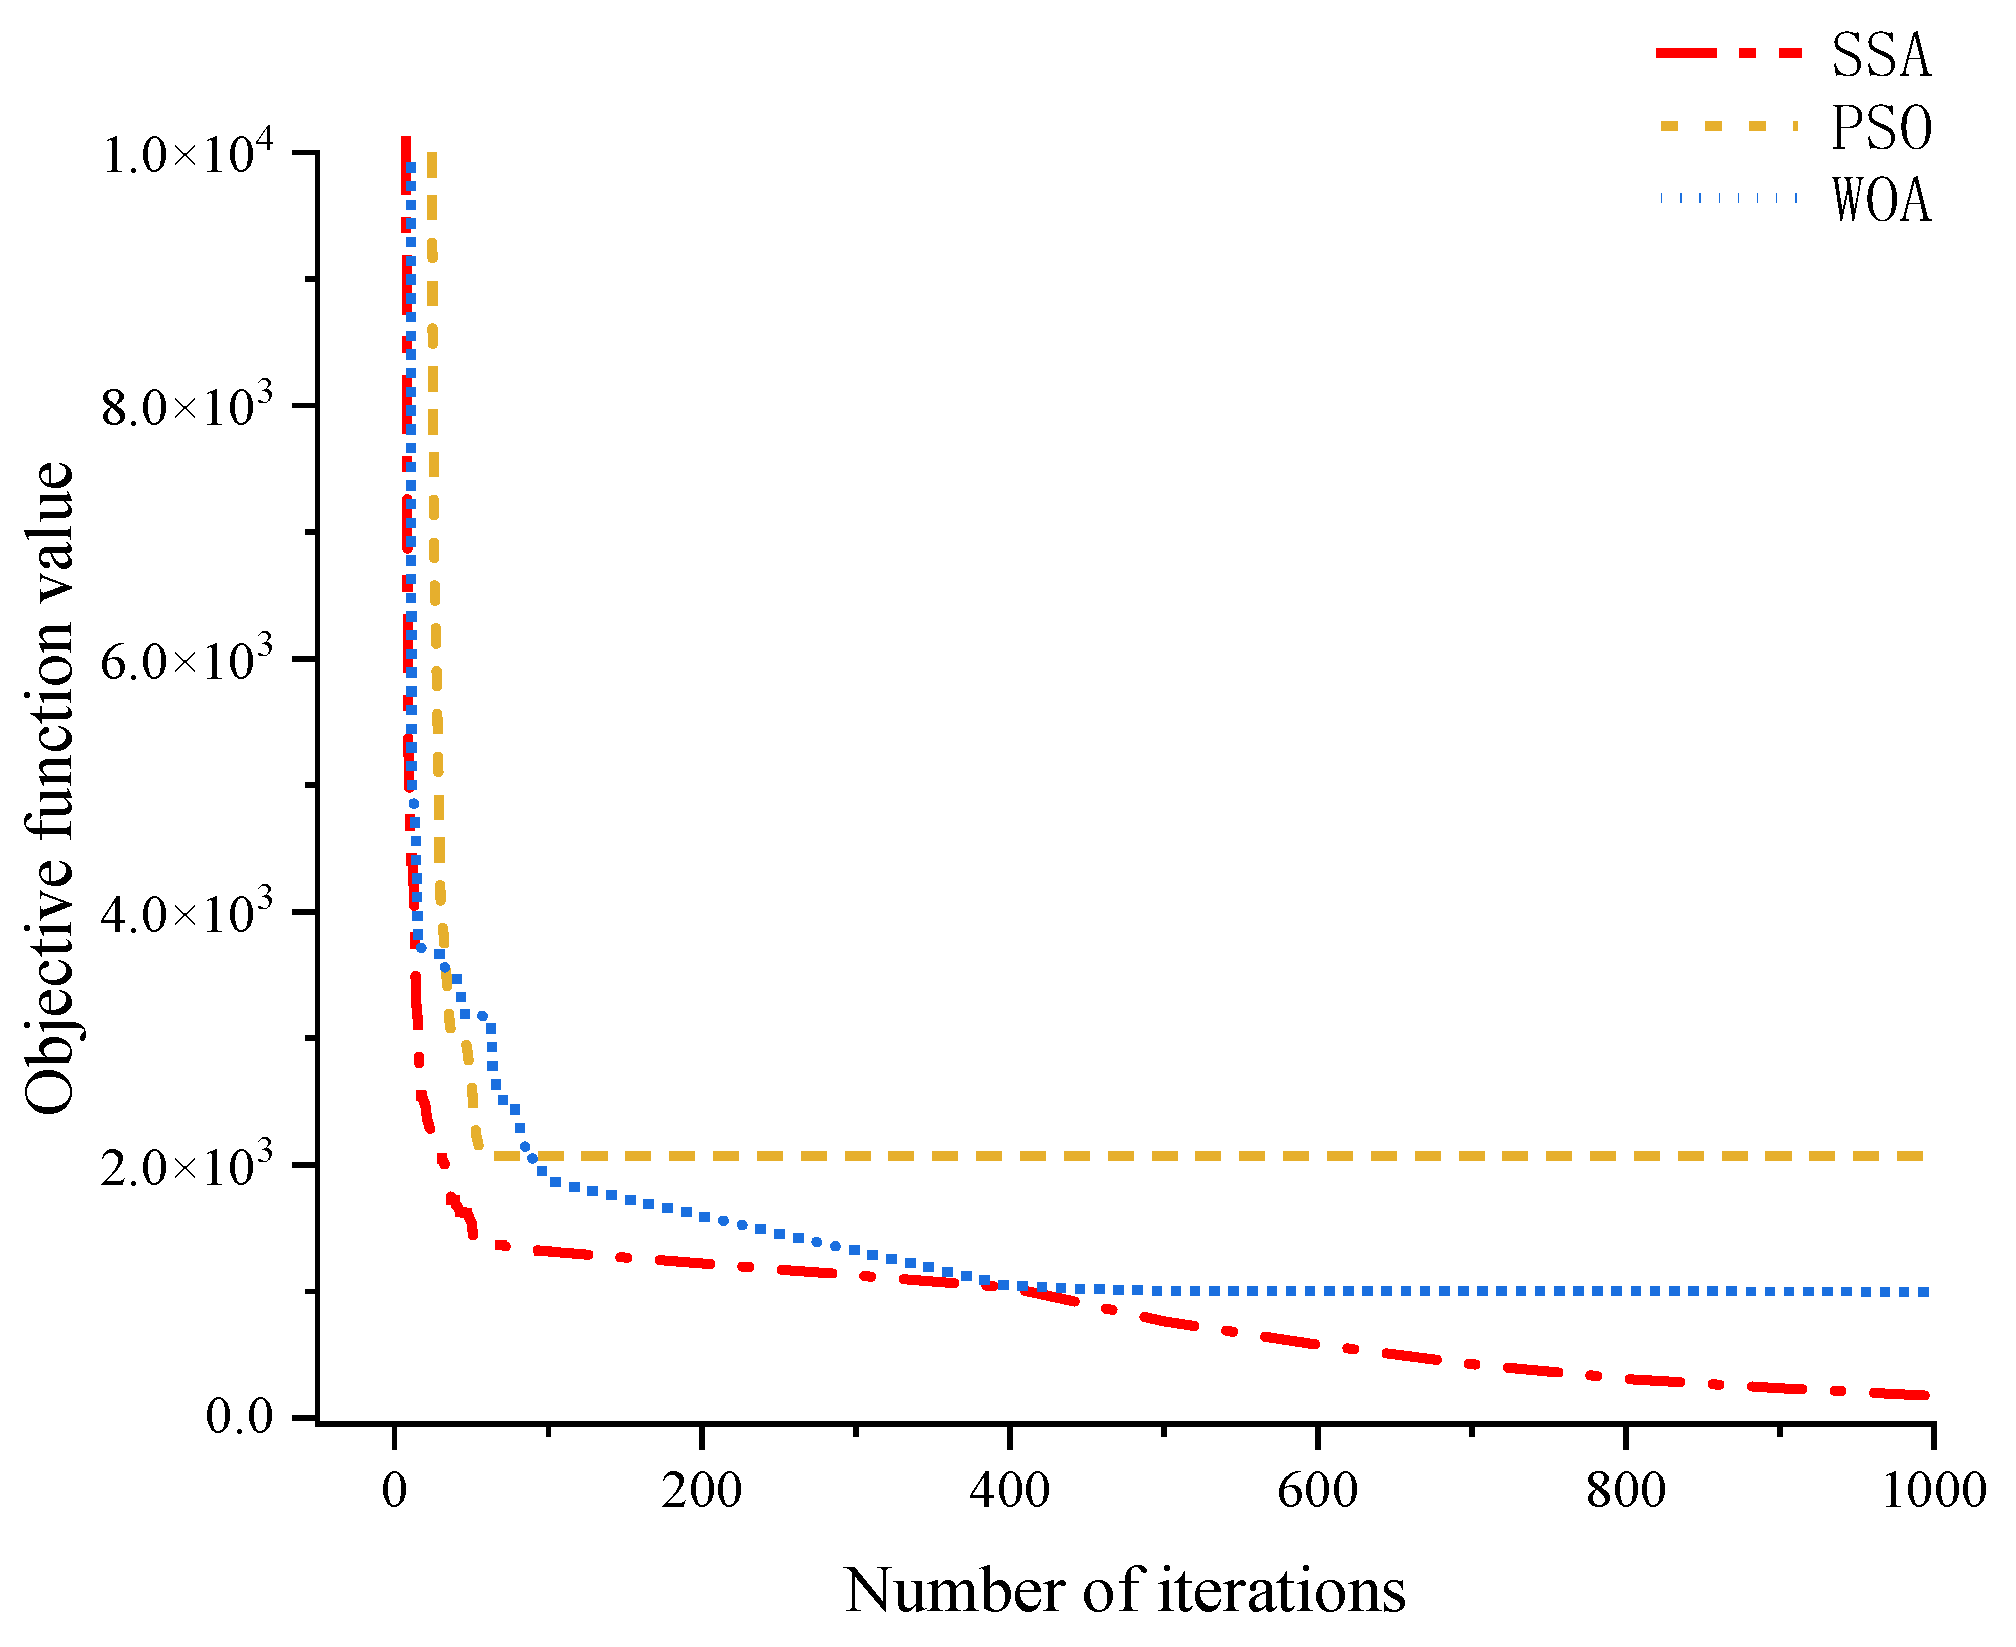
Figure 1 shows the spatial truss structure model used in this example, which is composed of 12 nodes and 26 truss elements, with a total freedom of 24 nodes. The basic parameters of the structure are Young’s modulus , density and cross-sectional area . The damage is simulated as a 15% stiffness reduction for unit 7 and 20% for unit 16. The proposed method is used for damage identification and calculation. The eigenvalue sensitivity and eigenvalue difference vector are calculated by Equations (1)–(5), respectively. The objective function is defined as follows:
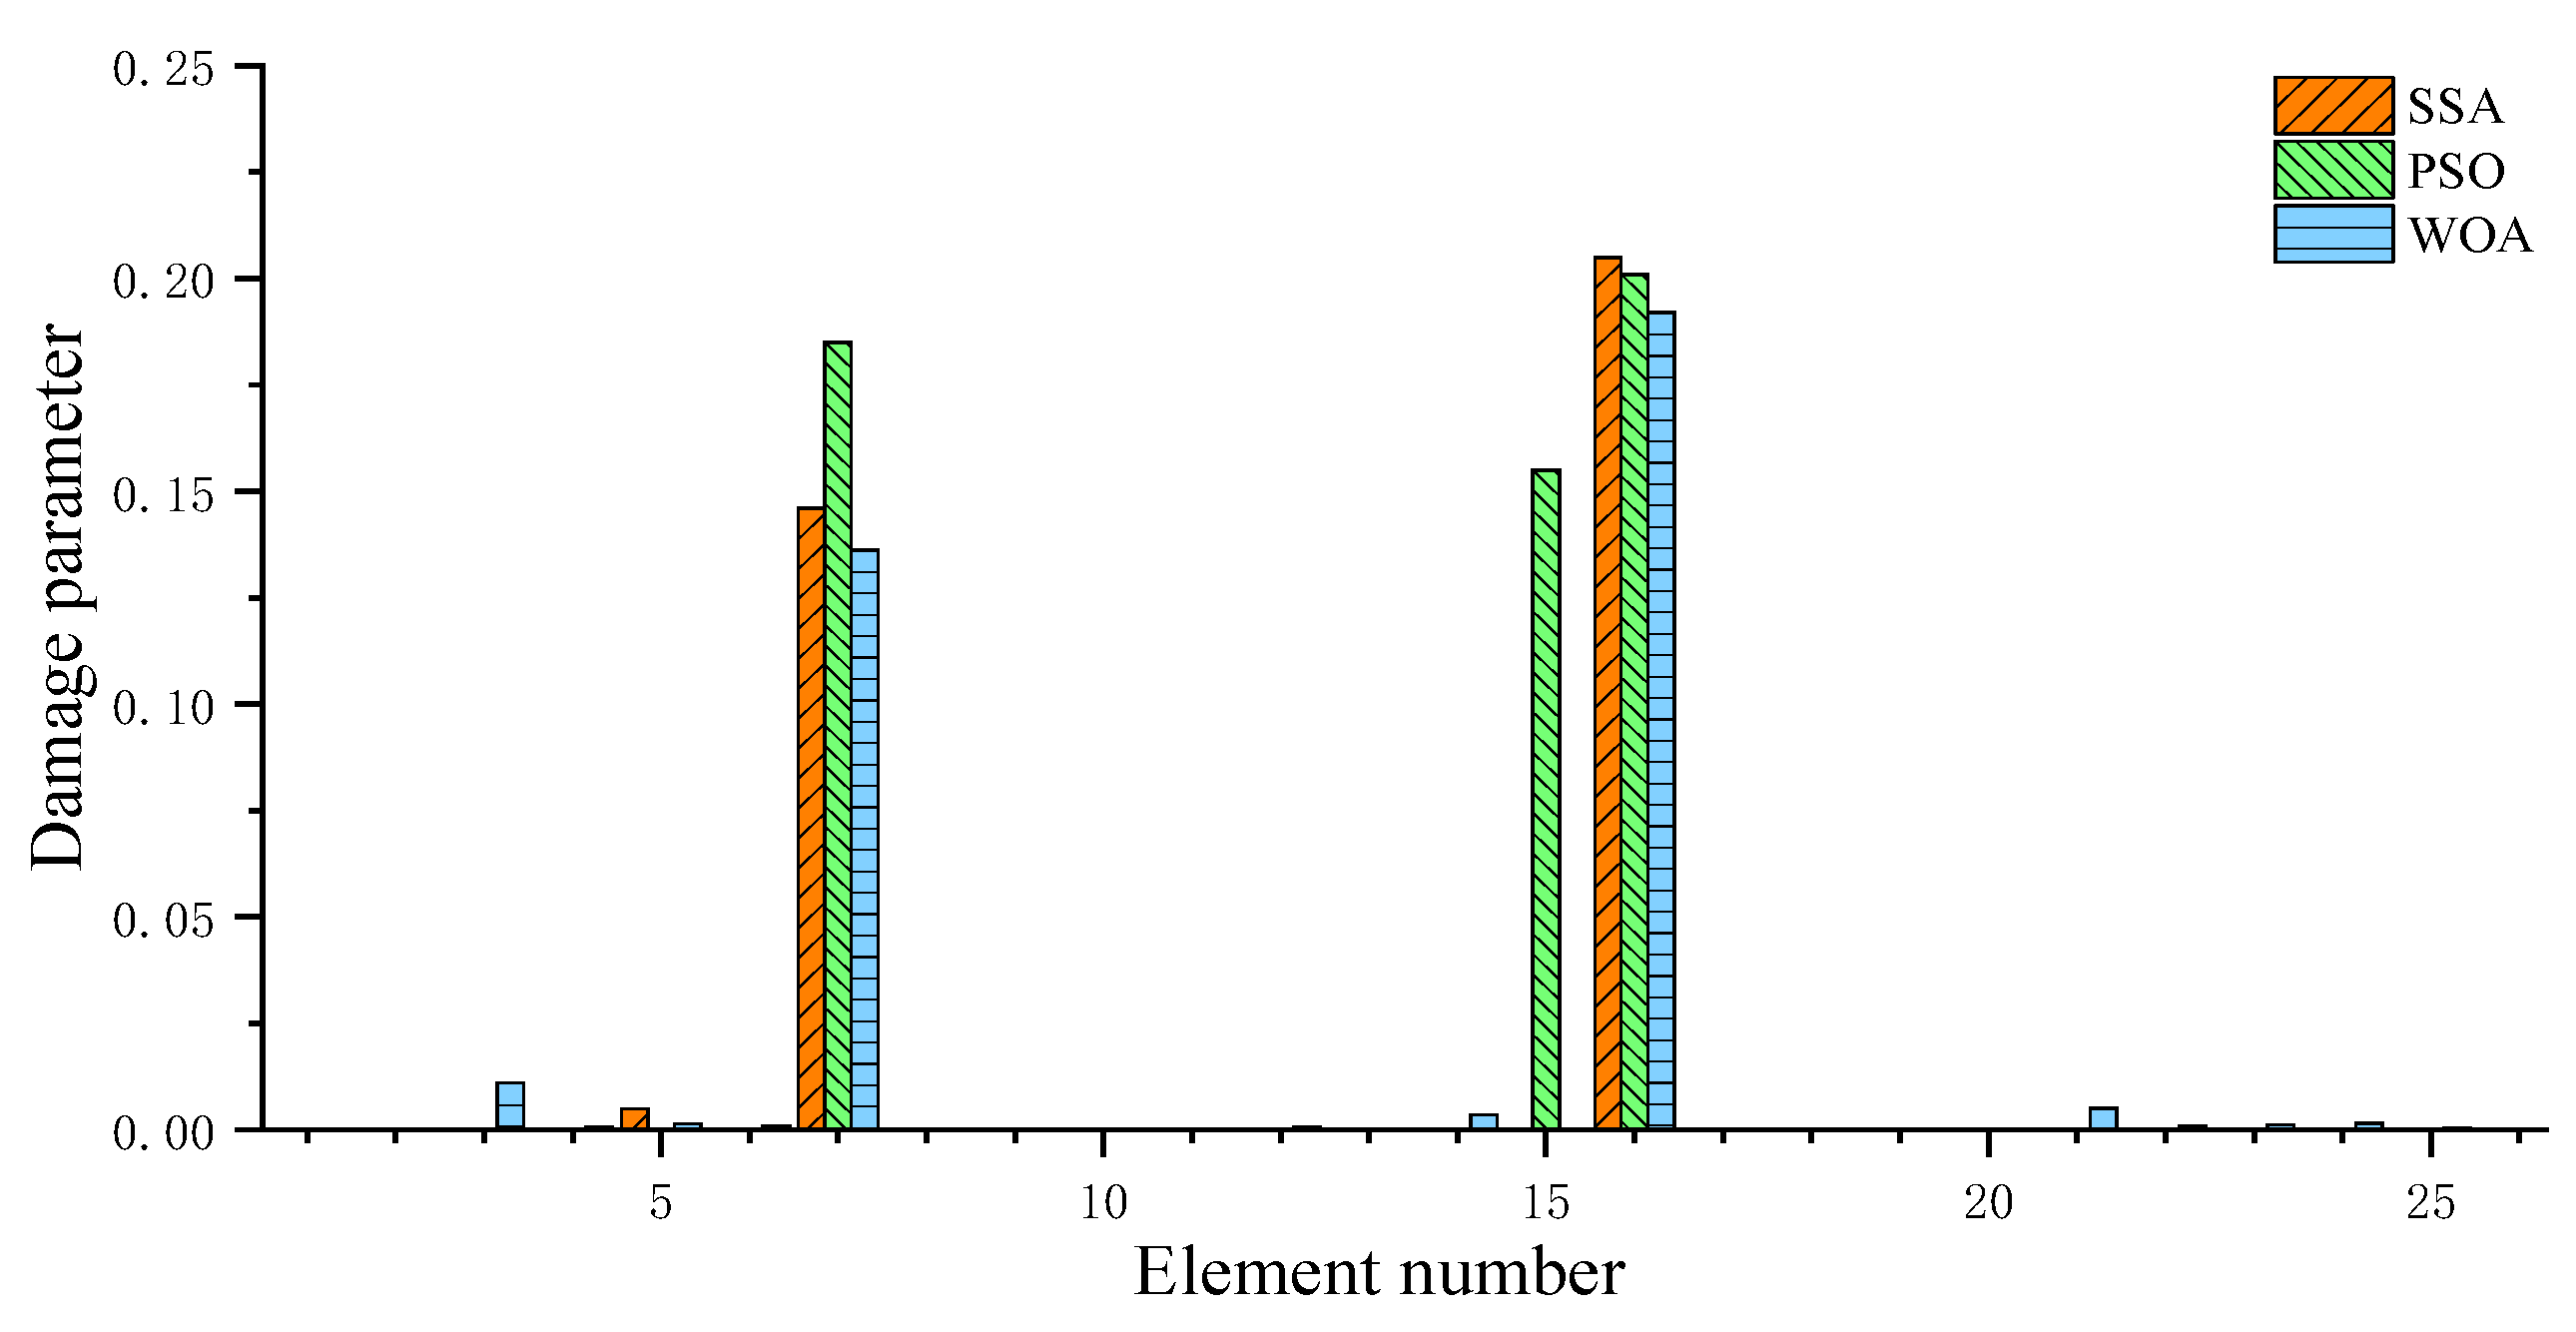
where represents a regularization coefficient that reflects the fixed error introduced by the linear approximation in the frequency sensitivity equation, and its value is set to be 0.05 times the 2-norm of . The fundamental settings for the SSA are as follows: population size = 120, number of iterations = 1000, proportion of explorer populations = 20%, upper limit = 99, and lower limit = 0. In the subsequent examples, the fundamental settings for the SSA remain the same as those in this example. For comparison, the particle swarm optimization (PSO) algorithm, whale optimization algorithm (WOA), and genetic algorithm (GA) were also used for damage identification of the structure. However, since the GA cannot converge and provide stable calculation results, only the calculation results of PSO and WOA are provided for comparison with the SSA. Figure 2 shows the iteration process of the three algorithms, and Figure 3 presents the damage parameters calculated by these optimization algorithms. As shown in Figure 2, as the number of iterations increases, the SSA achieves the smallest objective function value. This indicates that the SSA has a faster convergence rate than the other algorithms. The PSO reaches its computed optimal solution around the 100th iteration, with an objective function value of approximately 2000, after which it is unable to further optimize. The WOA reaches the calculated optimal solution around the 500th iteration, and the objective function value is about 1000. No further optimization can be achieved after that. In contrast, the SSA not only demonstrates superior performance during the initial convergence phase but also continues to perform effective computations in later iterations, further reducing the objective function. By the 1000th iteration, the objective function value of the SSA decreases to 175, and it gradually reduces to around 14 in subsequent iterations, thereby demonstrating the high computational efficiency of the SSA. As shown in Figure 3, both the SSA and WOA results clearly indicate defects in elements 7 and 16; however, the PSO method indicates that elements 7, 15, and 16 are damaged. Compared with the true values, it is evident that the PSO method falsely identifies element 15 as a damaged location, while the SSA and WOA achieve zero false positives. For ease of comparison, Table 1 lists the error rate, accuracy, and number of false positives and false negatives for the three algorithms. It should be noted that in this example, after 1000 iterations, the objective function values obtained by the three algorithms vary significantly. Therefore, no comparison of the computation time was conducted, and the computational efficiency was directly and intuitively measured by ranking the objective function values. As stated before, for damage parameters obtained through SSA calculations, if the value exceeds 0.15, Equation (14) is used to calculate a more precise degree of damage, as follows: For instance, the damage parameter for element 16 directly calculated by SSA is 0.2579. When further refined using Equation (14), the final value of the damage parameter is 0.205. Evidently, the latter is closer to the true value of 0.2. This demonstrates that for scenarios involving significant damage, applying Equation (14) can yield more accurate damage parameters. The recognition accuracy of the SSA method refers to the calculation accuracy of the final damage parameter values obtained using Equation (14). As can be seen from Table 1, in terms of error rate, PSO is significantly higher than WOA and SSA; in terms of recognition accuracy, SSA is superior to WOA. Although the SSA has a lower recognition accuracy than PSO for unit 16, when considering the error rate and recognition accuracy of the other units comprehensively, the overall performance of the SSA is the best among the three algorithms.

Figure 1.
A space truss structure.
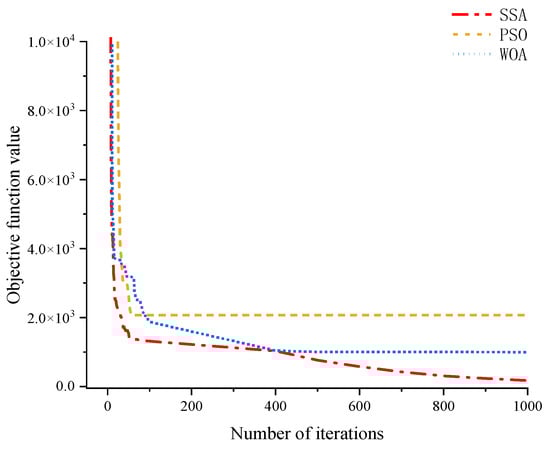
Figure 2.
SSA, WOA, and PSO iteration processes for the space truss structure.
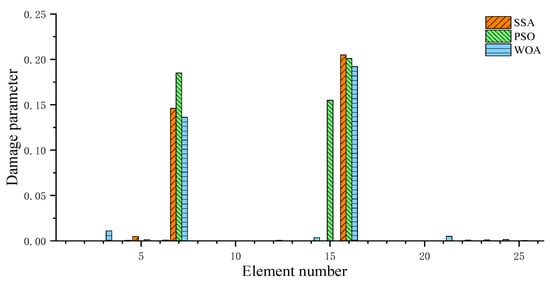
Figure 3.
SSA, WOA, and PSO calculation results for the space truss structure.

Table 1.
Performance comparison of SSA, WOA, and PSO for the space truss structure.
3.2. A Plate Structure
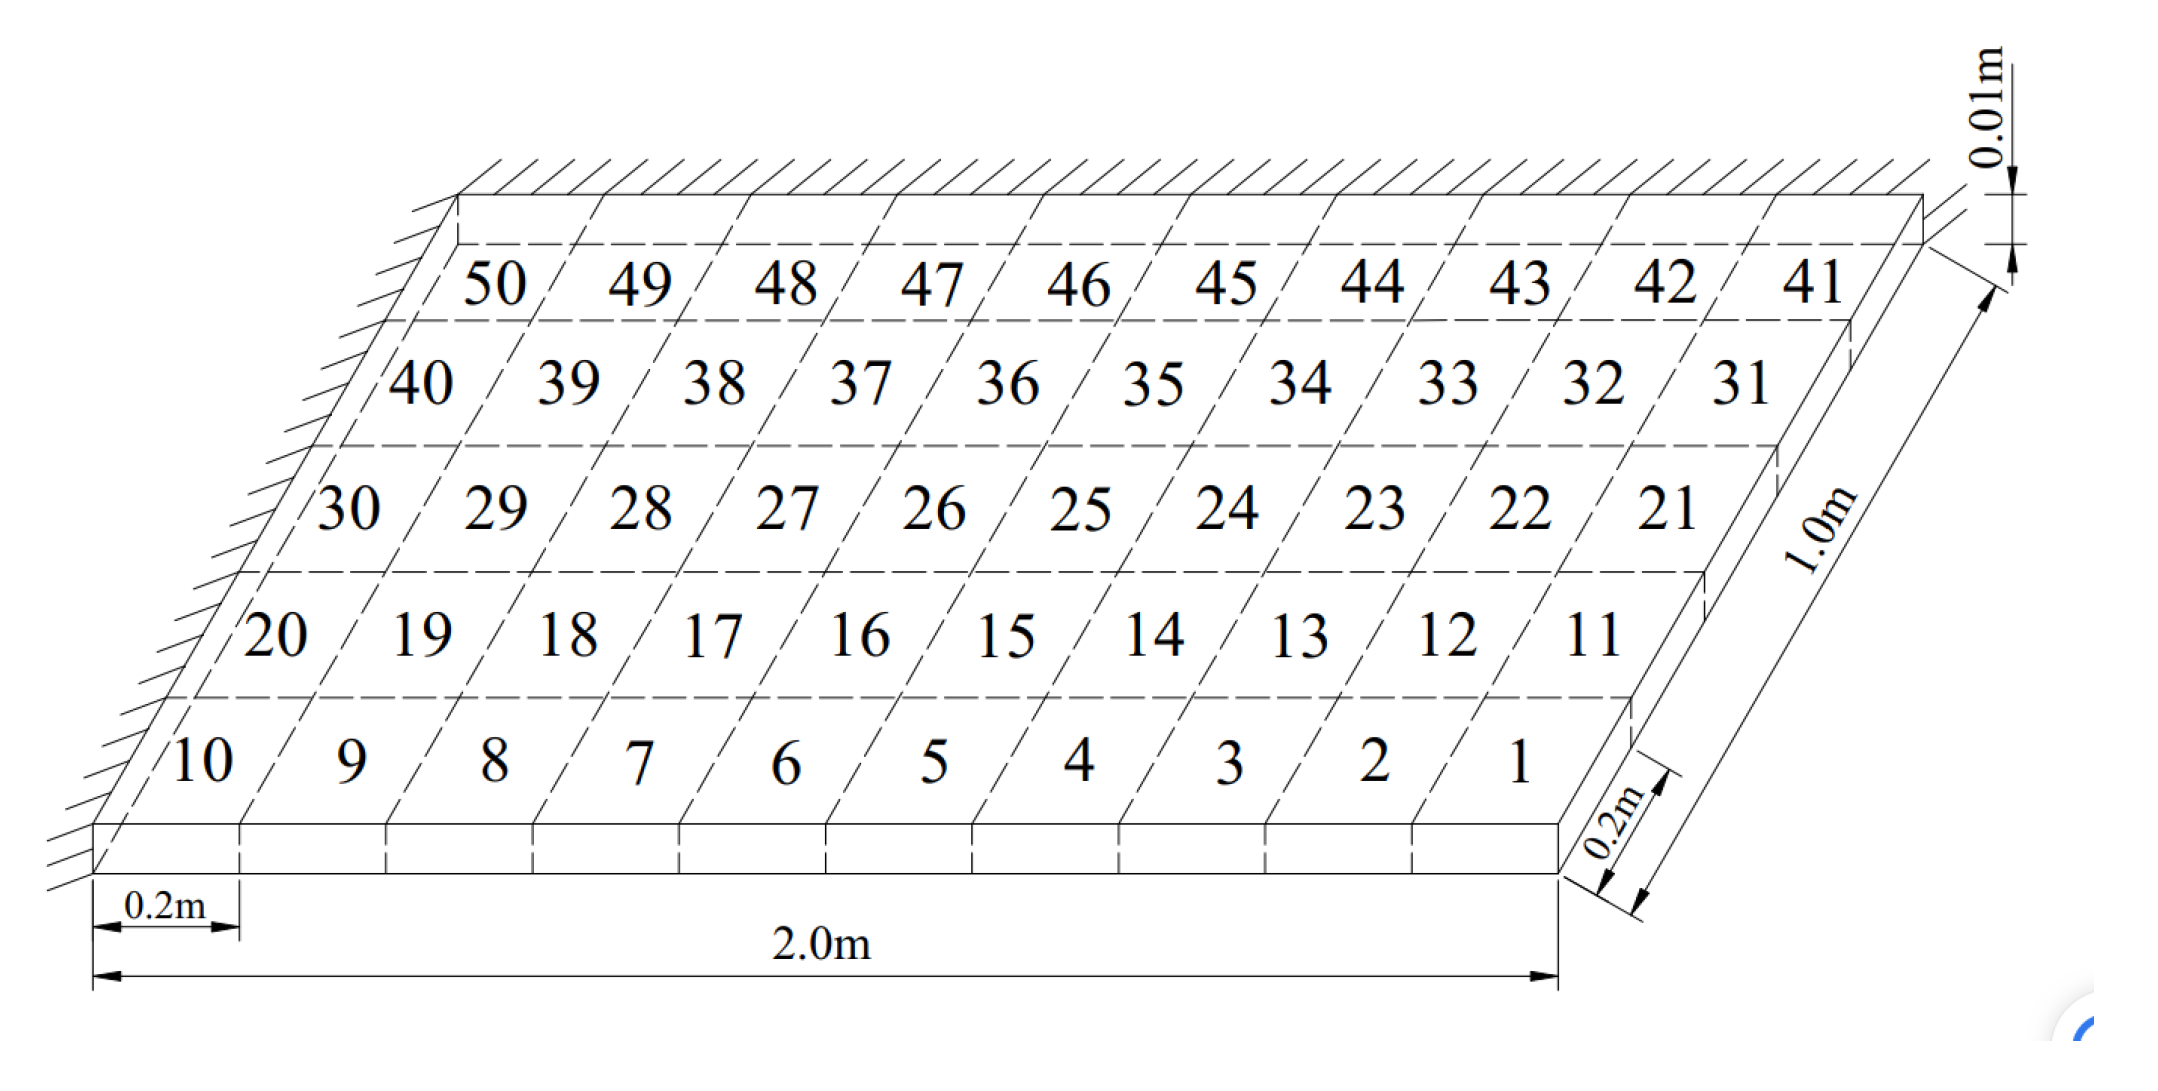
The plate structure illustrated in Figure 4 is used as a second example to demonstrate the effectiveness of the proposed methodology. Constructed from steel, this model has an elastic modulus of 200 GPa, a density of 7800 kg/m3, and a Poisson ratio of 0.3. It comprises 50 solid element units, identical in composition to those depicted in Figure 4. For the damage simulation, it is presumed that elements 12 and 20 experience a reduction in the elastic modulus by 20% and 15%, respectively.
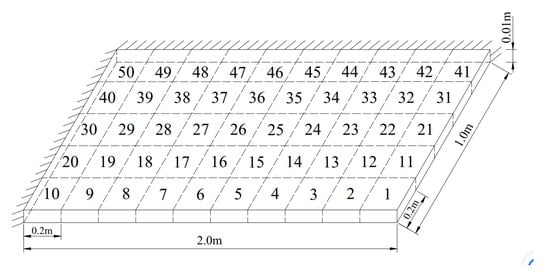
Figure 4.
A plate structure.
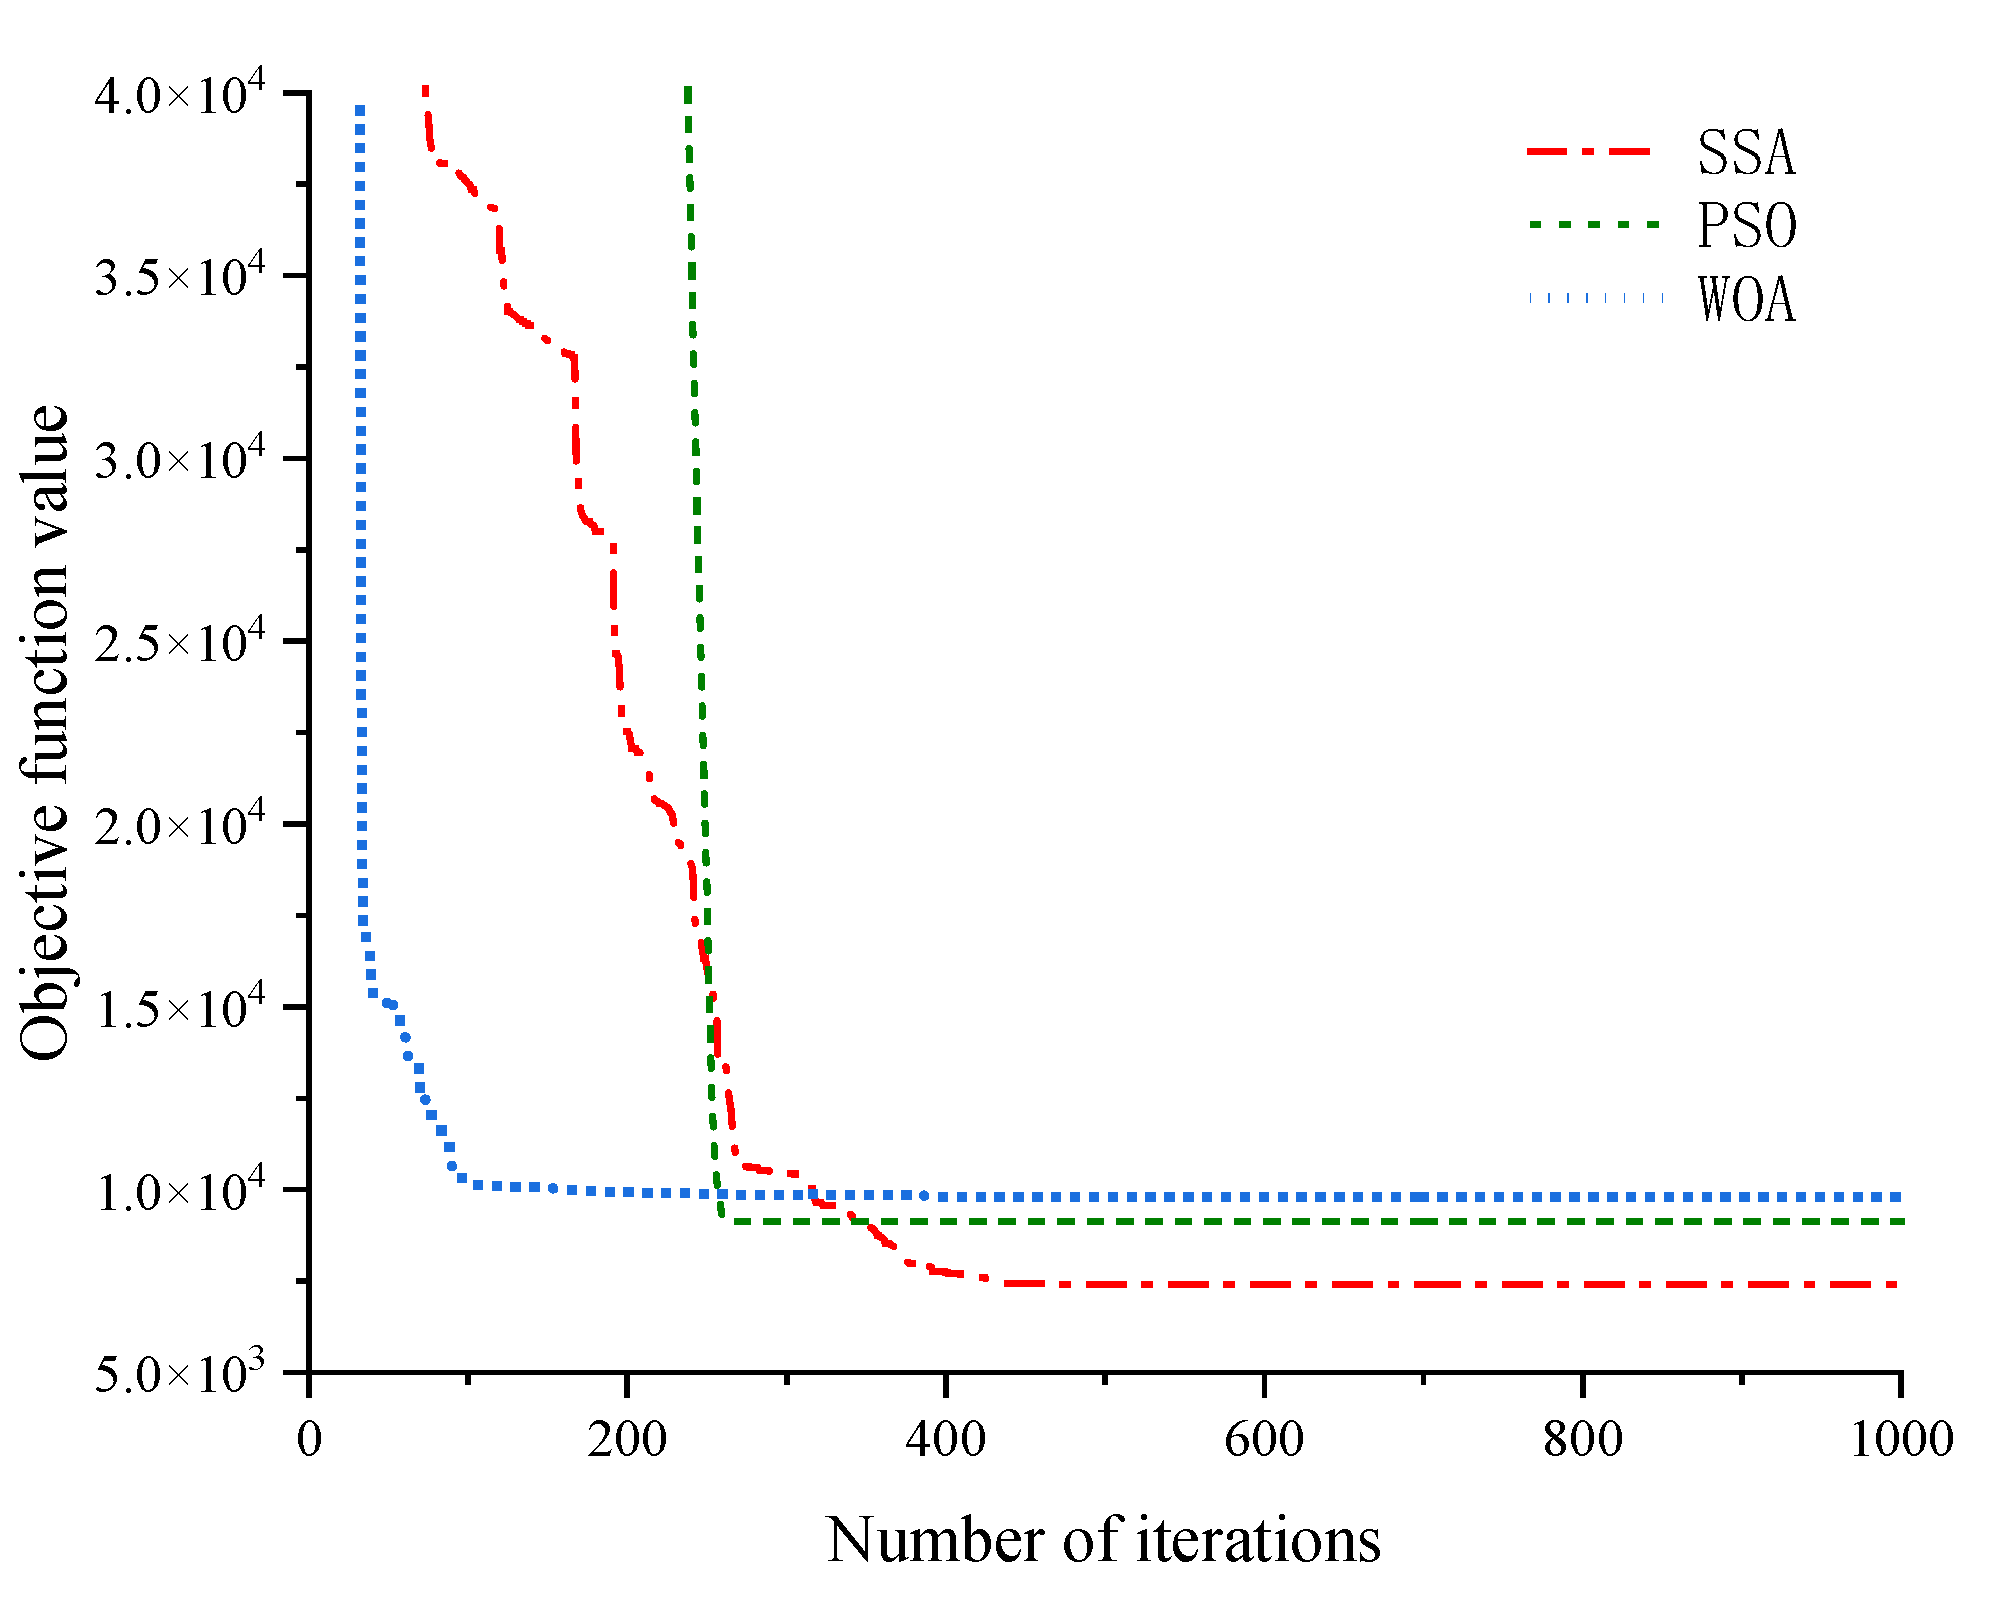
Figure 5 illustrates the iterative processes of the three swarm intelligence optimization algorithms, and Figure 6 presents the computational results of these three algorithms. As can be seen from Figure 5, the WOA converges rapidly in the early stages of iteration, but the SSA is able to obtain the smallest objective function value. This indicates that the SSA can achieve a better solution compared to the other two algorithms. As can be observed from Figure 6 and Table 2, PSO exhibits the highest error rate, whereas SSA demonstrates the highest recognition accuracy. Although the WOA does not misjudge any damage, its computational accuracy is lower than that of the other two algorithms.
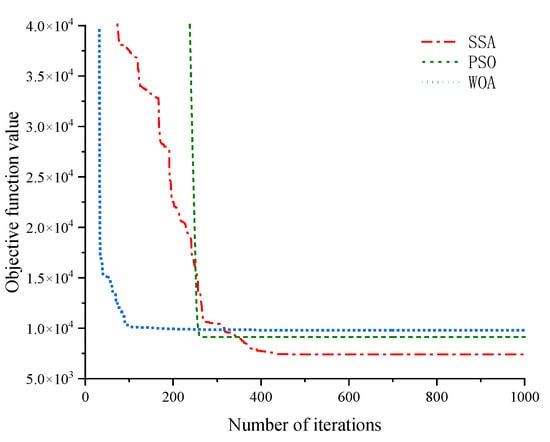
Figure 5.
SSA, WOA, and PSO iteration processes for the plate structure.
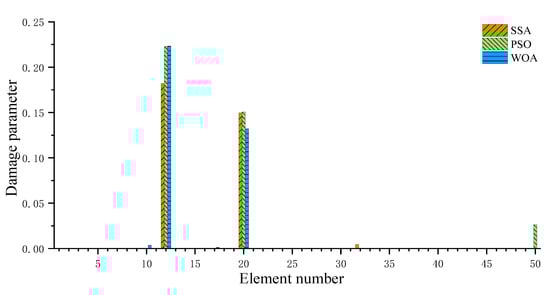
Figure 6.
SSA, WOA, and PSO calculation results for the plate structure.
Table 2.
Performance comparison of the SSA, WOA, and PSO for the plate structure.
3.3. A Lattice Structure
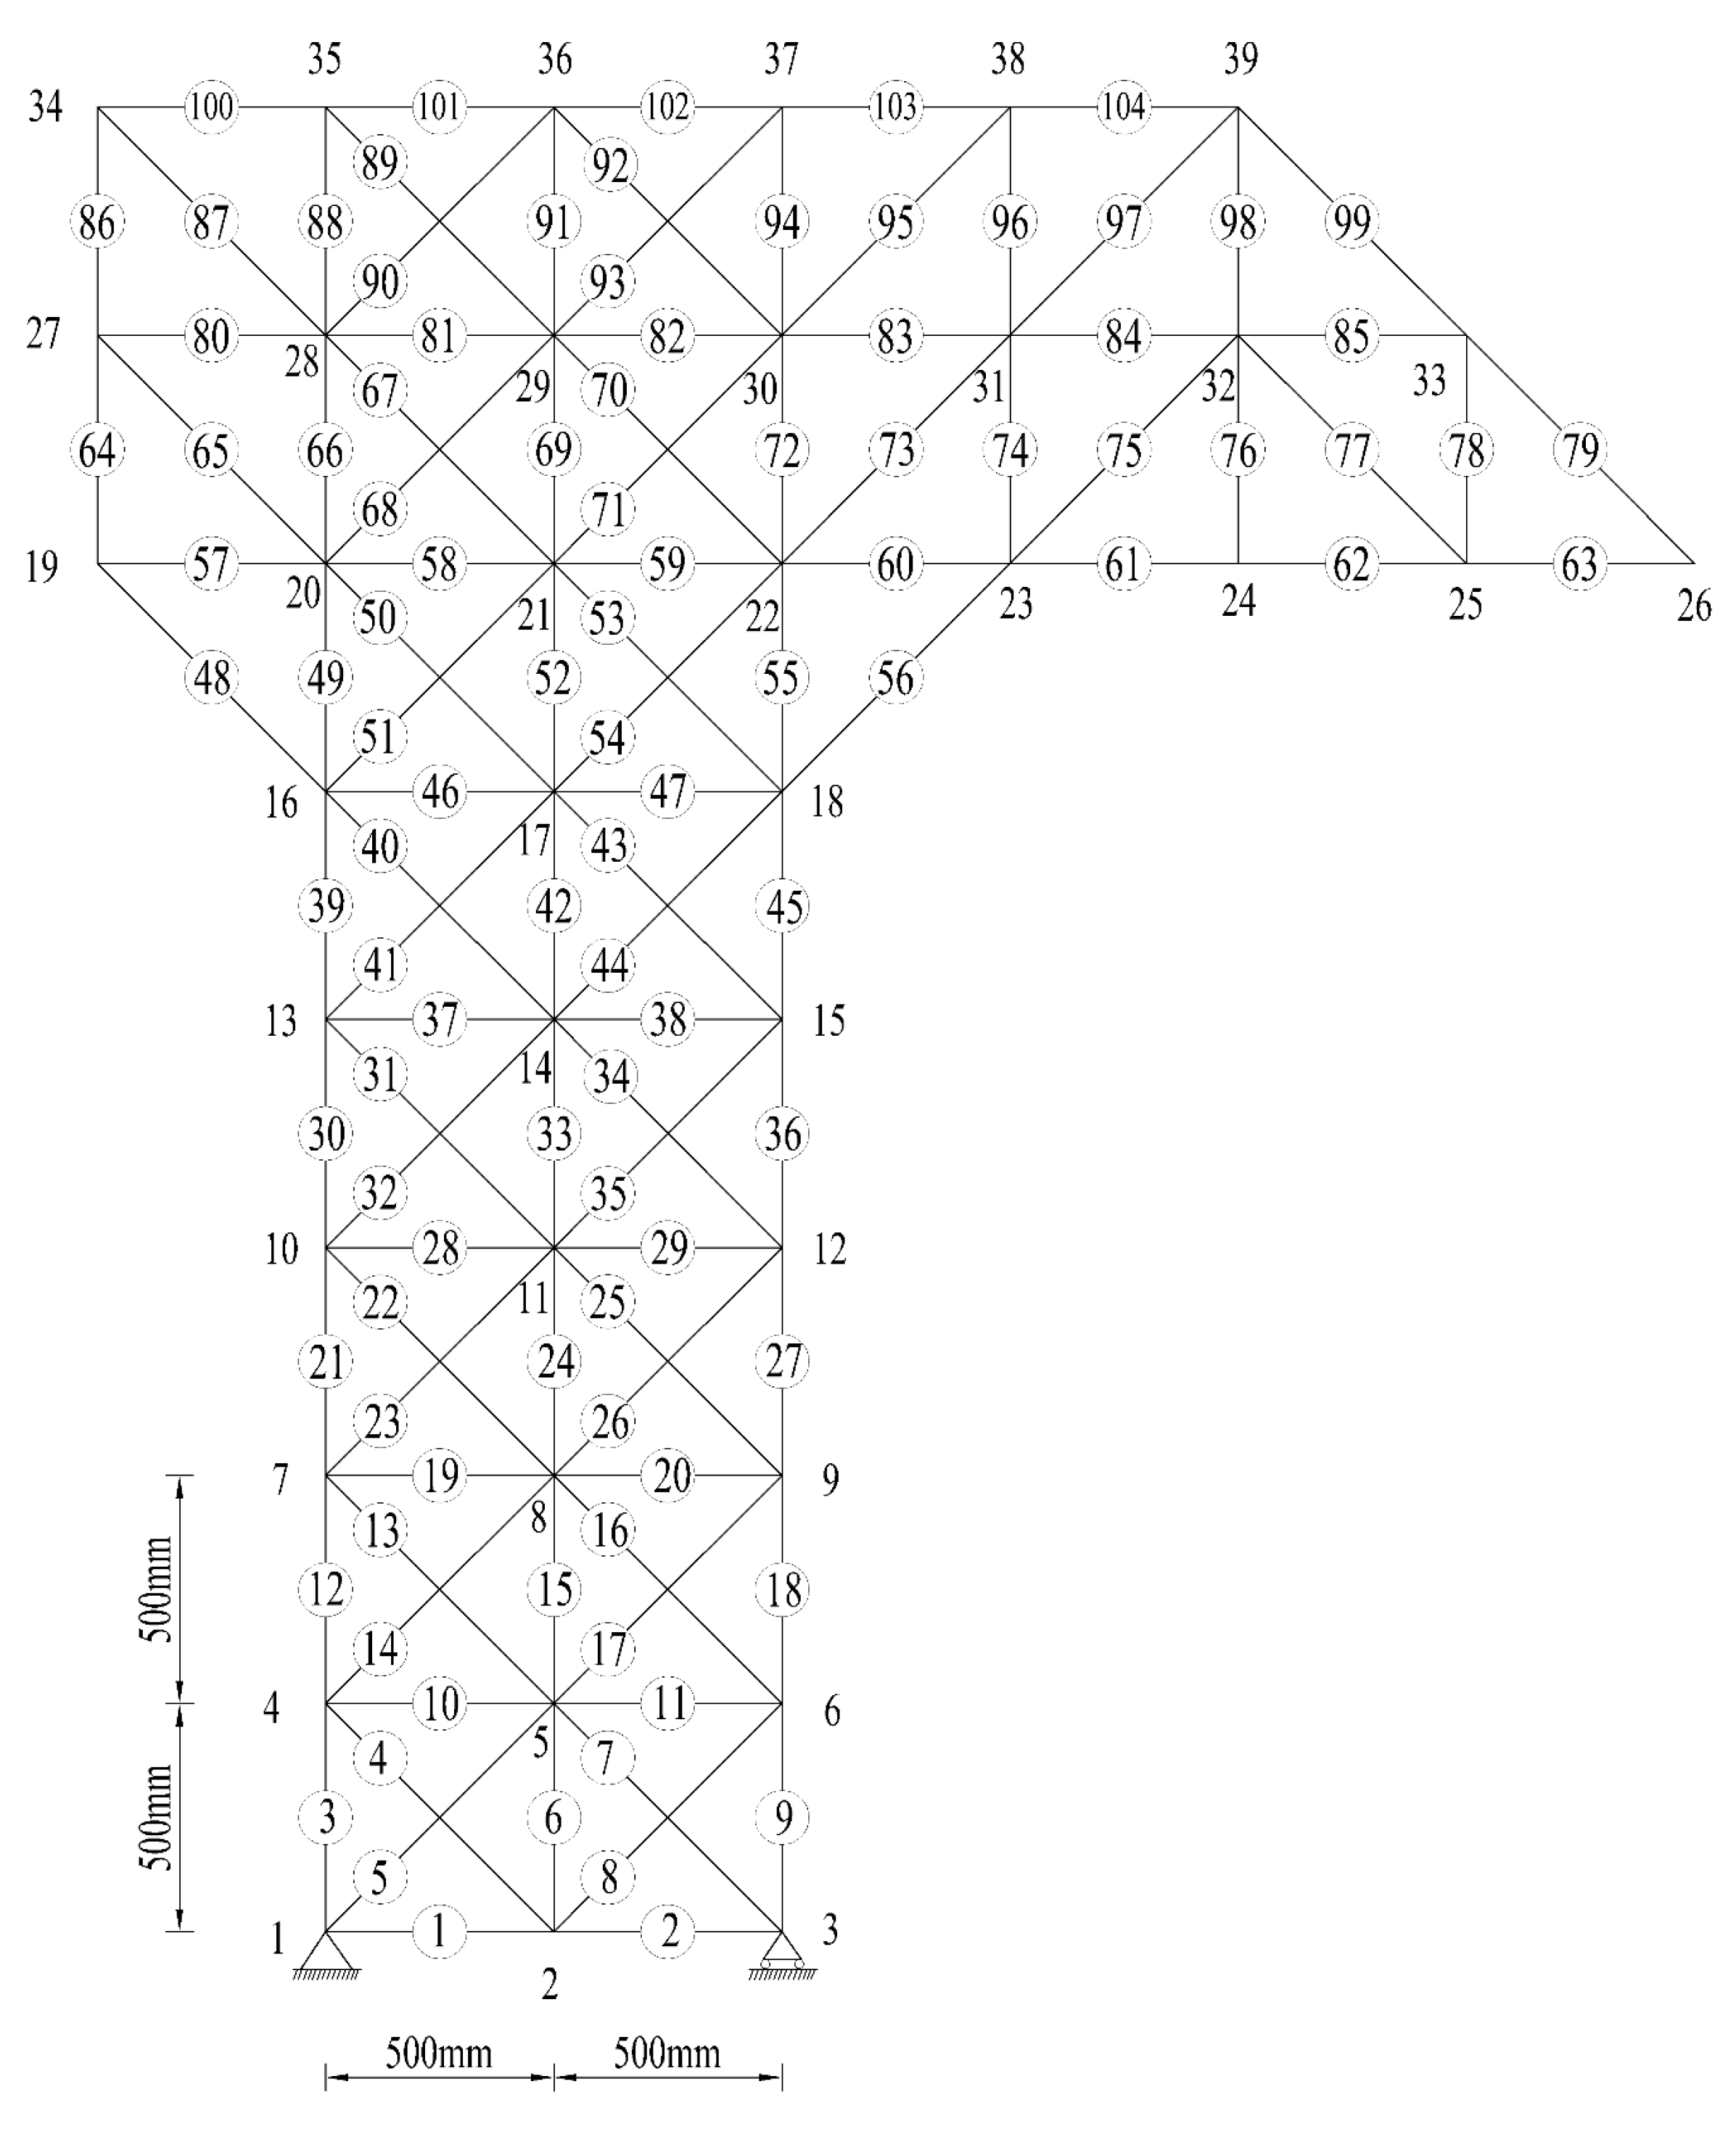
Figure 7 presents a large lattice structure used to further validate the proposed damage detection method. This structure consists of 104 rod elements, each with an elastic modulus of 206 GPa and a density of 7850 kg/m3. The length of each horizontal and vertical rod is 0.5 m, and the cross-sectional area of each rod is 1.84 × 10⁻⁴ m2. In this example, different levels of noise were added to the simulated data to mimic measurement errors in order to investigate the robustness of the proposed method under noise contamination. Two damage scenarios are discussed in this example. The first damage scenario assumes a 20% reduction in the elastic modulus of member 45. The second damage scenario assumes that the elastic moduli of both members 42 and 68 are reduced by 20%.
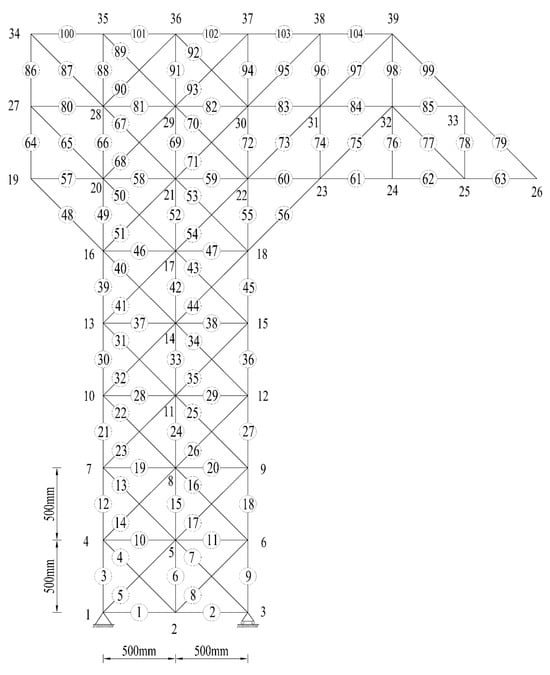
Figure 7.
A lattice structure.
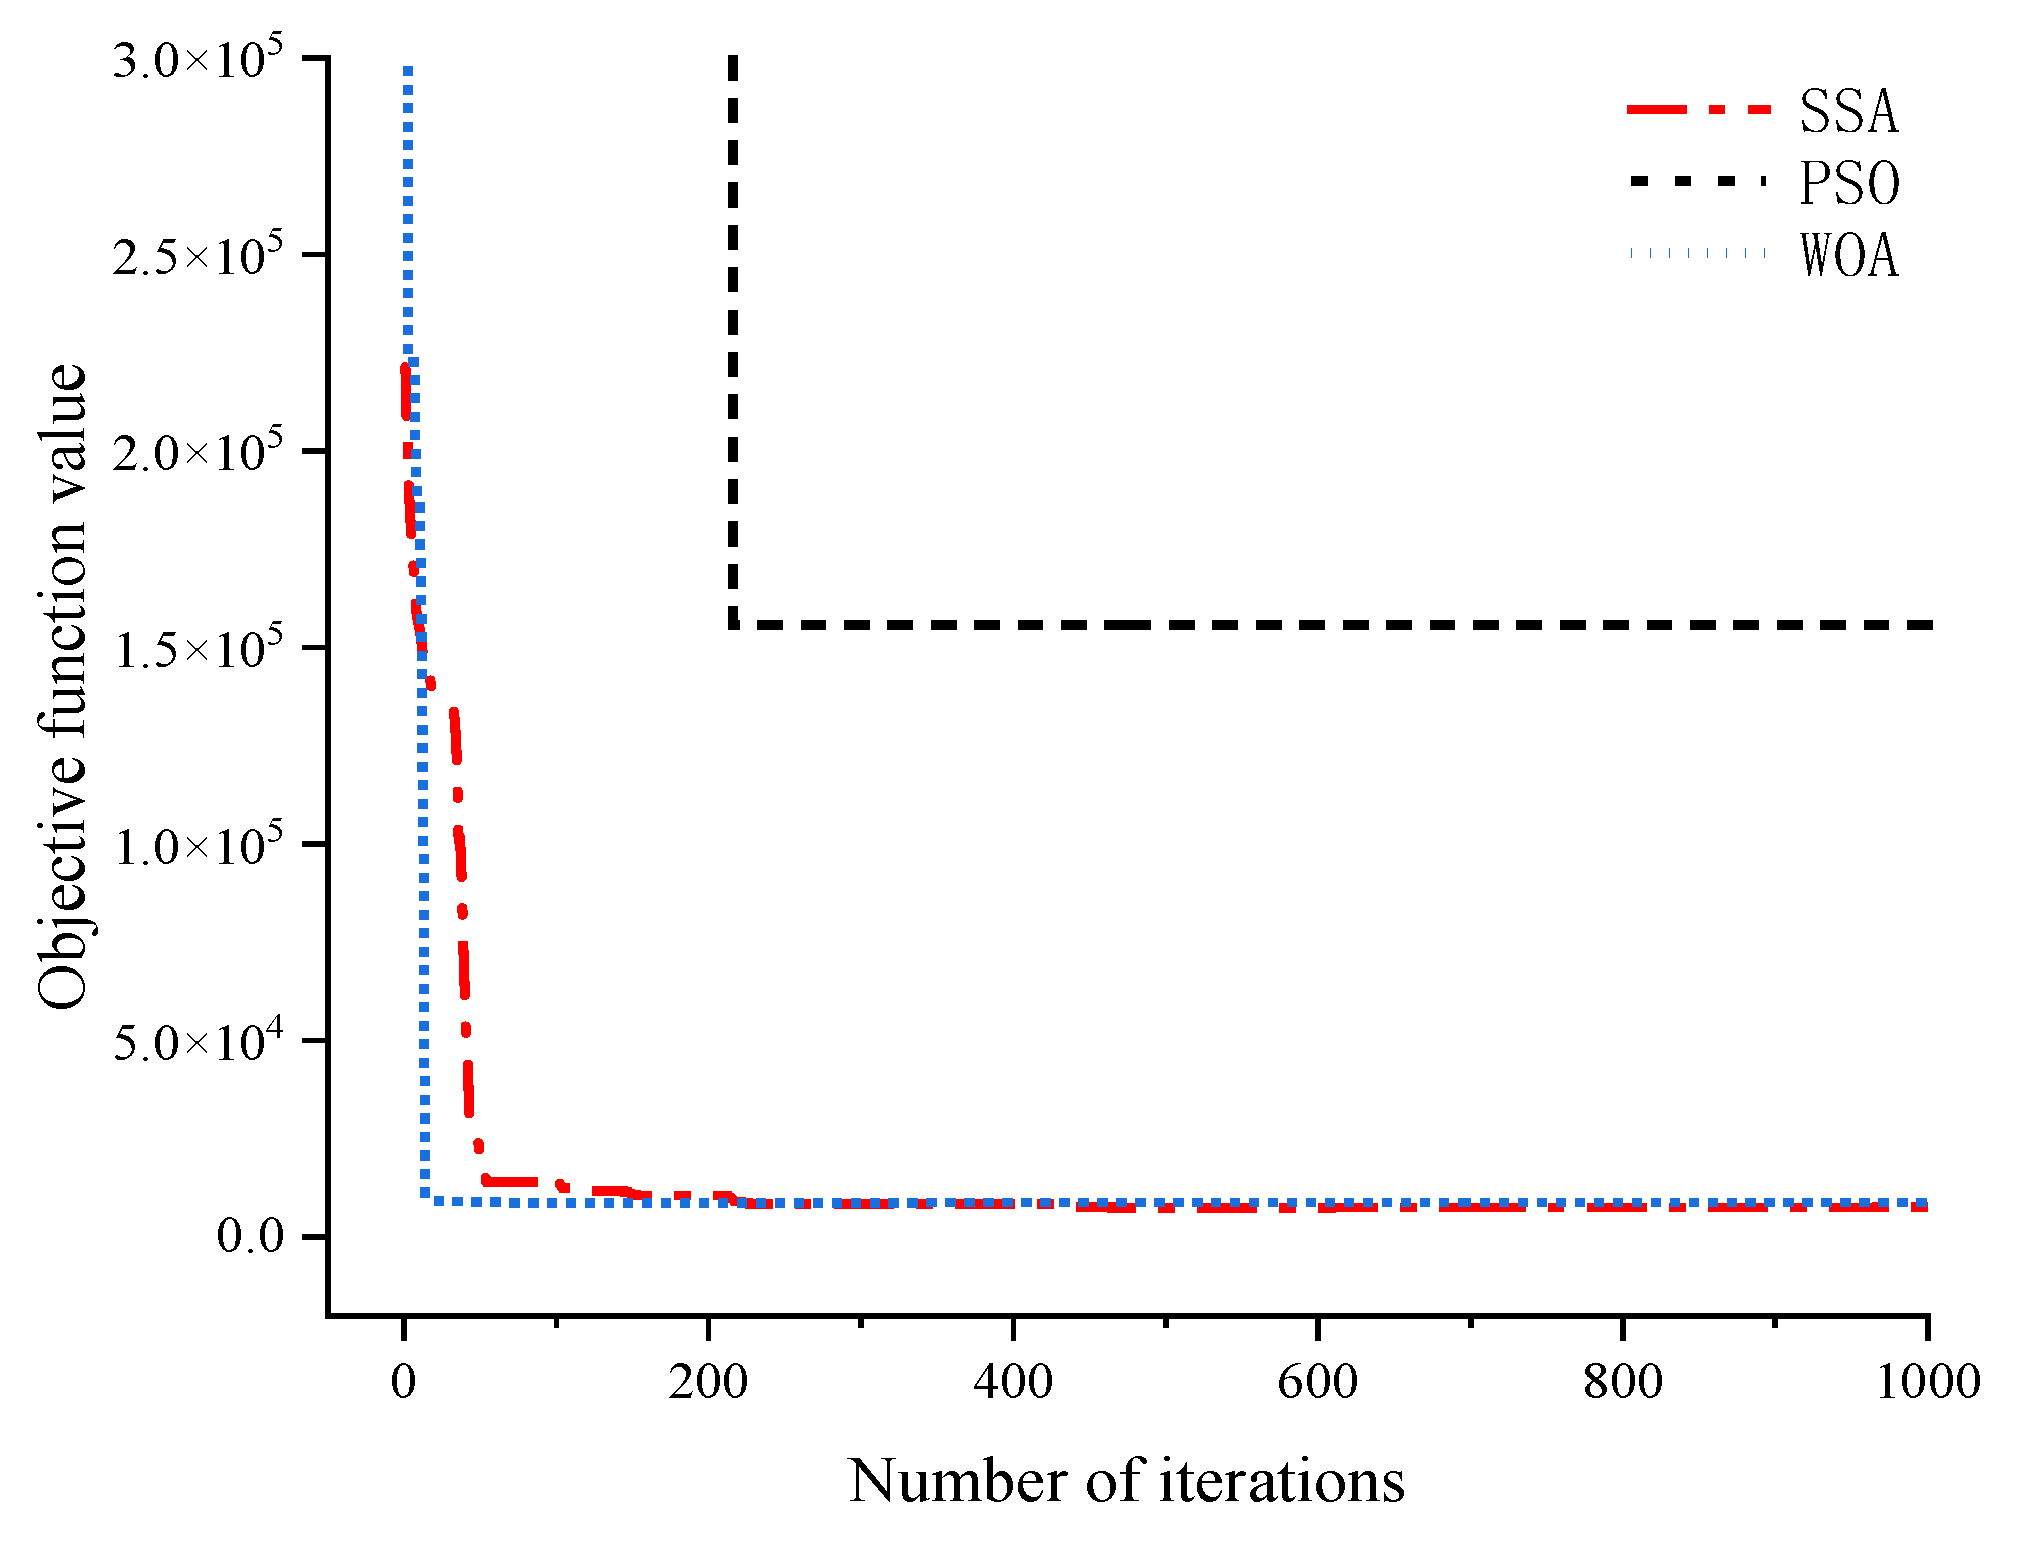
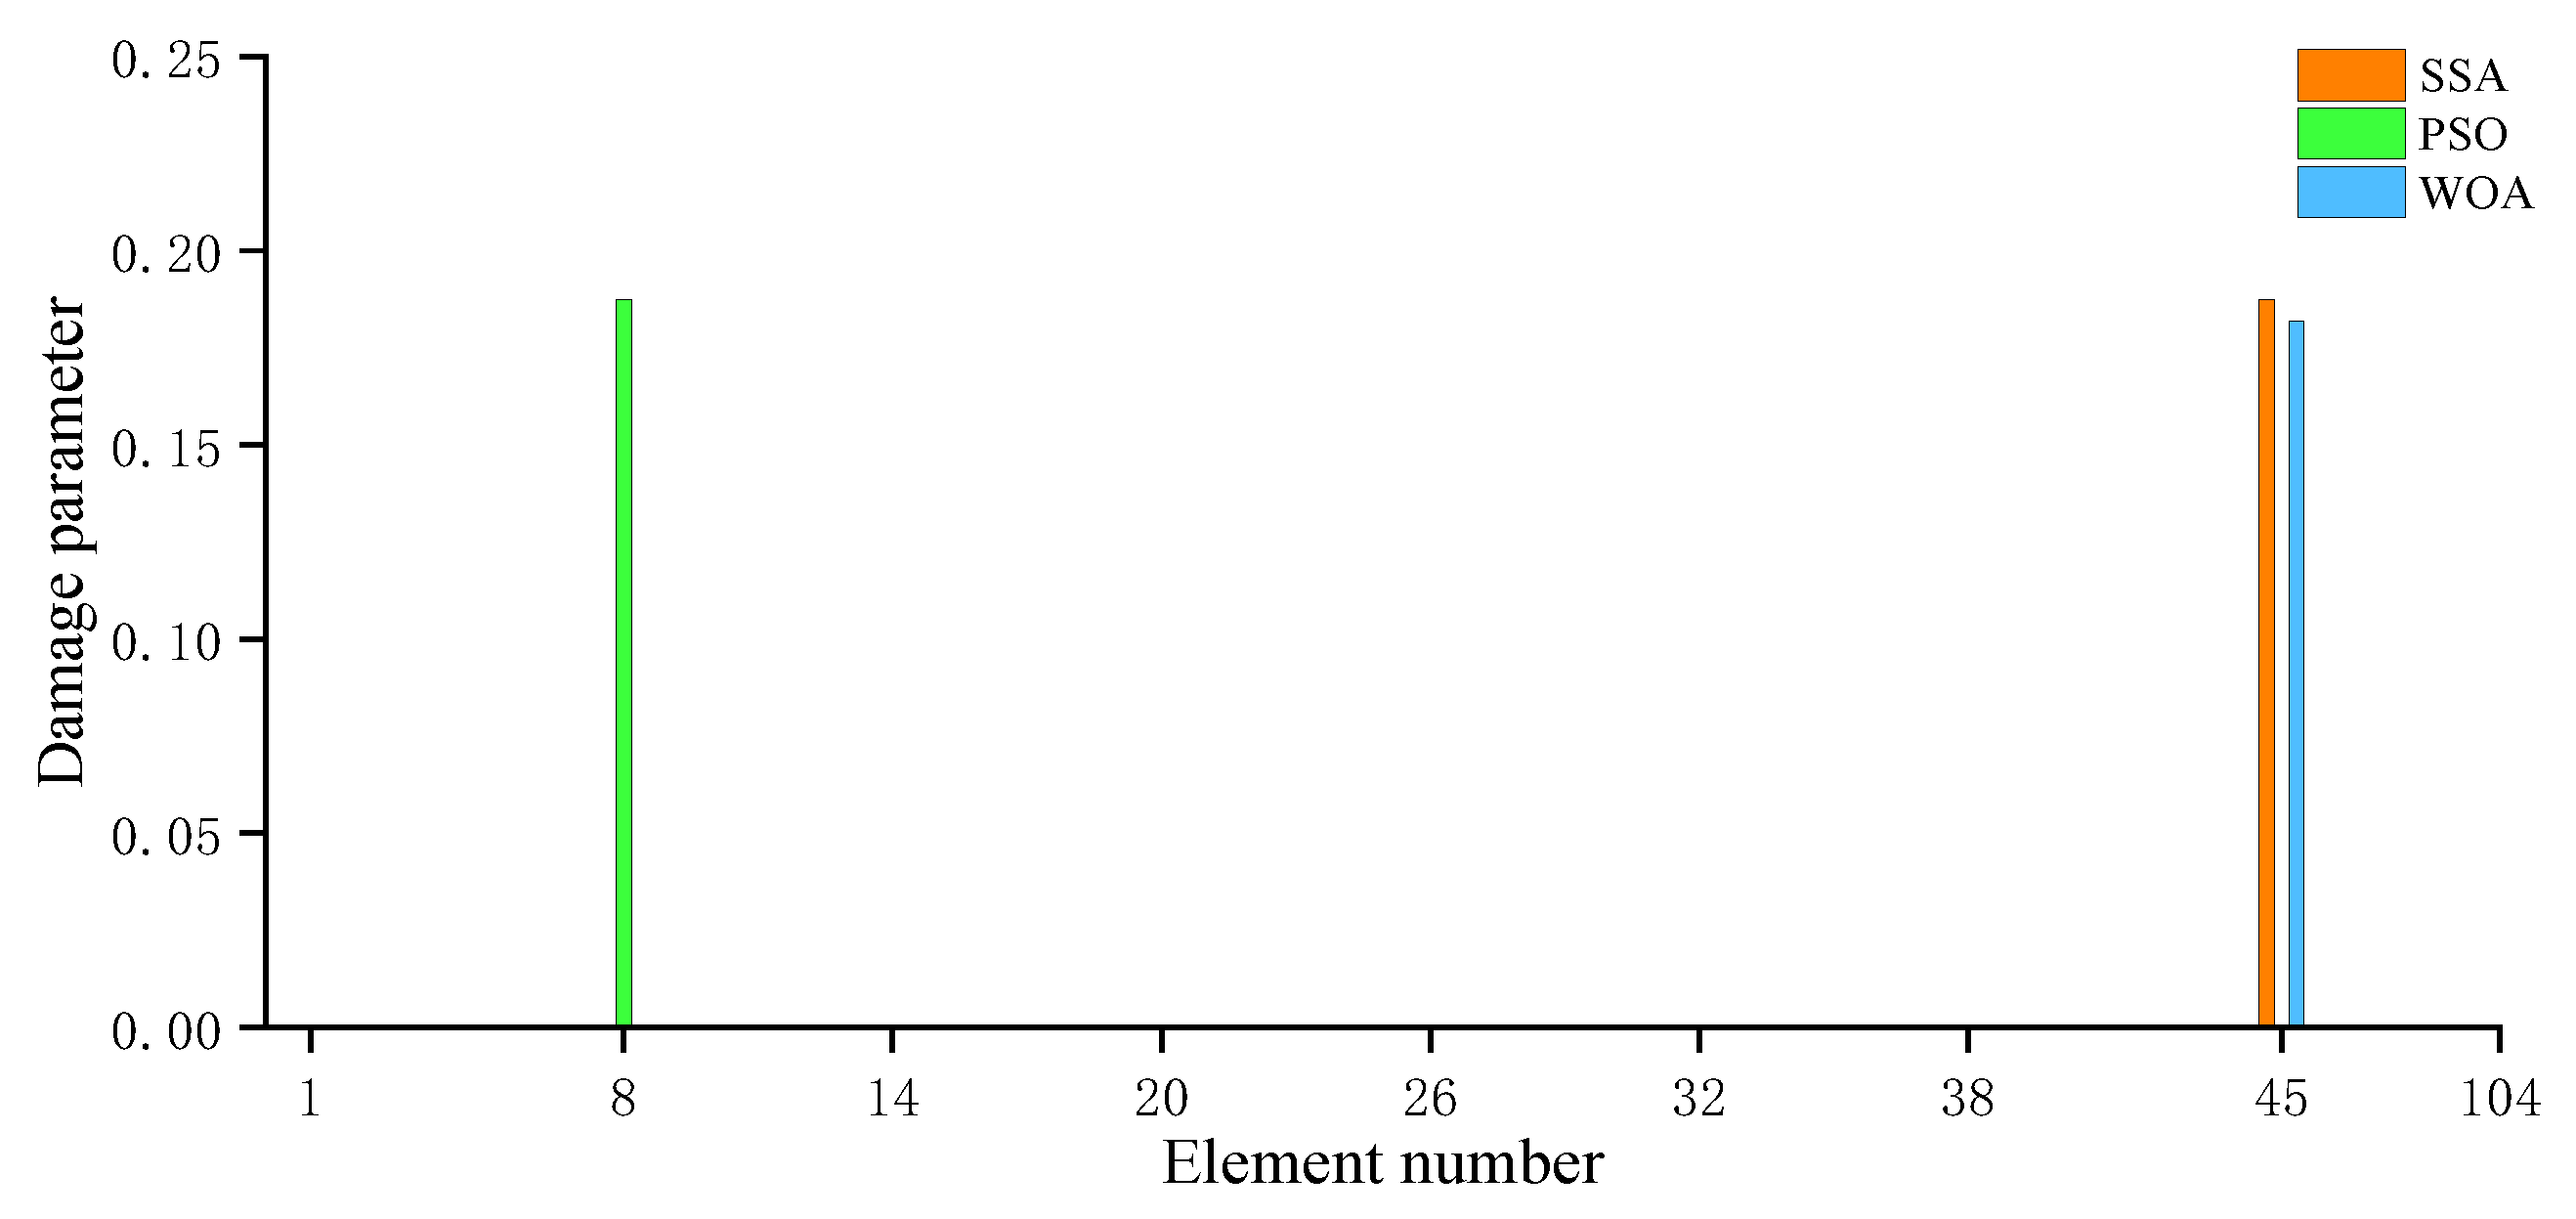
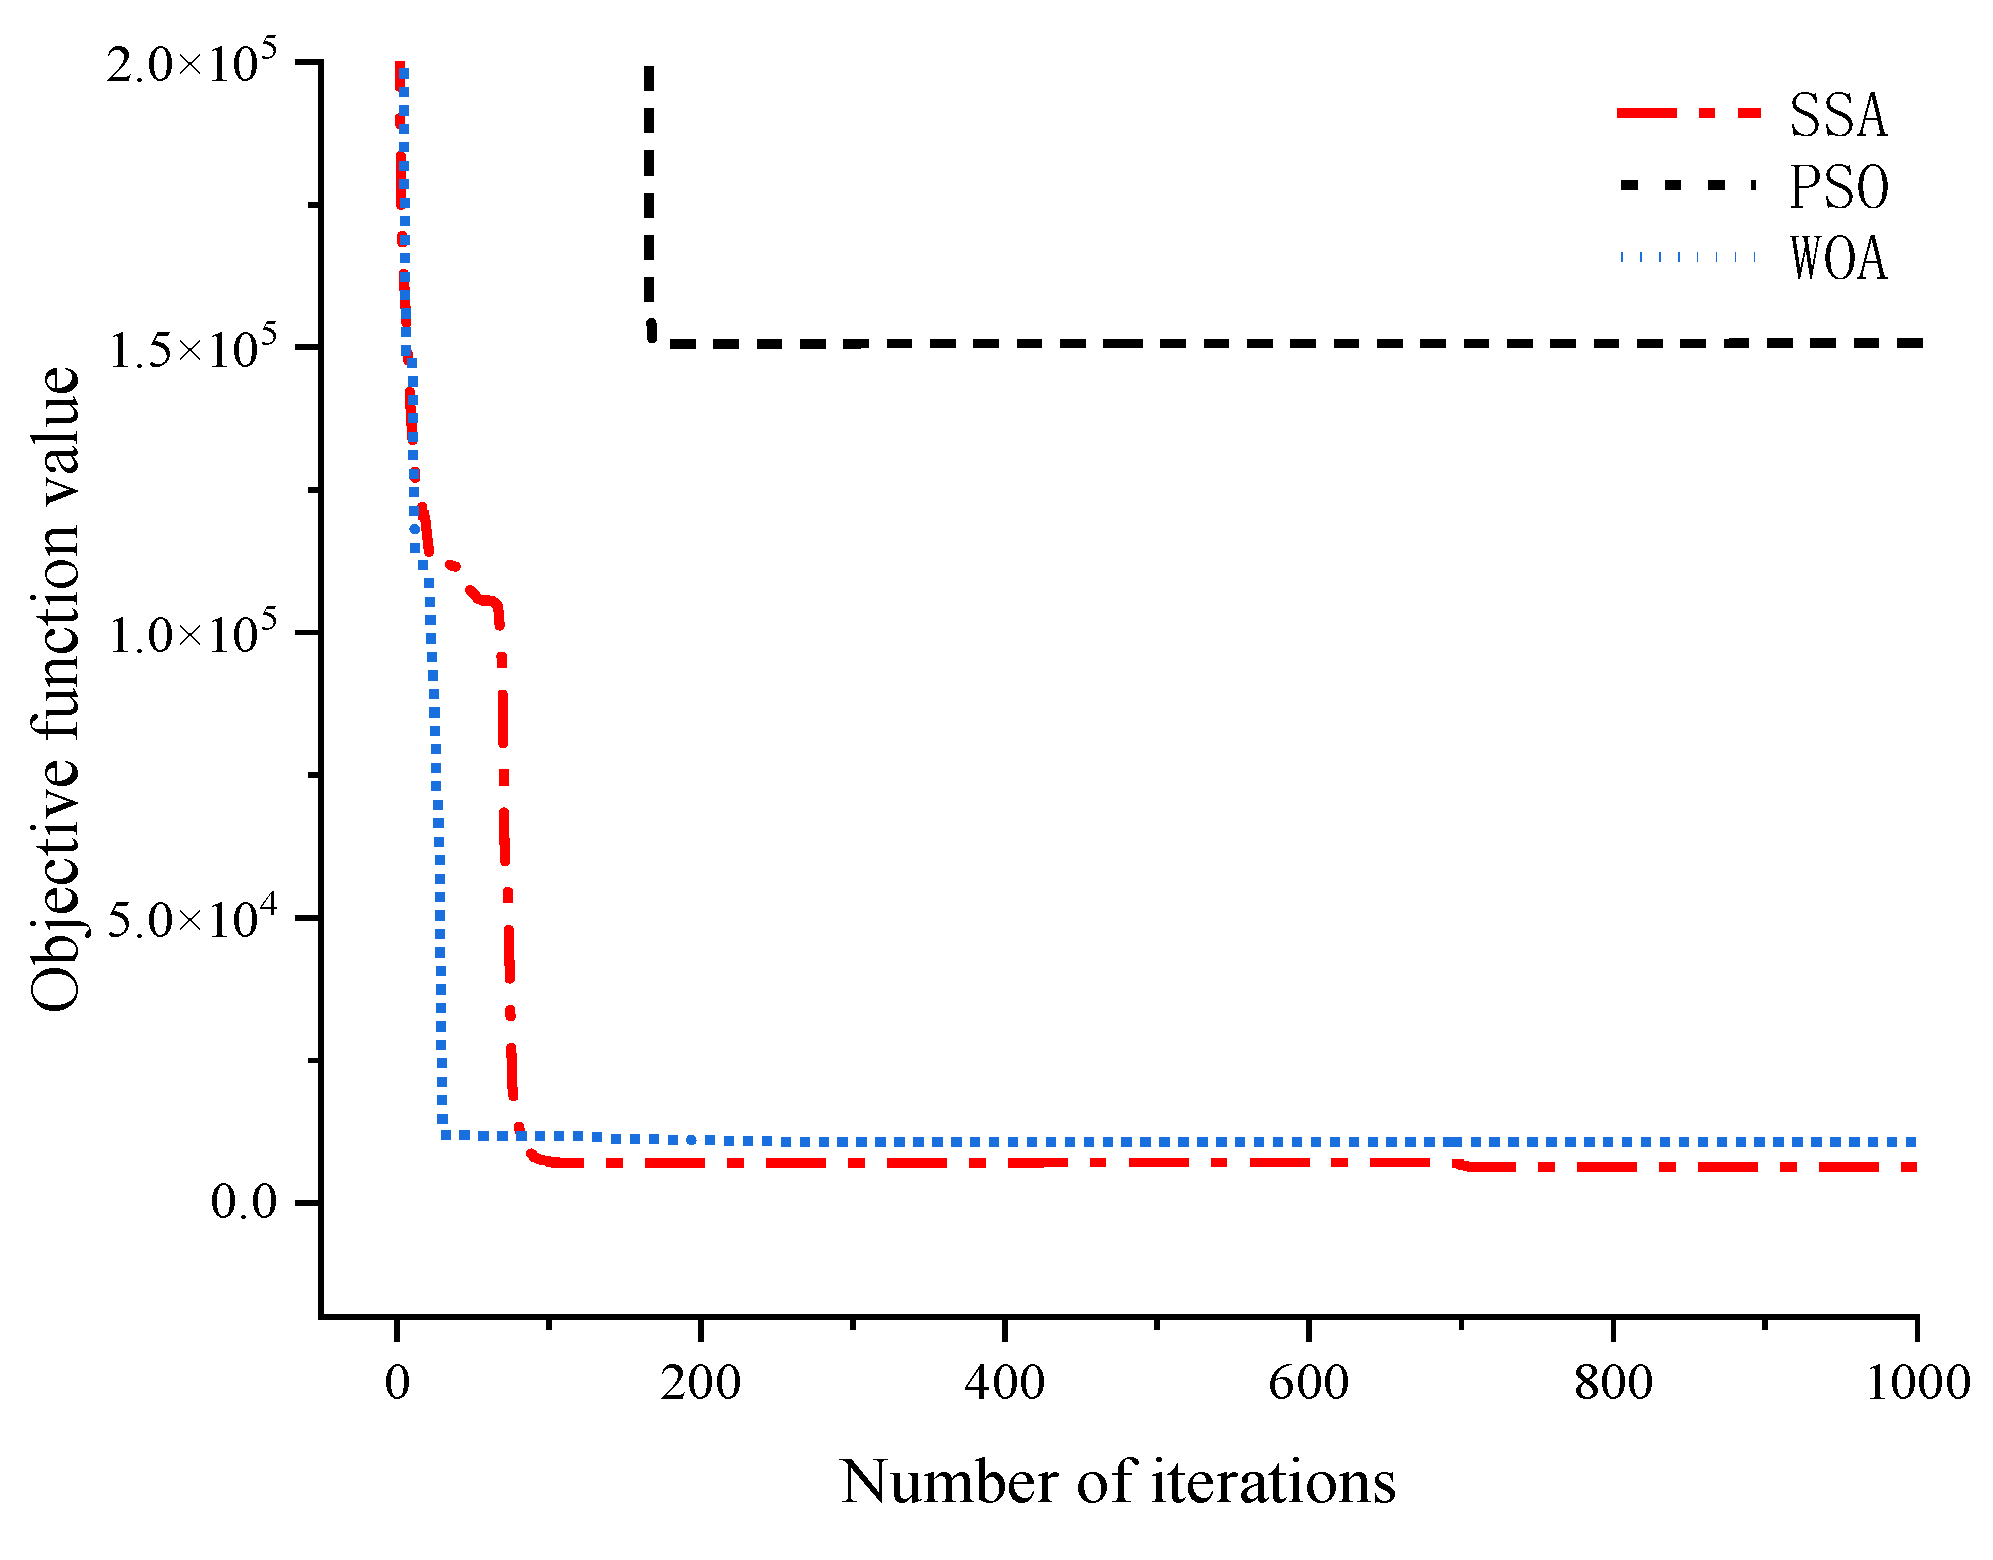
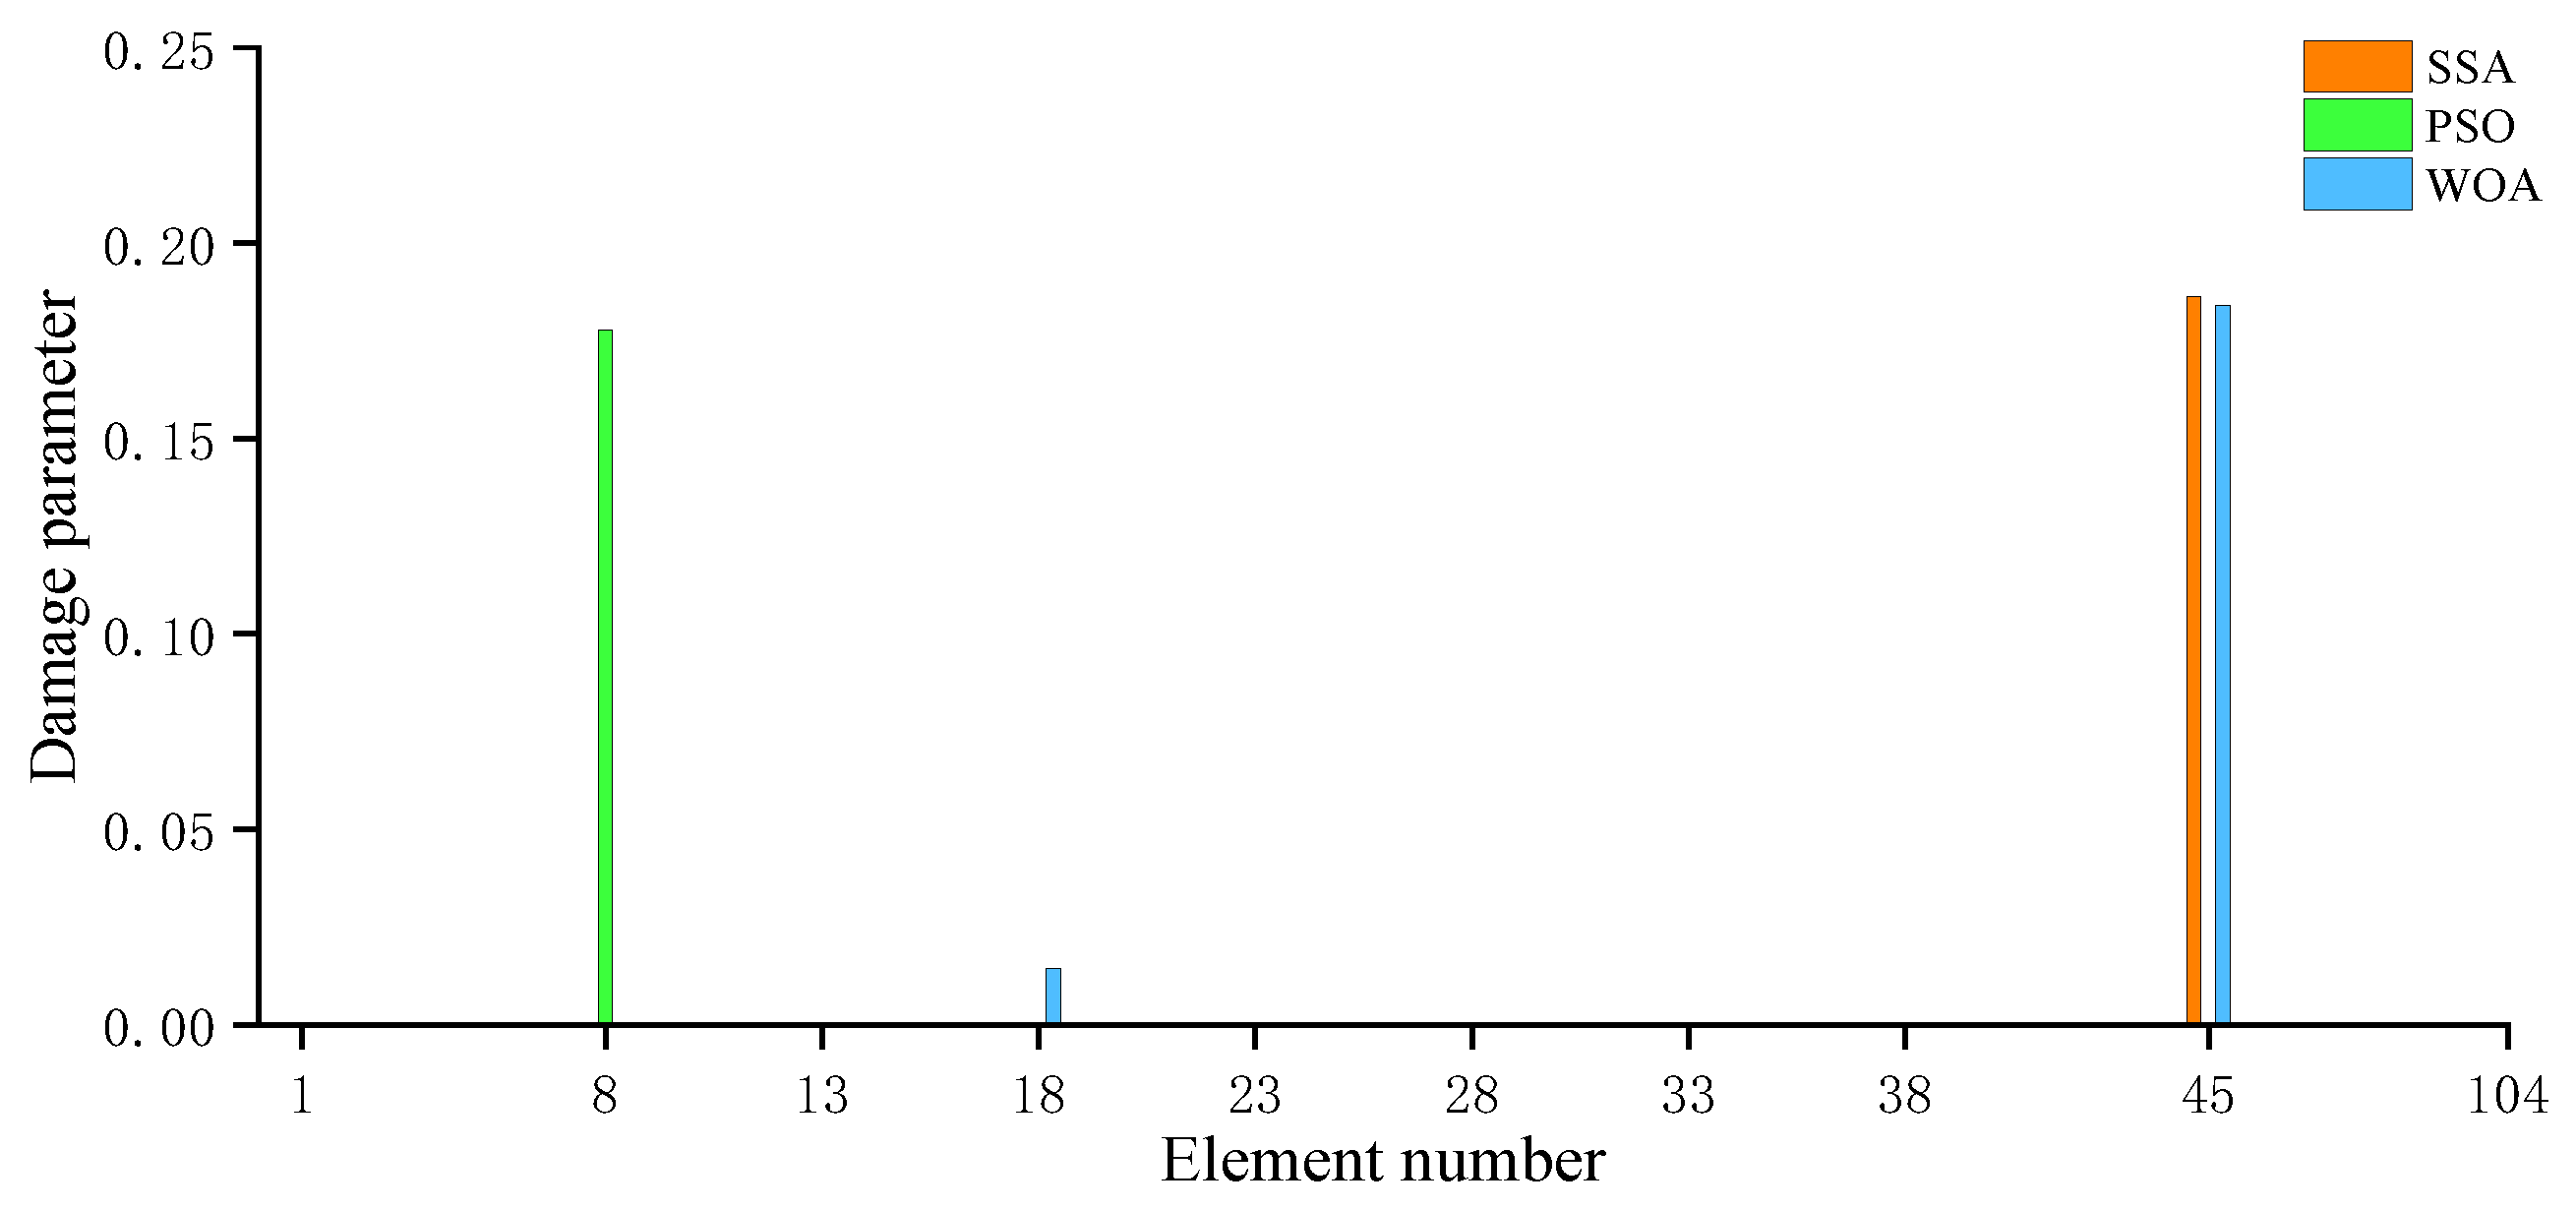
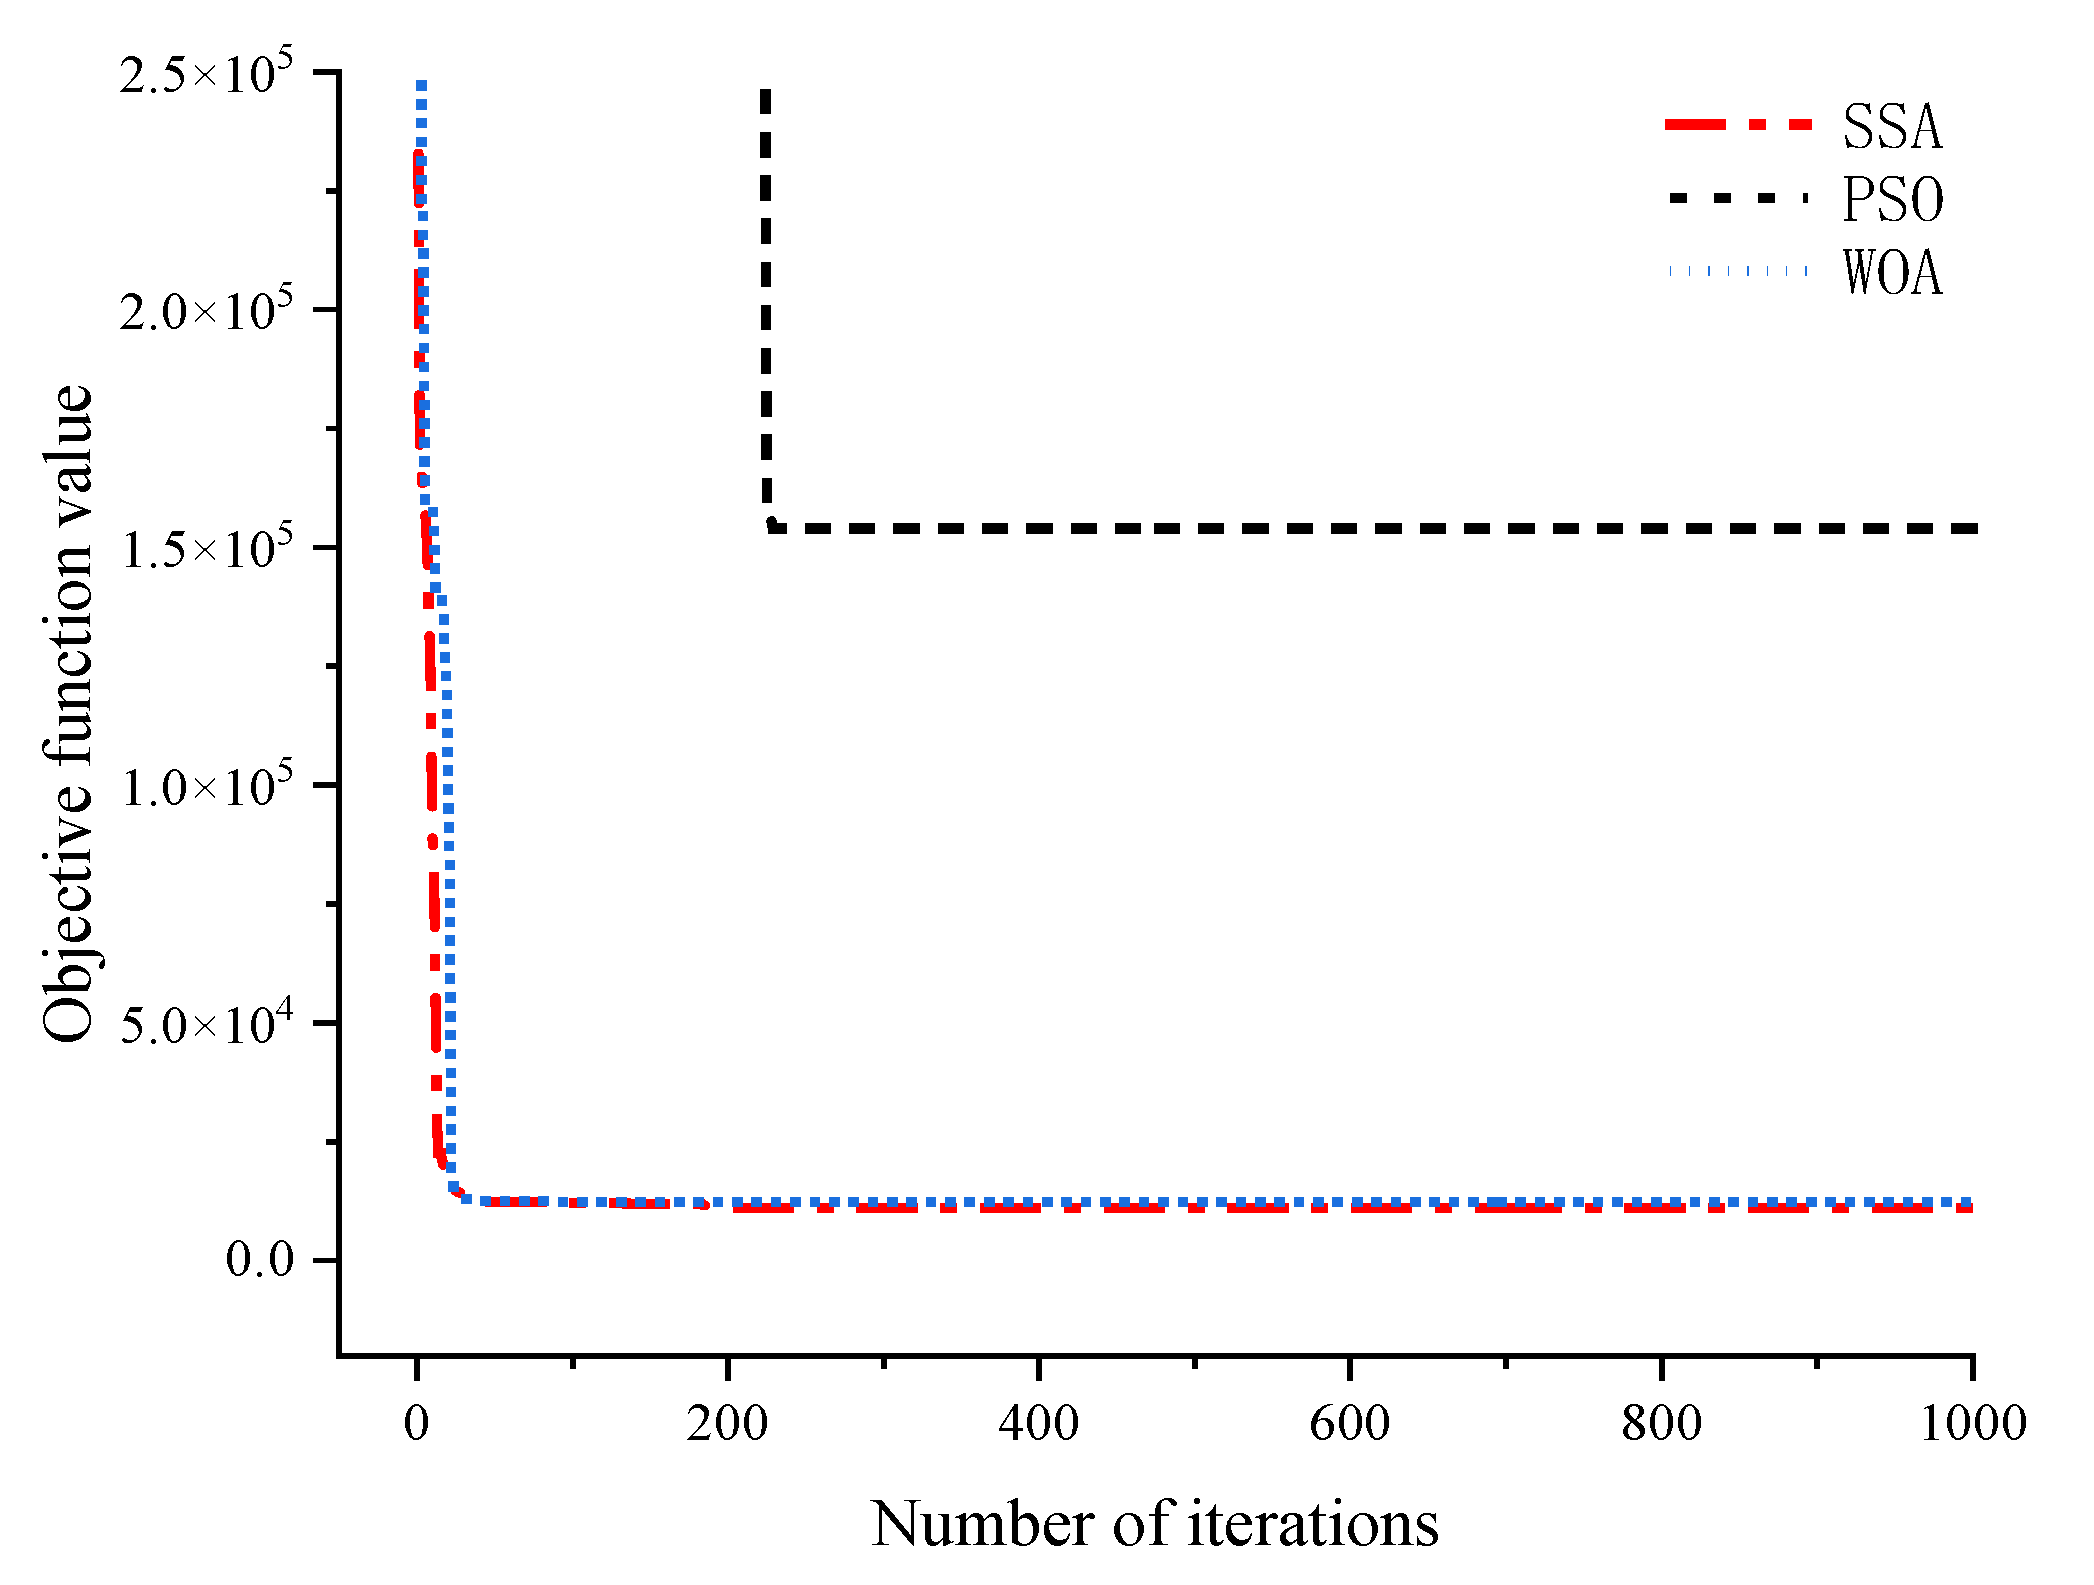
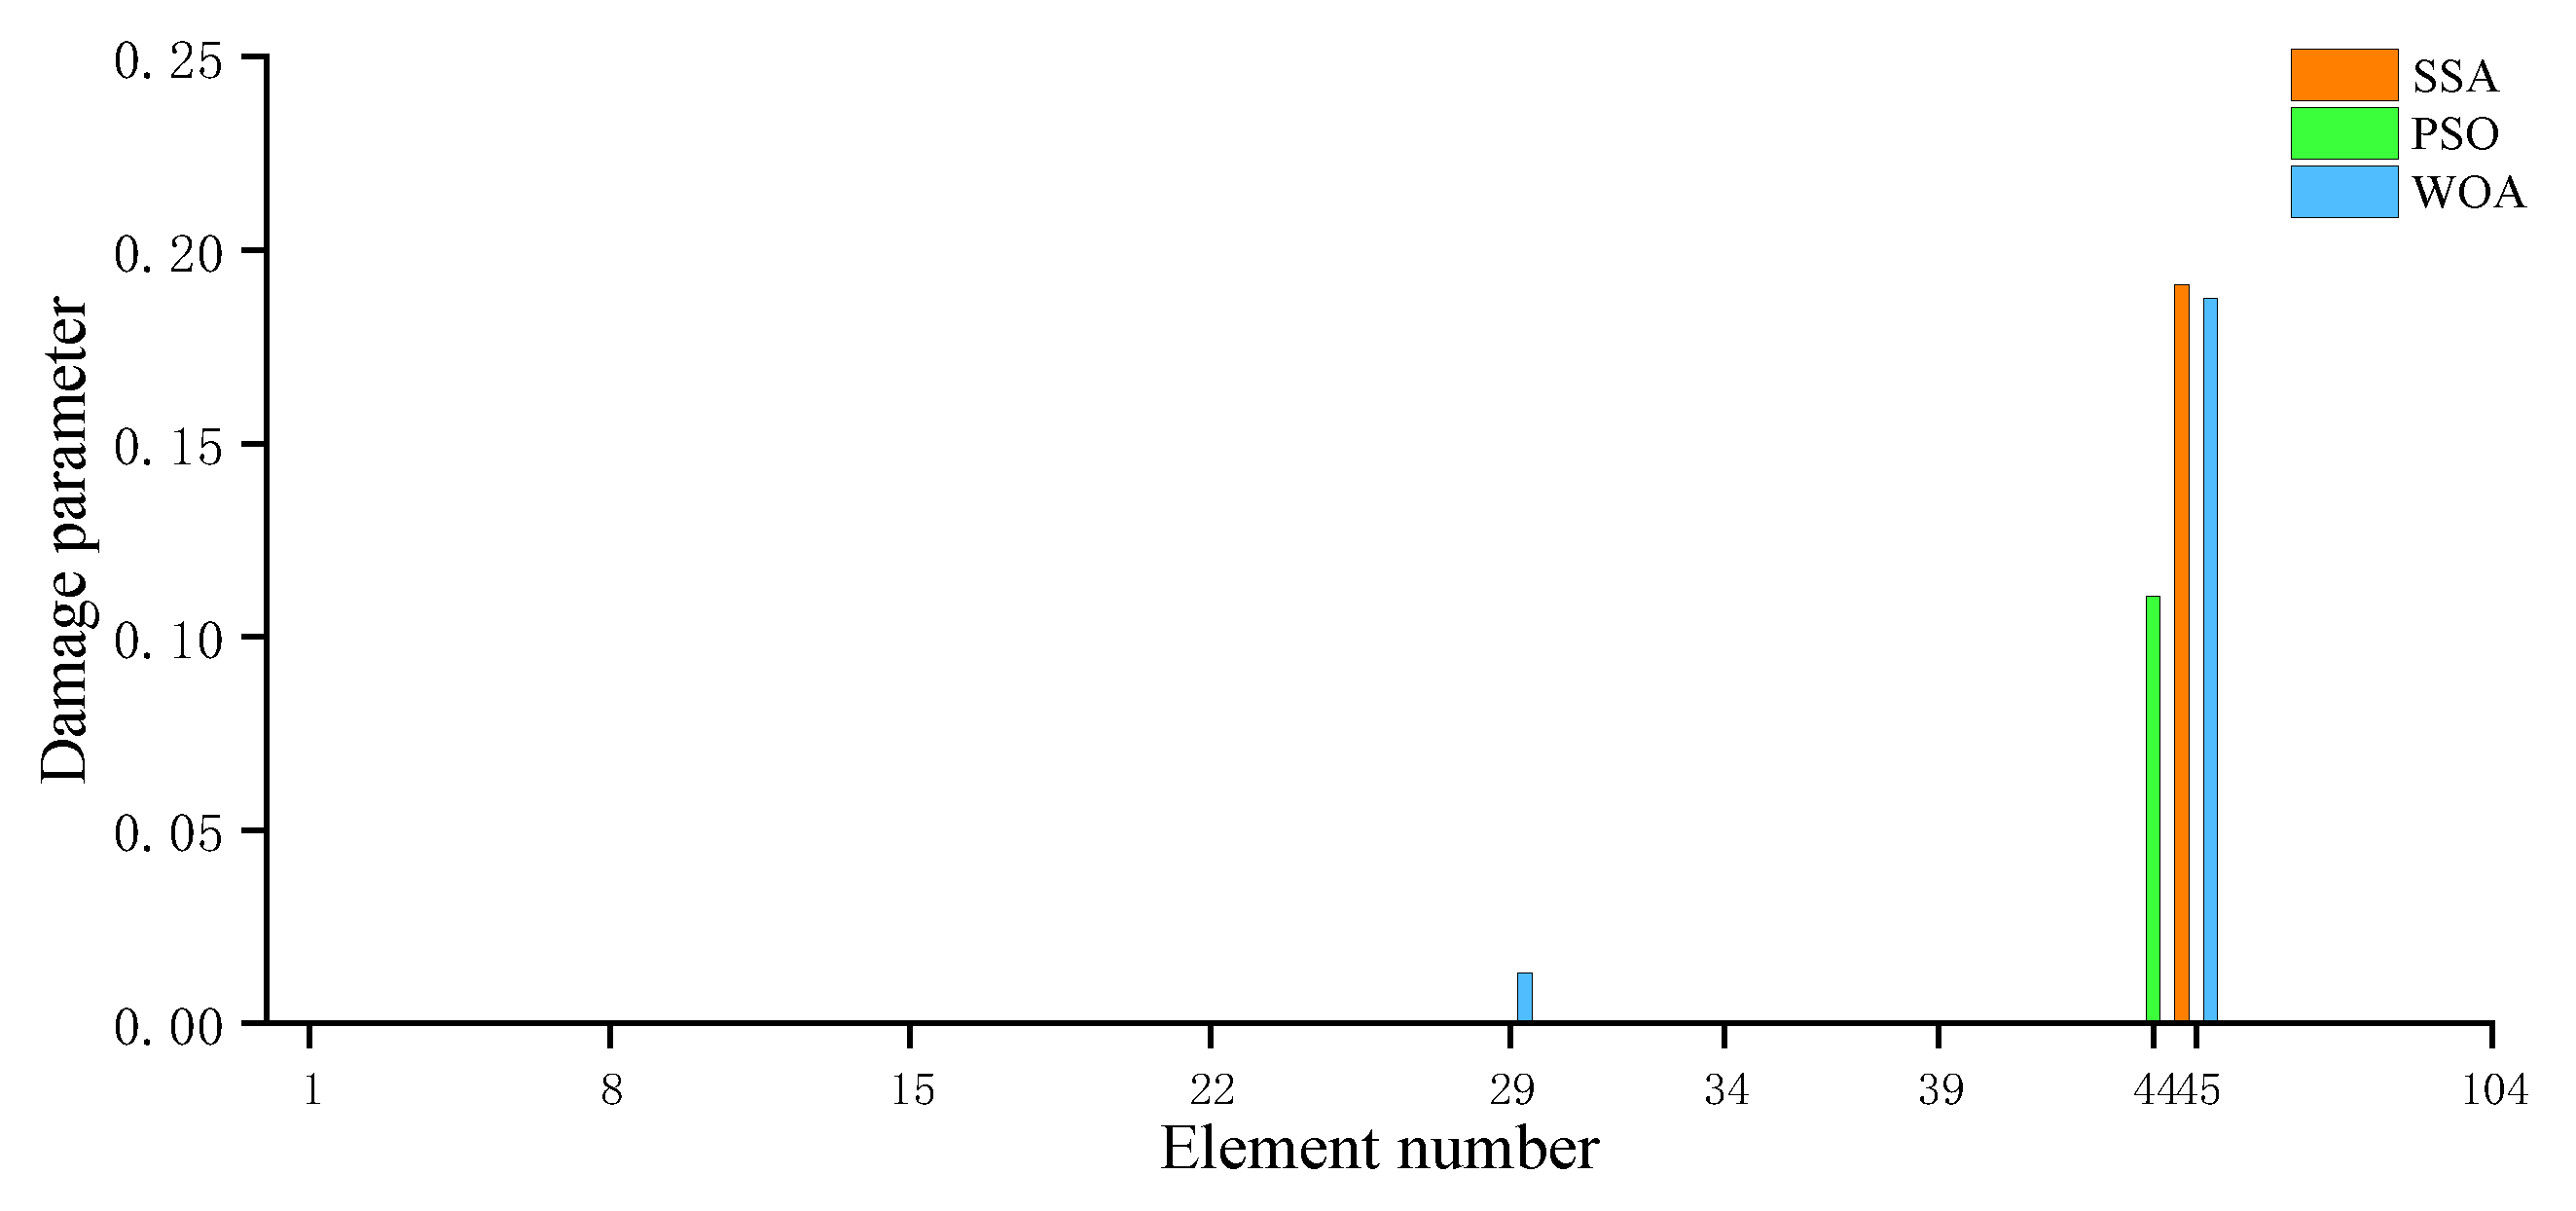
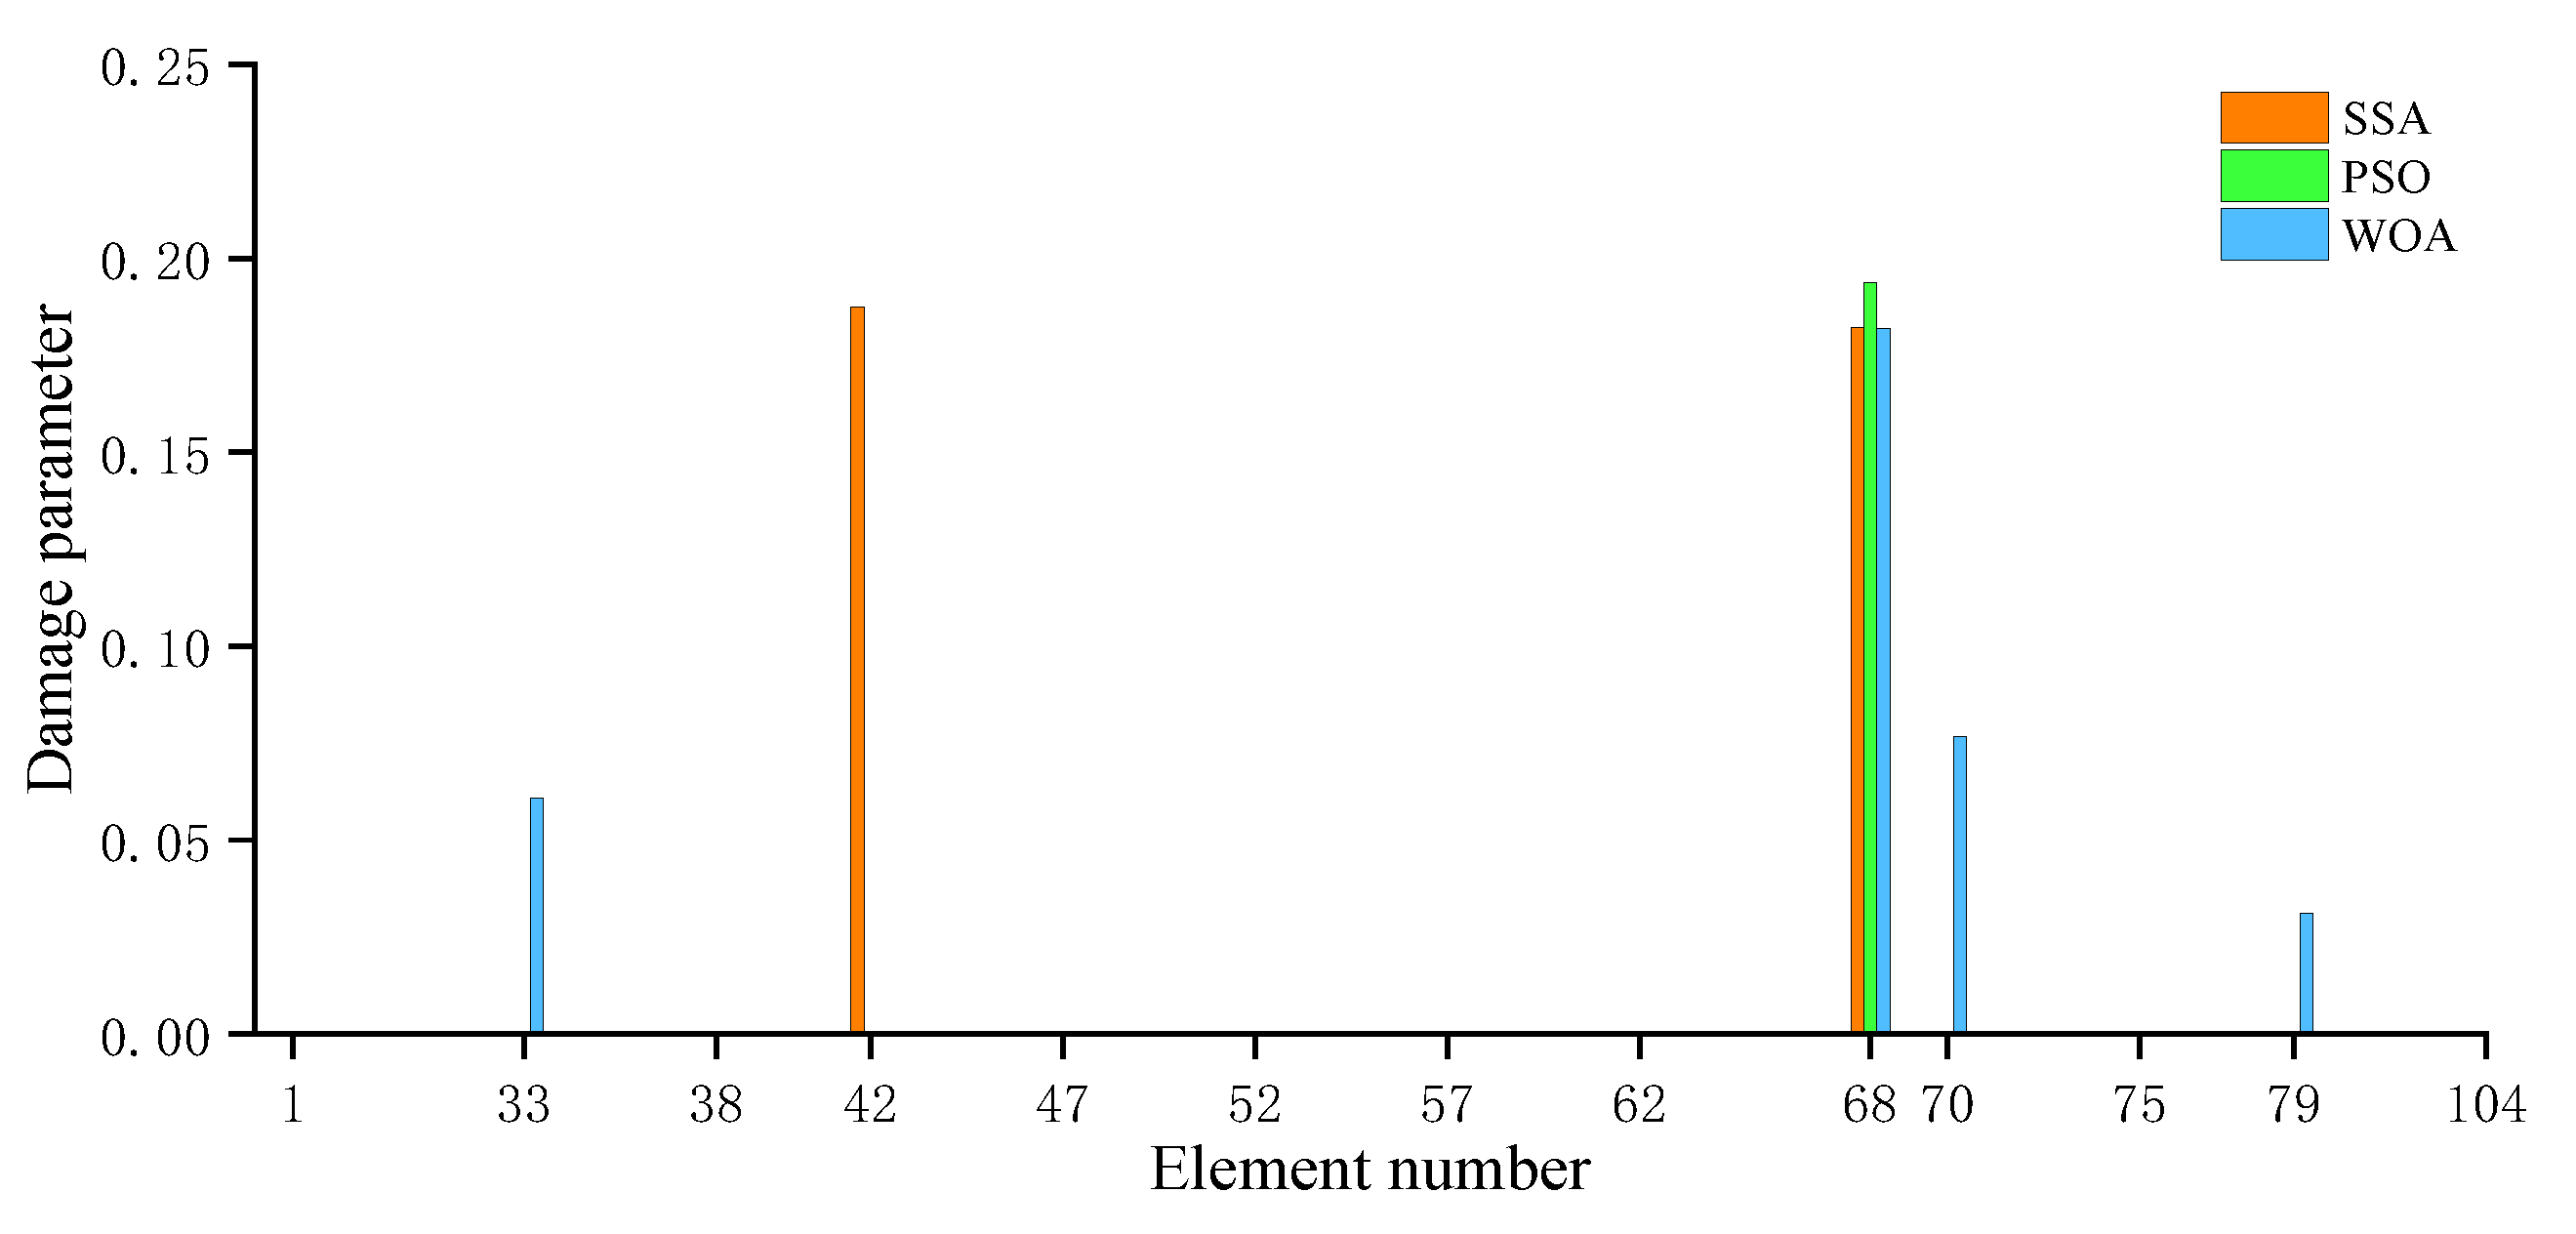
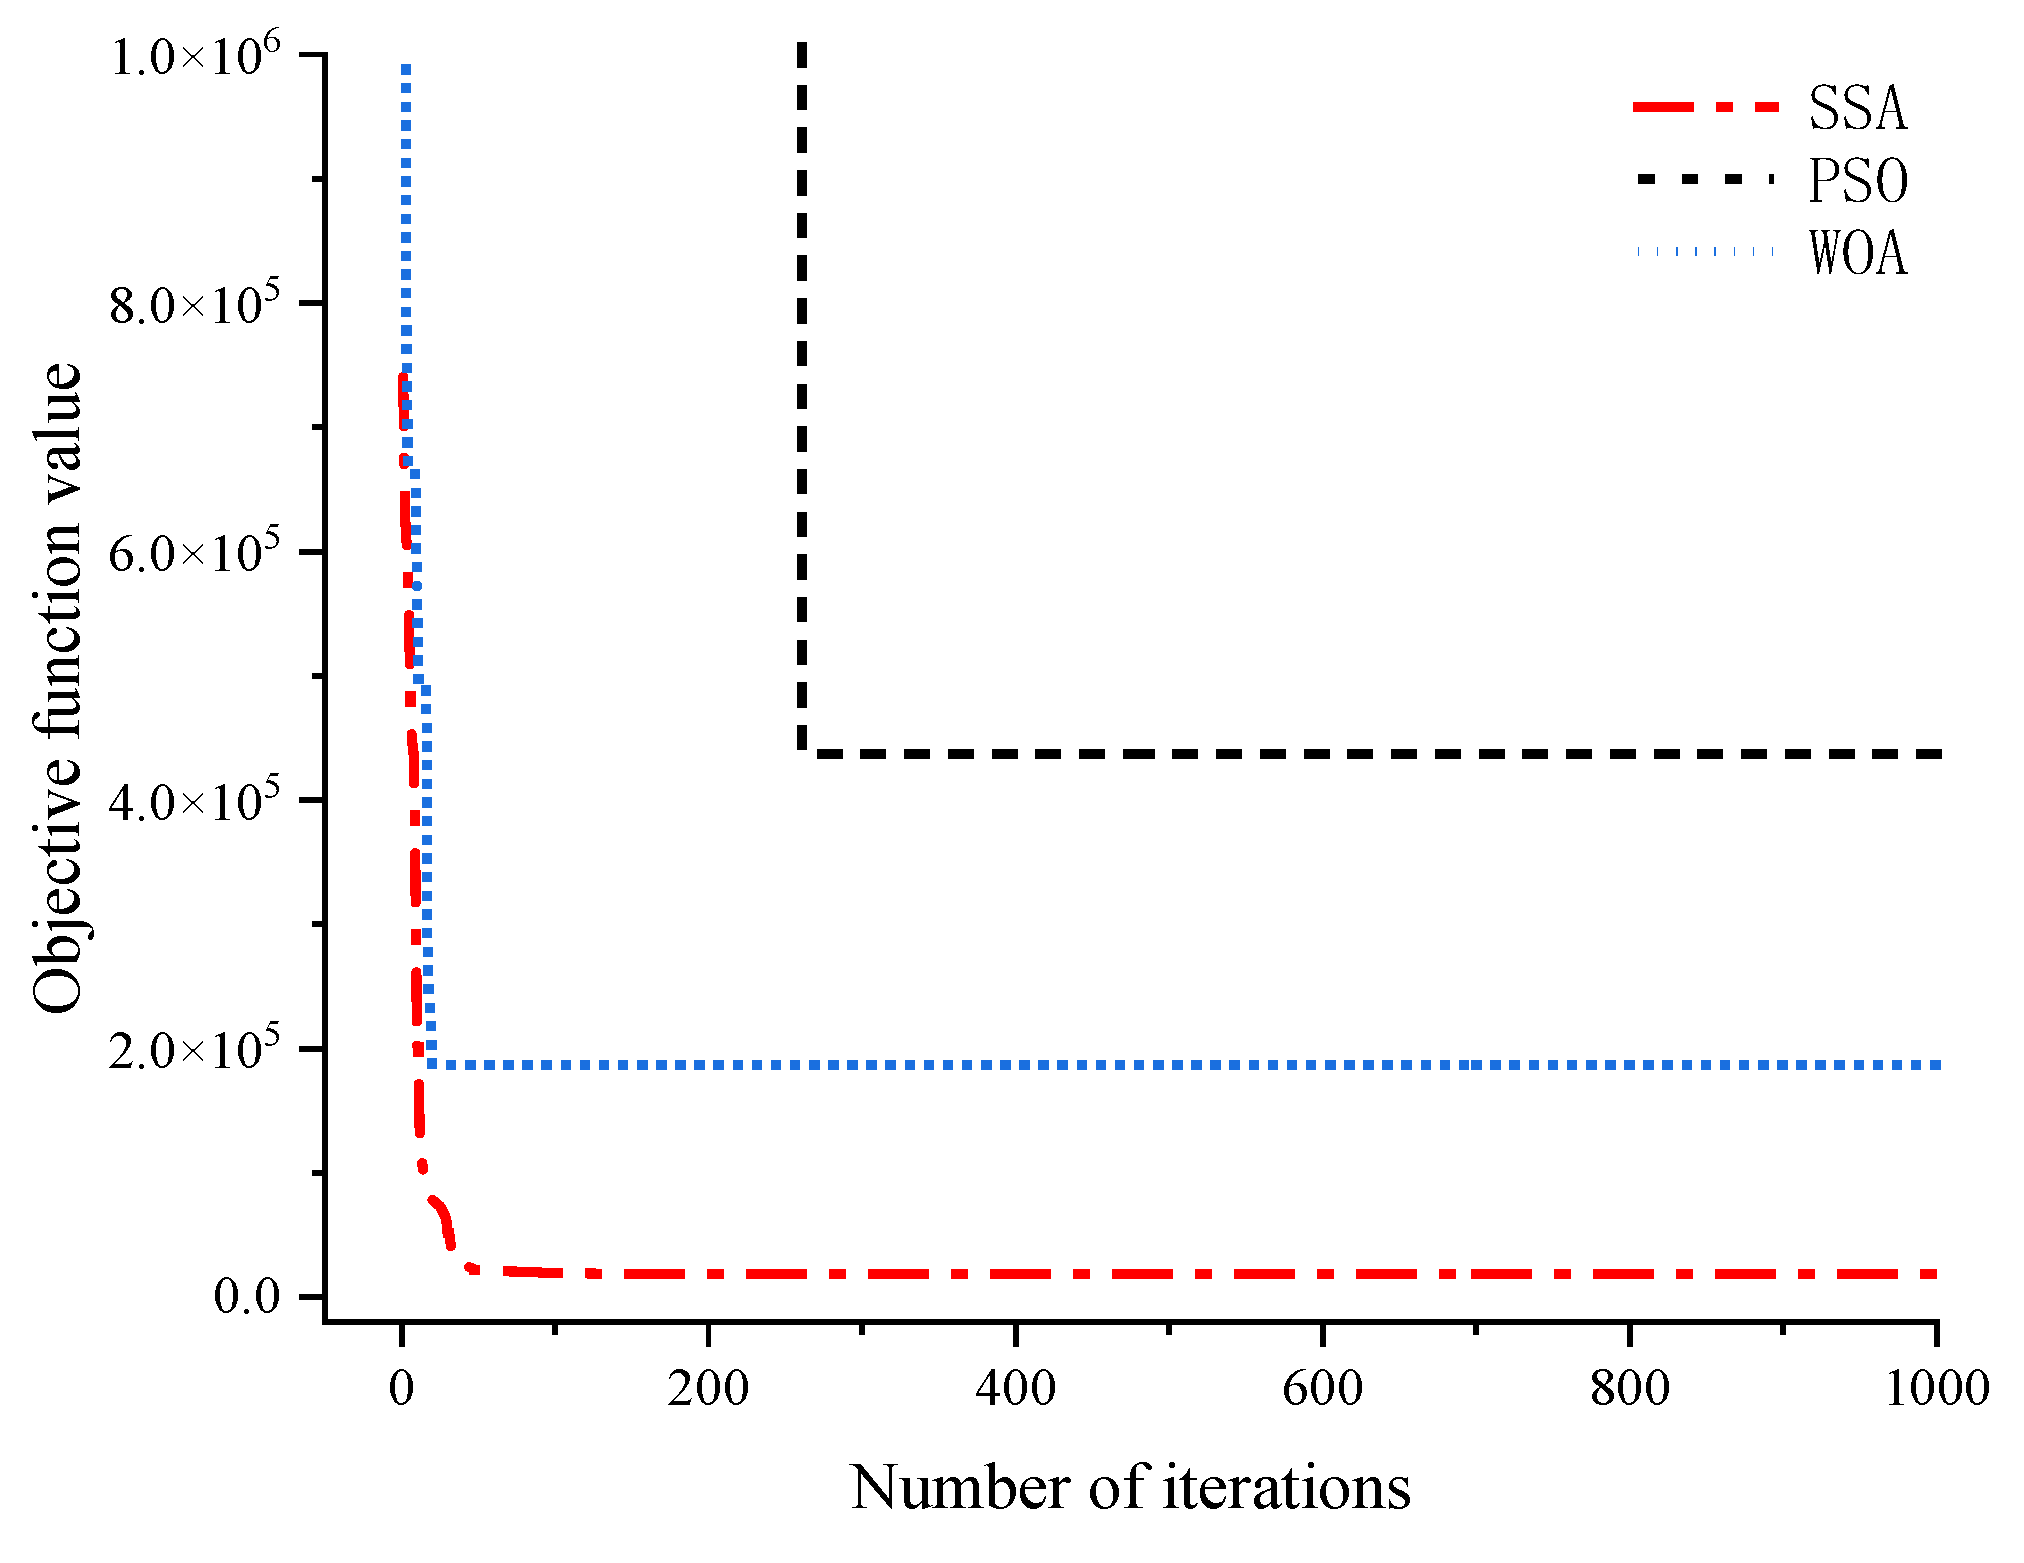
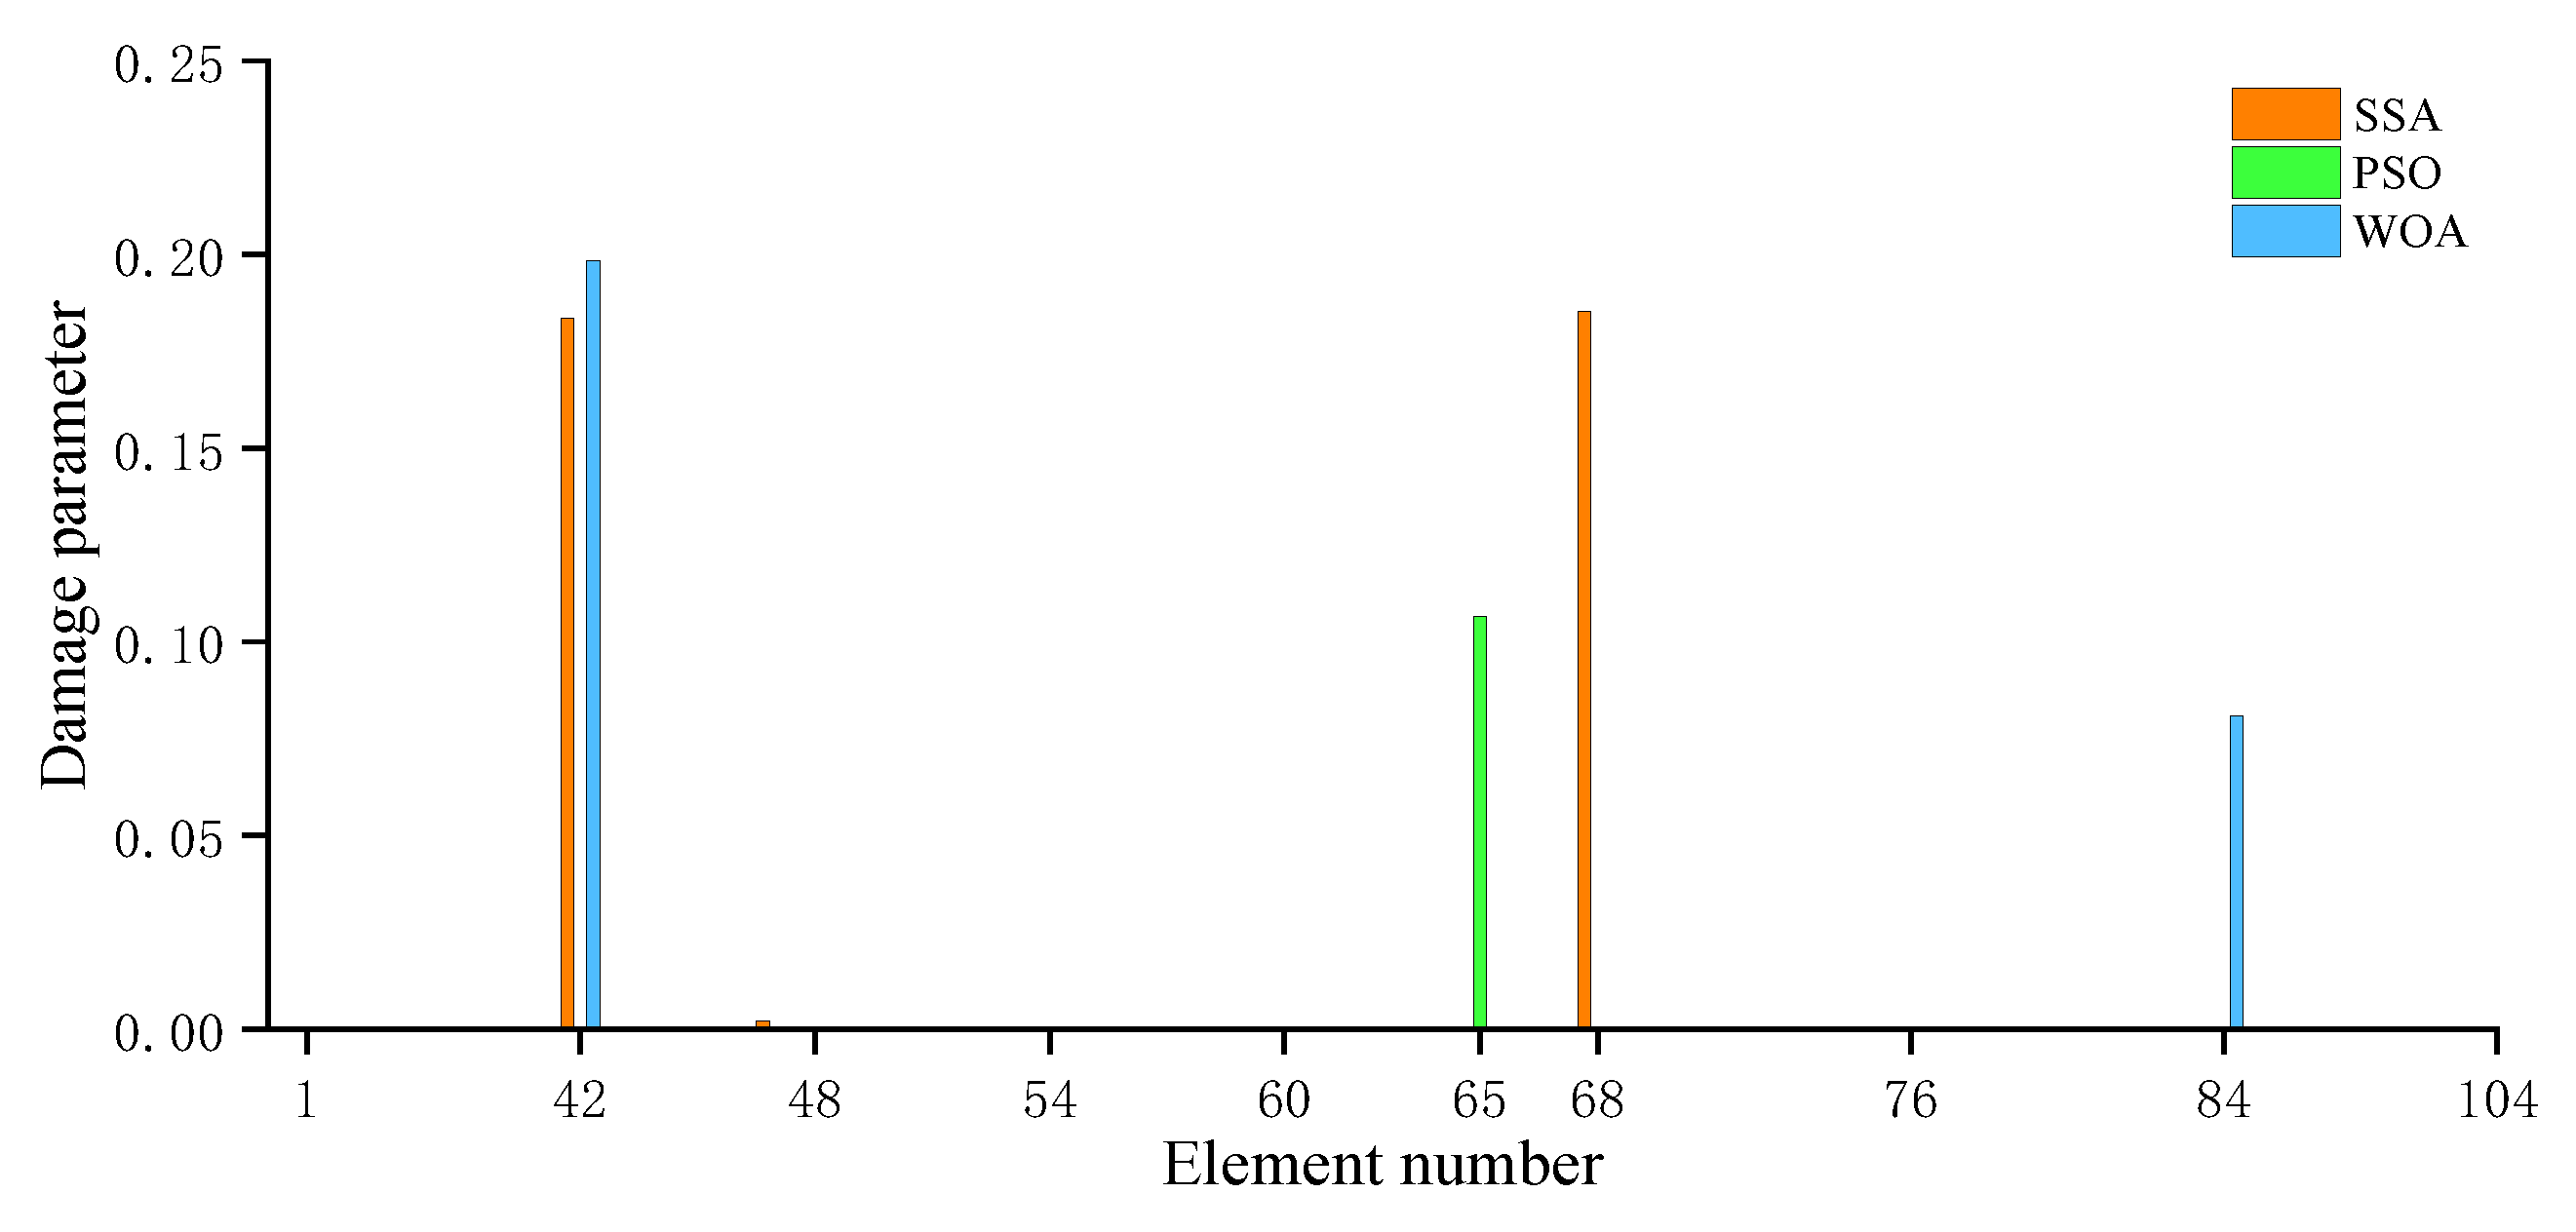
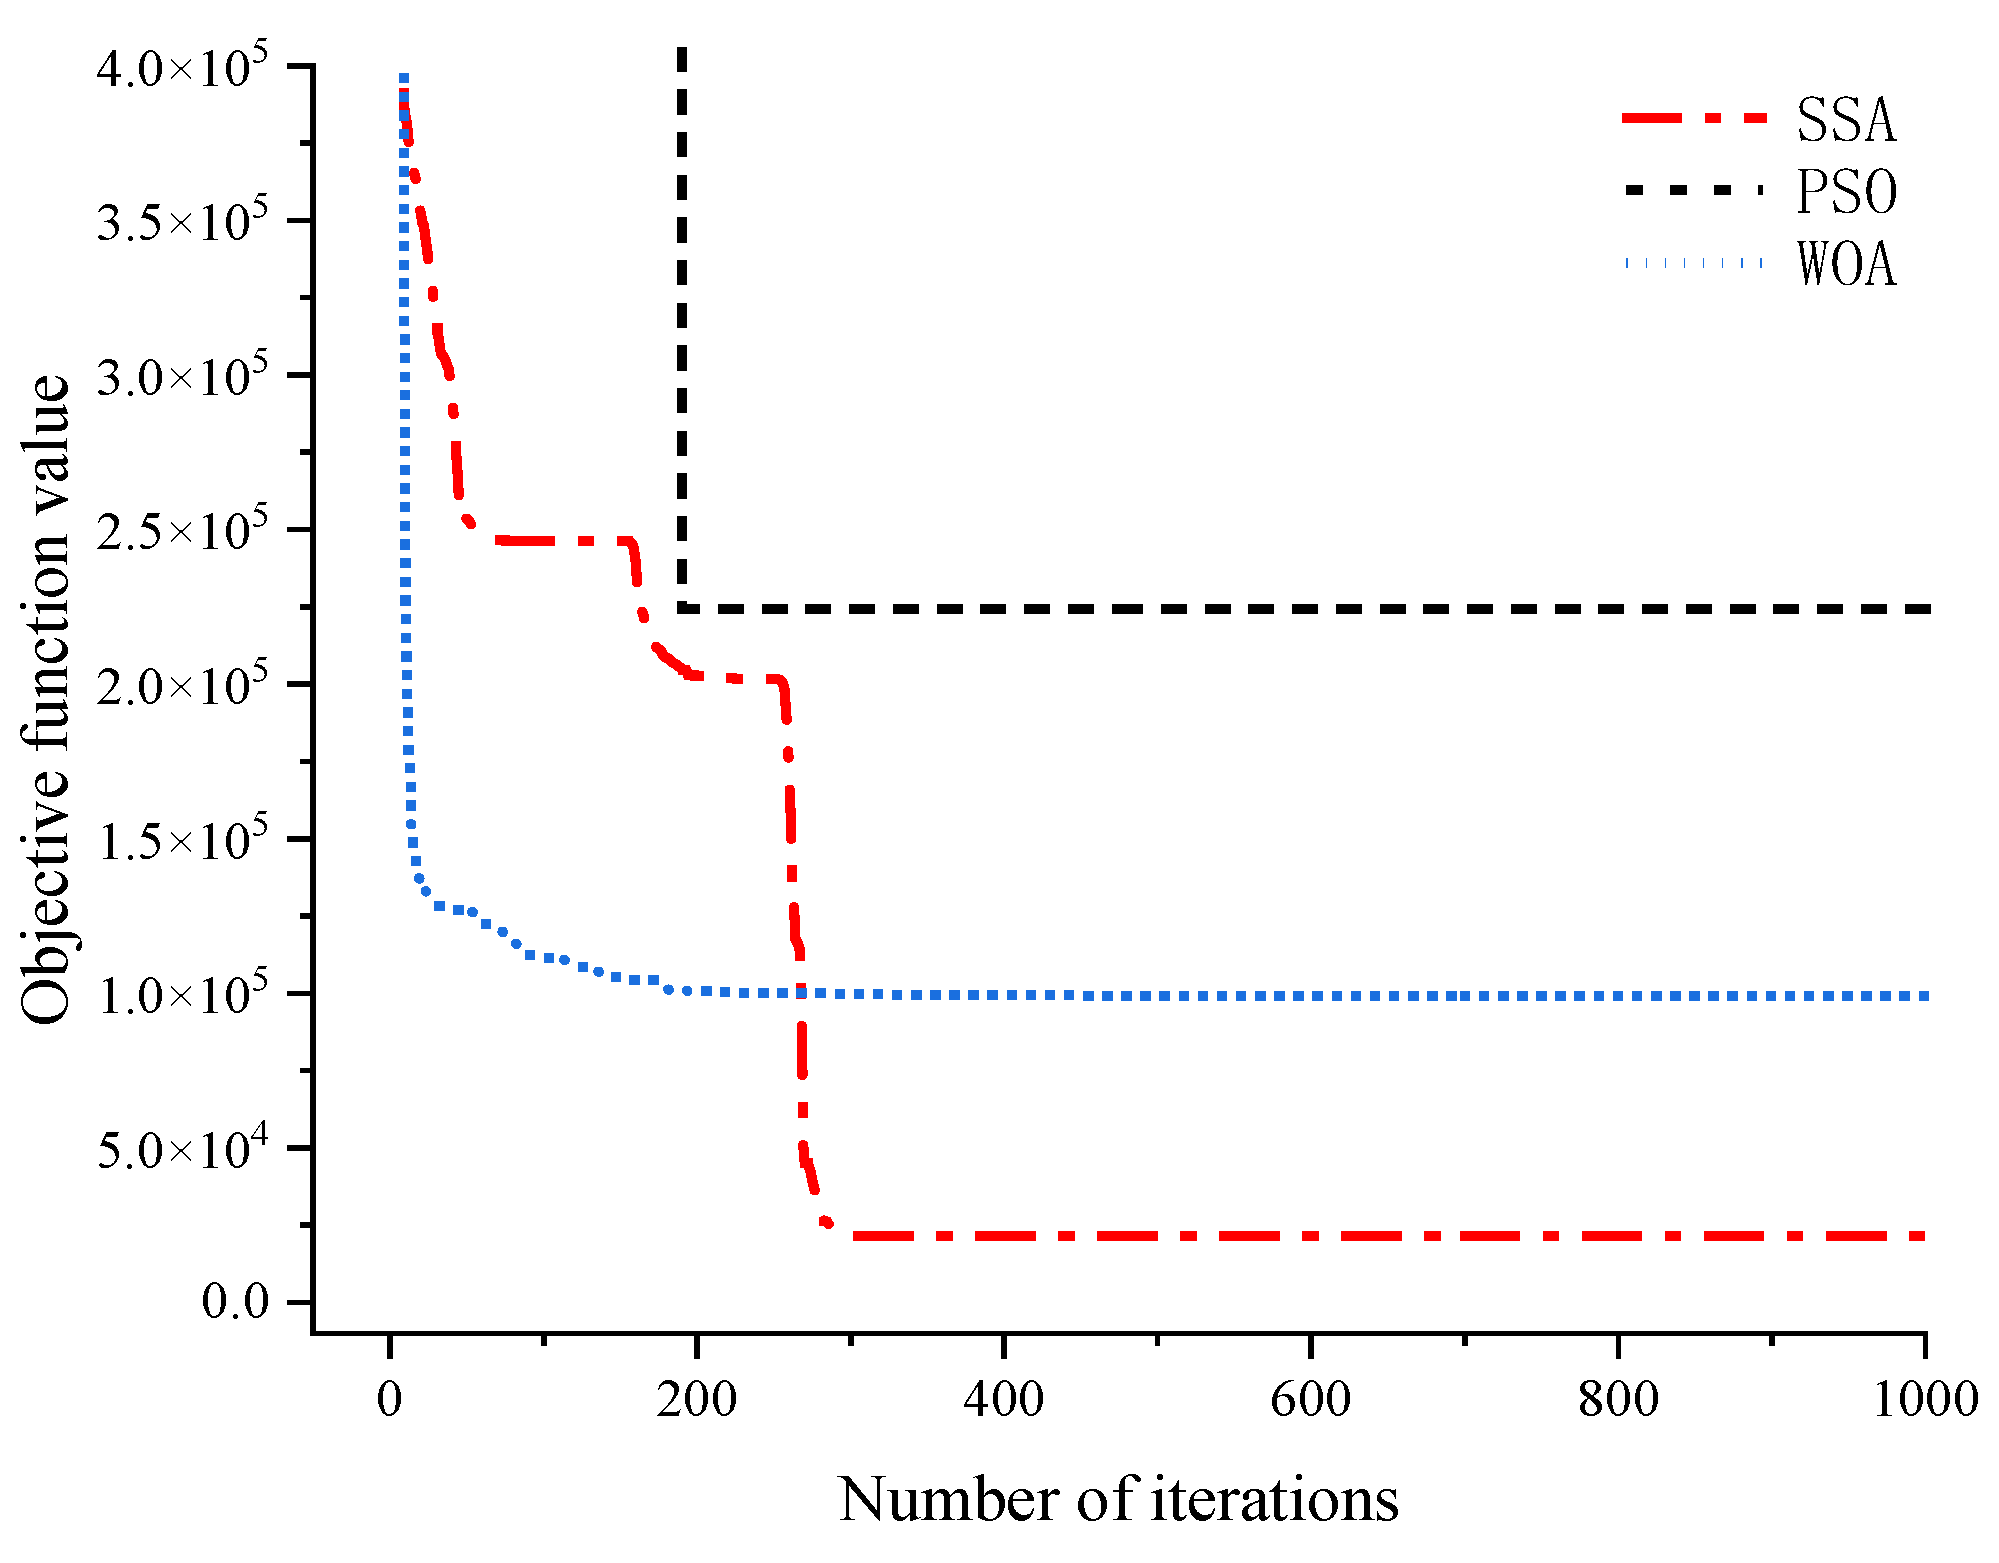
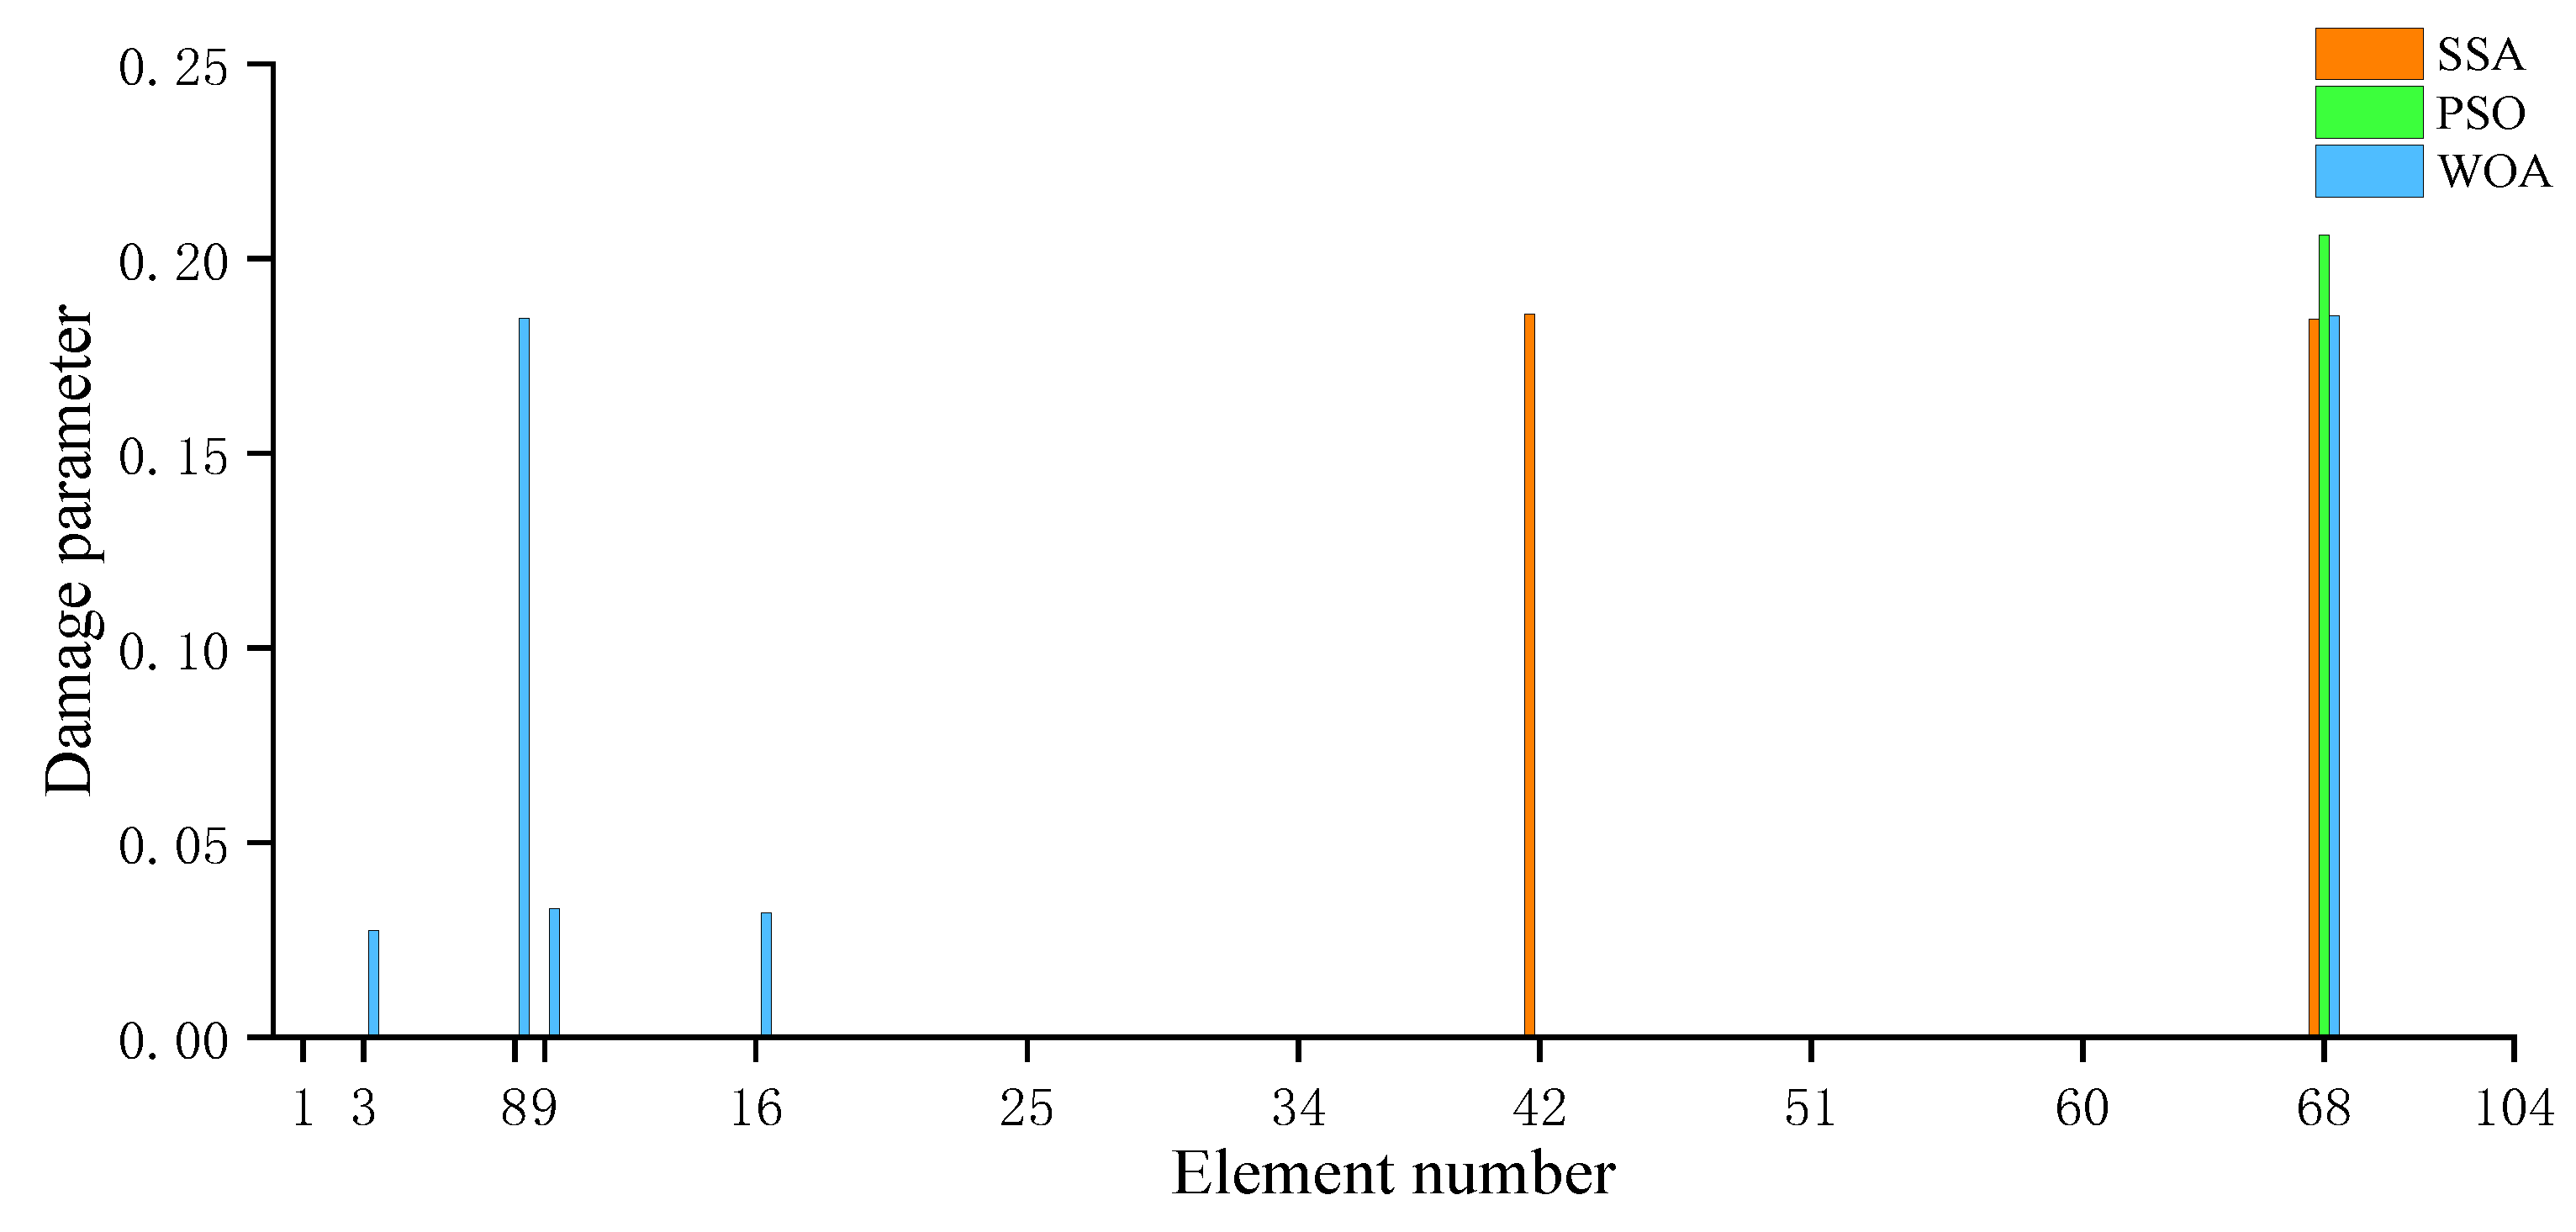
Figure 8 and Figure 9 illustrate the iterative processes and computational results of the three algorithms under the first damage scenario without noise in the data. Figure 10 and Figure 11 present the iterative processes and computational results of the three algorithms under the first damage scenario with a 5% noise level. Figure 12 and Figure 13 display the iterative processes and computational results of the three algorithms under the first damage scenario at a 10% noise level. Table 3 presents a comparison of the computational performances of the three algorithms for damage scenario 1. As can be seen from Figure 8, Figure 10 and Figure 12, for damage Scenario 1, regardless of whether the data contains noise or not, the SSA is able to achieve the smallest objective function value after multiple iterations, which demonstrates that SSA outperforms PSO and WOA in terms of global convergence performance. As evident from Figure 9, Figure 11 and Figure 13, and Table 3, for noise-free data, 5% noise, and 10% noise, the error rate of SSA remains consistently at 0, indicating its superiority over PSO and WOA in terms of computational accuracy. For damage scenario 2, Figure 14, Figure 15, Figure 16, Figure 17, Figure 18 and Figure 19, respectively, present the iterative processes and computational results of the three algorithms under noise-free conditions, 5% noise, and 10% noise. Table 4 provides a comparison of the computational performances of the three algorithms for damage scenario 2. As can be seen from Figure 14, Figure 16 and Figure 18, for damage Scenario 2, regardless of whether the data contains noise or not, the objective function values of SSA after multiple iterations are significantly smaller than those of PSO and WOA. This indicates that the SSA significantly outperforms the other two algorithms in terms of global convergence performance. As evident from Figure 15, Figure 17 and Figure 19, and Table 4, for damage scenario 2, only the SSA achieves a zero error rate and demonstrates a significantly higher overall identification accuracy compared to PSO and WOA. The results mentioned above indicate that the SSA still maintains excellent robustness even under the interference of data noise.
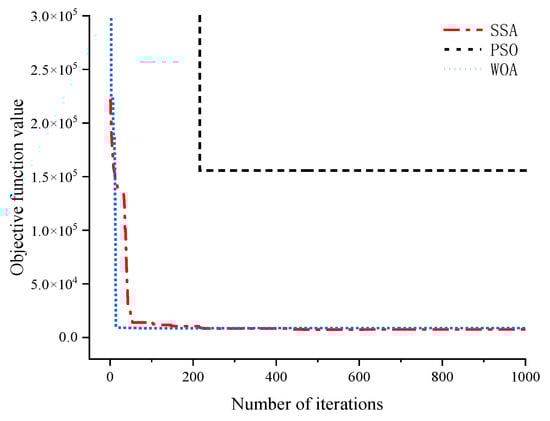
Figure 8.
SSA, WOA, and PSO iteration processes for the lattice structure (damage scenario 1, without noise).
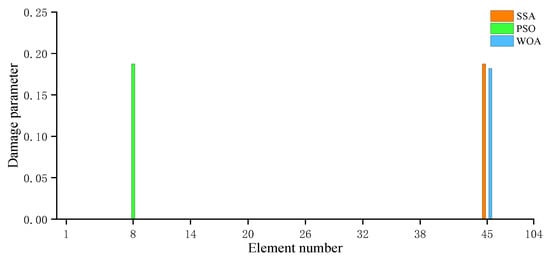
Figure 9.
SSA, WOA, and PSO calculation results for the lattice structure (damage scenario 1, without noise).
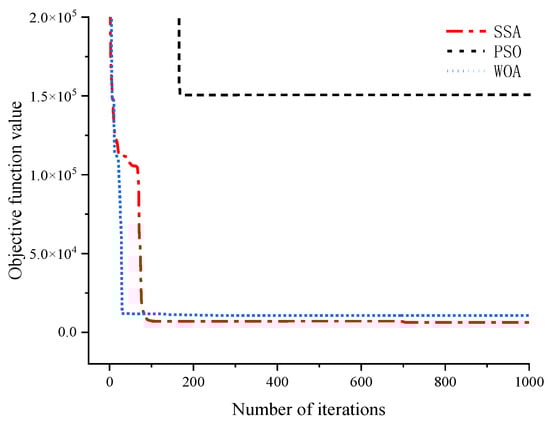
Figure 10.
SSA, WOA, and PSO iteration processes for the lattice structure (damage scenario 1 with 5% noise).
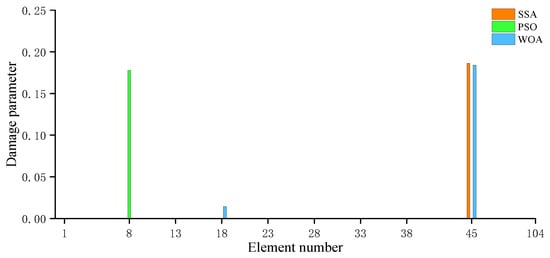
Figure 11.
SSA, WOA, and PSO calculation results for the lattice structure (damage scenario 1 with 5% noise).
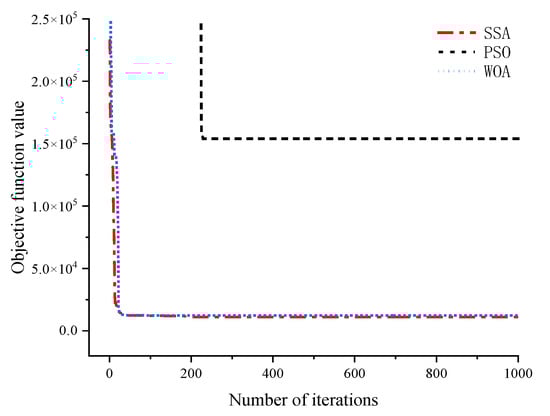
Figure 12.
SSA, WOA, and PSO iteration processes for the lattice structure (damage scenario 1 with 10% noise).
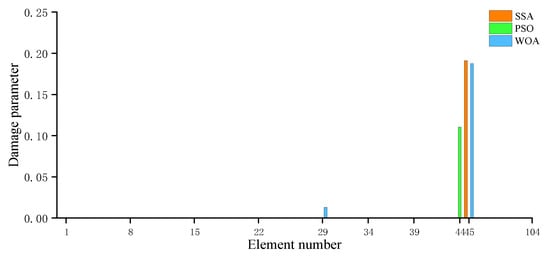
Figure 13.
SSA, WOA, and PSO calculation results for the lattice structure (damage scenario 1 with 10% noise).
Table 3.
Performance comparison of SSA, WOA, and PSO for the lattice structure (damage scenario 1).
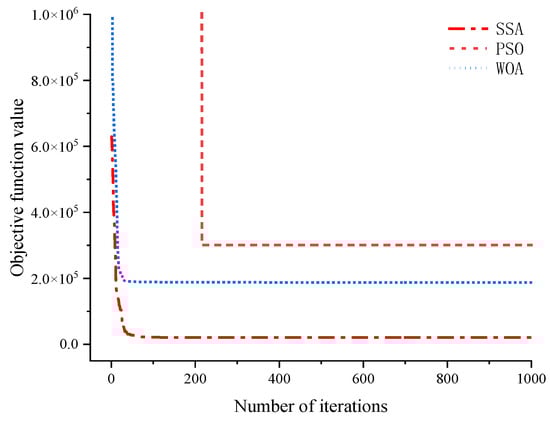
Figure 14.
SSA, WOA, and PSO iteration processes for the lattice structure (damage scenario 2, without noise).
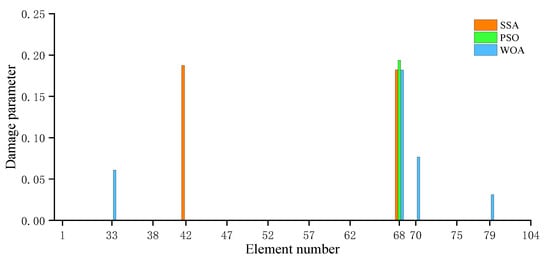
Figure 15.
SSA, WOA, and PSO calculation results for the lattice structure (damage scenario 2 without noise).
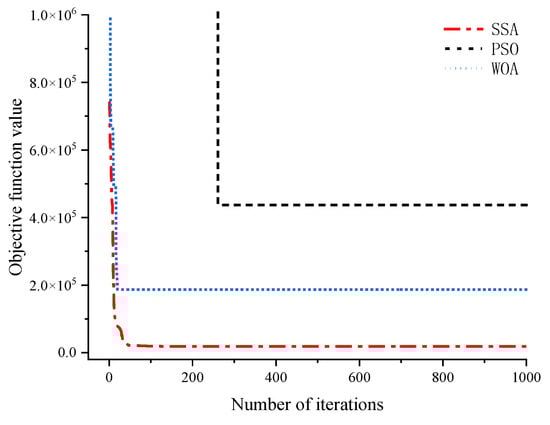
Figure 16.
SSA, WOA, and PSO iteration processes for the lattice structure (damage scenario 2 with 5% noise).
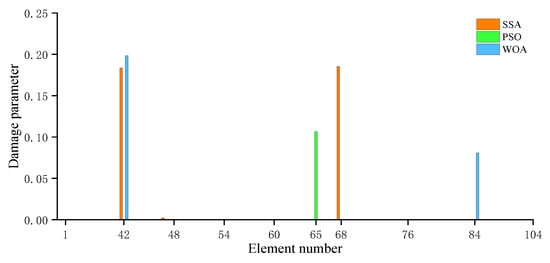
Figure 17.
SSA, WOA, and PSO calculation results for the lattice structure (damage scenario 2 with 5% noise).
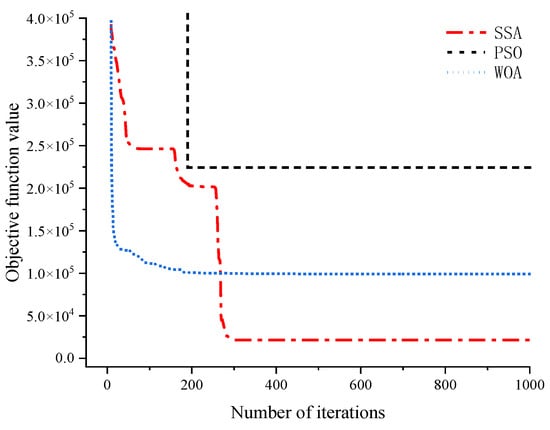
Figure 18.
SSA, WOA, and PSO iteration processes for the lattice structure (damage scenario 2 with 10% noise).
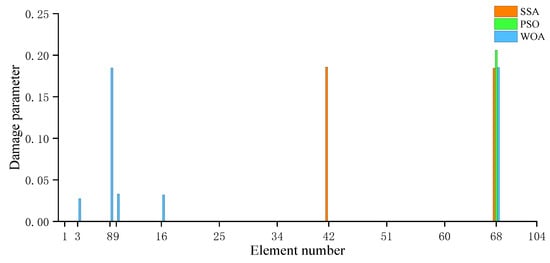
Figure 19.
SSA, WOA, and PSO calculation results for the lattice structure (damage scenario 2 with 10% noise).
Table 4.
Performance comparison of SSA, WOA, and PSO for the lattice structure (damage scenario 2).
4. Experimental Validation
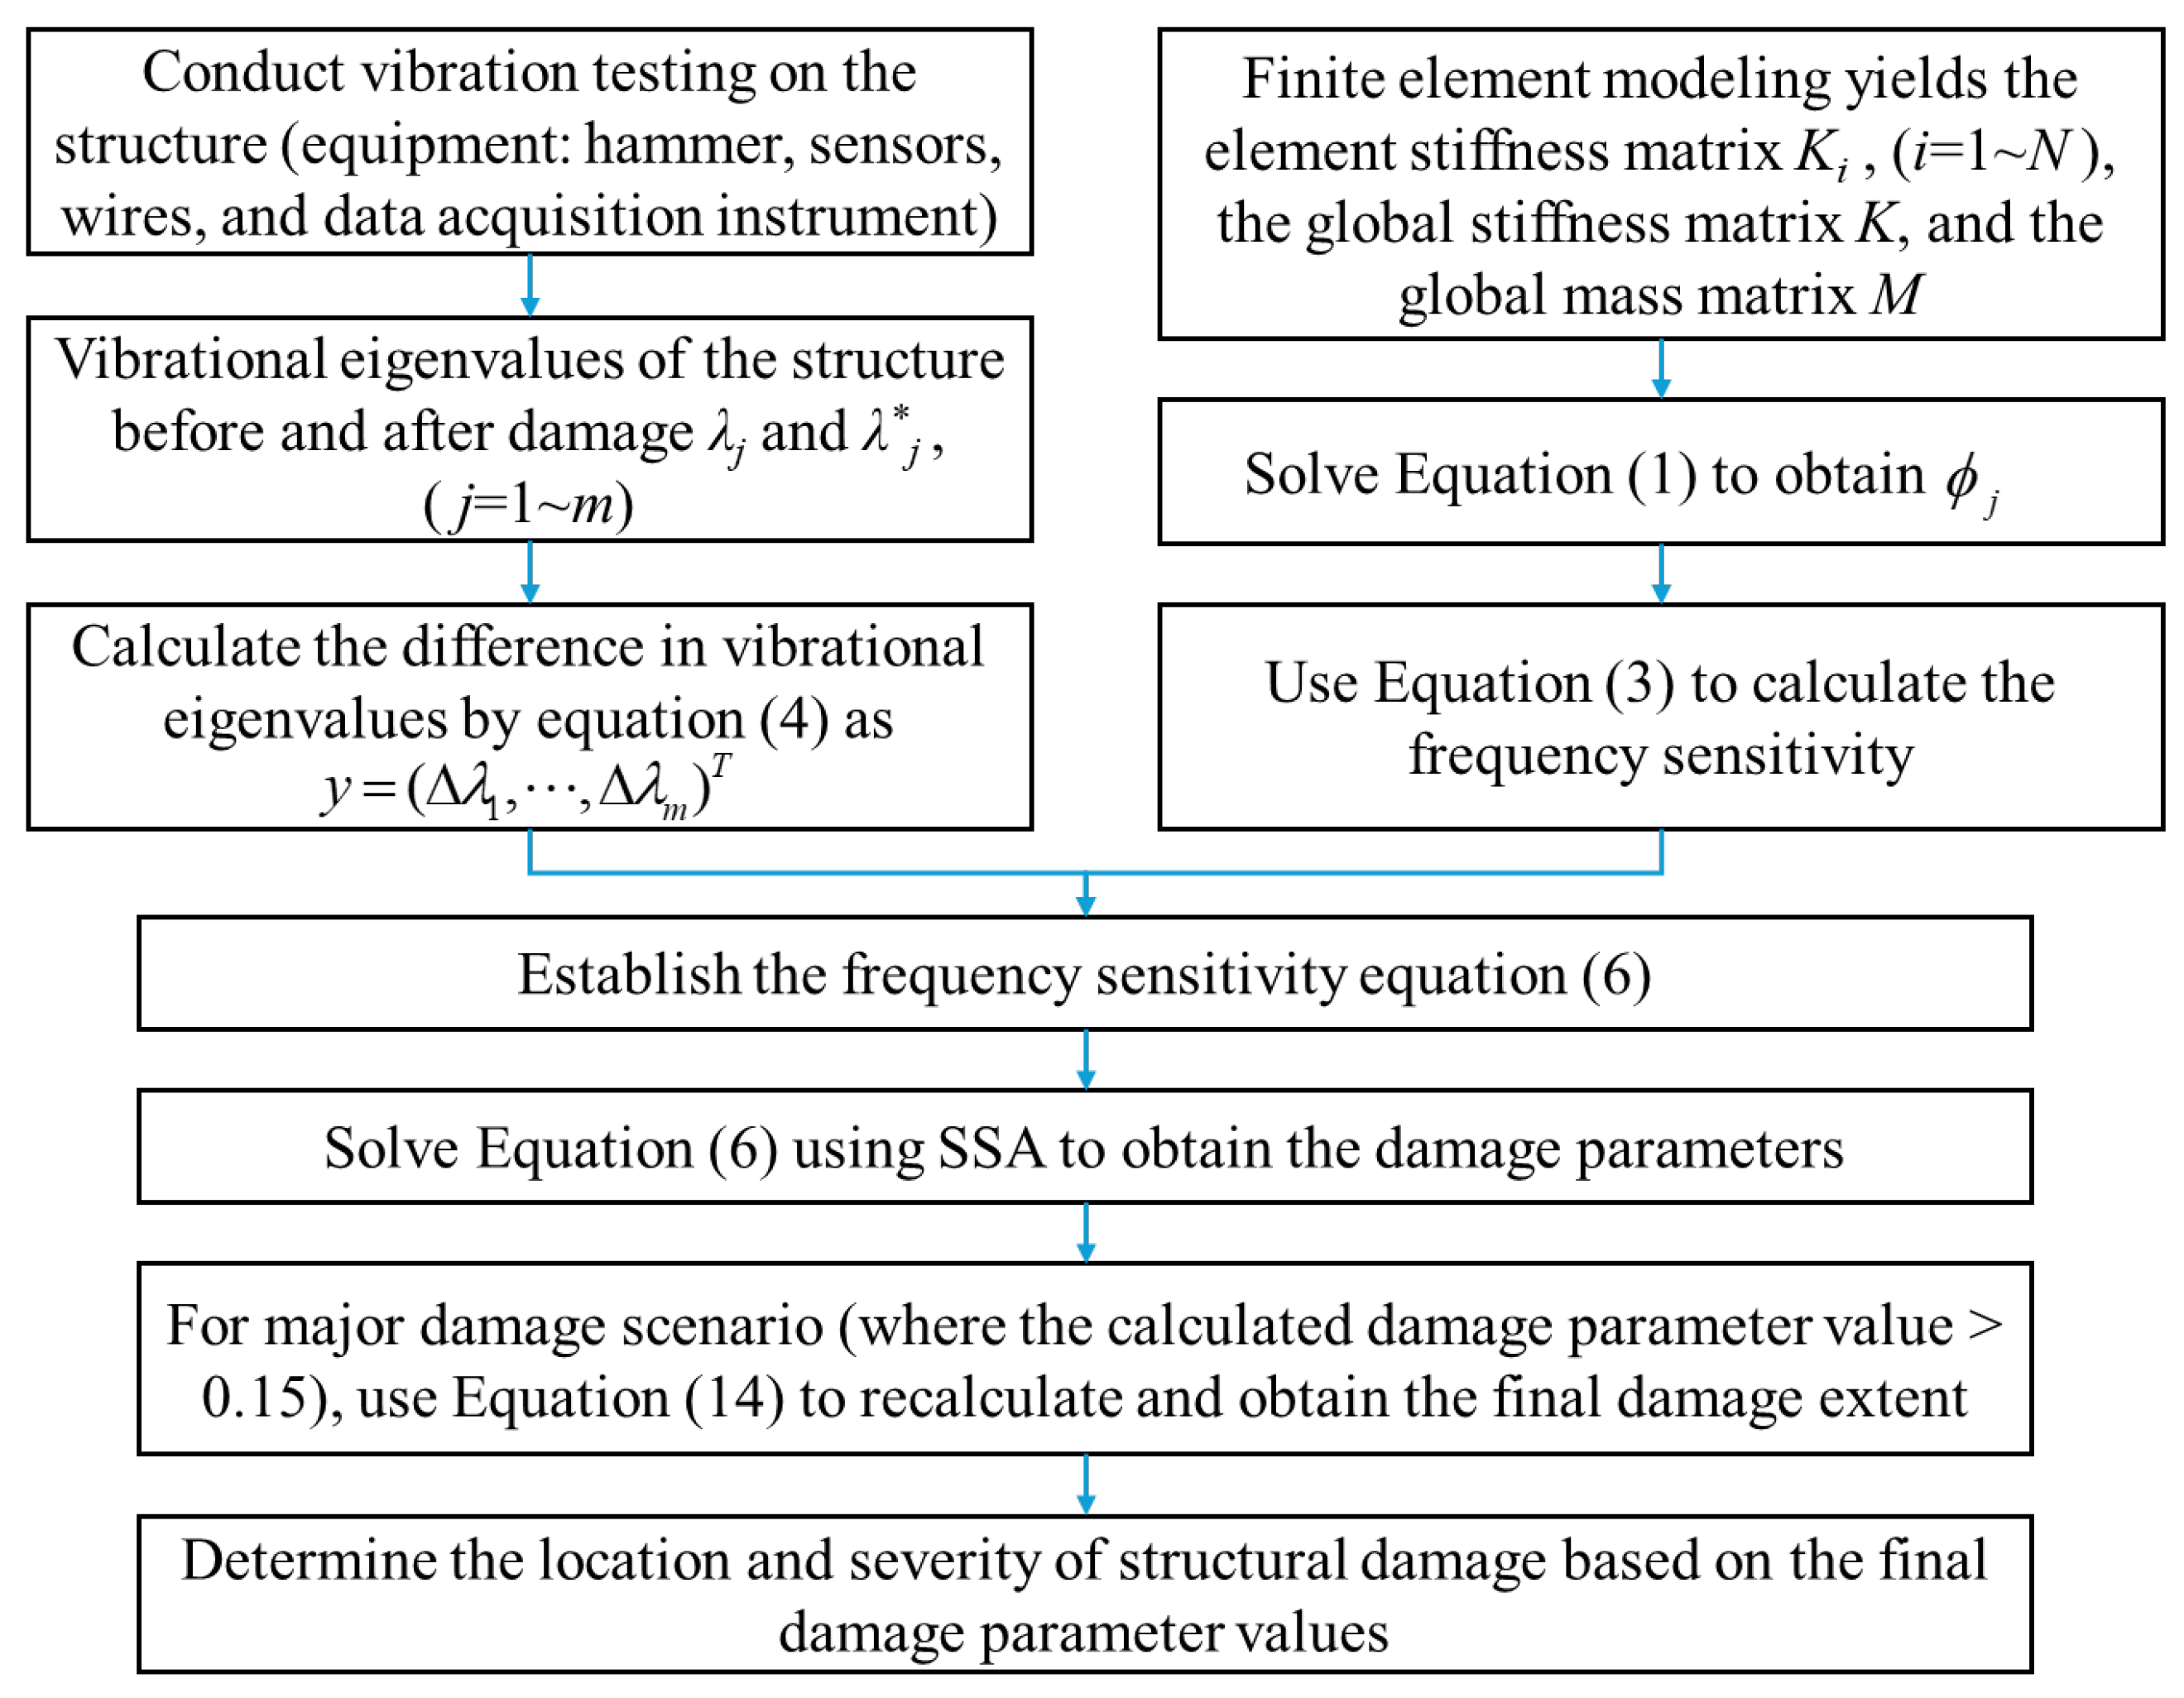
When applying the proposed method for damage detection in actual structures, the implementation mainly consists of three parts. The first part involves conducting vibration tests on the structure to obtain the vibration frequencies before and after the structural damage. The equipment required for vibration testing includes a hammer, sensors, wires, and data acquisition instruments. The second part involves performing finite element modeling of the structure to obtain the stiffness matrix and mass matrix. Finite element modeling can be carried out using finite element software, such as ANSYS 2021 R1 or MATLAB 2021b. The third part involves establishing the frequency sensitivity equation and calculating the damage parameters using the SSA. Finally, judgments regarding the location and severity of structural damage are made based on the obtained damage parameters. A flowchart for the practical implementation of the proposed method is shown in Figure 20.
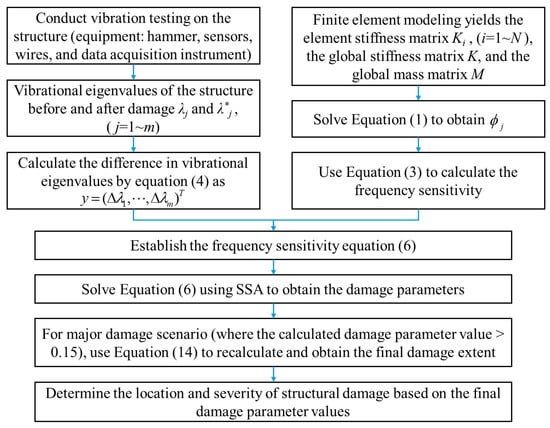
Figure 20.
Implementation flow of the proposed method.
4.1. Cantilever Beam
In order to verify the proposed method, Yang et al.’s experimental beam [34] is used as an example. The cantilever beam consists of aluminum, possessing an elastic modulus of 71 GPa and a mass density of 2210 kg/m3. As shown in Figure 21, the geometric parameters are 495.3 mm long, 25.4 mm wide, and 6.35 mm high. The beam model is composed of 20 equal-length elements, and sawing damage is performed in the 9th element. According to reference [34], the boundary conditions of the beam structure are fixed at one end and free at the other. An accelerometer is employed to capture the response of the beam structure to impact loads, and subsequently, spectral analysis is conducted on the collected vibration data to determine the natural frequencies of vibration. The first six natural frequencies, both before and after damage, can be found in reference [34] and Table 5.
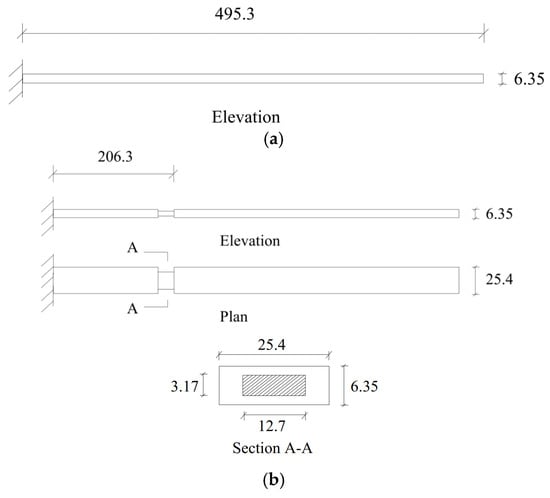
Figure 21.
The cantilever beam model. (a) Undamaged beam; (b) Damaged beam.
Table 5.
The six natural frequencies for intact and damaged beams.
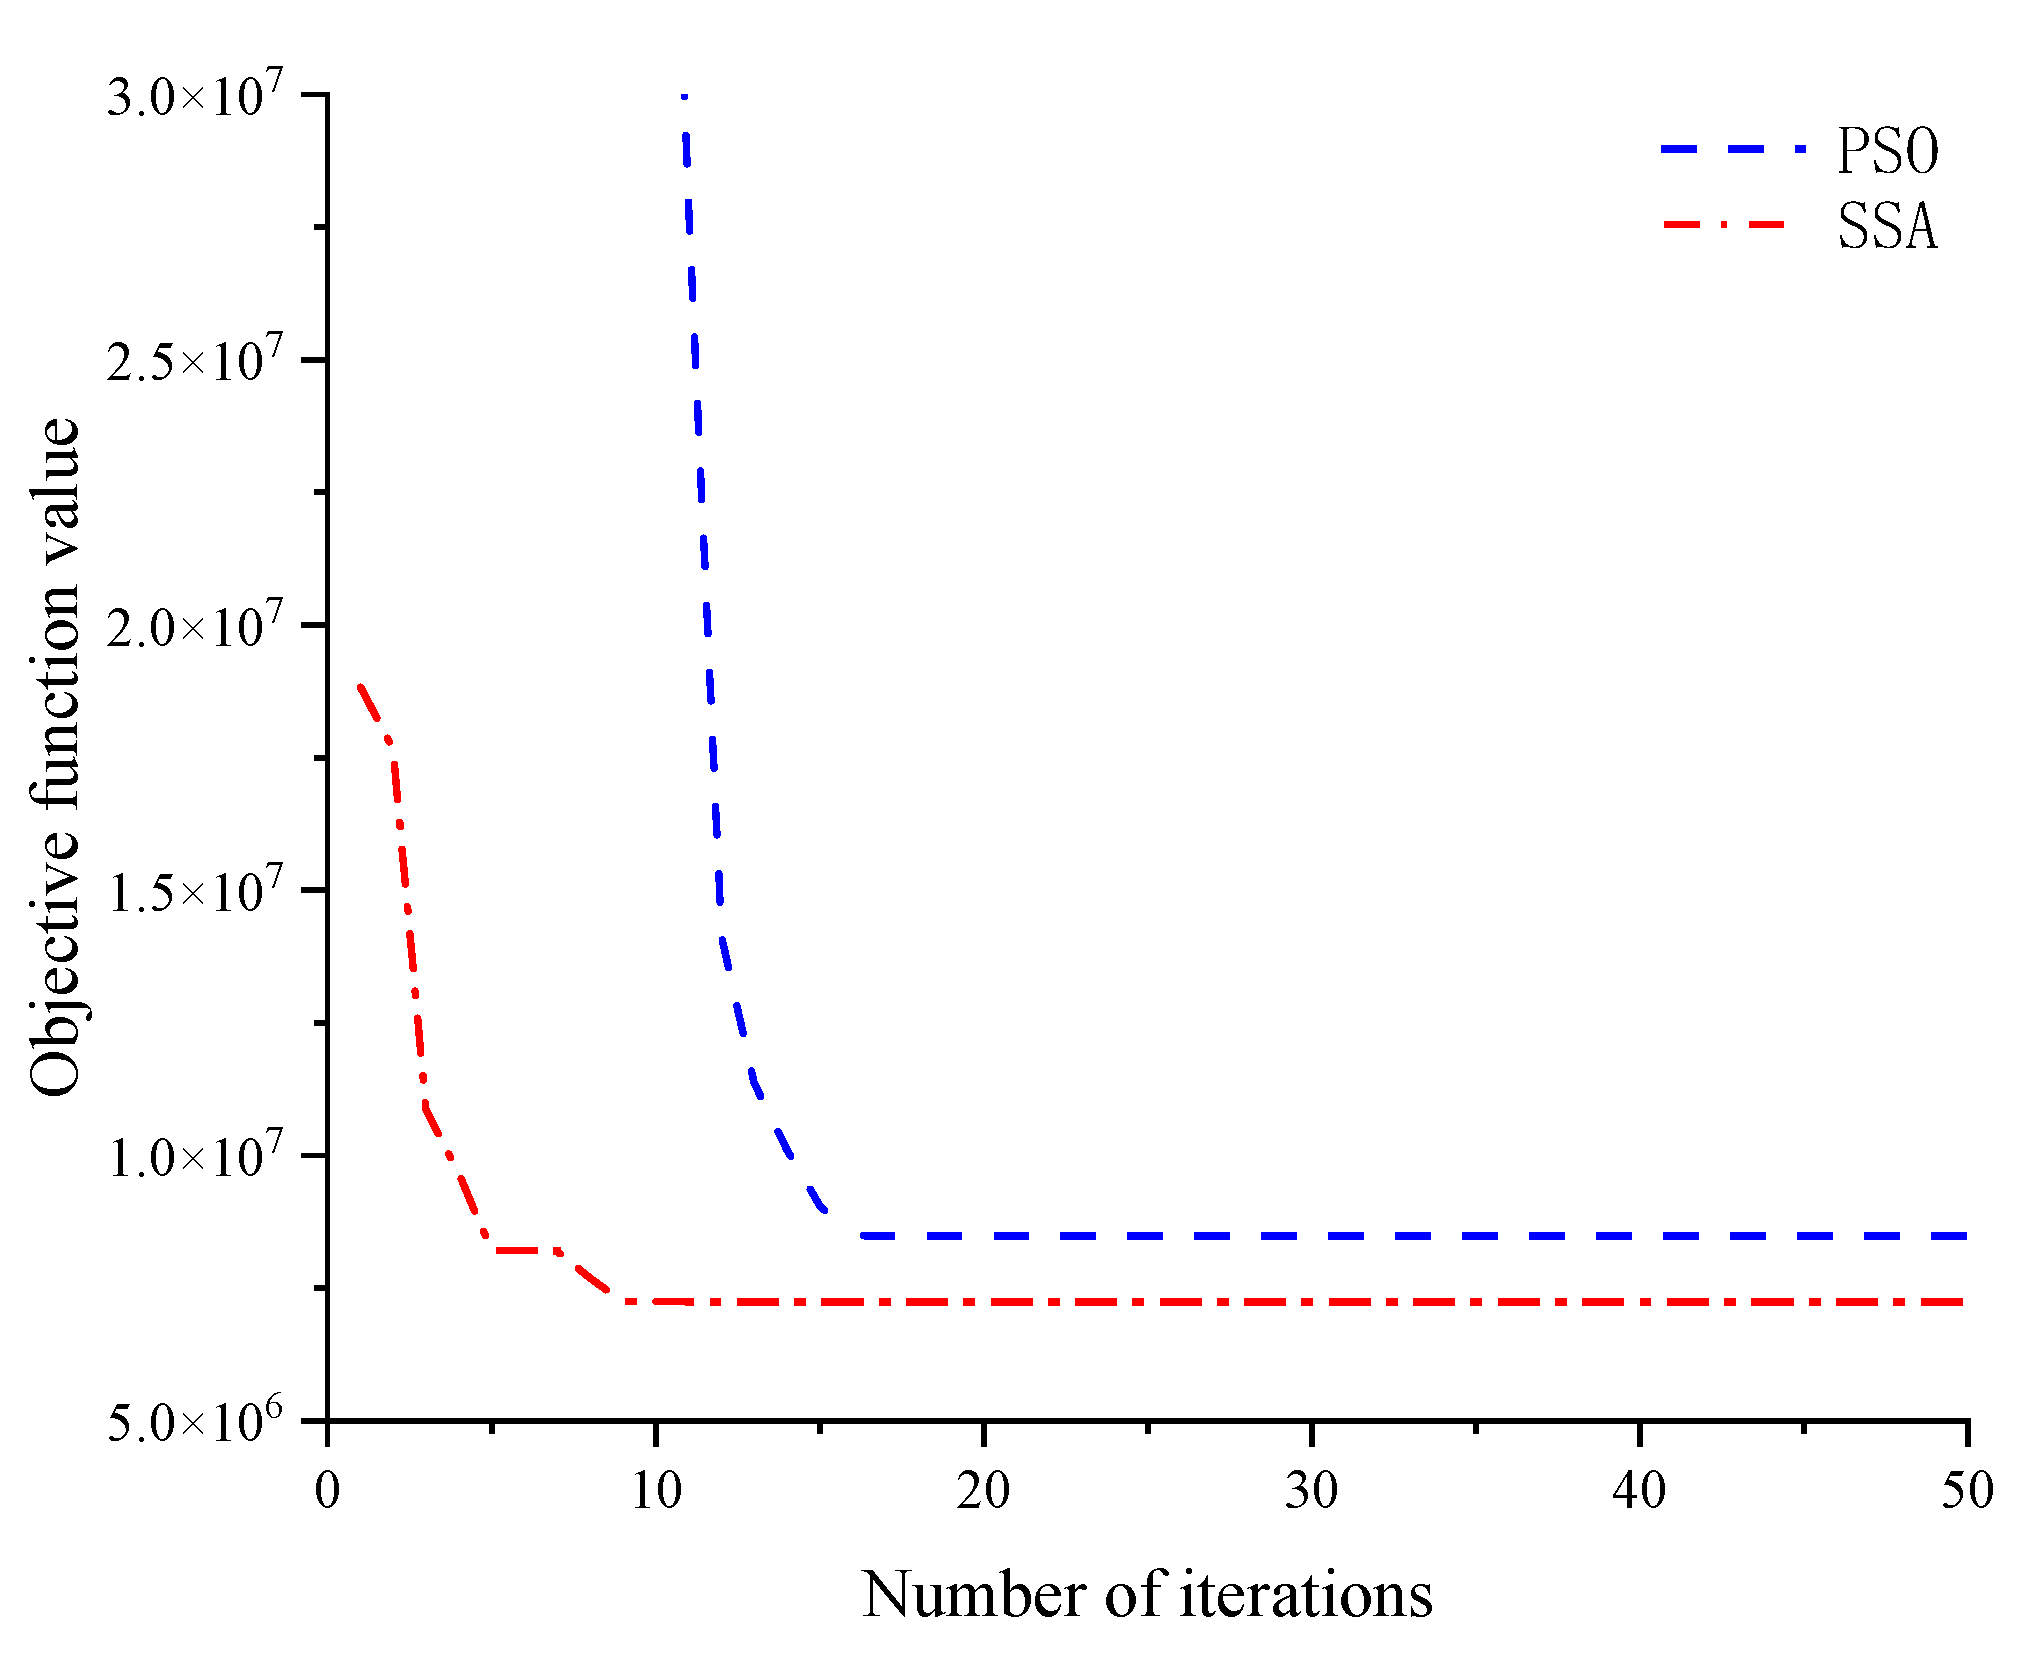
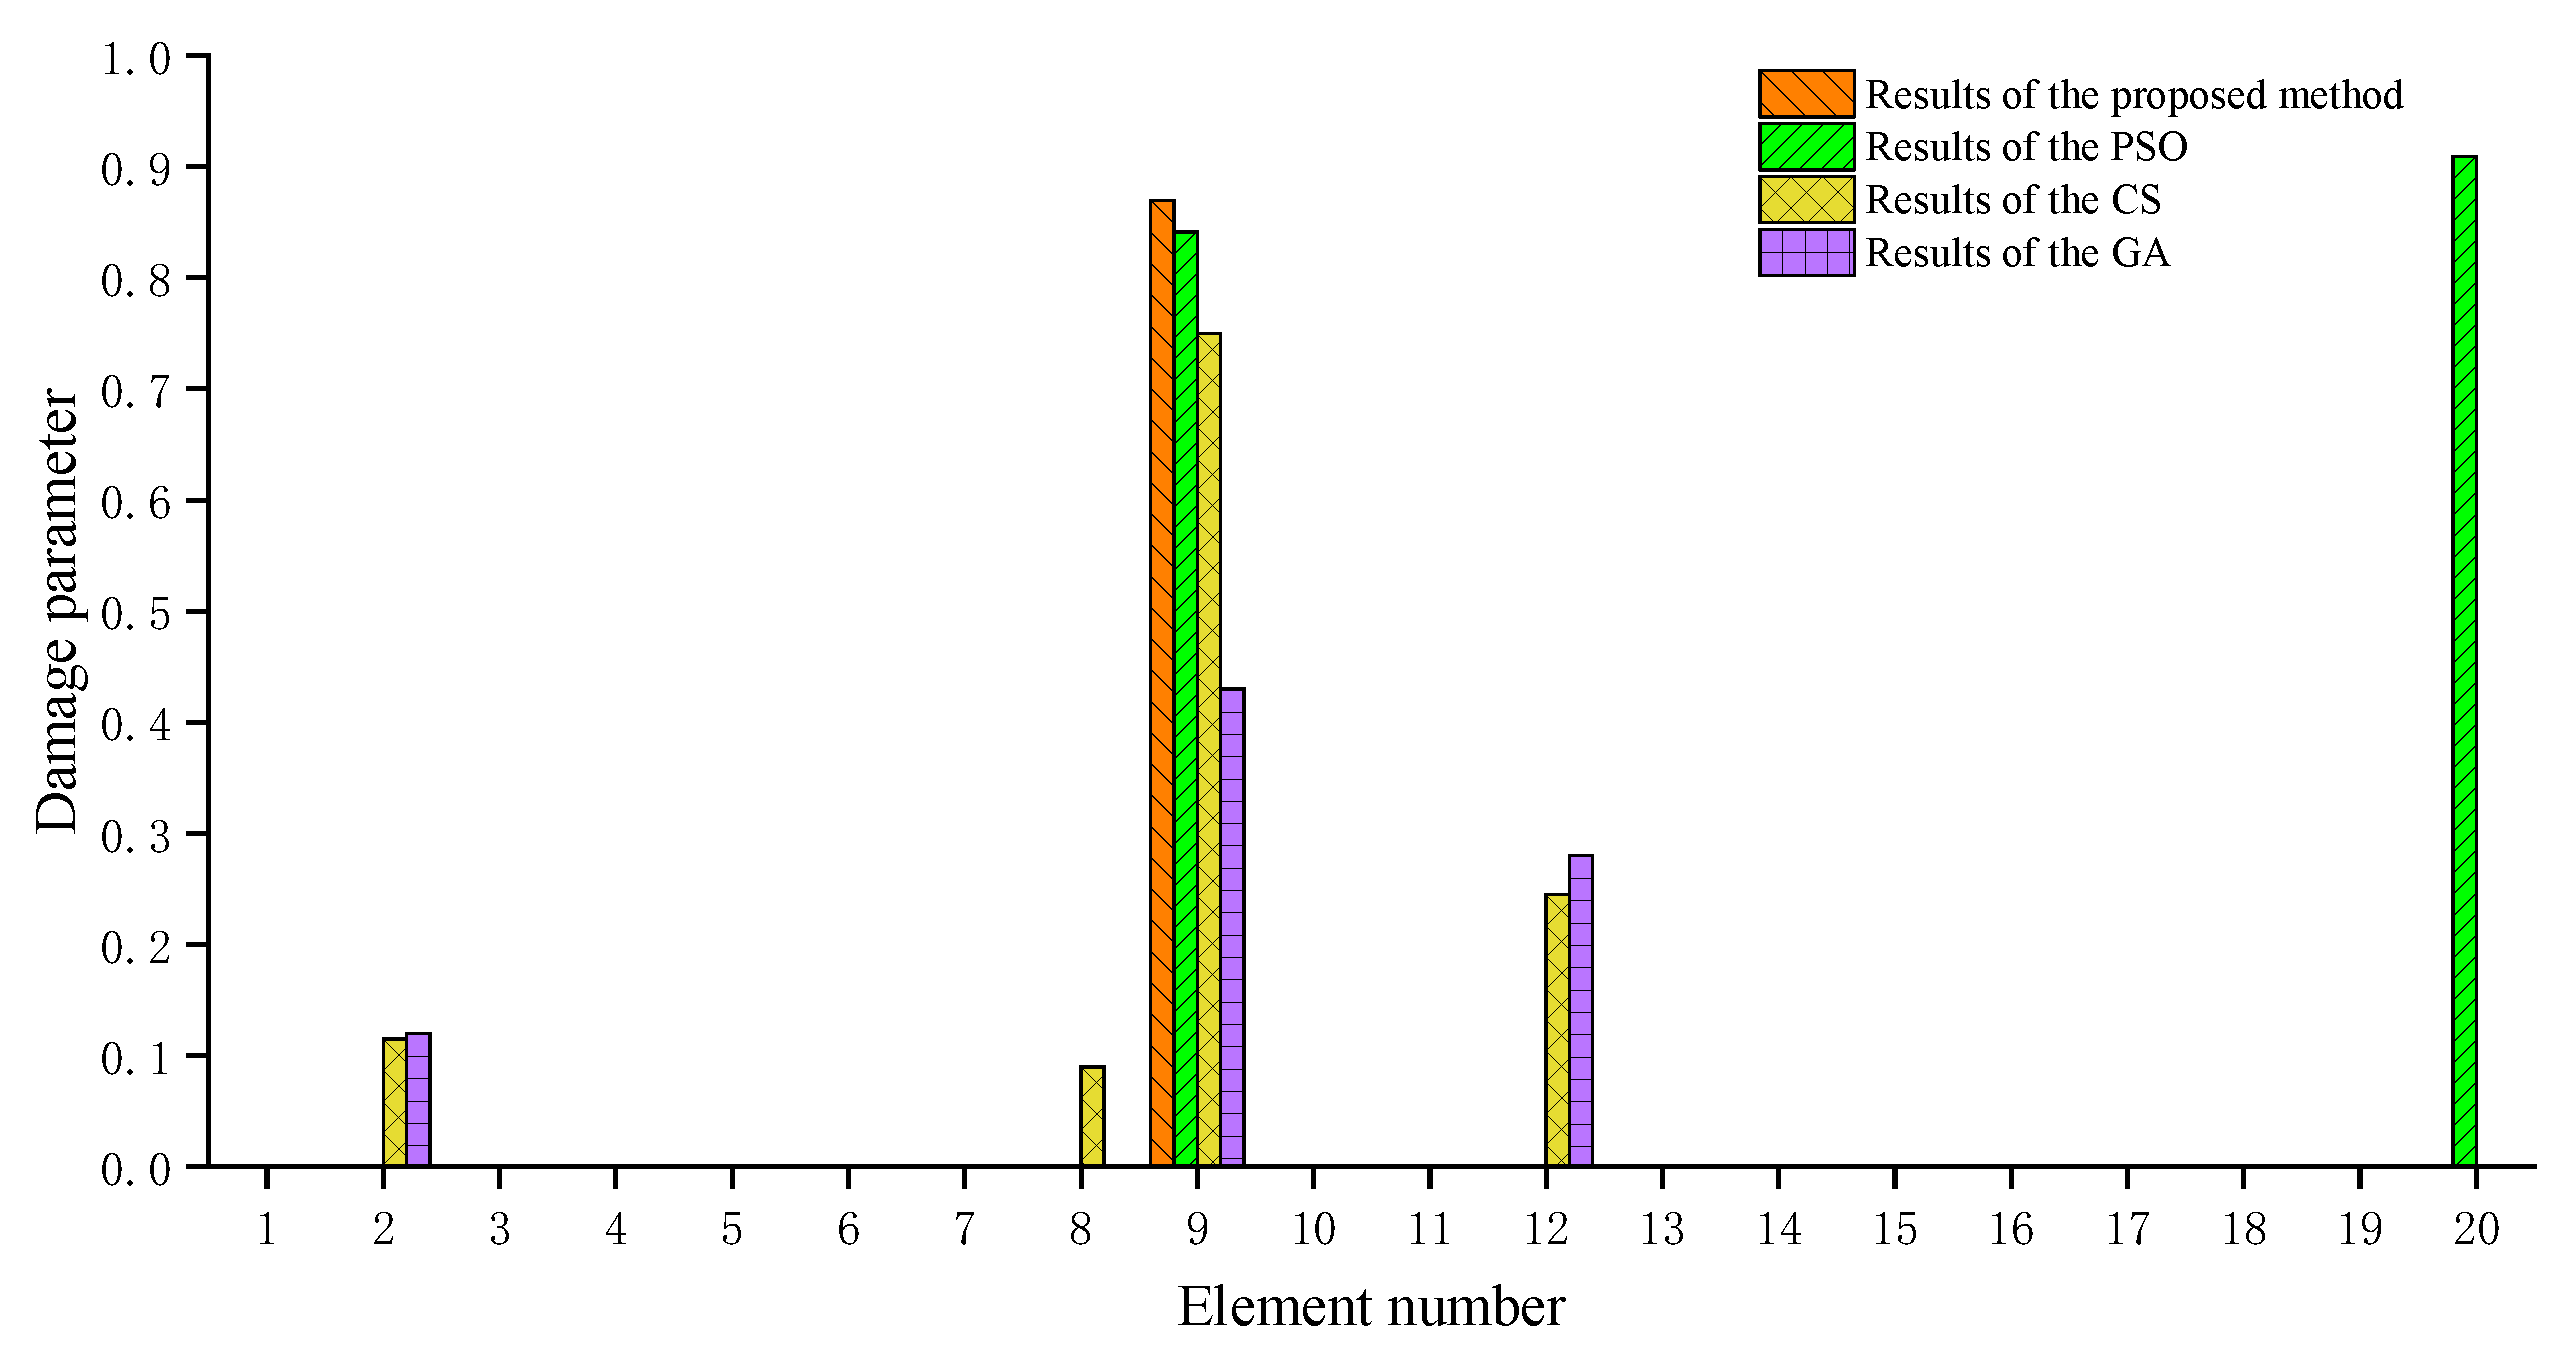
As shown in Table 5, there are significant differences between the analytical values derived from the finite element model and the experimental values obtained through dynamic testing. Consequently, the finite element model for the undamaged beam was revised, and the improved model was applied to the damage assessment. Table 6 presents the analytical values of the first six natural frequencies obtained using the revised finite element model. It is evident that the corrected frequency values are closer to the experimental ones. Based on the improved finite element model, a structural damage assessment was conducted using the SSA and PSO. Figure 22 presents the iterative calculation processes for the PSO and SSA. As shown in Figure 22, the SSA begins to converge approximately at the 10th iteration, whereas the PSO starts converging approximately at the 15th iteration, which indicates that the SSA reaches a state of convergence earlier than the PSO. Figure 9 compares the damage assessment results obtained by the SSA and PSO with those obtained using the methods described in references [16,26]. Note that the method utilized in reference [16] is the Cuckoo Search(CS), whereas the method employed in reference [26] is GA. As shown in Figure 23, only the result obtained by the SSA method indicates that element 9 is the sole location of damage, and the calculated damage extent of 86.9% is the closest to the actual value of 93.75%. Although the results of the other three optimization algorithms also identify element 9 as a damaged location, they mistakenly identify damage in other elements as well. Furthermore, the calculated damage extent values for element 9 obtained by the other three algorithms are further away from the true value compared to the result obtained by SSA. In terms of computational efficiency, CS used 65,000 iterations and GA used 500 iterations, both of which are far greater than the number of iterations used by SSA. The discrepancy between the actual damage degree value (93.75%) and the calculated value (86.9%) obtained through the SSA can be attributed to two primary factors: (1) measurement errors inherent in the experimental data and (2) a significant reduction in mass during the material cutting process. It is important to note that the proposed algorithm operates under the assumption that there is no change in mass before and after damage, which deviates from the experimental scenario, where a notable mass reduction occurred. Despite this, the calculation error remains within an acceptable range for engineering applications. Table 7 presents a comparison of the computational performance of four swarm intelligence optimization algorithms: PSO, GA, CS, and SSA. As can be seen from Table 7, only the SSA achieves a 0% error rate and boasts the highest recognition accuracy.
Table 6.
Comparisons of natural frequencies derived from the original FEM, revised FEM, and experimental results.
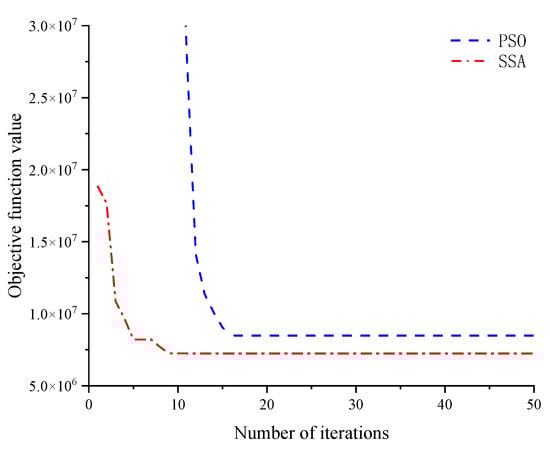
Figure 22.
PSO and SSA iteration processes for the beam structure.
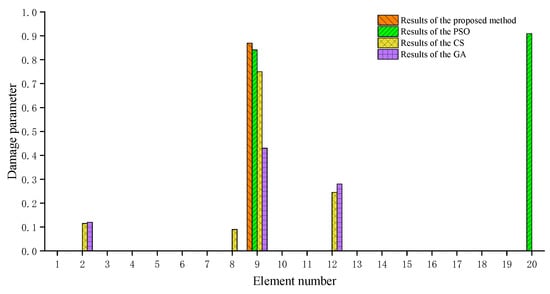
Figure 23.
Damage assessment results of the experimental beam by the four algorithms.
Table 7.
Performance comparison of four optimization algorithms for experimental beam.
4.2. Shear Frame Structure
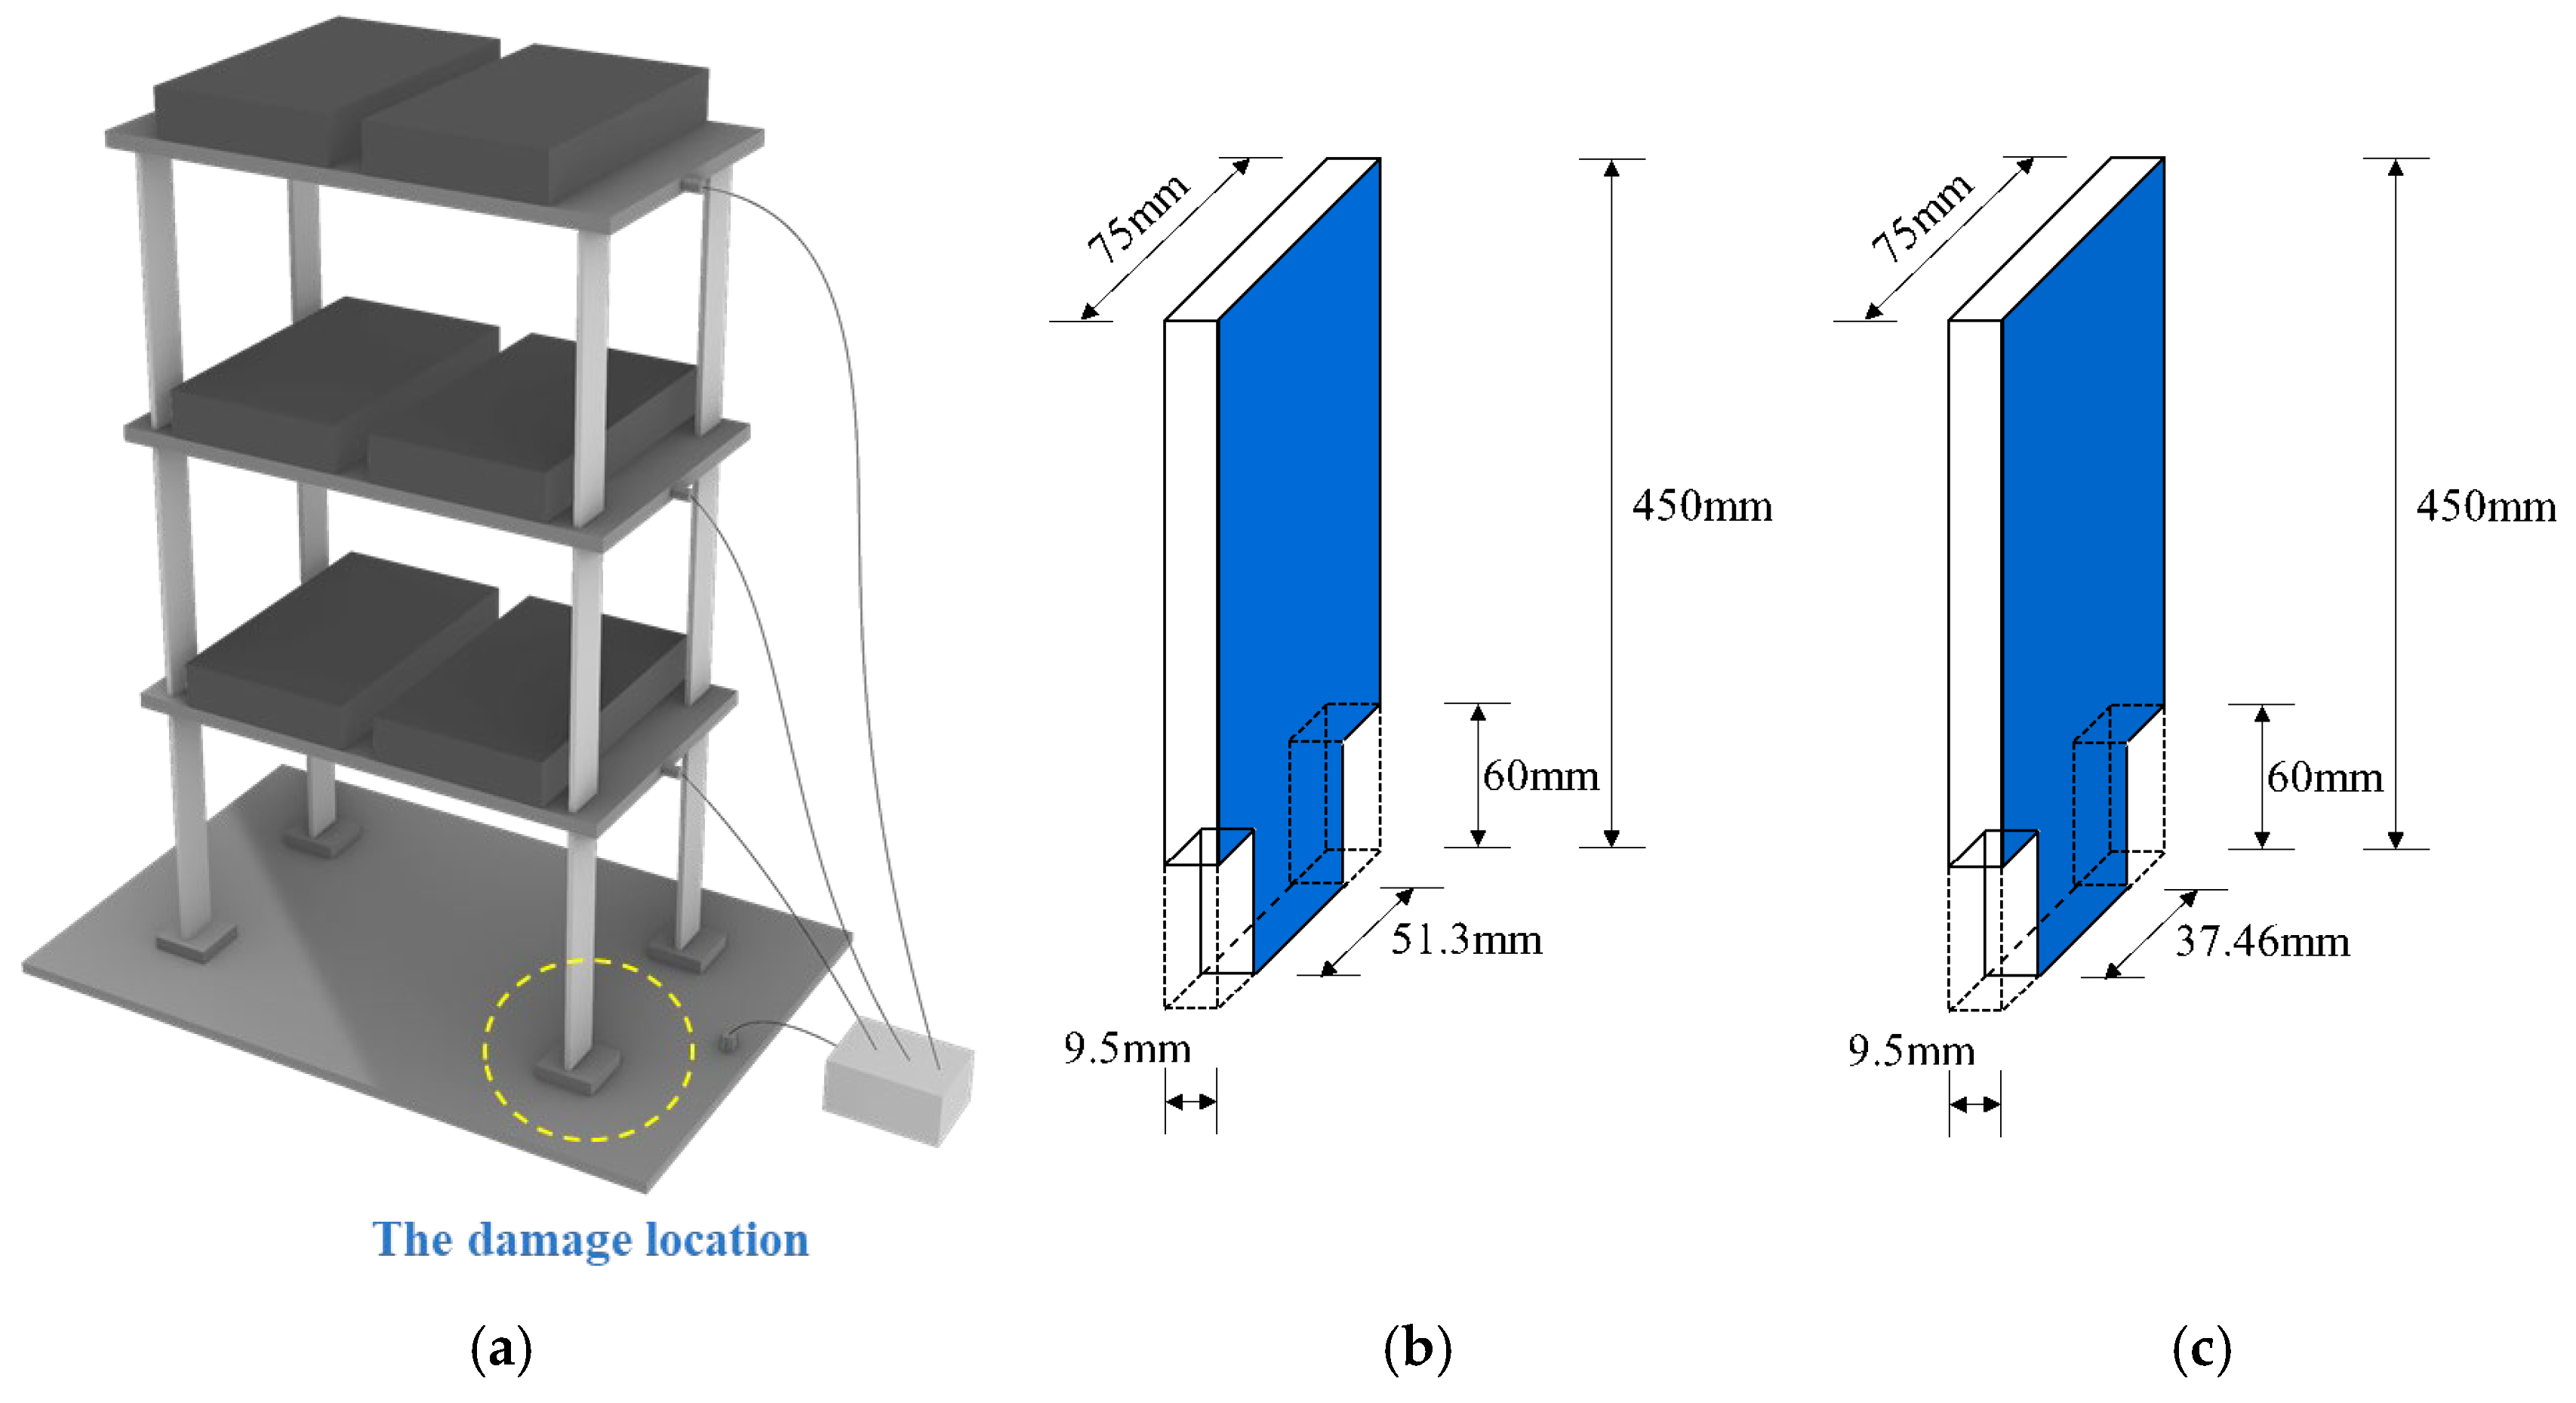
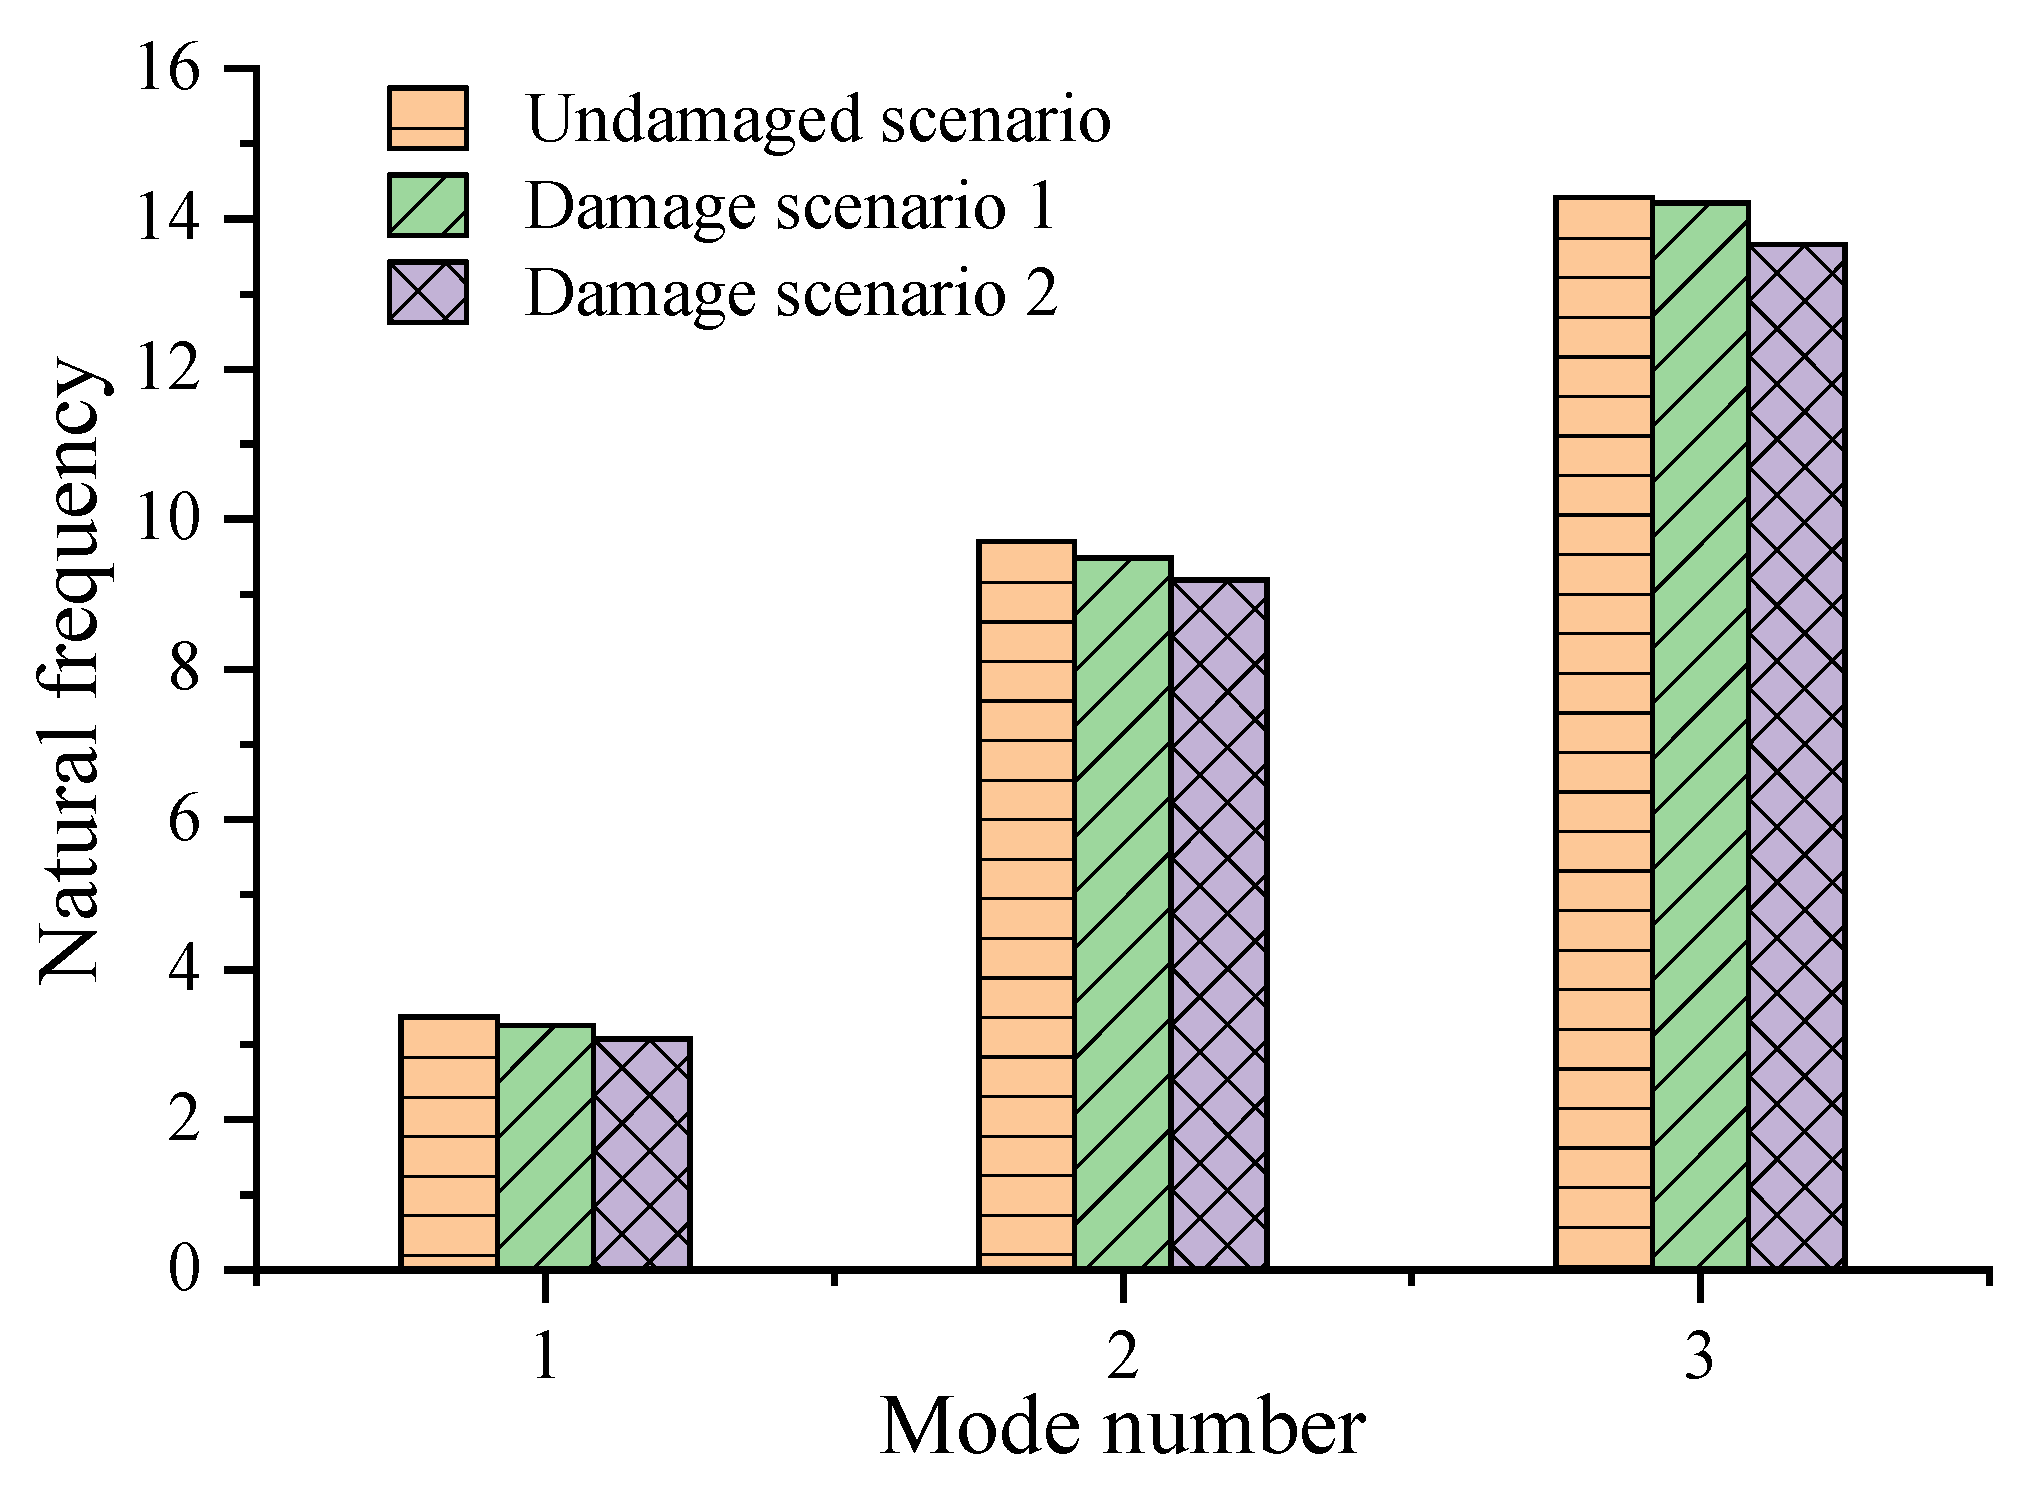
The experimental modal data of a three-story steel frame structure conducted by Li [35] were utilized to further validate the proposed damage assessment technique. The structural dimensions and damage conditions are shown in Figure 24 and can be found in reference [35]. As shown in Figure 24, the main components of the experimental structure are three steel plates and four rectangular columns. The plates and columns are rigidly connected through welding. According to reference [35], the model was mounted on a vibration table and subjected to vibration testing to acquire the dynamic characteristic parameters of the frame model. The vibration table generated white noise with a frequency range of 1 to 30 Hz in the x-direction. The peak acceleration of the excitation was set to 0.05 g with a duration of 180 s. A B&K4370 accelerometer(Brüel & Kjær, Nærum, Denmark) was installed on each floor slab to measure the acceleration in the x-direction. The signal captured by the accelerometer was modulated using a B&K2635 (Brüel & Kjær, Nærum, Denmark) and sampled at 300 Hz. Subsequently, the obtained digital signals were analyzed using the commercial computer software ARTEMIS (Structural Vibration Solutions, Aalborg, Denmark) to determine the natural frequency of the framework model. Structural damage was induced by cutting some of the steel columns on the first and second floors. For damage scenario 1, the cross-sectional width at the bottom of the first-floor columns was reduced from 75 mm to 51.3 mm by cutting the columns. Using the post-cutting cross-sectional dimensions, the story stiffness of the first floor was calculated and compared to the pre-cutting story stiffness. Thus, the extent of damage for damage condition 1 was approximately 11.6 %, obtained by taking the ratio of post-to-pre-cutting story stiffness. For damage scenario 2, the cross-sectional width at the bottom of the first-floor columns was reduced from 75 mm to 37.46 mm, and similarly, the cross-sectional width at the bottom of the second-floor columns was reduced from 75 mm to 37.46 mm. The corresponding damage extents for the first and second floors of damage condition 2 were 21.1% and 11.6%, respectively. Figure 25 presents the experimental frequency data for both undamaged and damaged structures from reference [35].
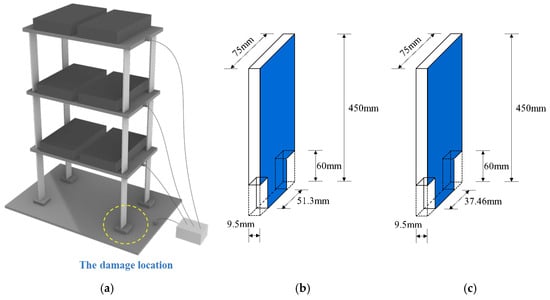
Figure 24.
A shear frame structure. (a) Diagram of the model; (b) first type of notch; (c) second type of notch.
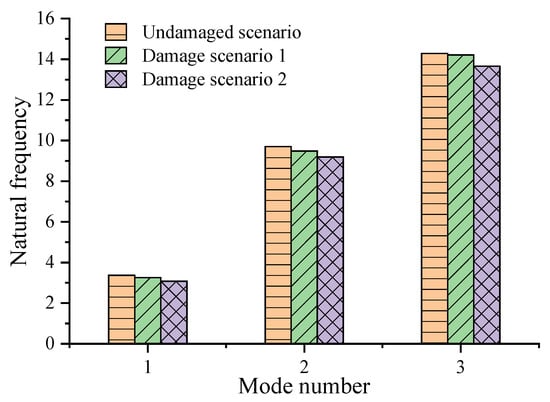
Figure 25.
Vibration frequencies tested for the shear frame structure.
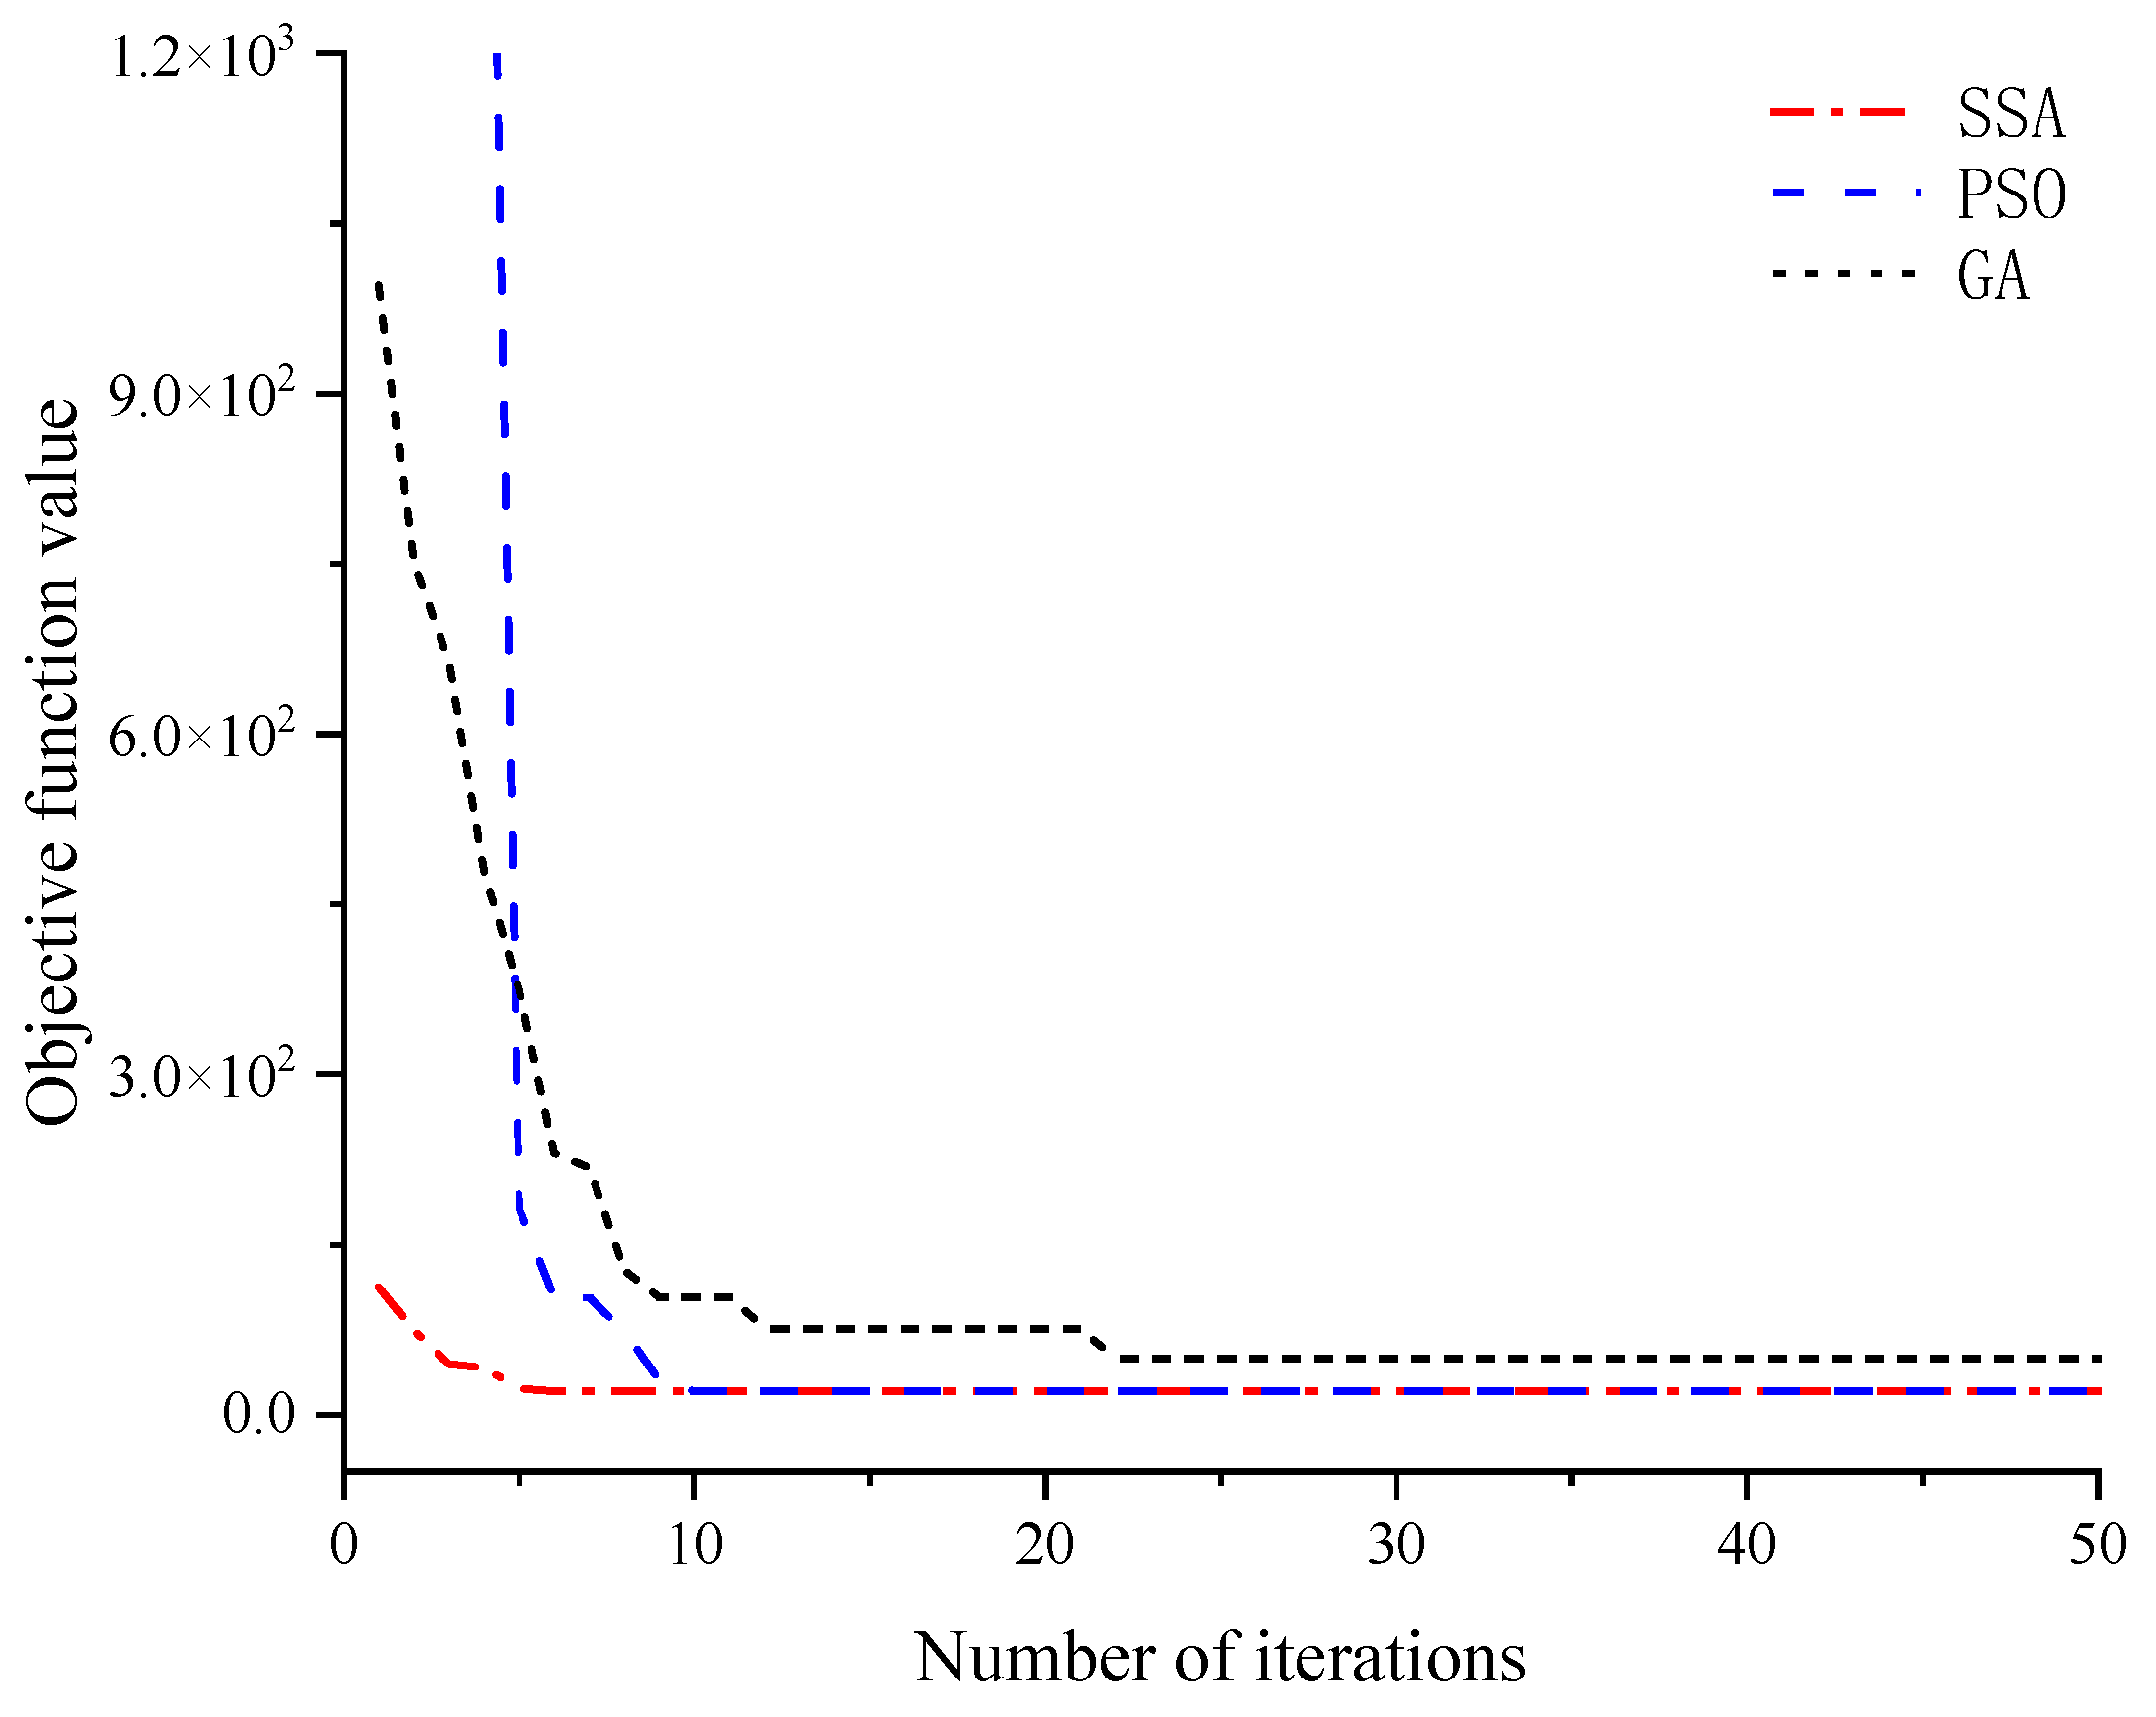
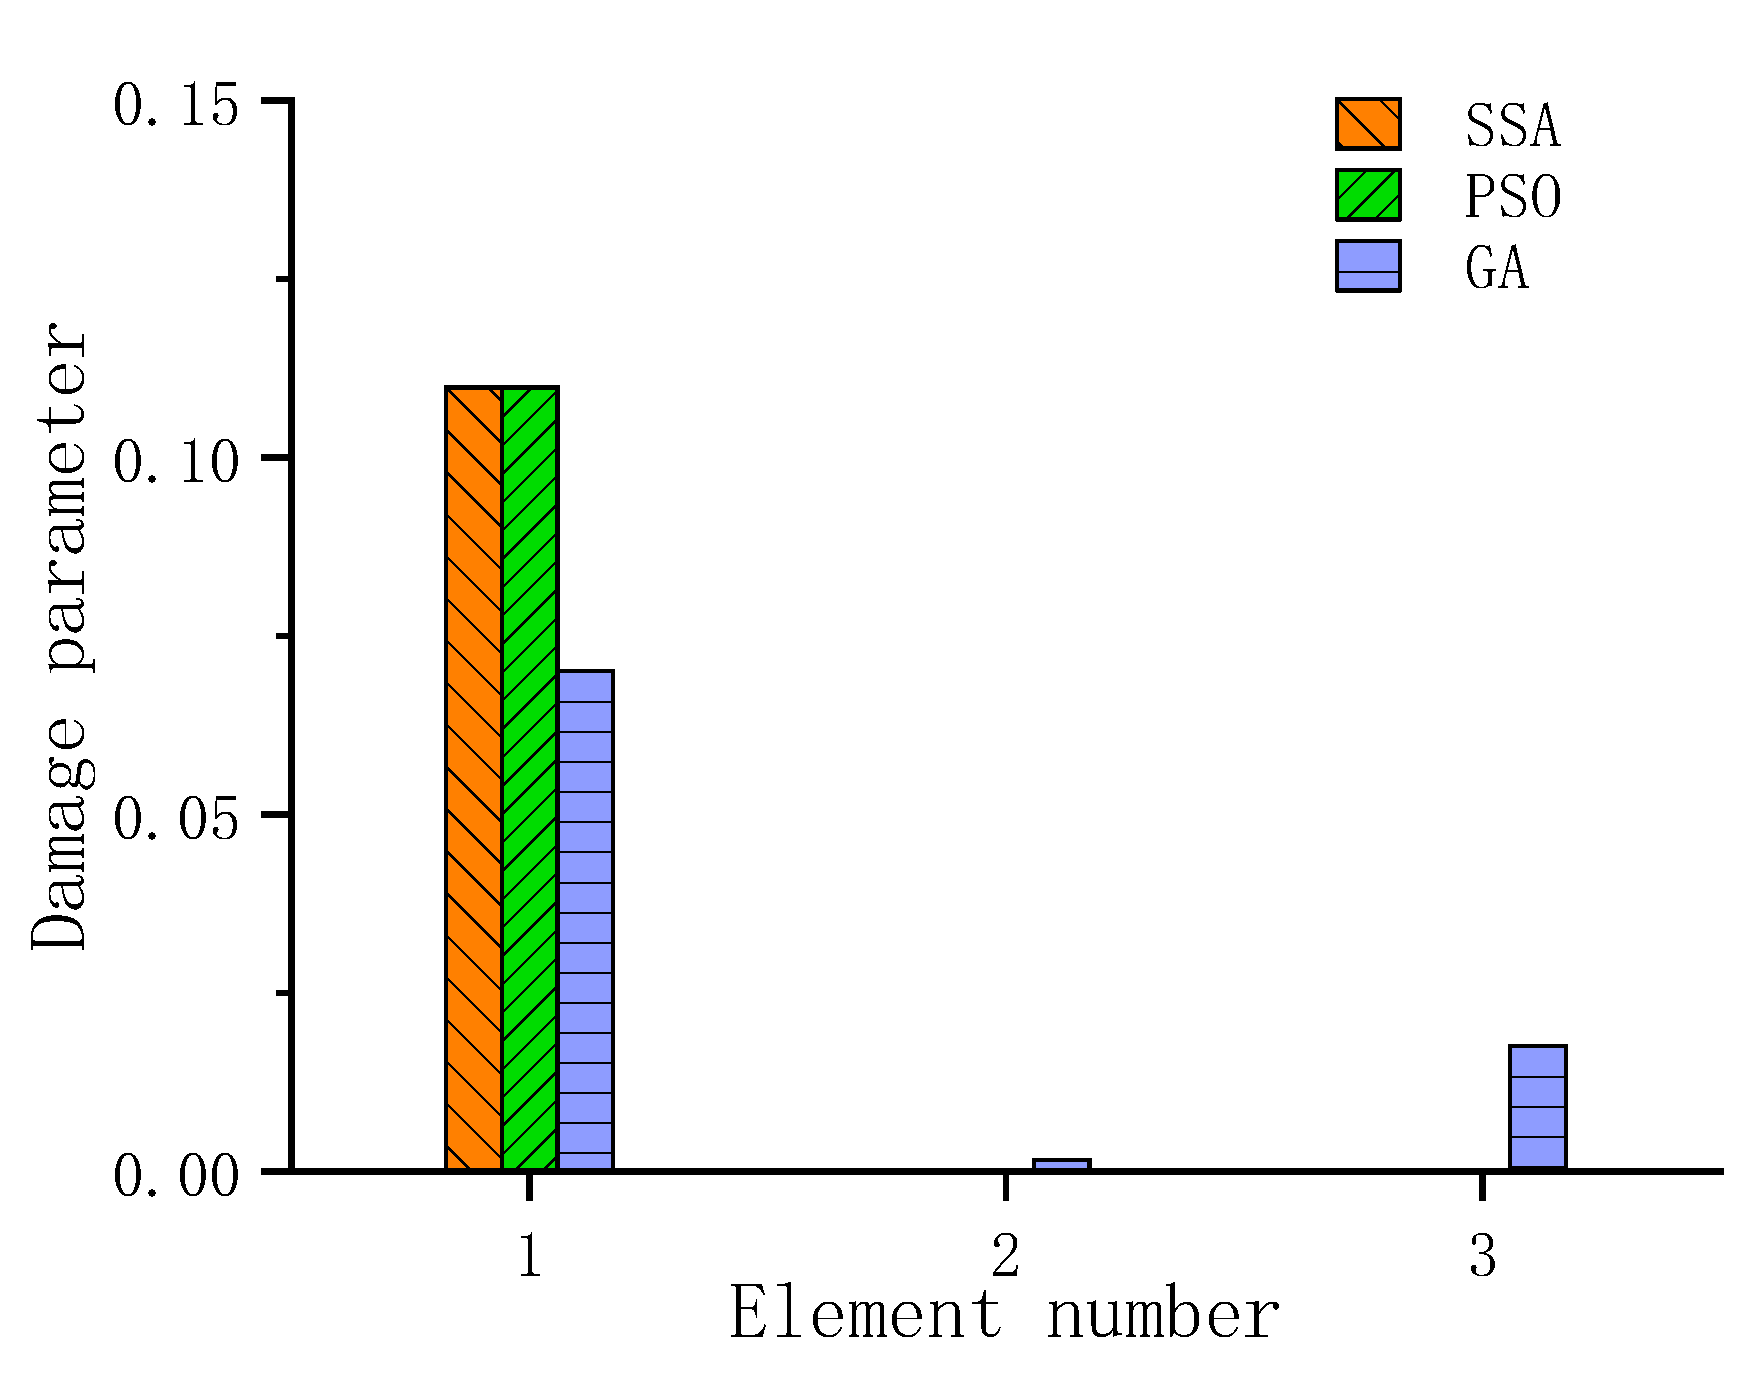
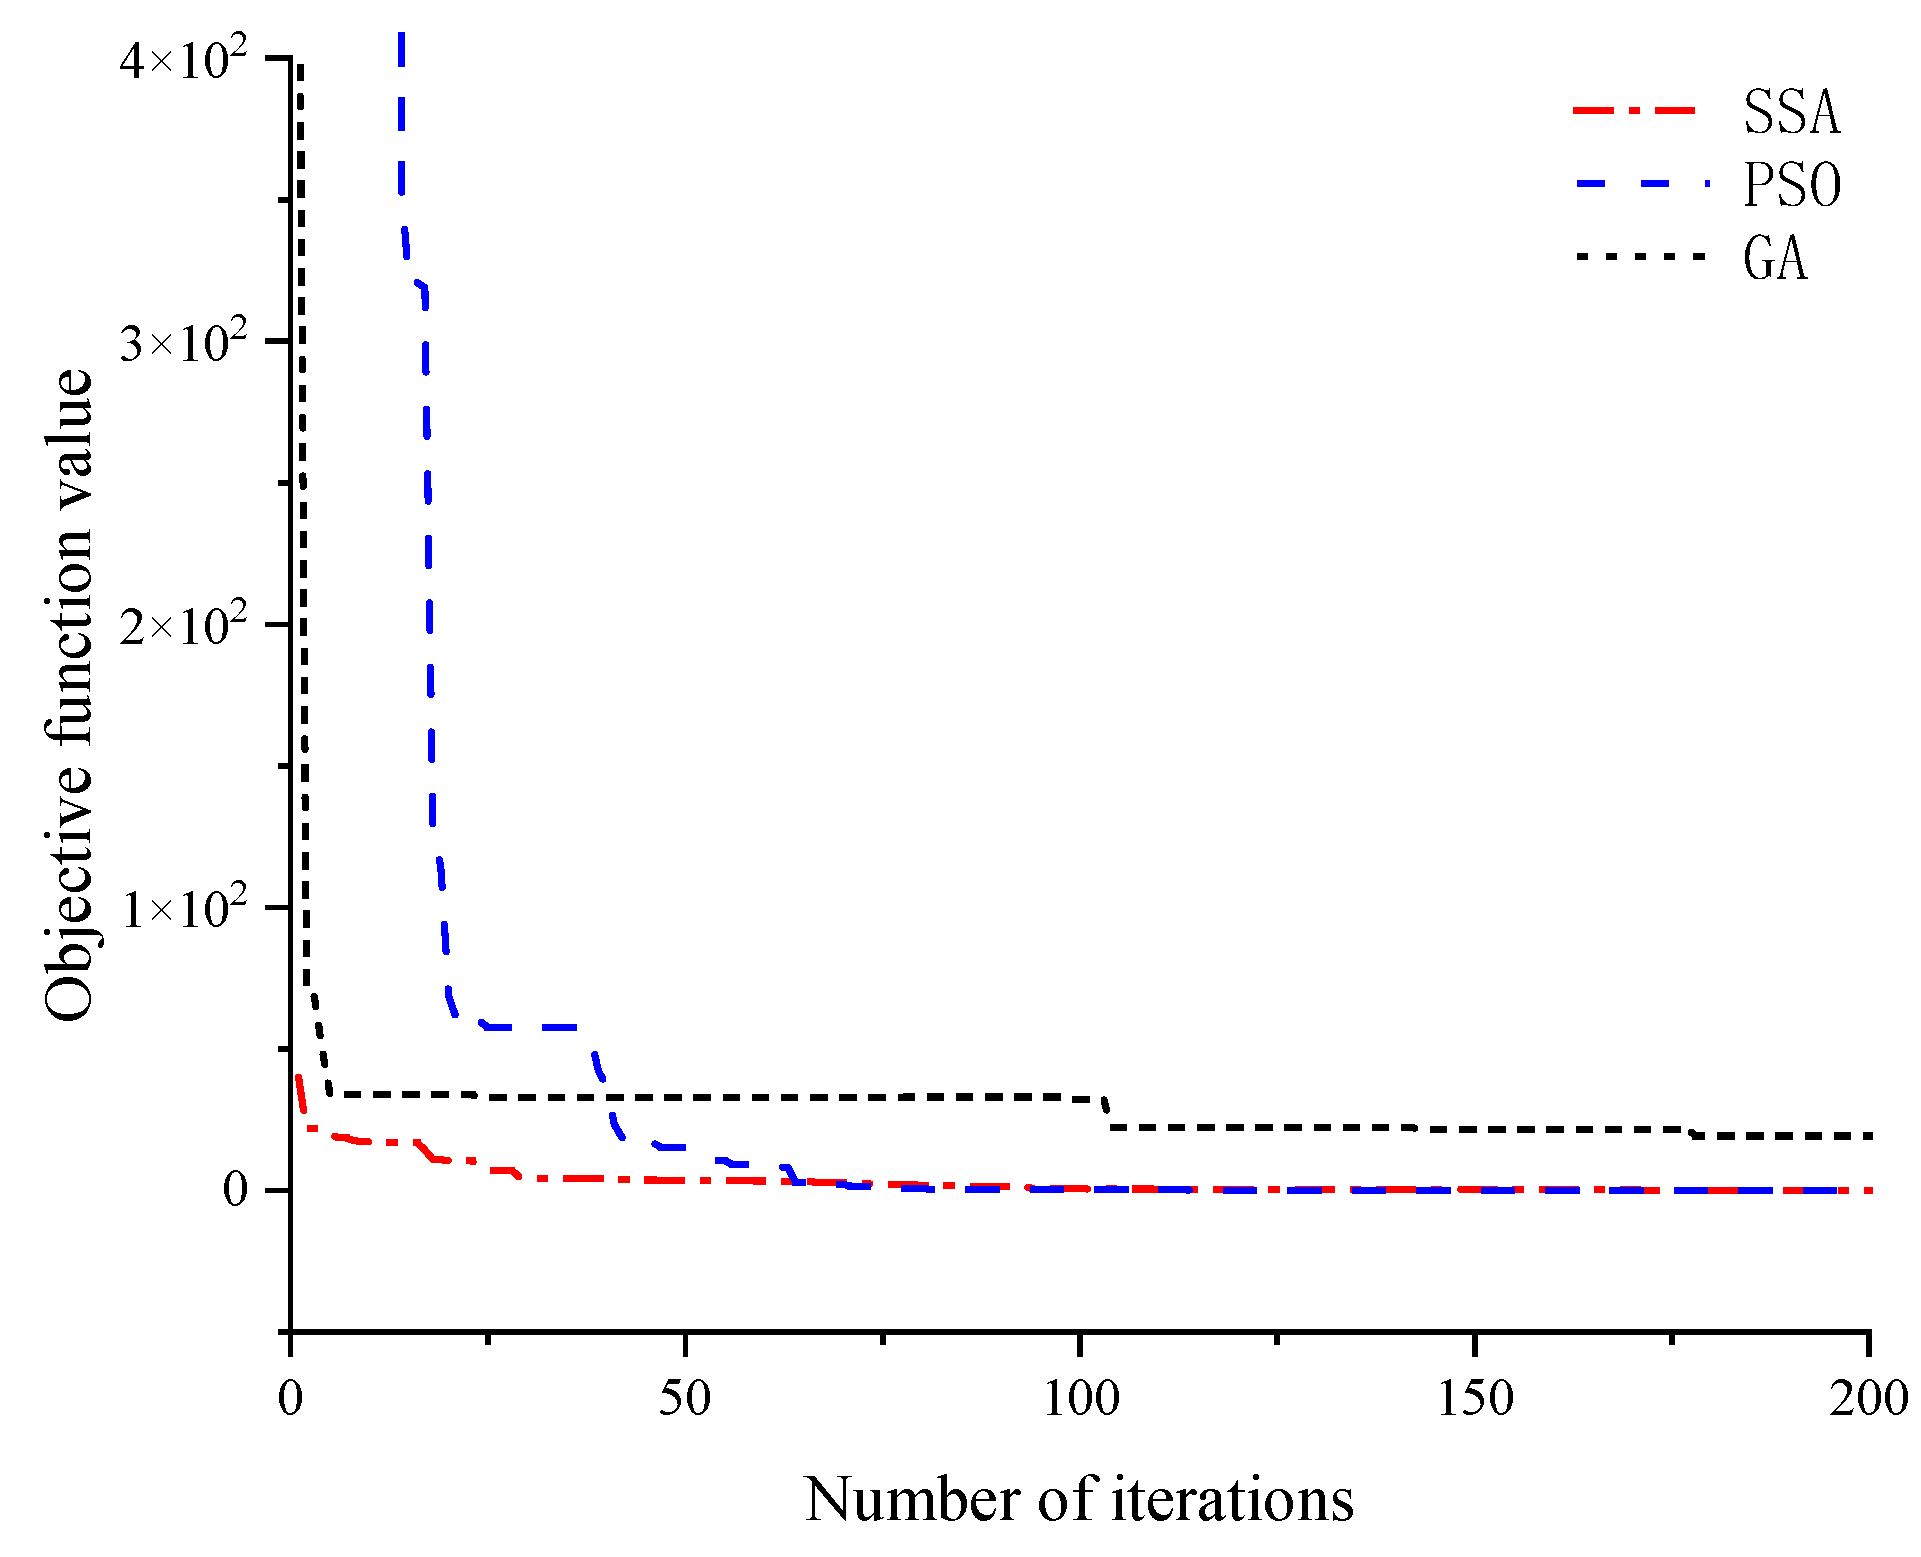
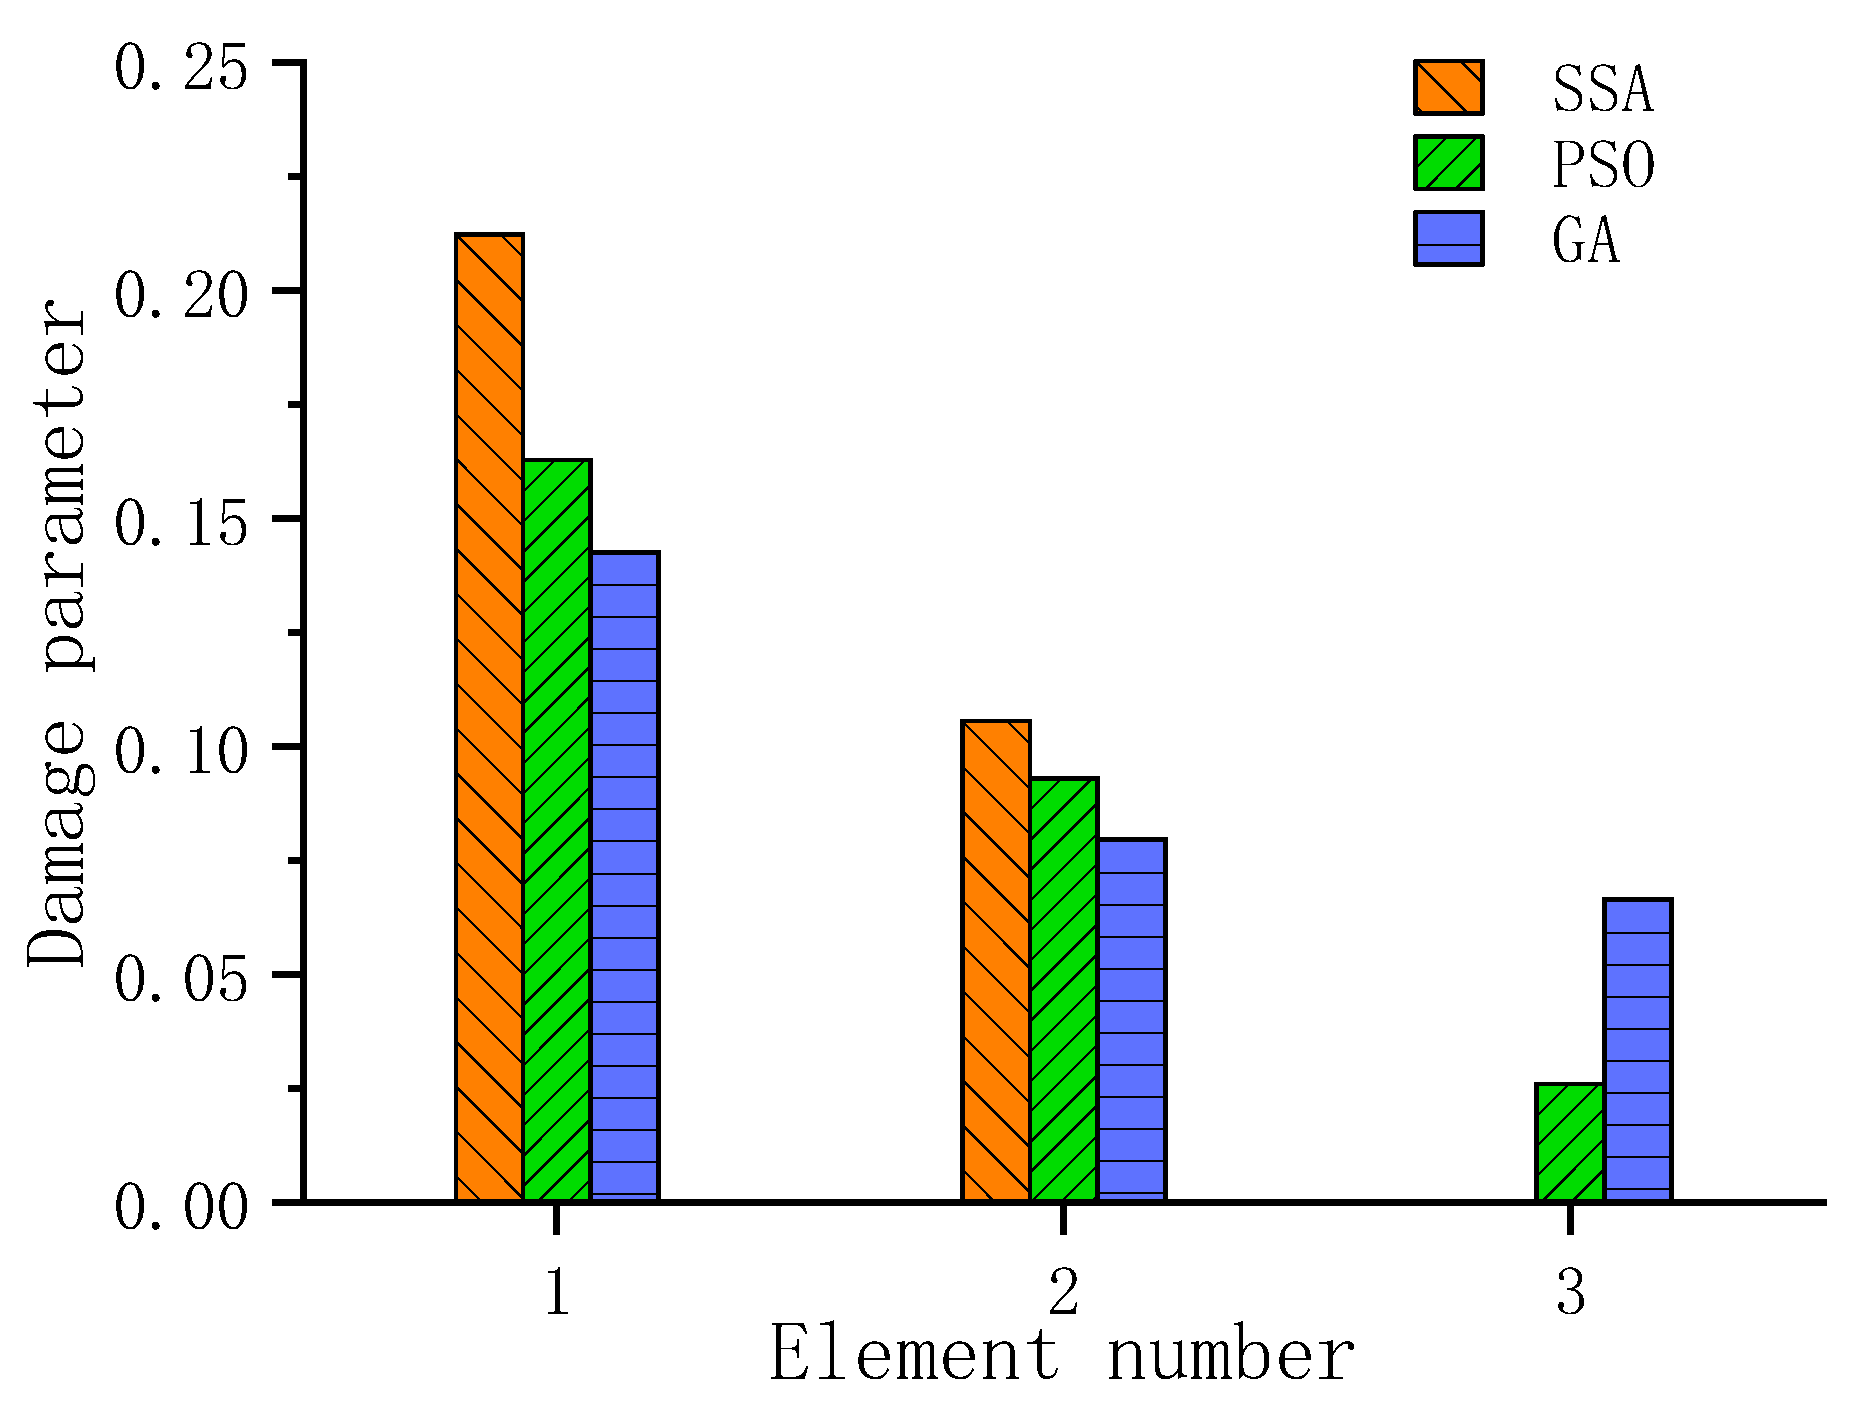
Using the frequency information from the tests, Figure 26 and Figure 27 display the iterative processes and calculated results of PSO, GA, and SSA for damage scenario 1. Figure 28 and Figure 29 present the iterative processes and calculated results of the three algorithms for damage scenario 2. One can observe from Figure 26 and Figure 28 that SSA achieves stable convergence more rapidly than both PSO and GA for the two damage scenarios. As can be seen from Figure 27, for damage scenario 1, the results obtained by SSA and PSO are identical and both outperform the results of GA. The damage degree of the first-floor calculated by both SSA and PSO is 10.98%, with an error of 5.3% compared to the true value of 11.6%. For damage scenario 2, Figure 29 shows that the result obtained by SSA is closer to the true solution than those of PSO and GA. The damage parameter values for the three layers calculated by PSO are 16.8%, 9.3%, and 2.6%, respectively. The values obtained by the GA are 14.3%, 8.0%, and 6.6%, respectively. The values calculated by the SSA are 21.2%, 10.6%, and 0%, respectively. Obviously, the results obtained by the SSA are closest to the true values of 21.1%, 11.6%, and 0%. The corresponding calculation errors of the SSA for the three layers are 0.5%, 8.6%, and 0%, respectively. It has been demonstrated that only the calculation results obtained by the proposed method did not exhibit any significant misjudgments. Table 8 and Table 9 present a comparison of the computational performances of the three algorithms—PSO, GA, and SSA—under two different damage scenarios, respectively. As can be seen from Table 8, for damage scenario 1, the computational accuracy of SSA is the same as that of PSO. Given that their objective function values are very close, the computation time of the SSA is slightly higher than that of the PSO. Both of these algorithms outperform the GA. As can be observed from Table 9, for damage Scenario 2, only SSA achieves a 0% error rate, and its accuracy is notably higher than that of PSO and GA. Although the computation time of SSA is slightly longer than that of PSO, SSA is evidently more suitable than other swarm intelligence optimization algorithms for identifying multiple damages present in a structure.
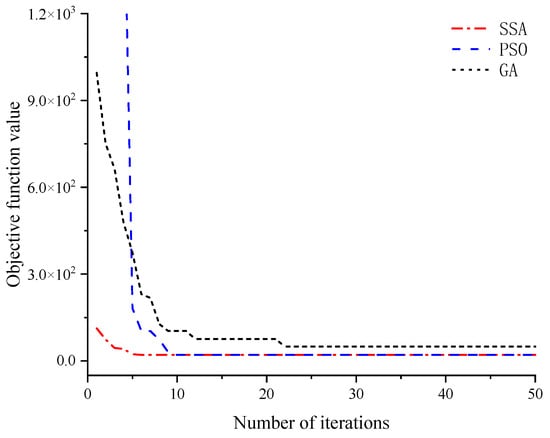
Figure 26.
PSO, GA, and SSA iteration processes for damage scenario 1 of the shear-frame structure.

Figure 27.
PSO, GA, and SSA calculation results for damage scenario 1 of the shear-frame structure.
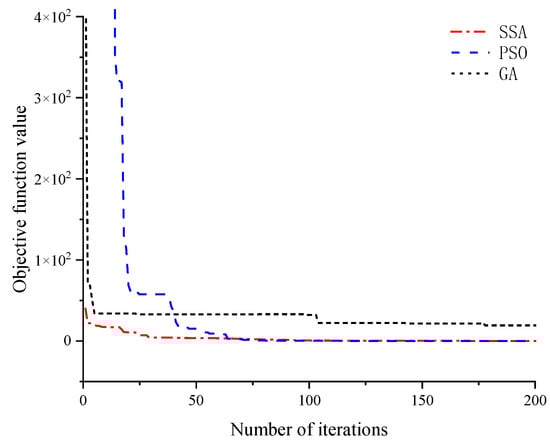
Figure 28.
PSO, GA, and SSA iteration processes for damage scenario 2 of the shear-frame structure.
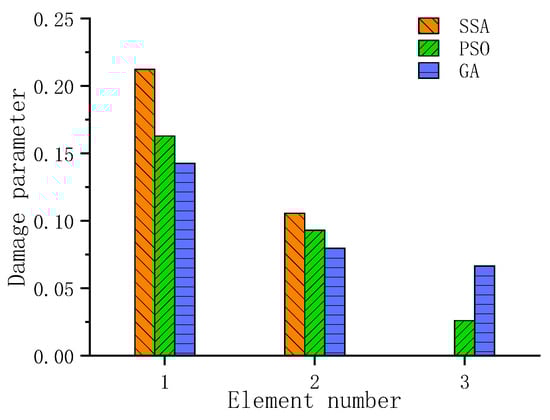
Figure 29.
PSO, GA, and SSA calculation results for damage scenario 2 of the shear-frame structure.
Table 8.
Performance comparison of PSO, GA, and SSA for the experimental frame structure (damage scenario 1).
Table 9.
Performance comparison of PSO, GA, and SSA for the experimental frame structure (damage scenario 2).
5. Conclusions
This work is the first attempt to combine frequency sensitivity with the SSA for structural damage identification. Based on the numerical and experimental case studies, the following conclusions can be drawn.
- (1)
- For the numerical example of a spatial truss structure, the proposed method accurately locates the two damage locations and calculates the damage degrees of the two damaged elements to be 14.6% and 20.5%, respectively (while the actual damage degrees are 15% and 20%). These results are almost identical to the actual damage. The PSO method has a slower convergence speed than the proposed method and produces a significant misjudgment in the calculation results. Although the WOA can also achieve a 0% error rate like the SSA, its recognition accuracy is lower than that of the SSA.
- (2)
- For the numerical example of a plate structure, the proposed method can accurately locate multiple damage locations and precisely assess the degree of damage. The calculated damage degrees obtained by the proposed method are 18.2% and 15% for the two units, respectively, which are very close to the actual values of 20% and 15%. The convergence speed and computational accuracy of the proposed method are superior to those of PSO and WOA.
- (3)
- For the large lattice structure, regardless of whether the data contains noise or not, the objective function values of the SSA after multiple iterations are significantly smaller than those of the PSO and WOA. This indicates that the SSA significantly outperforms the other two algorithms in terms of global convergence performance. In various simulated damage scenarios, only the SSA achieves a 0% error rate across all scenarios, and its recognition accuracy is notably higher than that of the PSO and WOA. It has been demonstrated that the SSA exhibits excellent robustness even in the presence of data noise interference.
- (4)
- For the example of the experimental beam, only the proposed method accurately identified the damage, while the PSO, CS, and GA all exhibited significant misjudgments. In terms of convergence speed, the proposed method requires fewer iterations than the other three methods. In terms of computational accuracy, the damage degree calculated by the proposed method, which is 86.9%, is closest to the actual value of 93.75%, while the errors of the other three methods are relatively large.
- (5)
- For the experimental example of a three-layer steel frame, the proposed method outperforms both the PSO and GA in terms of convergence speed and computational accuracy. In the scenario involving multiple damage locations (damage present on the first and second floors), both the PSO and GA exhibited significant misjudgments, falsely indicating the presence of some degree of damage on the third floor. Only the method proposed in this paper clearly identified that damage was only present in the first and second layers, with the calculated damage parameter values deviating minimally from the actual values.
- (6)
- Compared to existing swarm intelligence optimization algorithms, such as PSO, GA, CS, and WOA, the SSA has a simpler algorithmic structure, superior global search and optimization capabilities, and enhanced robustness. The introduction of the SSA into damage detection can improve the calculation efficiency and resistance to noise interference, with results that are more consistent with the actual degree of damage. For all cases presented in this paper, only the SSA achieved a 0% error rate, and in the vast majority of scenarios, its computational accuracy surpassed that of the other algorithms, particularly in complex situations where multiple damages exist within the structure. The limitation of the SSA is that, in a few simple cases, when the objective function values are similar, the computation time of the SSA is slightly higher than that of the PSO.
- (7)
- In practical applications, the proposed method is effective for various structural damage scenarios, such as material fatigue or corrosion, as long as these damages result in observable frequency changes. However, the method proposed in this paper cannot effectively identify damage scenarios that do not cause significant changes in the vibration frequency, which is a limitation of this approach. Therefore, in future studies, the following research directions can be explored. The first is to combine SSA with mode shape data for multi-parameter detection, in order to address damage detection problems that do not cause significant frequency changes. The second is to validate the proposed method by testing it on nonlinear structures (e.g., cracked beams), thereby refining the theory of damage detection under nonlinear vibrations.
Author Contributions
Conceptualization, Z.M., X.P., Q.Y. and F.Q.; methodology, Z.M. and X.P.; investigation, Q.Y., X.P. and F.Q.; writing—original draft preparation, Z.M., X.P., Q.Y. and F.Q.; project administration, X.P. and B.X.; funding acquisition, B.X. All authors have read and agreed to the published version of the manuscript.
Funding
This work was supported by the Zhejiang Provincial Natural Science Foundation of China (LY24E080010), the Key Projects of Yongjiang Science and Technology Innovation 2035 in Ningbo (2024Z090) and the Major Science and Technology Project of Ningbo High-tech Zone in 2023 (2023CX050001).
Data Availability Statement
The data used to support the findings of this study are included in this study and are also available from the corresponding author upon request.
Conflicts of Interest
Xi Peng and Bin Xu were employed by the company Ningbo Roaby Technology Industrial Group Co., Ltd. The remaining authors declare that the research was conducted in the absence of any commercial or financial relationships that could be construed as potential conflicts of interest. The funders had no role in the collection, analysis, or interpretation of the data or in the decision to publish the results.
References
- Bicanic, N.; Chen, H.P. Damage identification in framed structures using natural frequencies. Int. J. Numer. Methods Eng. 1997, 40, 4451–4468. [Google Scholar]
- Yang, Z.; Wang, L. Structural damage detection by changes in natural frequencies. J. Intell. Mater. Syst. Struct. 2010, 21, 309–319. [Google Scholar]
- Hassiotis, S. Identification of damage using natural frequencies and Markov parameters. Comput. Struct. 2000, 74, 365–373. [Google Scholar] [CrossRef]
- Liu, W.; Ying, H. Research on damage localization method through rate of frequency change. J. Vib. Shock 2004, 23, 30–32+19+126. [Google Scholar]
- Zhong, J.; Dong, C.; Xia, K. Structural damage identification method based on frequency and mode shape parameters. J. Huazhong Univ. Sci. Technol. (Urban Sci. Ed.) 2009, 26, 1–4+9. [Google Scholar]
- Wang, X.; Yang, C.; Wang, L.; Yang, H.; Qiu, Z. Membership-set identification method for structural damage based on measured natural frequencies and static displacements. Struct. Health Monit. 2013, 12, 23–34. [Google Scholar] [CrossRef]
- Kim, J.-T.; Ryu, Y.-S.; Cho, H.-M.; Stubbs, N. Damage identification in beam-type structures: Frequency-based method vs. mode-shape-based method. Eng. Struct. 2003, 25, 57–67. [Google Scholar]
- Liu, W.; Guo, L.; He, H.; Yan, L. Damage identification method for breathing cracked beams based on natural frequencies. China Mech. Eng. 2017, 28, 702–707+713. [Google Scholar]
- Du, S.; Yin, X.; Chen, H. Structural damage identification method based on second-order frequency perturbation. Chin. J. Appl. Mech. 2006, 23, 613–617+699. [Google Scholar]
- Casas, J.R.; Aparicio, A.C. Structural damage identification from dynamic-test data. J. Struct. Eng. 1994, 120, 2437–2450. [Google Scholar]
- Ditommaso, R.; Ponzo, F.C. Automatic evaluation of the fundamental frequency variations and related damping factor of reinforced concrete framed structures using the Short Time Impulse Response Function (STIRF). Eng. Struct. 2015, 82, 104–112. [Google Scholar] [CrossRef]
- Xiang, C.; Shi, H.; Yang, R. Research on bridge damage identification method based on modal frequency strain energy entropy and Tent-SSA-BP neural network. Highway 2023, 68, 143–150. [Google Scholar]
- Ren, Y.; Weng, P. Research on structural damage identification method based on improved Hilbert-Huang transform. J. Vib. Shock 2015, 34, 195–199. [Google Scholar]
- Foti, D.; Gattulli, V.; Potenza, F. Output-only identification and model updating by dynamic testing in unfavorable conditions of a seismically damaged building. Comput.-Aided Civ. Infrastruct. Eng. 2014, 29, 659–675. [Google Scholar]
- Chen, H.; Kurt, M.; Lee, Y.; McFarland, D.M.; Bergman, L.A.; Vakakis, A.F. Experimental system identification of the dynamics of a vibro-impact beam with a view towards structural health monitoring and damage detection. Mech. Syst. Signal Process. 2014, 46, 91–113. [Google Scholar]
- Krishnanunni, C.; Raj, R.S.; Nandan, D.; Midhun, C.K.; Sajith, A.S.; Ameen, M. Sensitivity-based damage detection algorithm for structures using vibration data. J. Civ. Struct. Health Monit. 2019, 9, 137–151. [Google Scholar] [CrossRef]
- Liu, Y. Research on Structural Damage Identification Using Wavelet-Particle Swarm Genetic Optimization Algorithm. Master’s Thesis, Changsha University of Science and Technology, Changsha, China, 2018. [Google Scholar]
- Xie, S.; Wu, B.; Zhao, X.; Zou, M.; Lin, D. Structural damage identification based on improved grey wolf optimization algorithm. Chin. J. Comput. Mech. 2024, 41, 256–262. [Google Scholar]
- Pooya, M.; Reza, M.M.; Beheshti, A.S.B. A Two-Stage Method for Damage Identification in Concrete Gravity Dams by Using a Modal Curvature-Based Index and Pathfinder Algorithm. Arab. J. Sci. Eng. 2023, 49, 5927–5947. [Google Scholar]
- Qin, S.; Su, S.; Yang, R. Structural damage identification based on multi-label convolutional neural networks. J. Build. Sci. Eng. 2024, 41, 108–119. [Google Scholar]
- Chen, Z.; Wang, W.; Liu, Q.; Wu, J. Two-stage beam-like structure damage identification based on hybrid PSO algorithm and damage probability mean. Chin. J. Comput. Mech. 2024, 41, 525–533. [Google Scholar]
- Begambre, O.; Laier, J.E. A hybrid Particle Swarm Optimization–Simplex algorithm (PSOS) for structural damage identification. Adv. Eng. Softw. 2009, 40, 883–891. [Google Scholar]
- Huang, M.; Cheng, X.; Lei, Y. Structural damage identification based on substructure method and improved whale optimization algorithm. J. Civ. Struct. Health Monit. 2021, 11, 351–380. [Google Scholar]
- Zenzen, R.; Belaidi, I.; Khatir, S.; Wahab, M.A. A damage identification technique for beam-like and truss structures based on FRF and Bat Algorithm. C. R. Méc. 2018, 346, 1253–1266. [Google Scholar]
- Zhang, P.; Ma, T. Application research on improved BP neural network in damage identification of concrete bridges. Constr. Mach. 2024, 44, 122–129. [Google Scholar]
- Hao, H.; Xia, Y. Vibration-based damage detection of structures by genetic algorithm. J. Comput. Civ. Eng. 2002, 16, 222–229. [Google Scholar] [CrossRef]
- Xiong, C.; Lian, S. Structural damage identification based on improved fruit fly optimization algorithm. KSCE J. Civ. Eng. 2021, 25, 985–1007. [Google Scholar]
- Li, J.; Yu, L.; Qi, T.; Chen, Y. Structural Damage Identification Based on Quadratic Optimization of Objective Functions with Modal Residual Force and Weighting Strategy. J. Aerosp. Eng. 2024, 37, 04023089. [Google Scholar]
- Xue, J.; Shen, B. A novel swarm intelligence optimization approach: Sparrow search algorithm. Syst. Sci. Control Eng. 2020, 8, 22–34. [Google Scholar]
- Peng, X.; Yang, Q. A fast analysis algorithm for structural vibration modal sensitivity. Structures 2024, 64, 106623. [Google Scholar]
- Shi, Z.Y.; Law, S.S.; Zhang, L.M. Damage localization by directly using incomplete mode shapes. J. Eng. Mech. 2000, 126, 656–660. [Google Scholar]
- Impollonia, N.; Muscolino, G. Interval analysis of structures with uncertain-but-bounded axial stiffness. Comput. Methods Appl. Mech. Eng. 2011, 200, 1945–1962. [Google Scholar] [CrossRef]
- Yang, Q.; Peng, X. Dynamic Modal Reanalysis Using Flexibility Disassembly Perturbation Method. AIAA J. 2024, 62, 3474–3490. [Google Scholar] [CrossRef]
- Yang, J.C.S.; Tsai, T.; Pevlin, V.; Chen, J.; Tsai, W.H. Structural damage detection by the system identification technique. Shock Vib. Inf. Cent. Shock Vib. Bull. 1985, 55, 57–65. [Google Scholar]
- Li, L. Numerical and Experimental Studies of Damage Detection for Shear Buildings. Ph.D. Thesis, Huazhong University of Science and Technology, Wuhan, China, 2005. [Google Scholar]


Disclaimer/Publisher’s Note: The statements, opinions and data contained in all publications are solely those of the individual author(s) and contributor(s) and not of MDPI and/or the editor(s). MDPI and/or the editor(s) disclaim responsibility for any injury to people or property resulting from any ideas, methods, instructions or products referred to in the content. |
© 2025 by the authors. Licensee MDPI, Basel, Switzerland. This article is an open access article distributed under the terms and conditions of the Creative Commons Attribution (CC BY) license (https://creativecommons.org/licenses/by/4.0/).