
Vulnerability Assessment of Reinforced Concrete Piers Under Vehicle Collision Considering the Influence of Uncertainty

Abstract
1. Introduction
2. Vulnerability Assessment of RC Piers Under Vehicle Collision
2.1. Vulnerability Relationship
2.2. Limit State Definition
2.3. Monte Carlo Method to Account for Uncertainties
3. Numerical Modeling and Validation
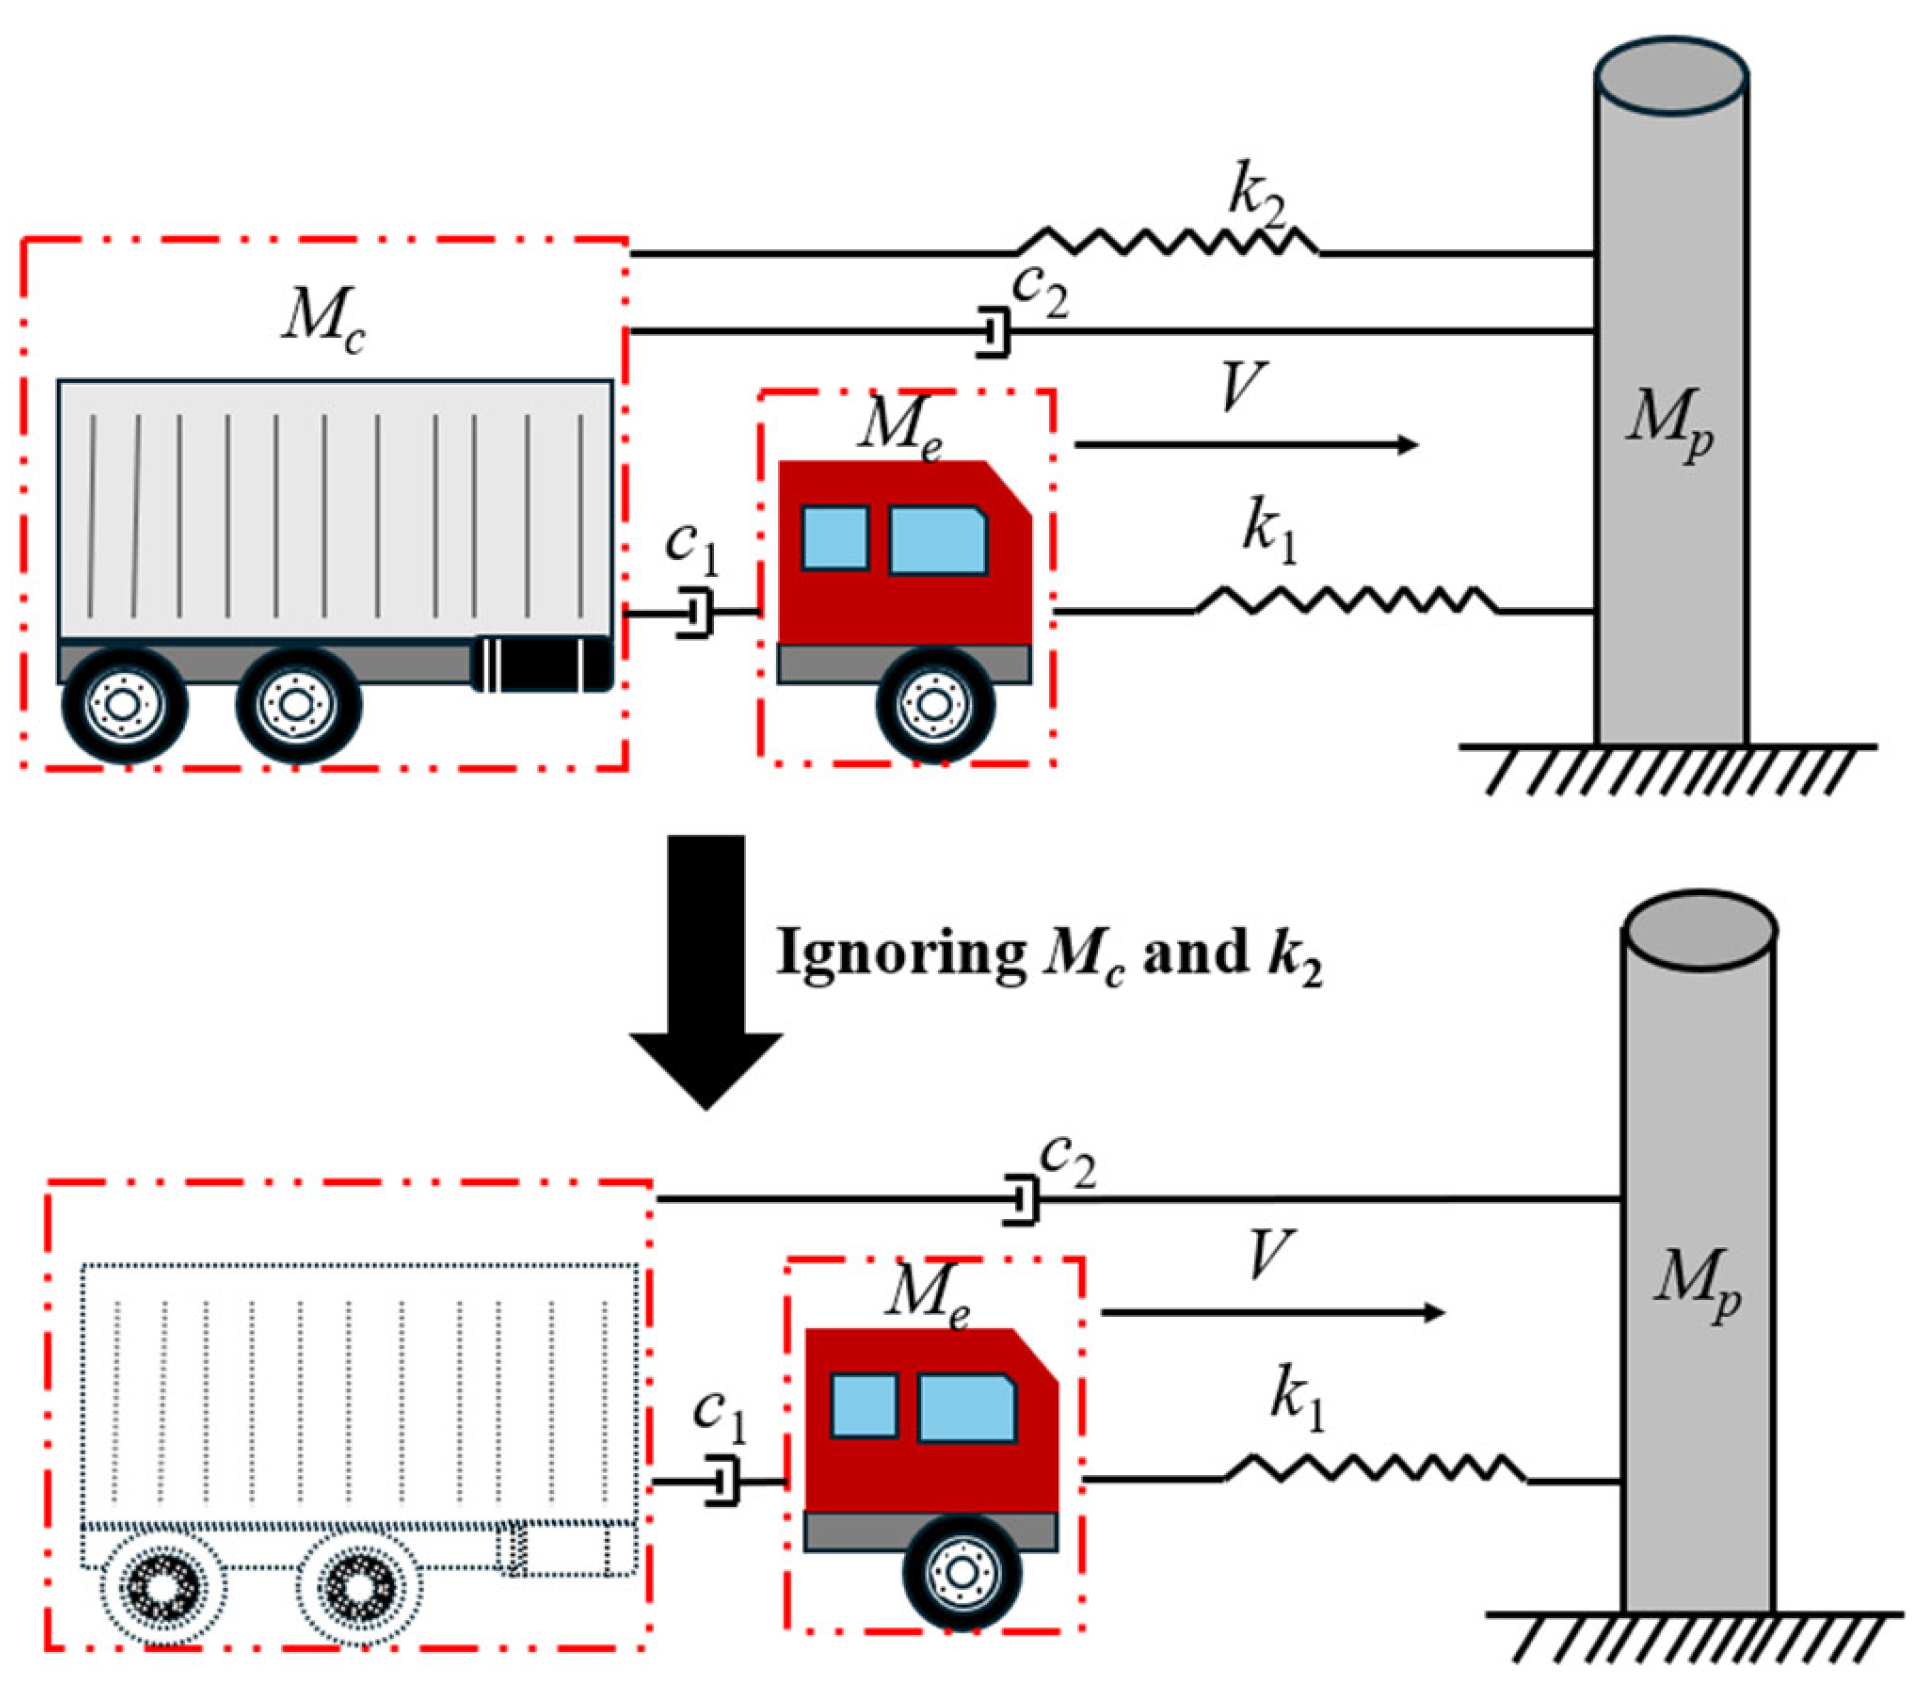
3.1. Vehicle-with-Pier Collision Analysis Model
3.2. Vehicle Model
3.3. Pier Model
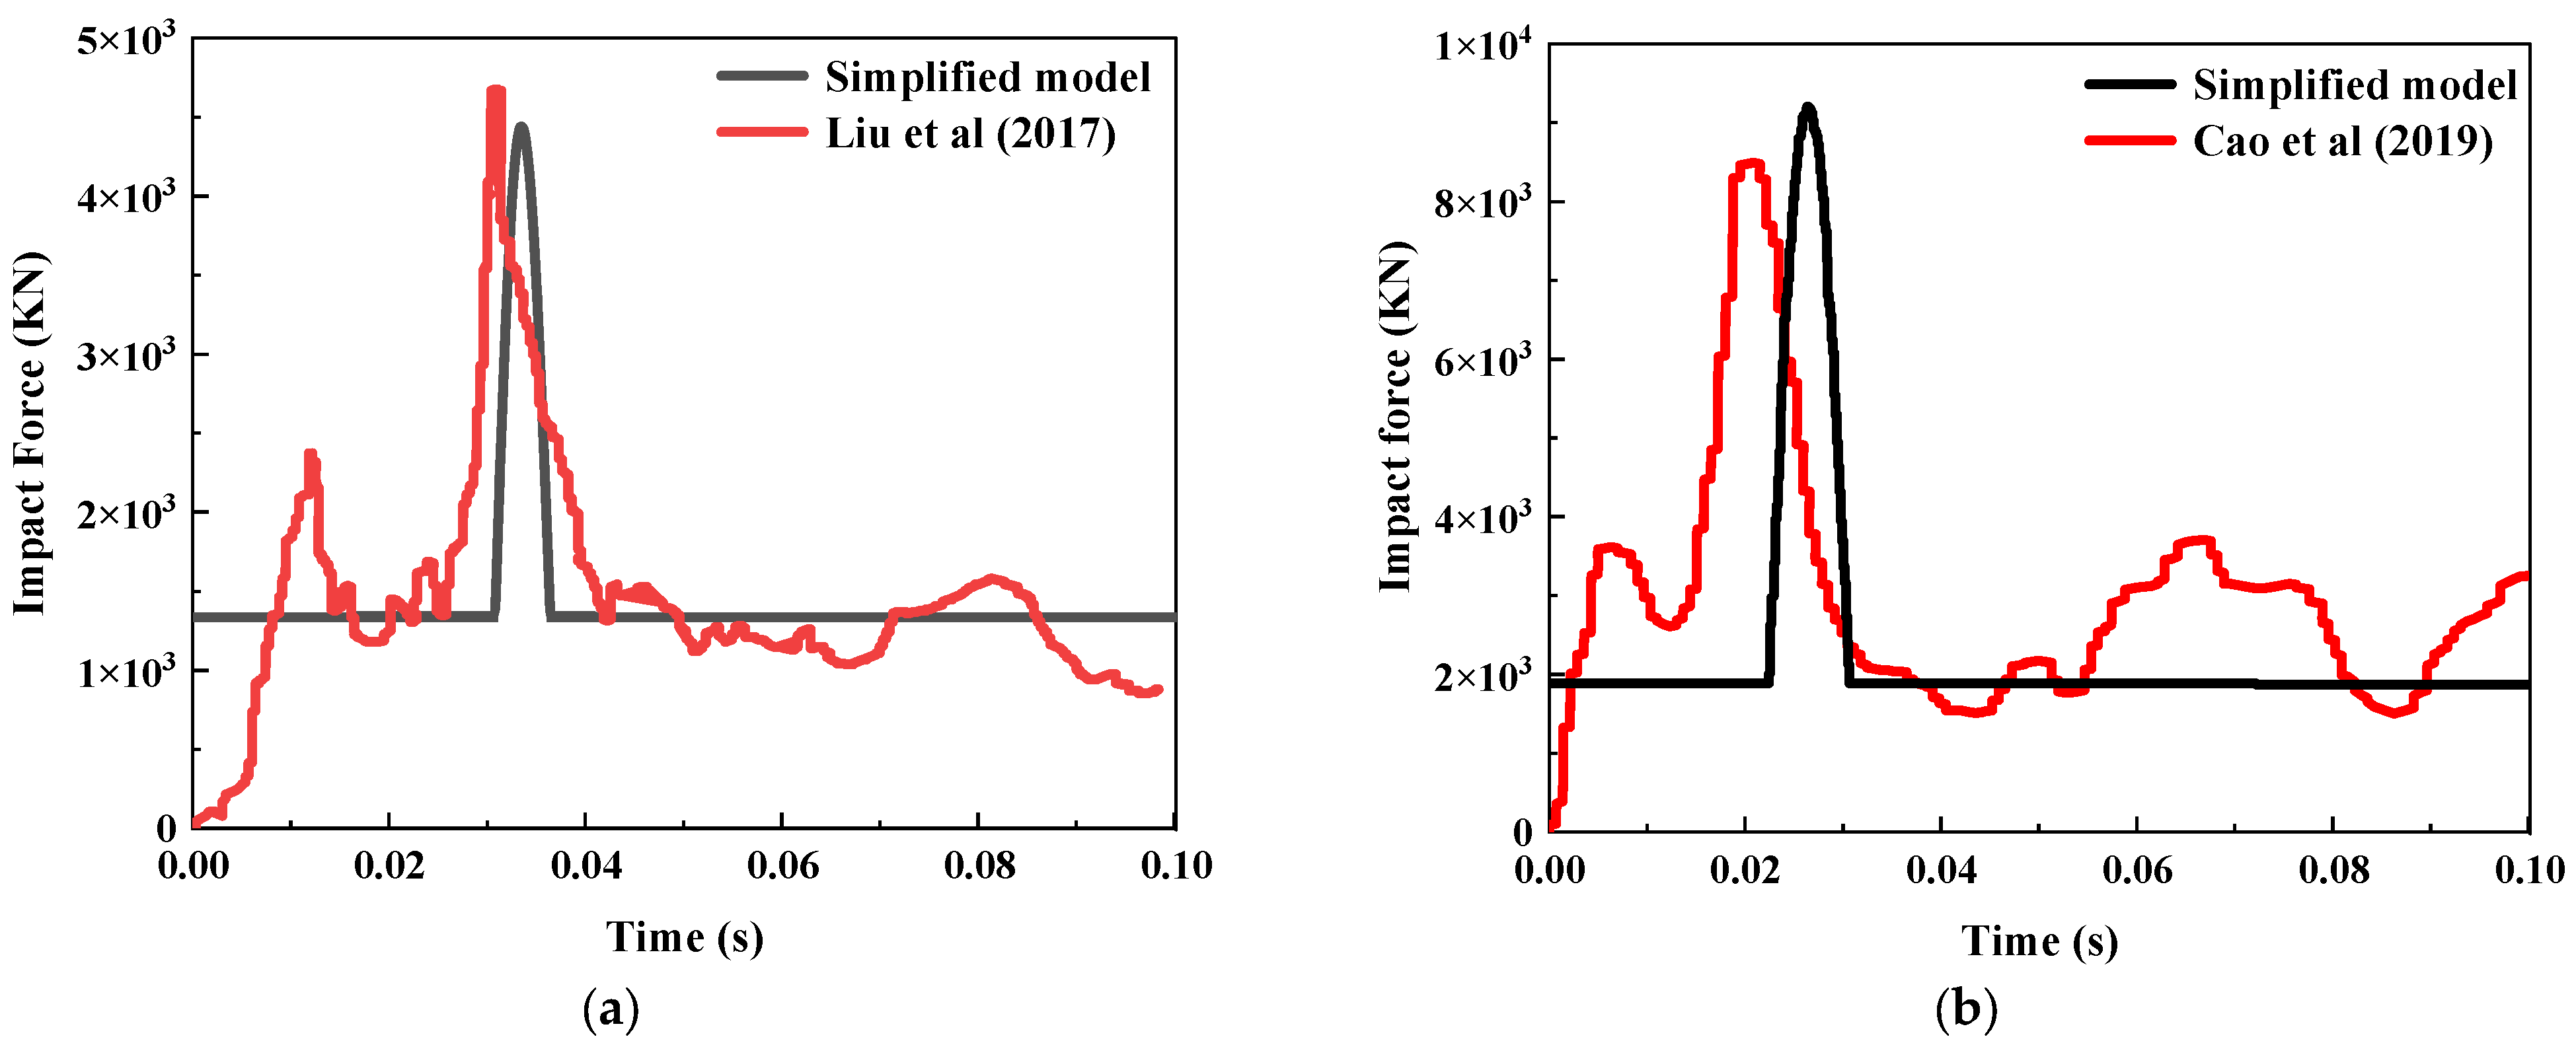
3.4. Model Validation
4. Uncertainty and Sensitivity Analysis for Vehicle-with-Pier Collision Response
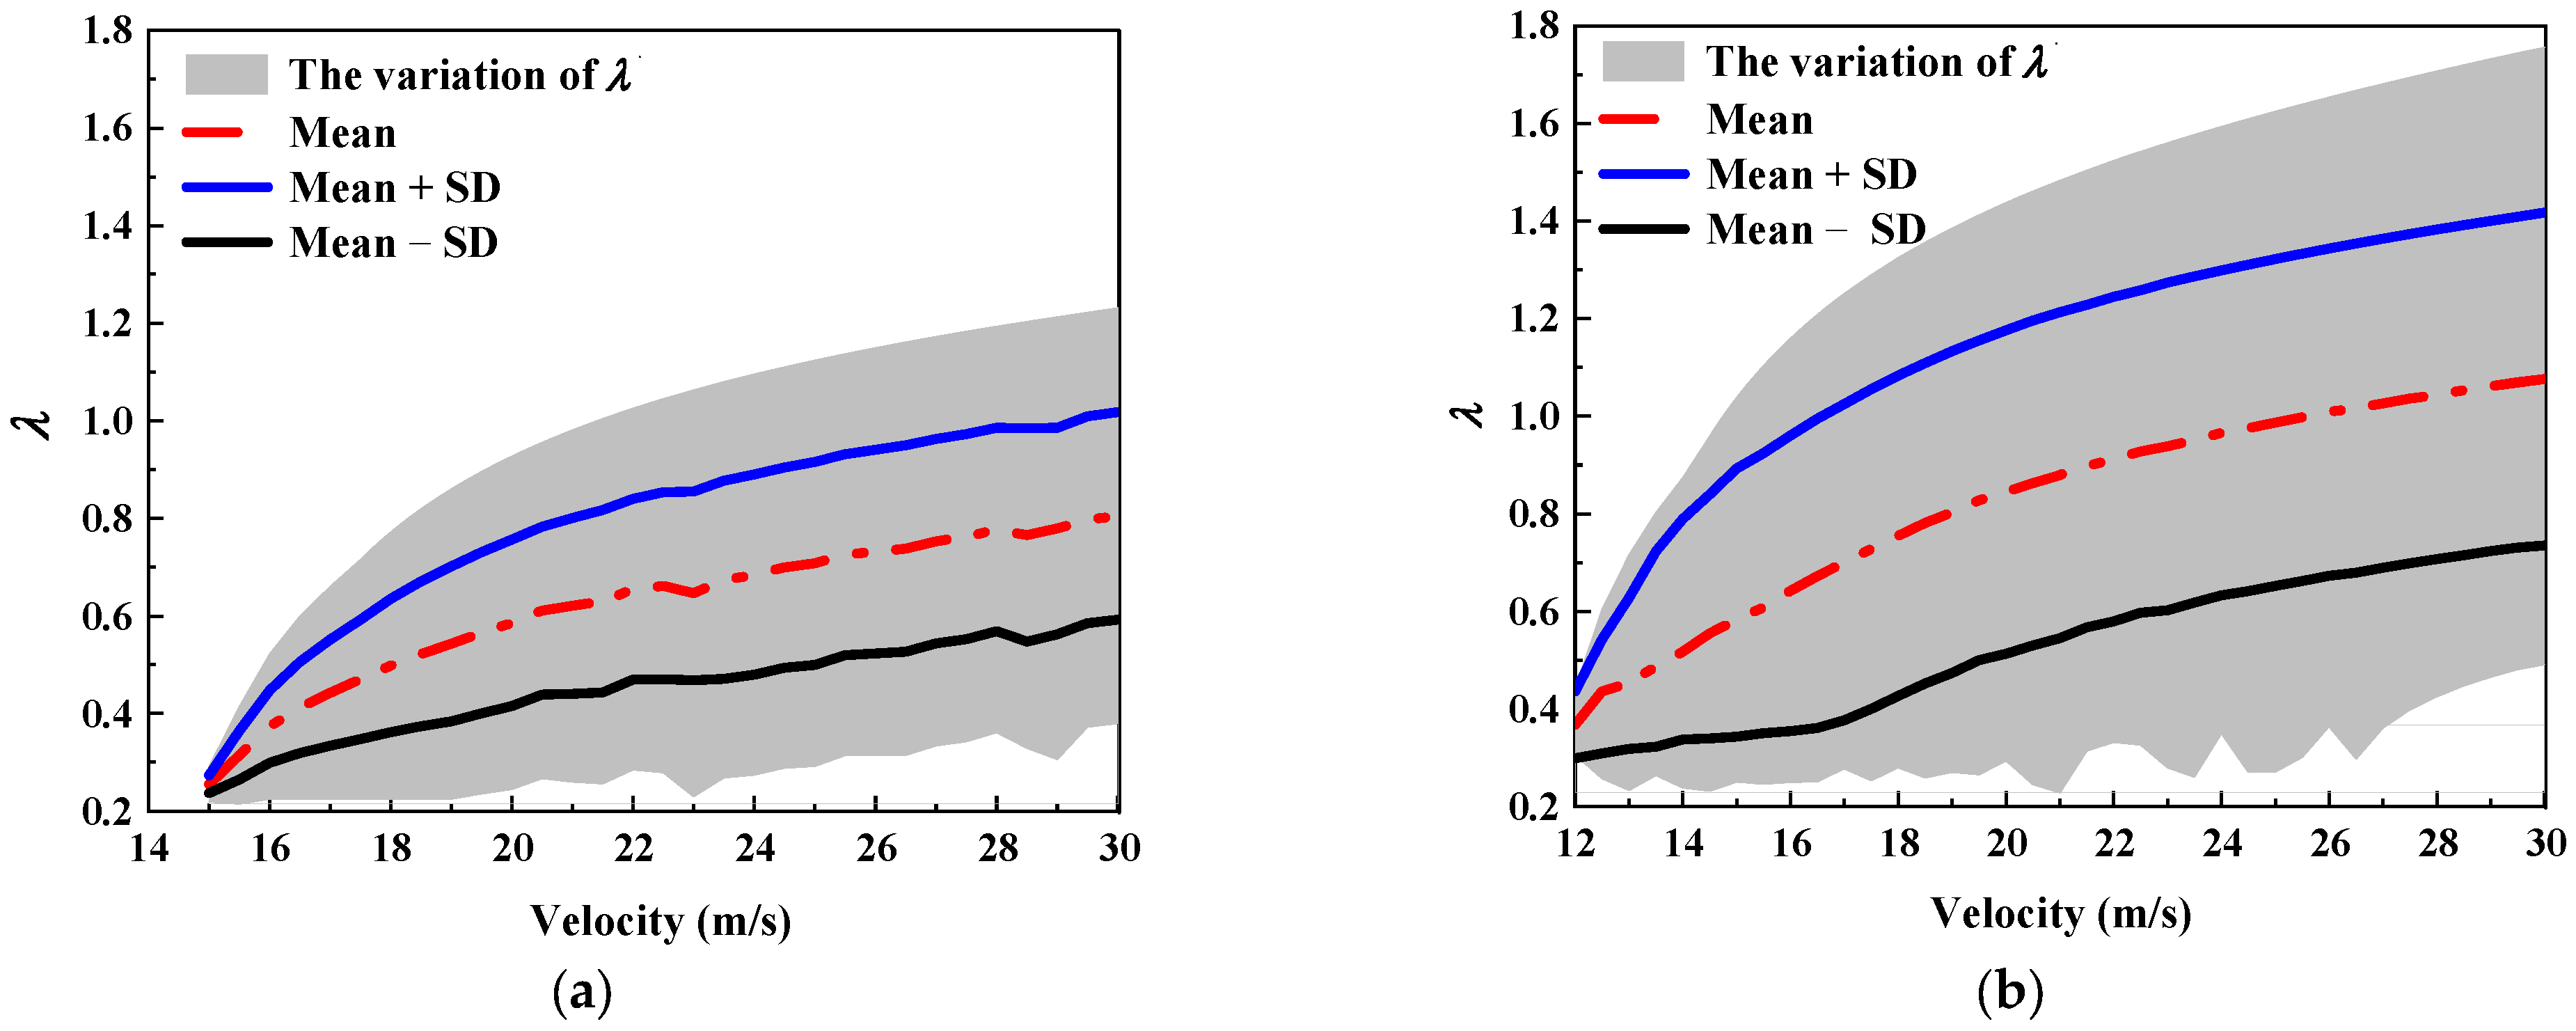
4.1. Uncertainty Analysis
4.2. Sensitivity Analysis
5. Vulnerability Analysis Considering Uncertainty Parameters
5.1. Influence of Vehicle Type
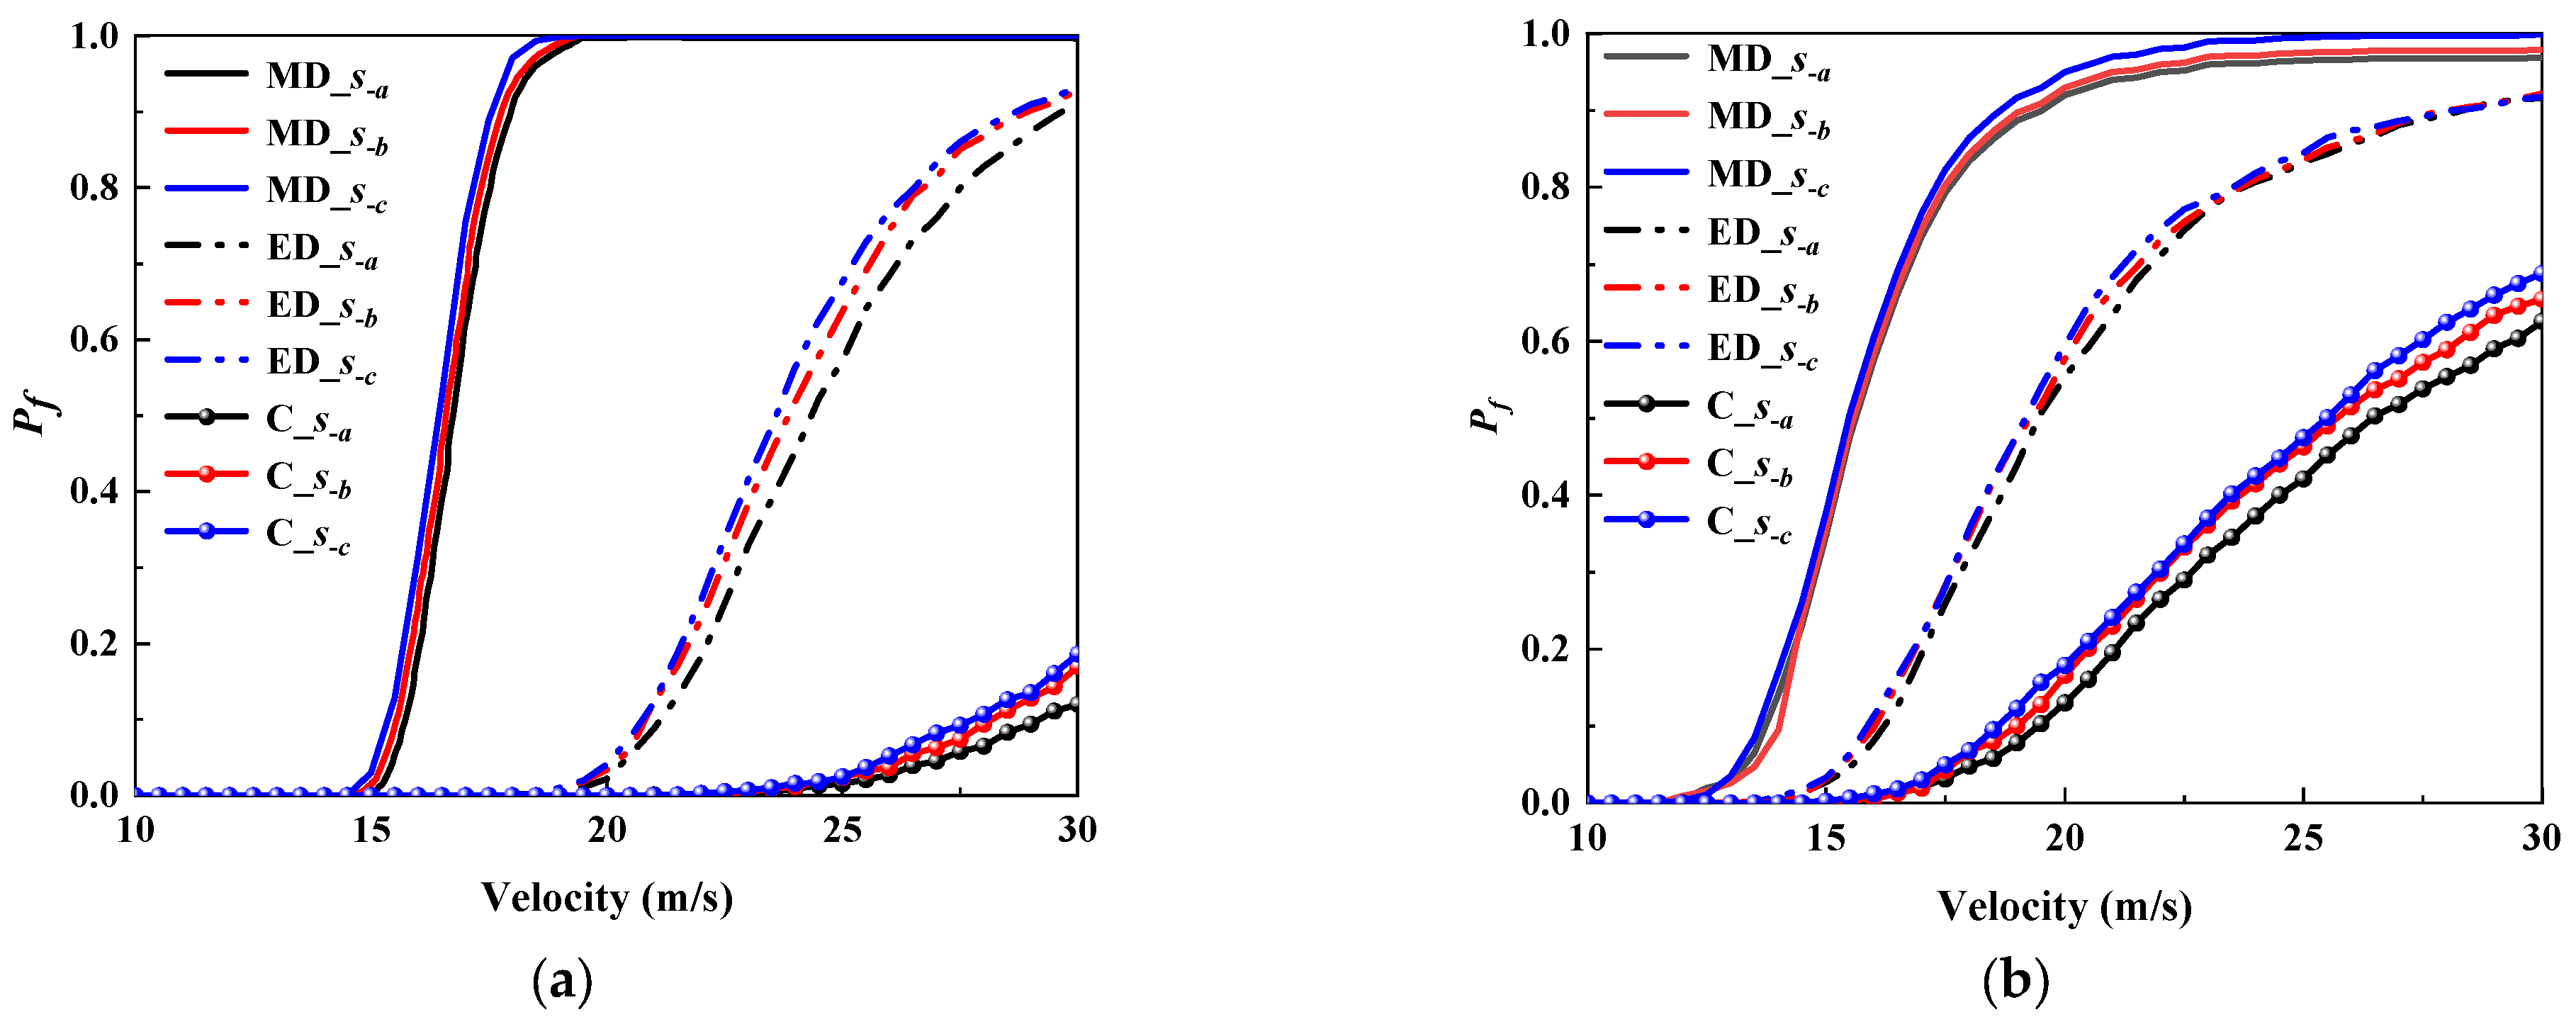
5.2. Influence of Structural Design Parameters
5.3. Influence of Vehicle Parameters
6. Conclusions
- (1)
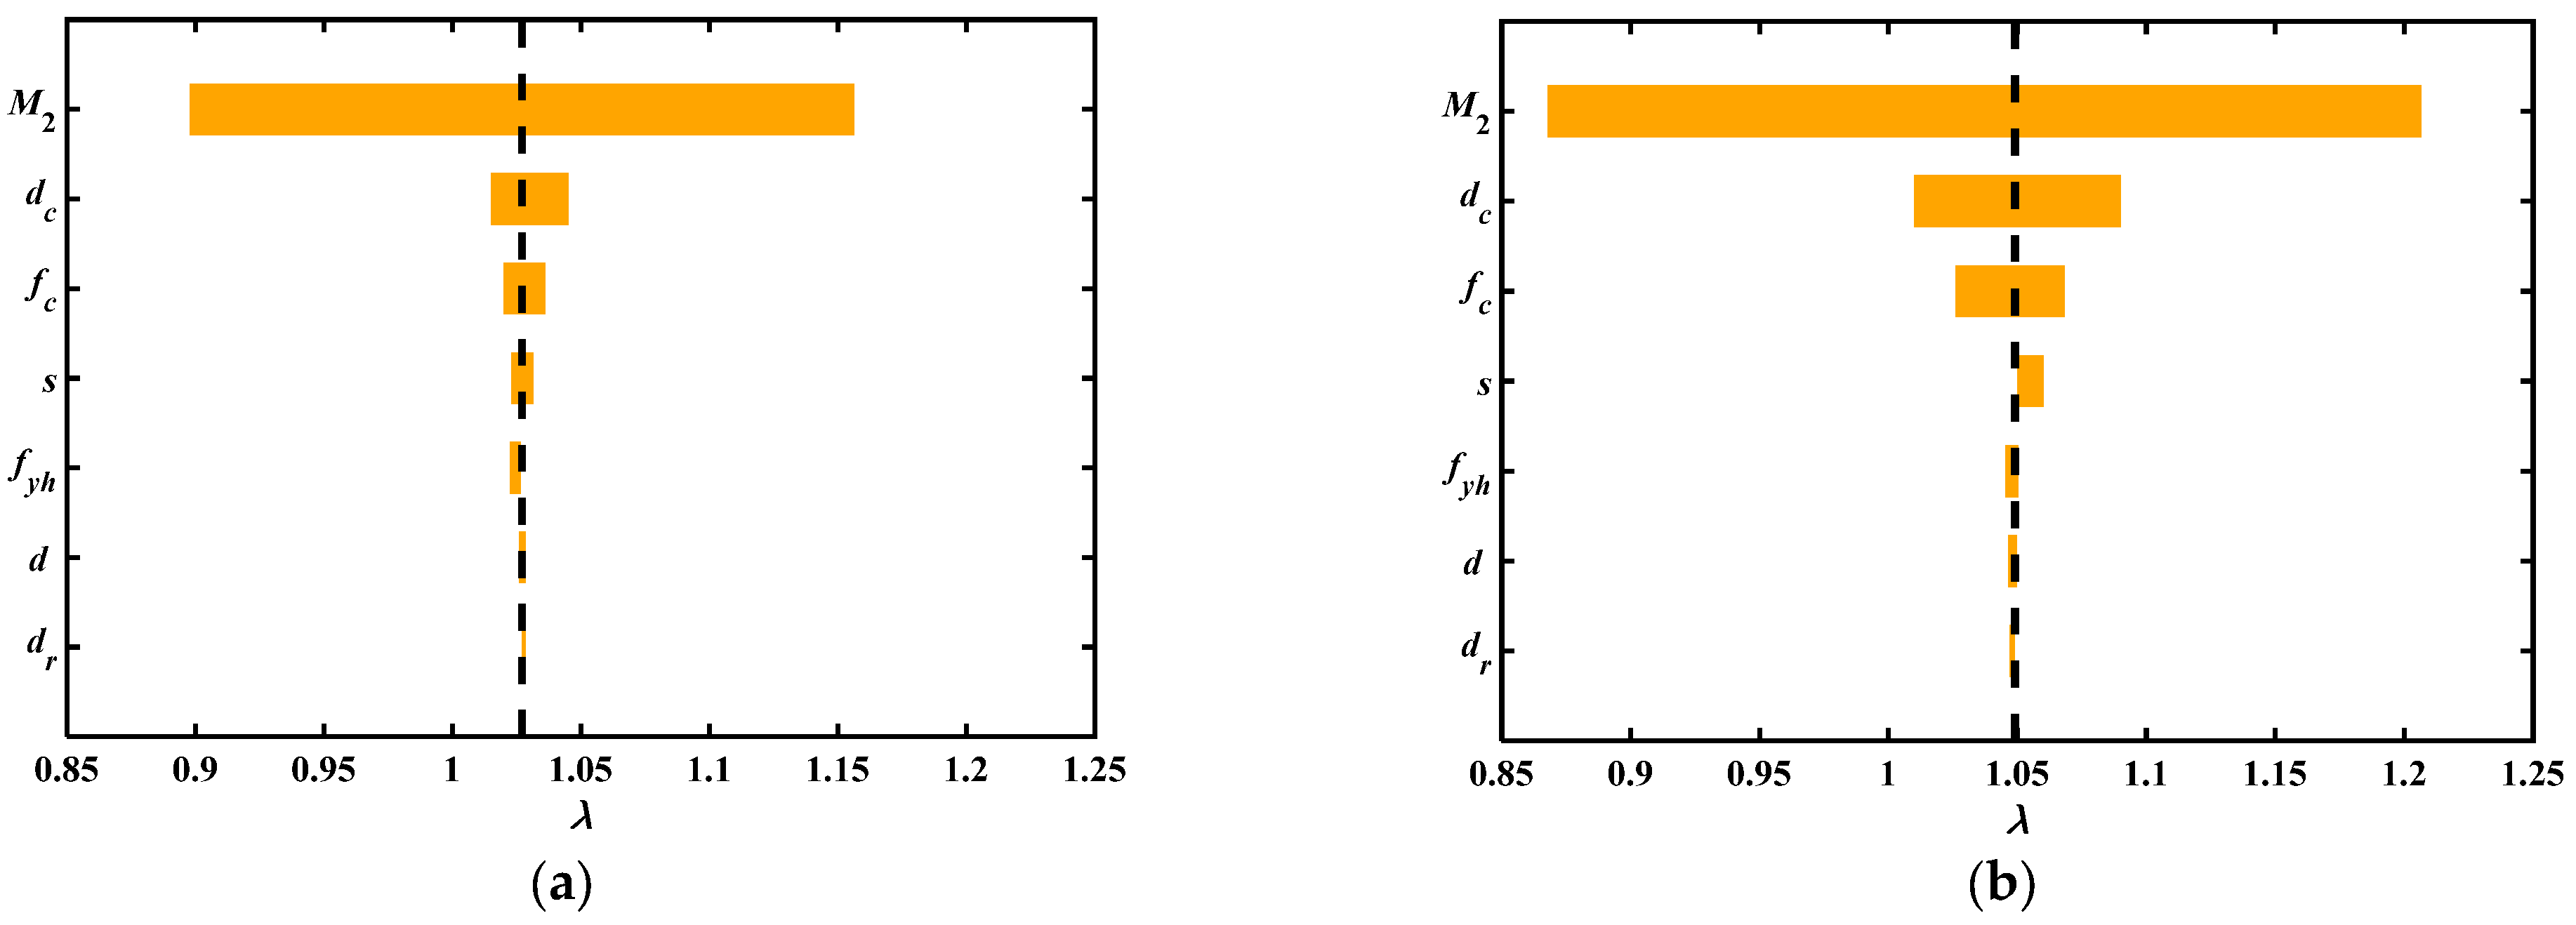
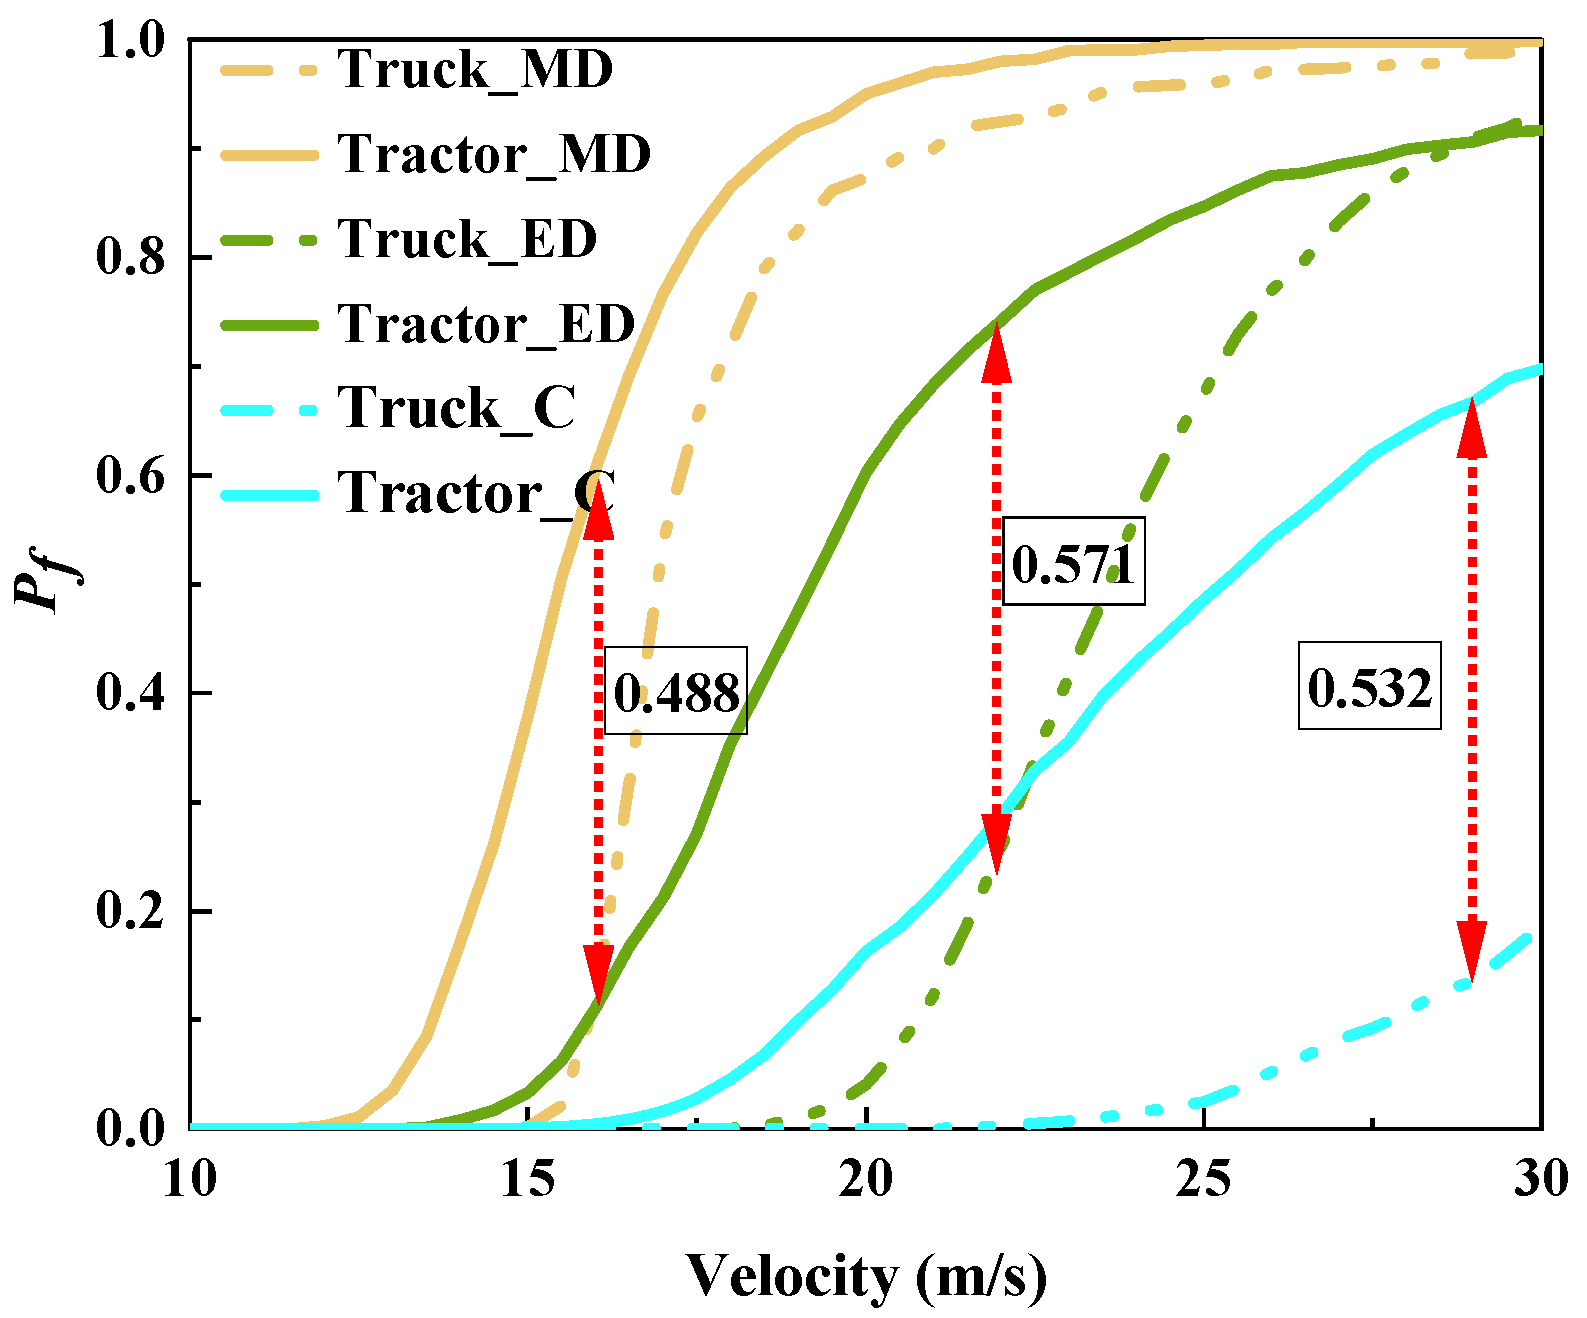
- The parameter sensitivity analyses indicated that the engine mass is the most important factor. The effect of variability on the shock response sensitivity analysis showed that the velocity has a great influence. Tractors often caused higher failure probabilities than trucks at the same velocity, and the maximum differences in failure probability were 0.488 (moderate damage), 0.571 (extensive damage), and 0.532 (collapse).
- (2)
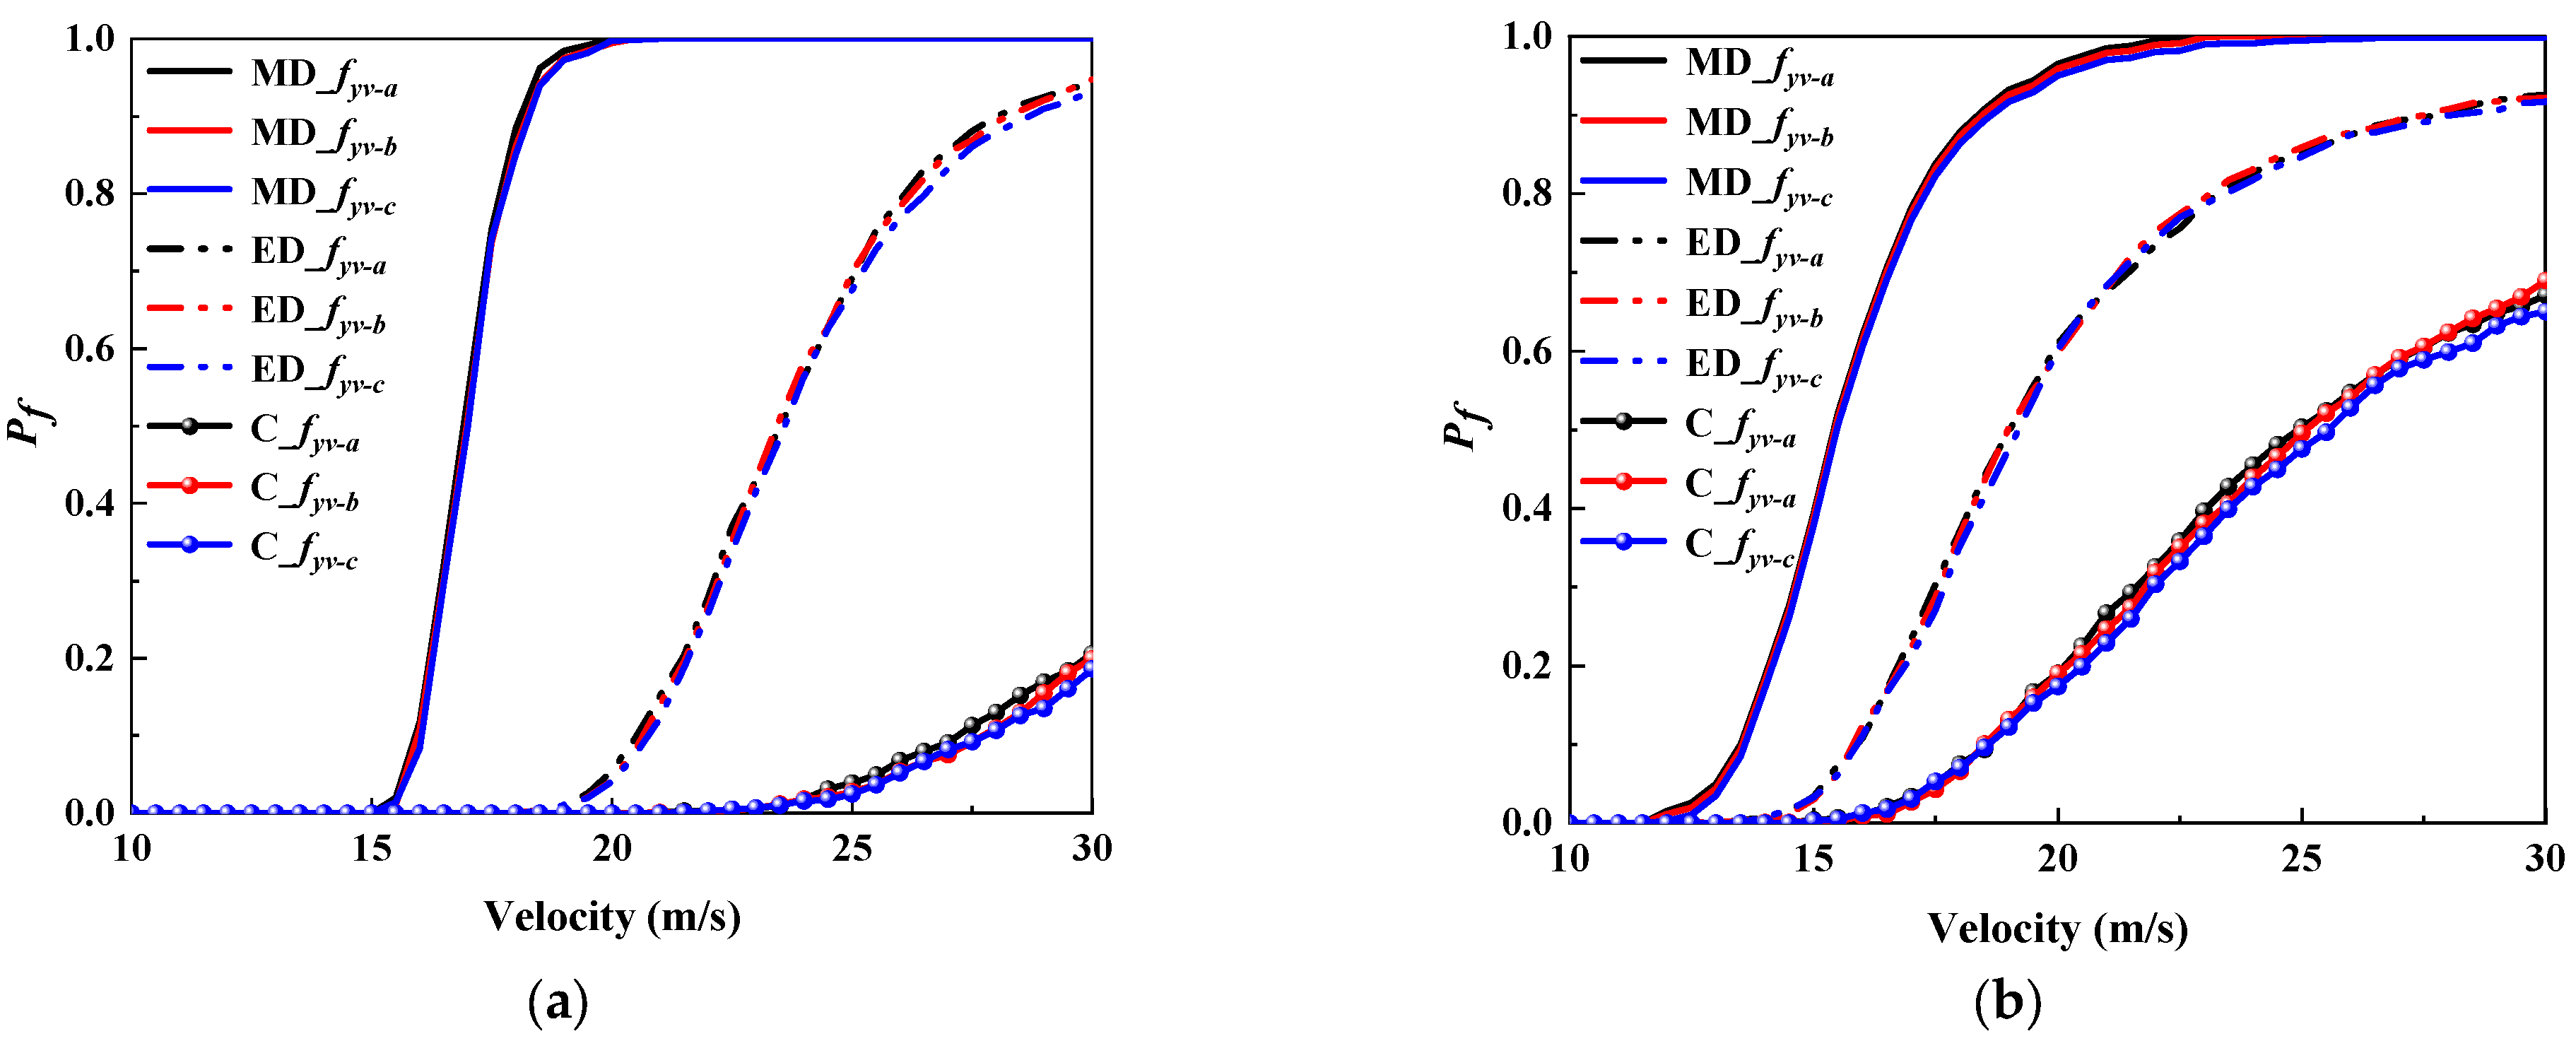
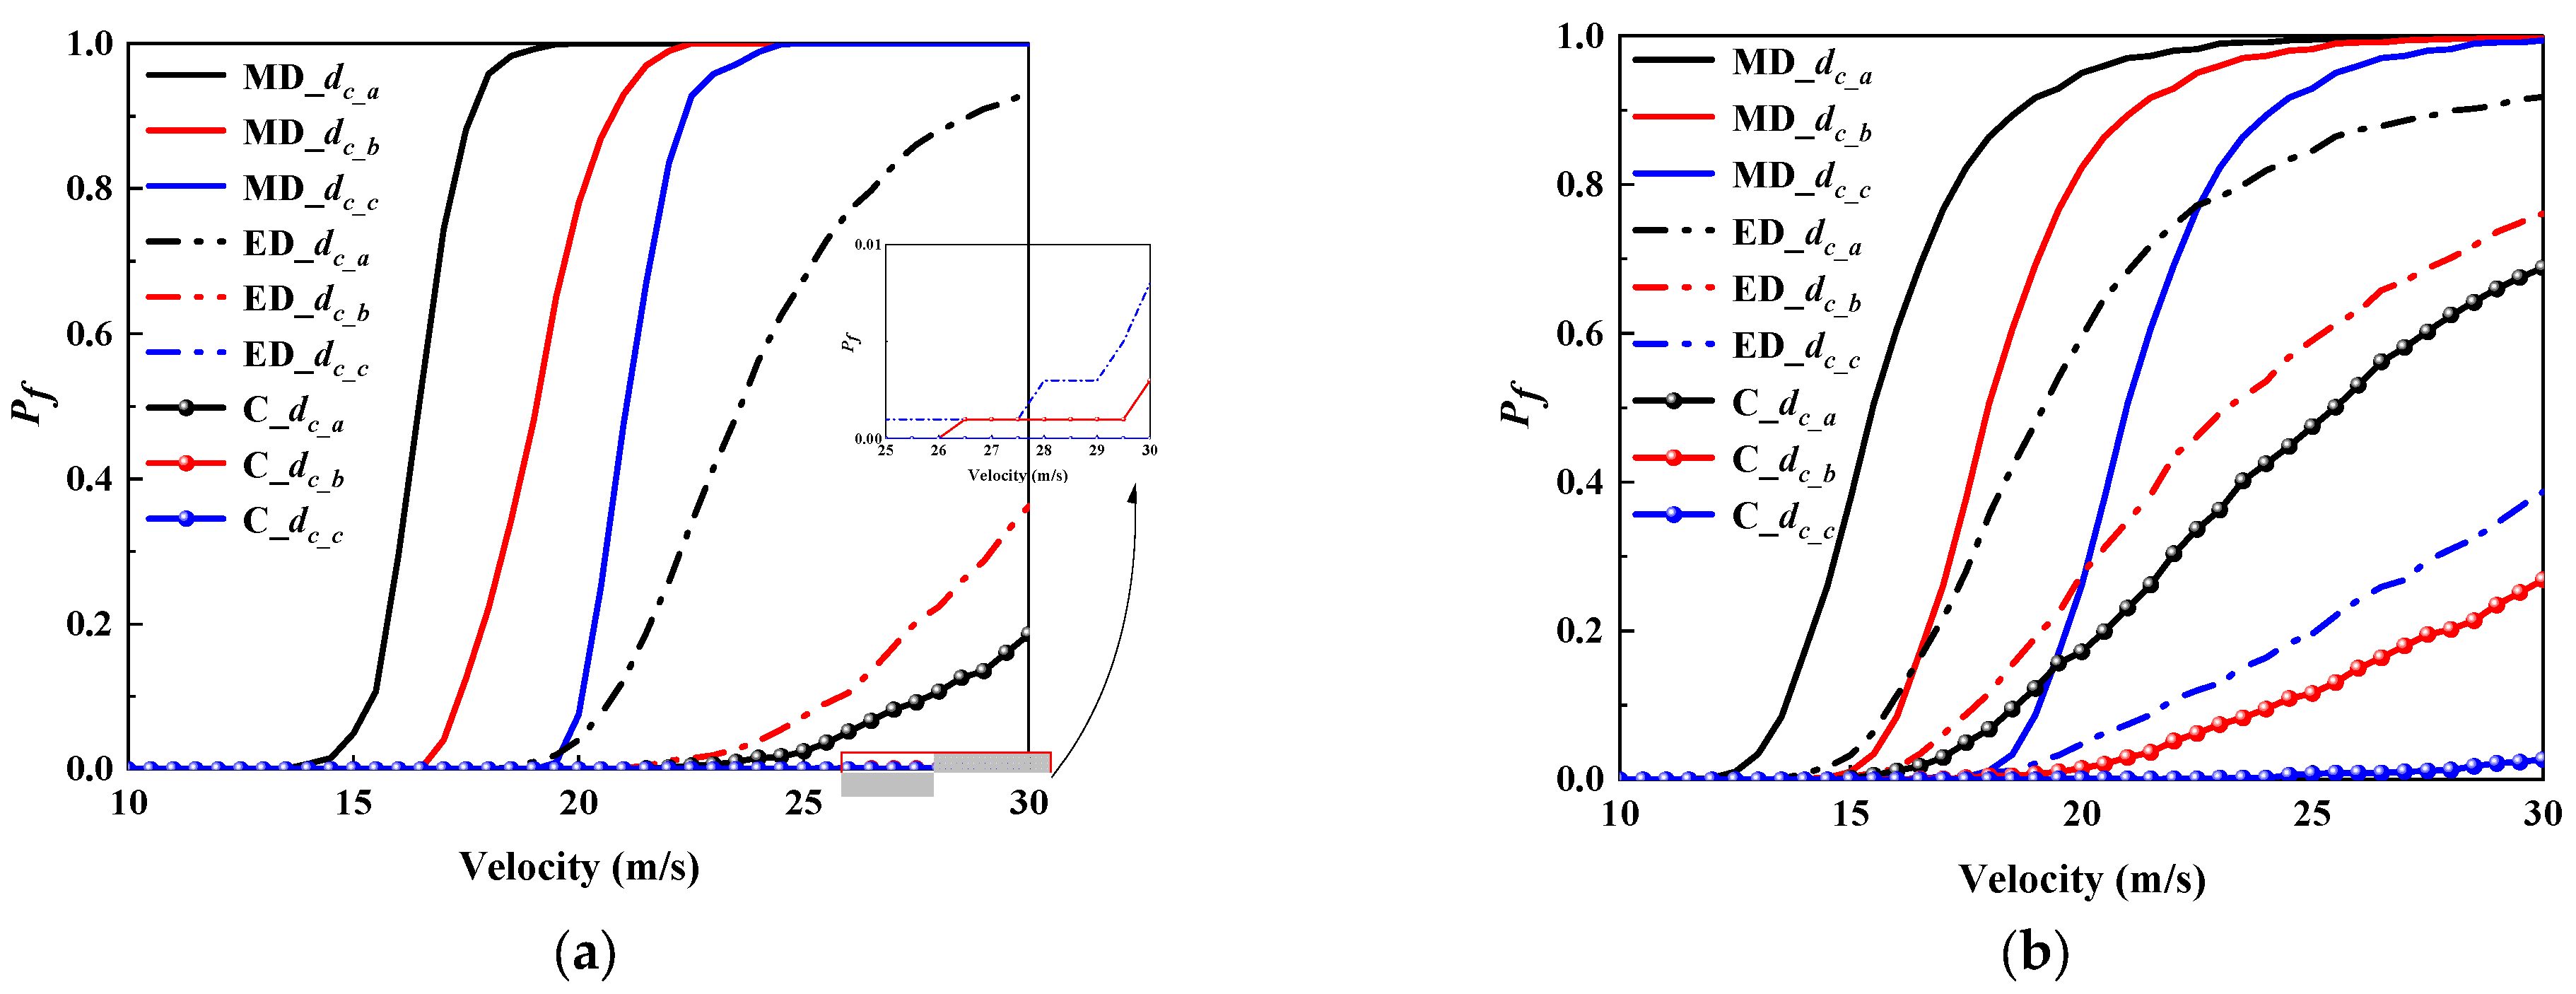
- The influence of important structural parameters for failure probability ranked as: pier diameter > concrete strength > stirrup spacing > stirrup yield strength. The influence of pier diameter on failure probability was more sensitive for trucks than tractors. Moreover, the concrete strength had a great impact on both trucks and tractors, especially for collapsed states.
- (3)
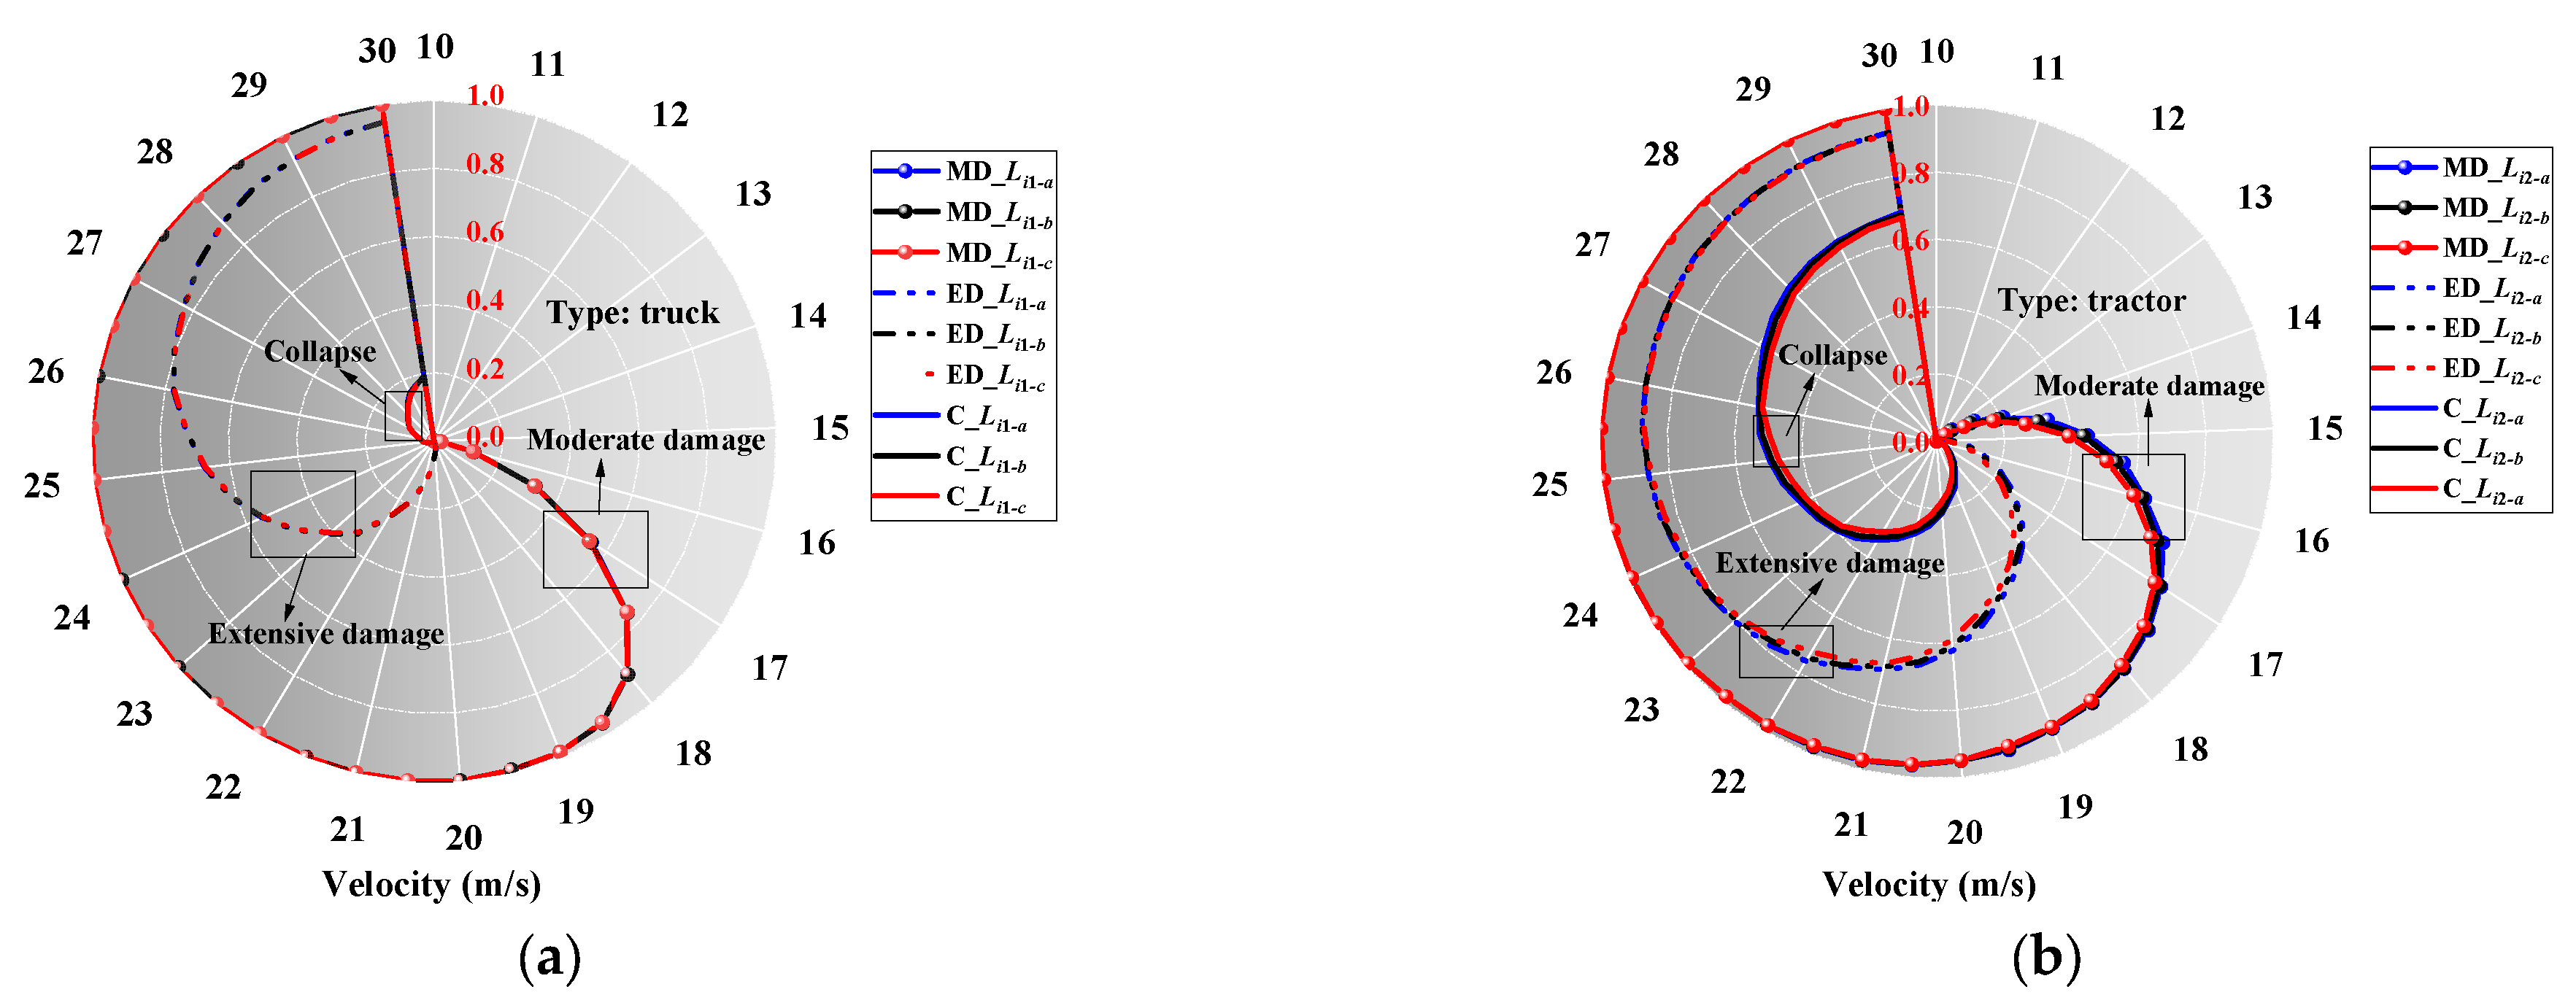
- The failure probability of a RC bridge pier decreased marginally as the vehicle impact height increased. When compared to trucks, tractors exhibited a slightly lower failure probability, with the maximum difference reaching only 0.067. At a constant velocity, increasing the distance from the engine to the front of the vehicle significantly increased the failure probability of a bridge pier. Specifically, for trucks, the maximum differences in failure probabilities for moderate damage, extensive damage, and collapse were 0.18, 0.099, and 0.07, respectively. For tractors, the maximum differences in failure probabilities were 0.106, 0.022, and 0.078, respectively.
Author Contributions
Funding
Data Availability Statement
Acknowledgments
Conflicts of Interest
References
- Yoshida, N.; Tazoh, T.; Wakamatsu, K.; Yasuda, S.; Towhata, I.; Nakazawa, H.; Kiku, H. Causes of Showa Bridge collapse in the 1964 Niigata earthquake based on eyewitness testimony. Soils Found. 2007, 47, 1075–1087. [Google Scholar] [CrossRef]
- Hsu, Y.T.; Fu, C.C. Seismic effect on highway bridges in Chi Chi earthquake. J. Perform. Constr. Facil. 2004, 18, 47–53. [Google Scholar] [CrossRef]
- Han, Q.; Du, X.; Liu, J.; Li, Z.; Li, L.; Zhao, J. Seismic damage of highway bridges during the 2008 Wenchuan earthquake. Earthq. Eng. Eng. Vib. 2009, 8, 263–273. [Google Scholar] [CrossRef]
- Sun, W.; Fan, W.; Yang, C.; Peng, W. Lessons learned from vehicle collision accident of Dongguofenli Bridge: FE modeling and analysis. Eng. Struct. 2021, 244, 112813. [Google Scholar] [CrossRef]
- Choudhury, J.R.; Hasnat, A. Bridge collapses around the world: Causes and mechanisms. In Proceedings of the IABSE-JSCE Joint Conference on Advances in Bridge Engineering-III, Dhaka, Bangladesh, 21–22 August 2015; pp. 26–34. [Google Scholar]
- Buth, C.E.; Williams, W.F.; Brackin, M.S.; Lord, D.; Geedipally, S.R.; Abu-Odeh, A.Y. Analysis of Large Truck Collisions with Bridge Piers: Phase 1, Report of Guidelines for Designing Bridge Piers and Abutments for Vehicle Collisions; Texas Transportation Institute: College Station, TX, USA, 2010. [Google Scholar]
- Turner, J.P.; Ge, D.; Axtell, P.J. Rockfall Hazard Mitigation at the TH-53 Bridge, Virginia, Minnesota. 2016. Available online: https://www.semanticscholar.org/paper/Rockfall-Hazard-Mitigation-at-the-TH-53-Bridge%2C-Graham-Turner/681cb07b76a81e2b7a6731b7e8f02d203b59ef94 (accessed on 7 April 2025).
- Zhong, H.; Hao, C.; Yu, Z.; Lyu, L.; Wu, A. Damage assessment of RC bridge piers under rockfall impact and evaluation of a steel-sand protective structure. Structures 2023, 47, 607–624. [Google Scholar] [CrossRef]
- Do, T.V.; Pham, T.M.; Hao, H. Dynamic responses and failure modes of bridge columns under vehicle collision. Eng. Struct. 2018, 156, 243–259. [Google Scholar] [CrossRef]
- El-Tawil, S.; Severino, E.; Fonseca, P. Vehicle collision with bridge piers. J. Bridge Eng. 2005, 10, 345–353. [Google Scholar] [CrossRef]
- Bullard, D.L., Jr.; Buth, C.; Williams, W.F.; Menges, W.L.; Haug, R.R. Crash Testing and Evaluation of The Modified T77 Bridge Rail. 2003. Available online: https://trid.trb.org/View/697096 (accessed on 7 April 2025).
- Beason, W.L.; Hirsch, T.J. Measurement of Heavy Vehicle Impact Forces and Inertia Properties. United States. Federal Highway Administration. Office of Safety and Traffic Operations. 1989. Available online: https://trid.trb.org/View/299135 (accessed on 7 April 2025).
- Alberson, D.; Menges, W.; Haug, R. Testing and Evaluation of the Adler Anti-Ram Wall™. Texas Transporation Institute: College Station, TX, USA, 2004. [Google Scholar]
- Ivory, M. Crash Test Report for Perimeter Barriers and Gates Tested to SD-STD-02.01, Revision A. Rep TR-P25039-01-NC; KARCO Engineering, LLC: Adelanto, CA, USA, 2005. [Google Scholar]
- Buth, C.E.; Brackin, M.S.; Williams, W.F.; Fry, G.T. Collision Loads on Bridge Piers: Phase 2, Report of Guidelines for Designing Bridge Piers and Abutments for Vehicle Collisions; Texas Transportation Institute: College Station, TX, USA, 2011. [Google Scholar]
- Chen, L.; Wu, H.; Fang, Q.; Li, R. Full-scale experimental study of a reinforced concrete bridge pier under truck collision. J. Bridge Eng. 2021, 26, 05021008. [Google Scholar] [CrossRef]
- Chen, L.; Xiao, Y.; El-Tawil, S. Impact tests of model RC columns by an equivalent truck frame. J. Struct. Eng. 2016, 142, 04016002. [Google Scholar] [CrossRef]
- Demartino, C.; Wu, J.; Xiao, Y. Response of shear-deficient reinforced circular RC columns under lateral impact loading. Int. J. Impact Eng. 2017, 109, 196–213. [Google Scholar] [CrossRef]
- Do, T.V.; Pham, T.M.; Hao, H. Impact force profile and failure classification of reinforced concrete bridge columns against vehicle impact. Eng. Struct. 2019, 183, 443–458. [Google Scholar] [CrossRef]
- Heng, K.; Li, R.; Wu, H. Damage assessment of simply supported double-pier bent bridge under heavy truck collision. J. Bridge Eng. 2022, 27, 04022021. [Google Scholar] [CrossRef]
- Li, R.; Cao, D.; Wu, H.; Wang, D. Collapse analysis and damage evaluation of typical simply supported double-pier RC bridge under truck collision. Structures 2021, 33, 3222–3238. [Google Scholar] [CrossRef]
- Opiela, K.; Kan, S.; Marzougui, D. Accomplishments of the FHWA/NHTSA National Crash Analysis Center (NCAC) 1993–2008; US National Crash Analysis Center: Washington, DC, USA, 2009. [Google Scholar]
- Sharma, H.; Hurlebaus, S.; Gardoni, P. Performance-based response evaluation of reinforced concrete columns subject to vehicle impact. Int. J. Impact Eng. 2012, 43, 52–62. [Google Scholar] [CrossRef]
- Zhao, W.; Ye, J. Impact force characteristic and mechanical behavior of trucks in collisions against bridge piers. Structures 2021, 34, 1489–1506. [Google Scholar] [CrossRef]
- Wu, M.; Jin, L.; Du, X. Dynamic response analysis of bridge precast segment piers under vehicle collision. Eng. Fail. Anal. 2021, 124, 105363. [Google Scholar] [CrossRef]
- Al-Thairy, H.; Wang, Y. Simplified FE vehicle model for assessing the vulnerability of axially compressed steel columns against vehicle frontal impact. J. Constr. Steel Res. 2014, 102, 190–203. [Google Scholar] [CrossRef]
- Cao, X.-Y.; Feng, D.-C.; Li, Y. Assessment of various seismic fragility analysis approaches for structures excited by non-stationary stochastic ground motions. Mech. Syst. Signal Process. 2023, 186, 109838. [Google Scholar] [CrossRef]
- Guo, X.; Chen, W.; Chen, Z. Probabilistic impact fragility analysis of bridges under Barge collision and local scour. Appl. Ocean Res. 2023, 134, 103495. [Google Scholar] [CrossRef]
- Lv, C.; Yan, Q.; Li, L.; Li, S. Field test and probabilistic vulnerability assessment of a reinforced concrete bridge pier subjected to blast loads. Eng. Fail. Anal. 2023, 143, 106802. [Google Scholar] [CrossRef]
- Guo, X.; Wang, Y.; Zhao, W.; Li, Z. Impact-fragility analysis of bridges under Vehicle collision with soil–structure Interaction effects. J. Perform. Constr. Facil. 2023, 37, 04023042. [Google Scholar] [CrossRef]
- Sharma, H.; Gardoni, P.; Hurlebaus, S. Probabilistic demand model and performance-based fragility estimates for RC column subject to vehicle collision. Eng. Struct. 2014, 74, 86–95. [Google Scholar] [CrossRef]
- Roy, S.; Unobe, I.D.; Sorensen, A.D. Reliability assessment and sensitivity analysis of vehicle impacted reinforced concrete circular bridge piers. Structures 2022, 37, 600–612. [Google Scholar] [CrossRef]
- Björnsson, I. Reliability of RC Bridge Supports Designed to Resist Heavy Goods Vehicle Collisions. Struct. Eng. Int. 2015, 25, 395–404. [Google Scholar] [CrossRef]
- Lu, D.; Yu, X.; Jia, M.; Wang, G. Seismic risk assessment for a reinforced concrete frame designed according to Chinese codes. Struct. Infrastruct. Eng. 2014, 10, 1295–1310. [Google Scholar] [CrossRef]
- Yu, X.; Lu, D.; Jia, M.M. Two analytical formulas for seismic fragility evaluation considering collapse case. In Proceedings of the International Symposium on Reliability Engineering and Risk Management (ISRERM’2012), Yokohama, Japan, 5–8 August 2012. [Google Scholar]
- Padmanabhan, D.; Agarwal, H.; Renaud, J.E.; Batill, S.M. A study using Monte Carlo simulation for failure probability calculation in reliability-based optimization. Optim. Eng. 2006, 7, 297–316. [Google Scholar] [CrossRef]
- Fujikake, K.; Li, B.; Soeun, S. Impact response of reinforced concrete beam and its analytical evaluation. J. Struct. Eng. 2009, 135, 938–950. [Google Scholar] [CrossRef]
- Hu, B.; Liu, Y.-Y.; Li, Y.; Wang, H.-B. Residual Deformation-Based Performance Evaluation Method for CFST Piers Subjected to Vehicle Collision. J. Perform. Constr. Facil. 2023, 37, 04023007. [Google Scholar] [CrossRef]
- Zhou, D.; Li, R. Damage assessment of bridge piers subjected to vehicle collision. Adv. Struct. Eng. 2018, 21, 2270–2281. [Google Scholar] [CrossRef]
- Chen, L.; Liu, T. Damage analysis of reinforced concrete piers under vehicle collision. Struct. Congr. 2019, 2019, 1–11. [Google Scholar]
- Hao, Y.; Hao, H. Influence of the concrete DIF model on the numerical predictions of RC wall responses to blast loadings. Eng. Struct. 2014, 73, 24–38. [Google Scholar] [CrossRef]
- Malvar, L.J. Review of static and dynamic properties of steel reinforcing bars. Mater. J. 1998, 95, 609–616. [Google Scholar]
- Sierakowski, R.L.; Chaturvedi, S.K. Dynamic Loading and Characterization of Fiber-Reinforced Composites; Wiley-VCH: Weinheim, Germany, 1997. [Google Scholar]
- Loads, M.D. Minimum Design Loads and Associated Criteria for Buildings and Other Structures; American Society of Civil Engineers: Reston, VT, USA, 2017. [Google Scholar]
- Priestley, M.N.; Verma, R.; Xiao, Y. Seismic shear strength of reinforced concrete columns. J. Struct. Eng. 1994, 120, 2310–2329. [Google Scholar] [CrossRef]
- Cao, R.; Agrawal, A.K.; El-Tawil, S.; Xu, X.; Wong, W. Heavy truck collision with bridge piers: Computational simulation study. J. Bridge Eng. 2019, 24, 04019052. [Google Scholar] [CrossRef]
- Xiao, Y.; Li, B.; Fujikake, K. Predicting response of reinforced concrete slabs under low-velocity impact. Mag. Concr. Res. 2017, 69, 996–1010. [Google Scholar] [CrossRef]
- Chen, L.; Xiao, Y.; Xiao, G.; Liu, C.; Agrawal, A.K. Test and numerical simulation of truck collision with anti-ram bollards. Int. J. Impact Eng. 2015, 75, 30–39. [Google Scholar] [CrossRef]
- Xu, C. Impact Load Model Analysis on the Vehicle-to-Pier Collision. Ph.D. Thesis, University of Maryland, College Park, MD, USA, 2019. [Google Scholar]
- Humar, J. Dynamics of Structures; CRC Press: Boca Raton, FL, USA, 2012. [Google Scholar]
- Li, D.; Xiong, C.; Huang, T.; Wei, R.; Han, N.; Xing, F. A simplified constitutive model for corroded steel bars. Constr. Build. Mater. 2018, 186, 11–19. [Google Scholar] [CrossRef]
- Mander, J.B.; Priestley, M.J.; Park, R. Theoretical stress-strain model for confined concrete. J. Struct. Eng. 1988, 114, 1804–1826. [Google Scholar] [CrossRef]
- Liu, F.; Luo, Q.Z.; Jiang, Z.G.; Yan, B. The impact response model of bridge piers considering subsoil and axial load. Earthq. Eng. Eng. Dyn. 2017, 37, 112–120. [Google Scholar]
- Chen, L.; Qian, J.; Tu, B.; Frangopol, D.M.; Dong, Y. Performance-based risk assessment of reinforced concrete bridge piers subjected to vehicle collision. Eng. Struct. 2021, 229, 111640. [Google Scholar] [CrossRef]
- Mestrovic, D.; Cizmar, D.; Miculinic, L. Reliability of concrete columns under vehicle impact. J. WIT Trans. Built Environ. 2008, 98, 157–165. [Google Scholar]
- Zhao, W.; Ye, J.; Qian, J.; Guo, X. Safety assessment of existing RC bridge piers subjected to vehicle impact. Structures 2022, 45, 1062–1075. [Google Scholar] [CrossRef]
- National People’s Congress (NPC). Road Traffic Safety Law of the People’s Republic of China; National People’s Congress: Beijing, China, 2011. [Google Scholar]
- GB 50010-2010; Ministry of Housing and Urban-Rural Development of the People’s Republic of China (MOHURD). China Architecture & Building Press: Beijing, China, 2010. (In Chinese)


| Vehicle Type | Engine Mass (Me) | Maximum Load (Mc) | Impact Height (Li) | Distance (xen) |
|---|---|---|---|---|
| Truck | 0.607 t | 4.88 t | 1000 mm | 493 mm |
| Tractor | 1.287 t | 24.60 t | 1500 mm | 422 mm |
| Parameter | Truck | Tractor | Unit |
|---|---|---|---|
| Me | 0.84 | 1.287 | ton |
| Δs | 0.72 × 10⁴ | 0.625 × 10⁴ | mm |
| Δt | 0.0174 | 0.0228 | s |
| D1 | 3.480 × 10⁵ | 3.530 × 10⁵ | N |
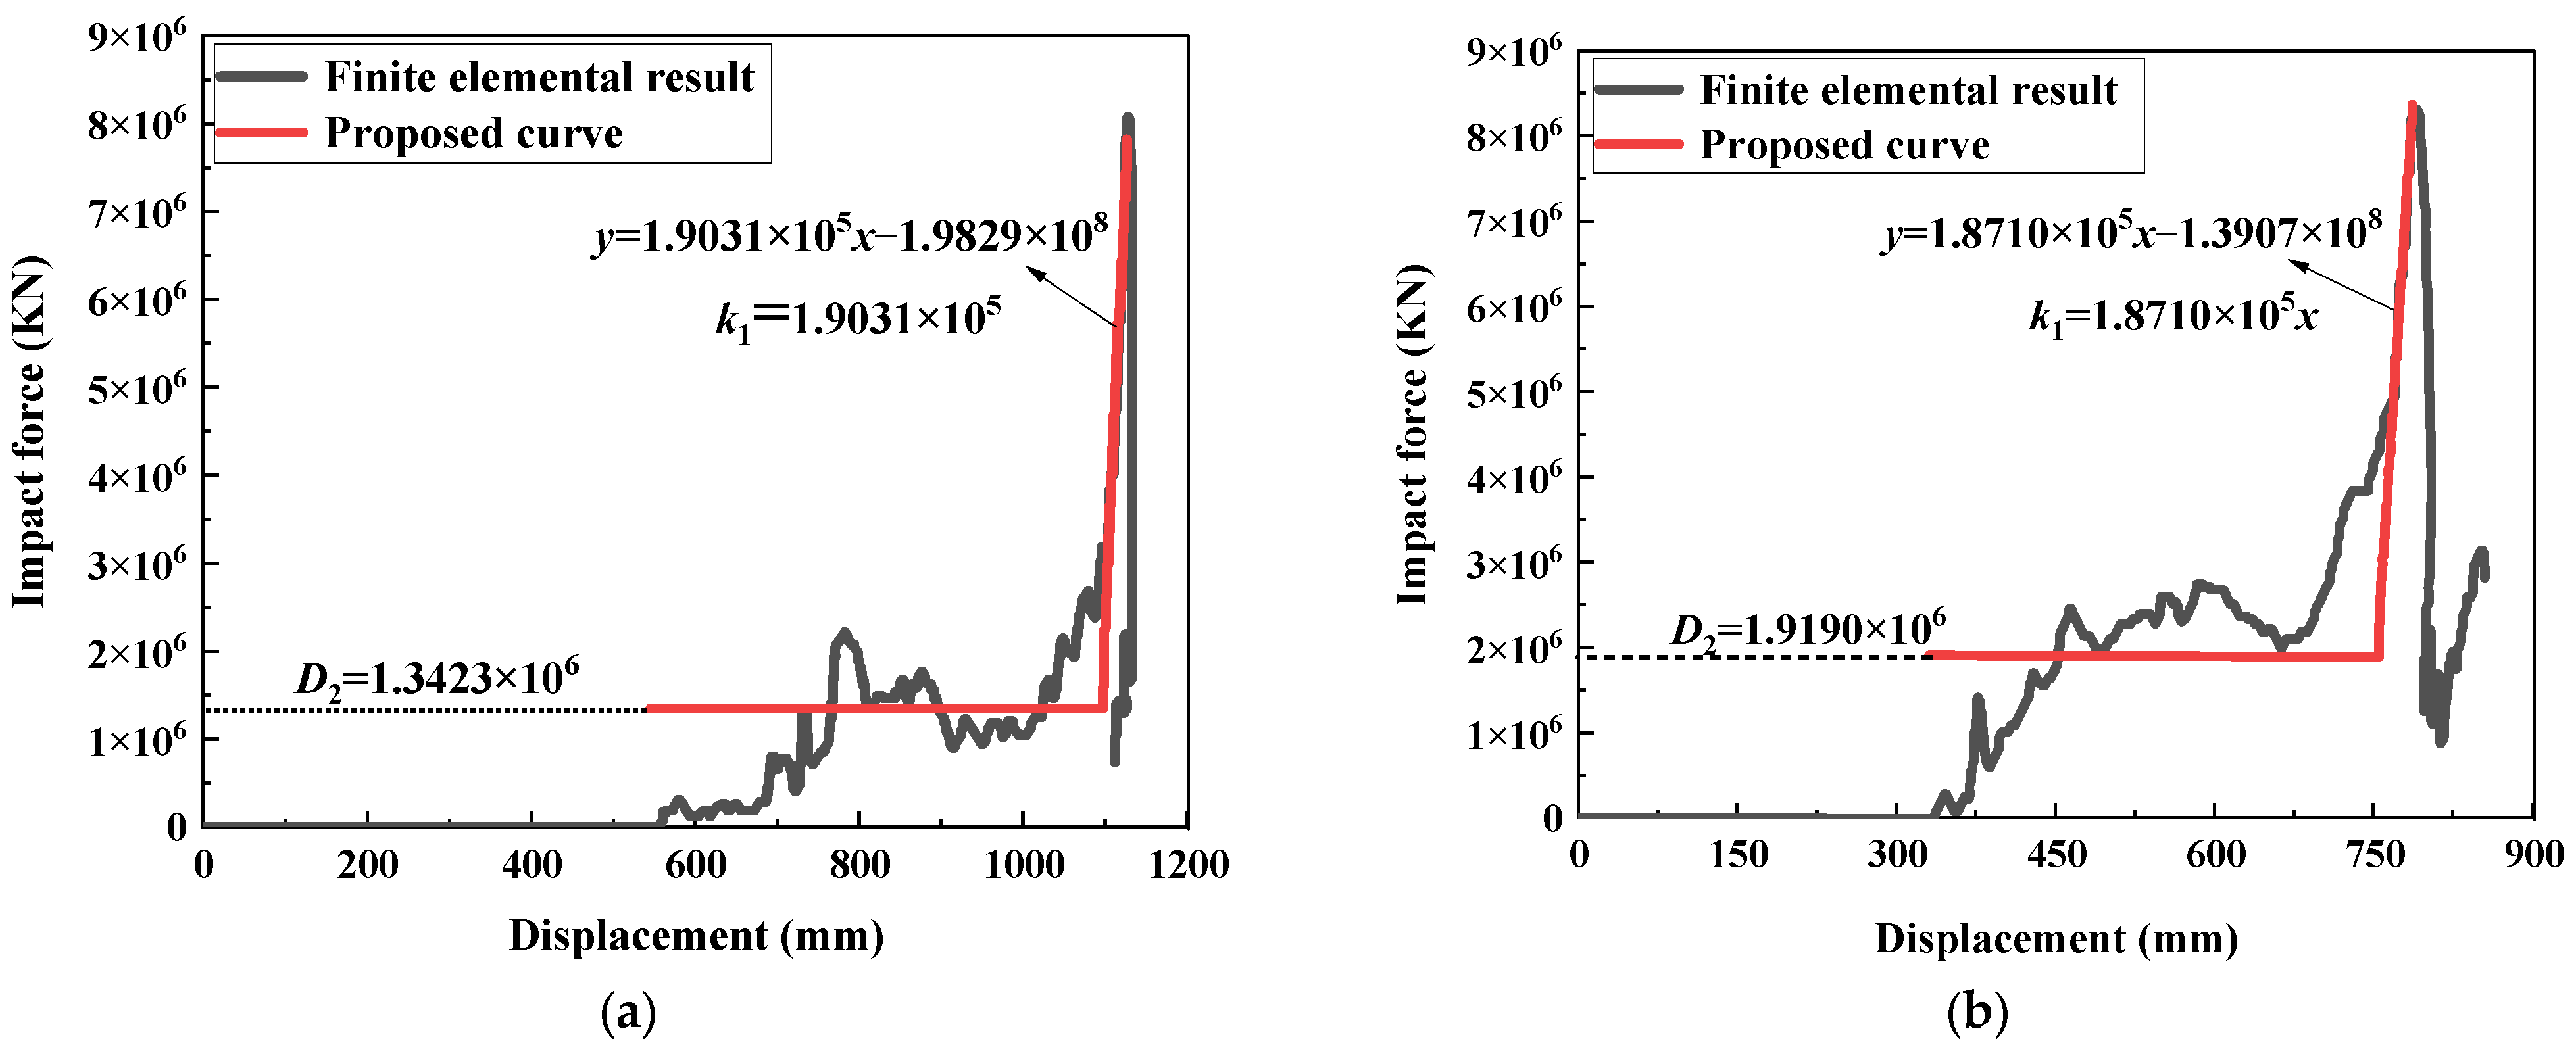
| D2 | 1.3423 × 10⁶ | 1.9190 × 10⁶ | N |
| k1 | 1.9031 × 10⁵ | 1.8710 × 10⁵ | N/mm |
| xen | 493 | 422 | mm |
| Parameter | Definition | [53] | [46] |
|---|---|---|---|
| v | Impact velocity | 80 km/h | 113 km/h |
| fc | Compressive strength of concrete | 30 Mpa | 27.58 Mpa |
| fyv | Stirrup yield strength | 235 Mpa | 275.79 Mpa |
| fy | Longitudinal bar yield strength | 335 Mpa | 300 Mpa |
| s | Stirrup spacing | 200 mm | 150 mm |
| d | Stirrup diameter | 10 mm | 10 mm |
| dr | Longitudinal bar diameter | 25 mm | 29 mm |
| n | Number of longitudinal bars | 24 | 8 |
| dc | Pier section diameter | 1300 mm | 900 mm |
| L | Pier height | 8540 mm | 4900 mm |
| Parameter | Definition | Mean Value | COV | Distribution | Source |
|---|---|---|---|---|---|
| M1 | Truck engine quality | 0.84 t | 0.1 | Normal | [54] |
| M2 | Tractor engine quality | 1.287 t | 0.25 | Normal | [55] |
| fc | Compressive strength of concrete | 35 Mpa | 0.11 | Normal | [56] |
| fyv | Yield strength of stirrup | 335 Mpa | 0.08 | Lognormal | [56] |
| s | Stirrup spacing | 200 | 0.1 | Normal | [54] |
| d | Stirrup section diameter | 8 mm | 0.35 | Normal | [54] |
| dr | Longitudinal bar diameter | 20 mm | 0.035 | Normal | [54] |
| dc | Pier section diameter | 1000 mm | 0.007 | Normal | [54] |
| Parameter | Mean Value | COV | Distribution |
|---|---|---|---|
| fc-a | 21 Mpa | 0.1773 | Normal |
| fc-b | 35 Mpa | 0.18 | Normal |
| fc-c | 41.36 Mpa | 0.11 | Normal |
| fyv-a | 240 Mpa | 0.1211 | Lognormal |
| fyv-b | 270 Mpa | 0.1 | Lognormal |
| fyv-c | 335 Mpa | 0.08 | Lognormal |
| dc-a | 1000 mm | 0.07 | Normal |
| dc-b | 1200 mm | 0.07 | Normal |
| dc-c | 1400 mm | 0.07 | Normal |
| s-a | 100 mm | 0.1 | Normal |
| s-b | 150 mm | 0.1 | Normal |
| s-c | 200 mm | 0.1 | Normal |
| Parameter | Value | Parameter | Value |
|---|---|---|---|
| Li1-a | 500 mm | xen,1-a | 481 mm |
| Li1-b | 700 mm | xen,1-b | 493 mm |
| Li1-c | 900 mm | xen,1-c | 505 mm |
| Li2-a | 1100 mm | xen,2-a | 410 mm |
| Li2-b | 1400 mm | xen,2-b | 422 mm |
| Li2-c | 1800 mm | xen,2-c | 434 mm |
Disclaimer/Publisher’s Note: The statements, opinions and data contained in all publications are solely those of the individual author(s) and contributor(s) and not of MDPI and/or the editor(s). MDPI and/or the editor(s) disclaim responsibility for any injury to people or property resulting from any ideas, methods, instructions or products referred to in the content. |
© 2025 by the authors. Licensee MDPI, Basel, Switzerland. This article is an open access article distributed under the terms and conditions of the Creative Commons Attribution (CC BY) license (https://creativecommons.org/licenses/by/4.0/).
Share and Cite
Yu, X.; Chen, Y.; He, Y. Vulnerability Assessment of Reinforced Concrete Piers Under Vehicle Collision Considering the Influence of Uncertainty. Buildings 2025, 15, 1222. https://doi.org/10.3390/buildings15081222
Yu X, Chen Y, He Y. Vulnerability Assessment of Reinforced Concrete Piers Under Vehicle Collision Considering the Influence of Uncertainty. Buildings. 2025; 15(8):1222. https://doi.org/10.3390/buildings15081222
Chicago/Turabian StyleYu, Xiaohui, Yihang Chen, and Yu He. 2025. "Vulnerability Assessment of Reinforced Concrete Piers Under Vehicle Collision Considering the Influence of Uncertainty" Buildings 15, no. 8: 1222. https://doi.org/10.3390/buildings15081222
APA StyleYu, X., Chen, Y., & He, Y. (2025). Vulnerability Assessment of Reinforced Concrete Piers Under Vehicle Collision Considering the Influence of Uncertainty. Buildings, 15(8), 1222. https://doi.org/10.3390/buildings15081222