
Simulation-Based Natural Ventilation Performance Assessment of a Novel Phase-Change-Material-Equipped Trombe Wall Design: A Case Study
Abstract
1. Introduction
2. Materials and Methods
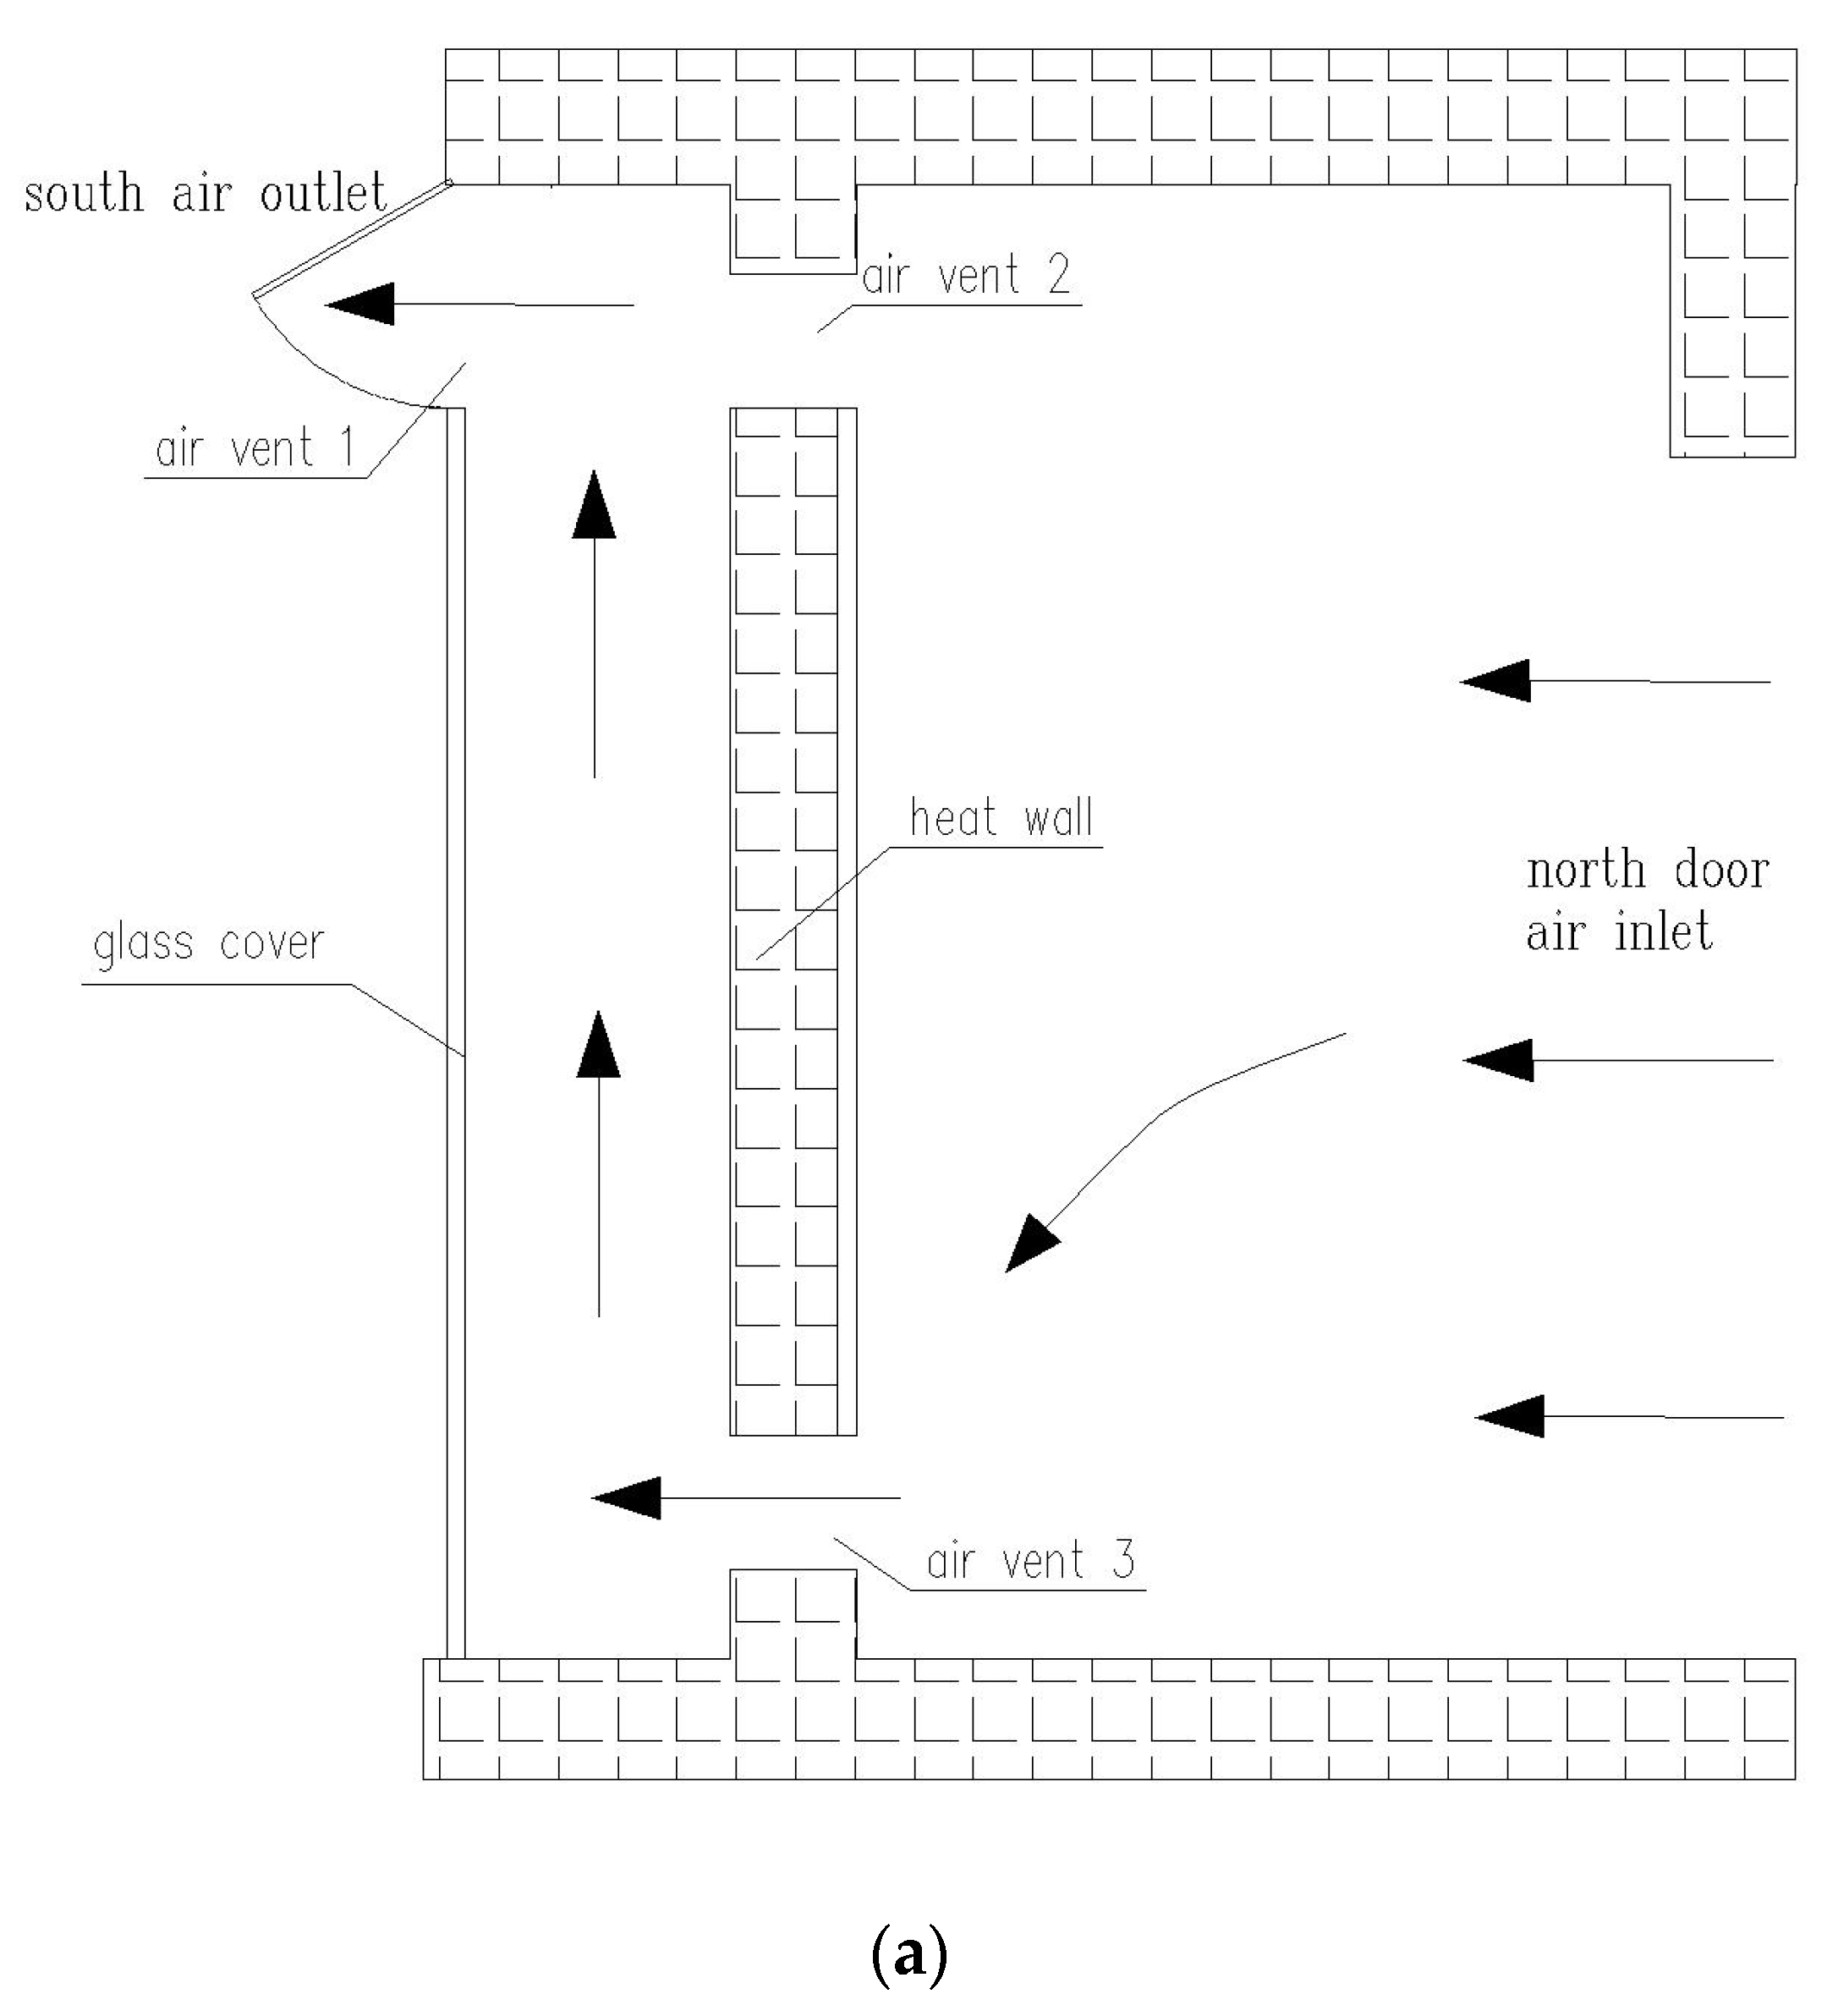
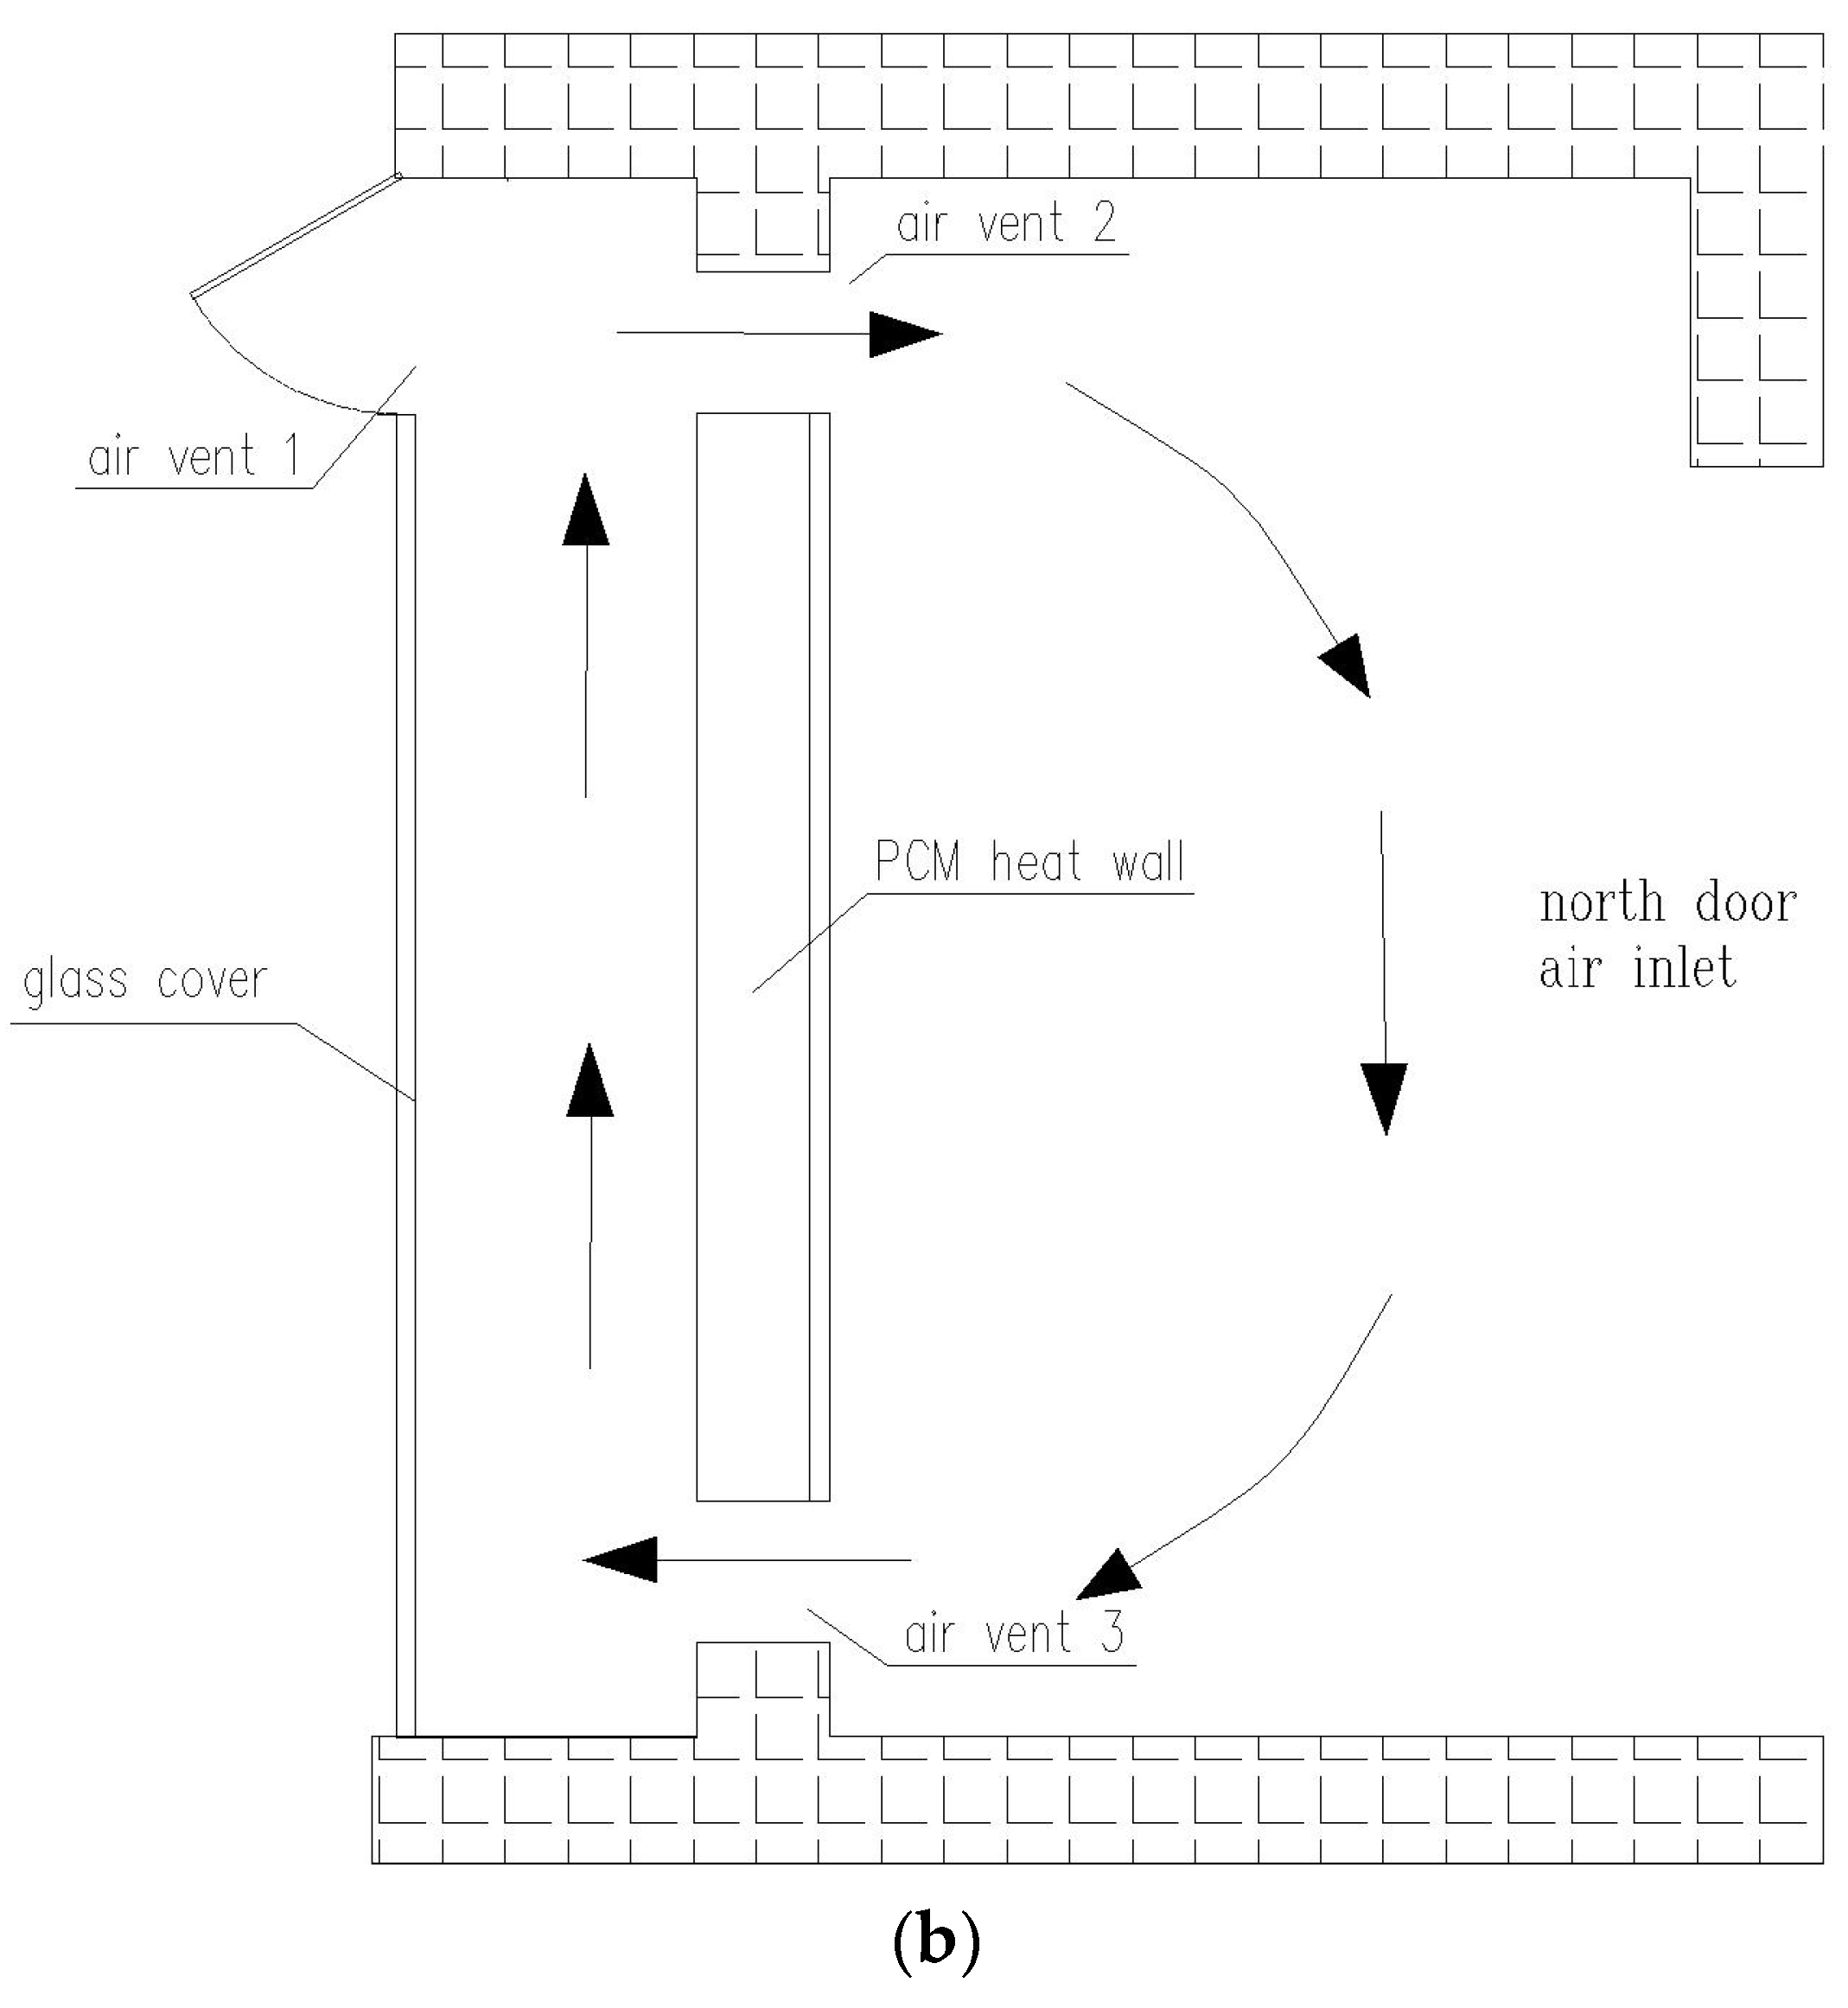
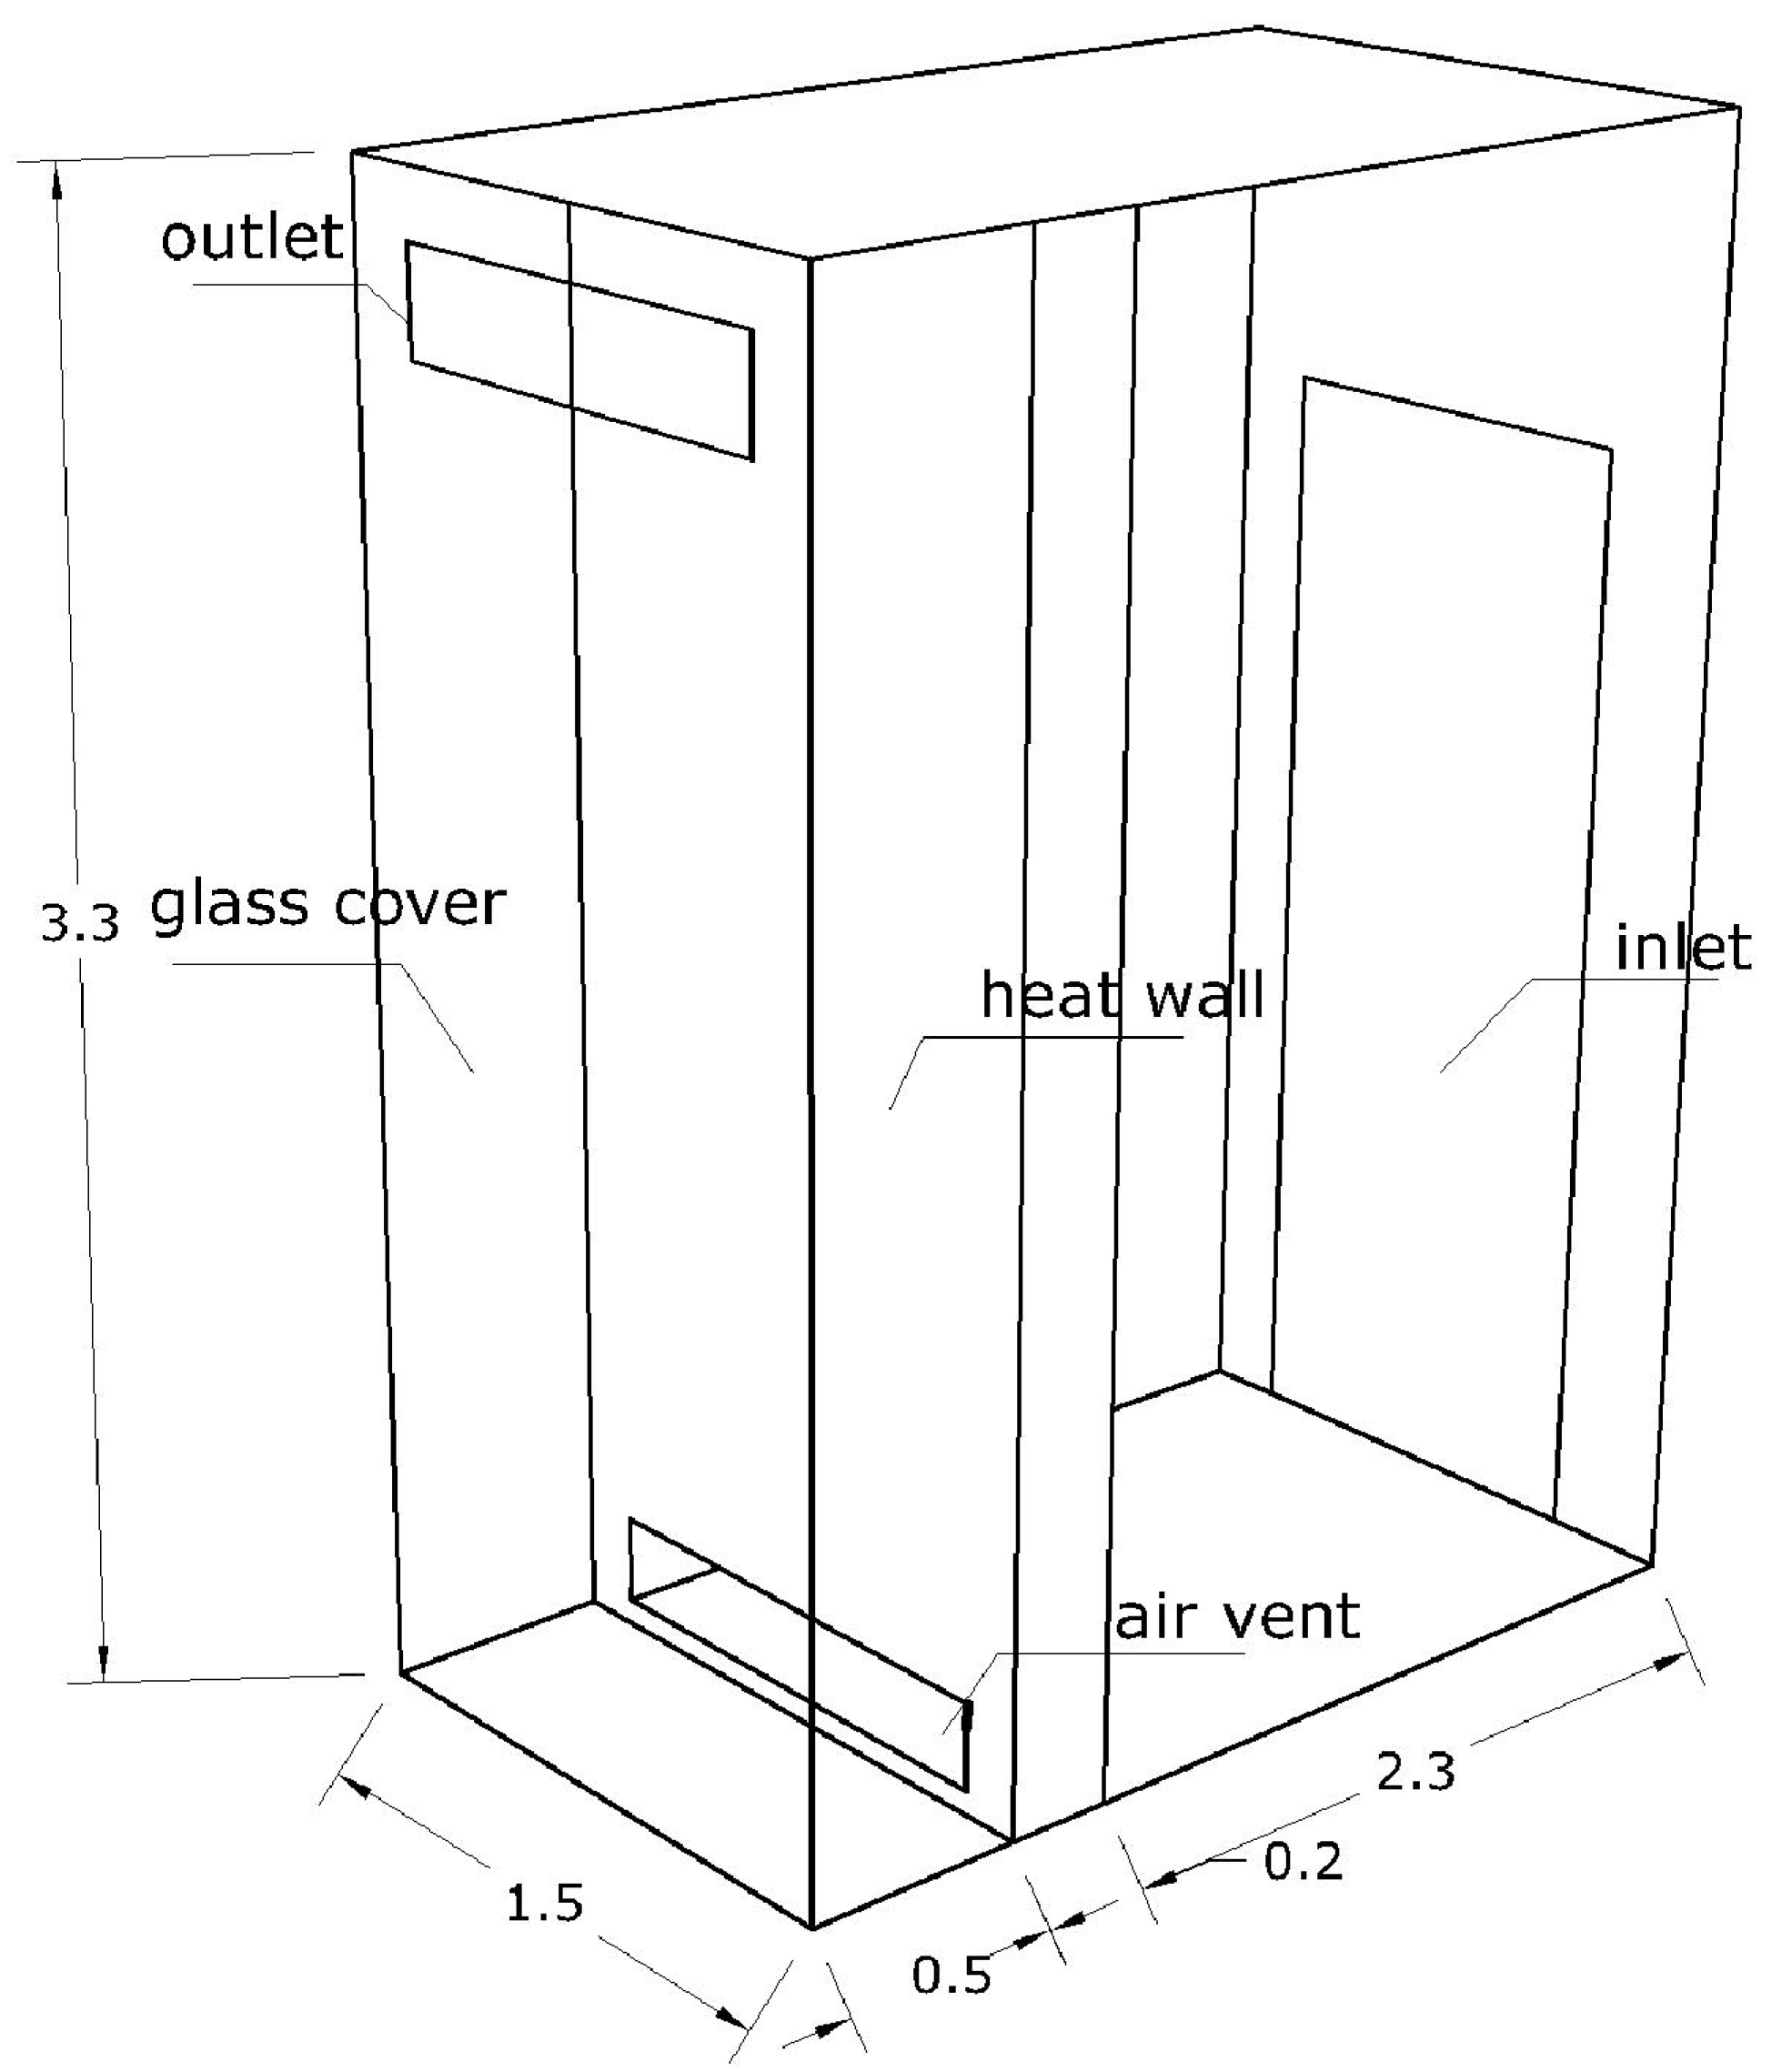
2.1. Construction of the Simulated Physical Model
2.2. Mathematical Description of the Simulation
- The entire airflow and heat transfer process is under steady-state conditions.
- The fluid is incompressible air, satisfying the Boussinesq assumption.
- Only natural ventilation driven by thermal buoyancy is considered.
- The enclosure structure is an adiabatic wall, and no air infiltration occurs.
- Heat storage of the absorber surface is not considered.
2.3. Boundary Condition Settings for the Simulation
3. Validation
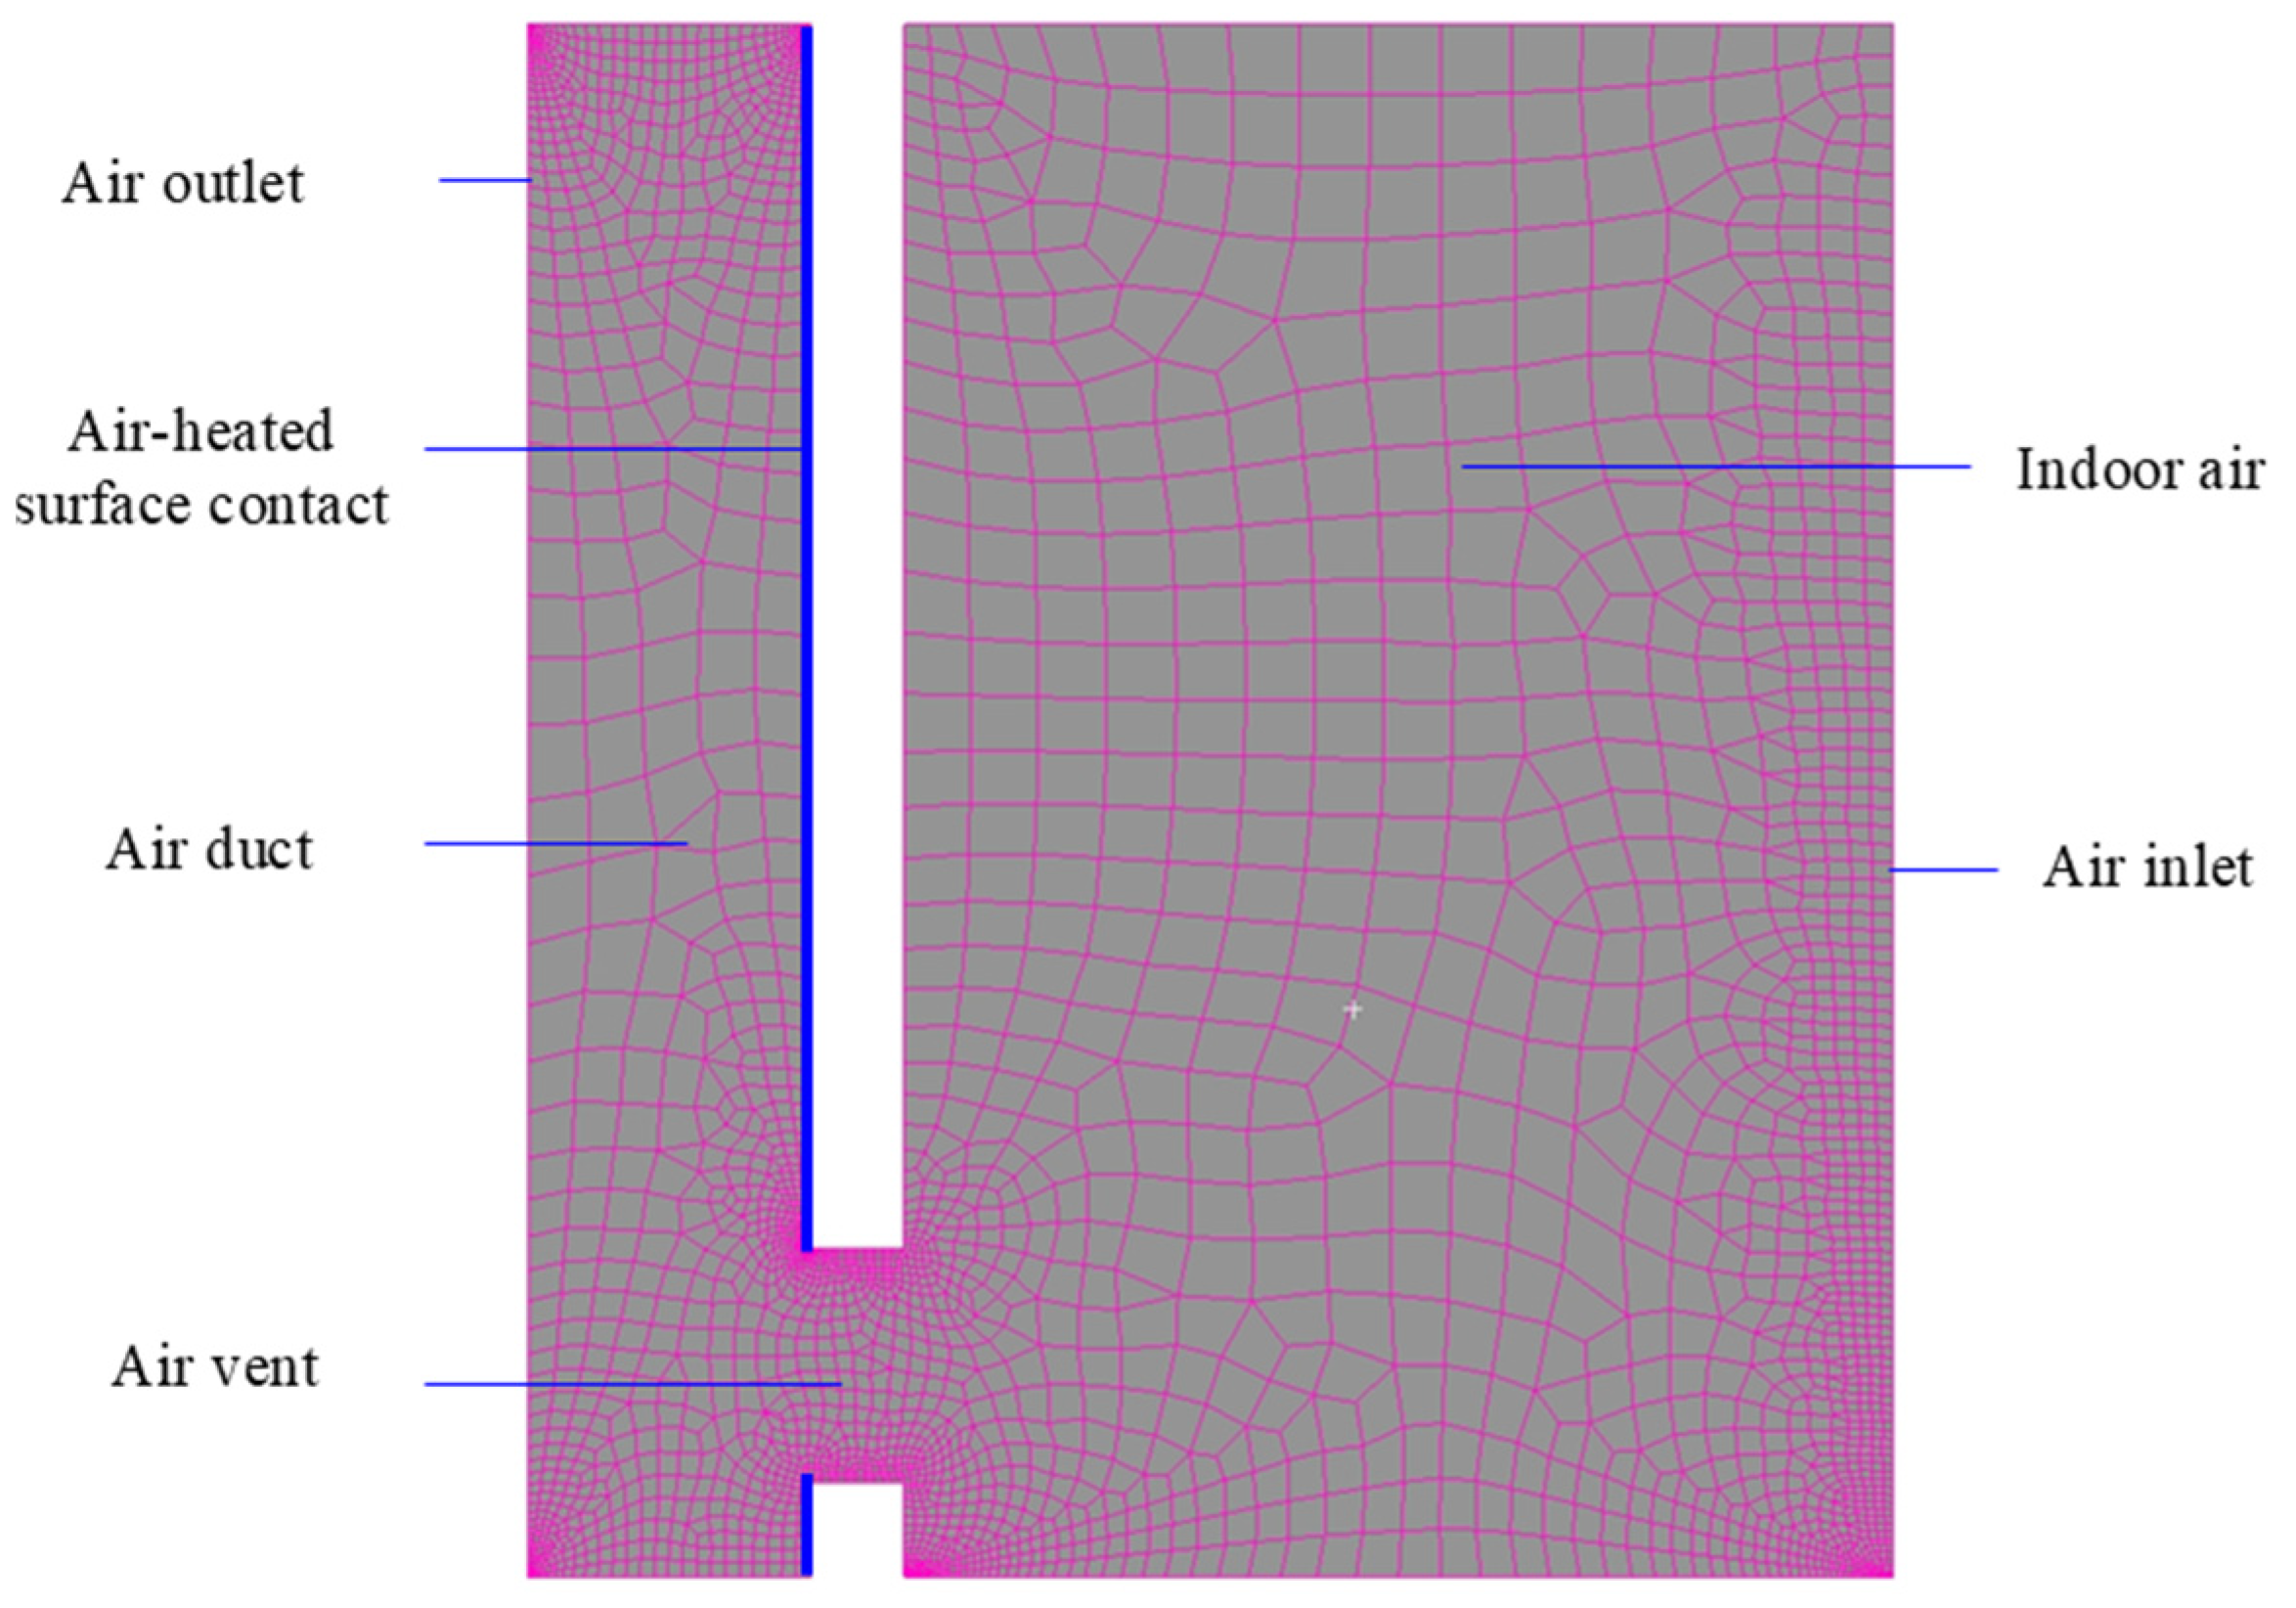
3.1. Mesh Validation for the Simulation
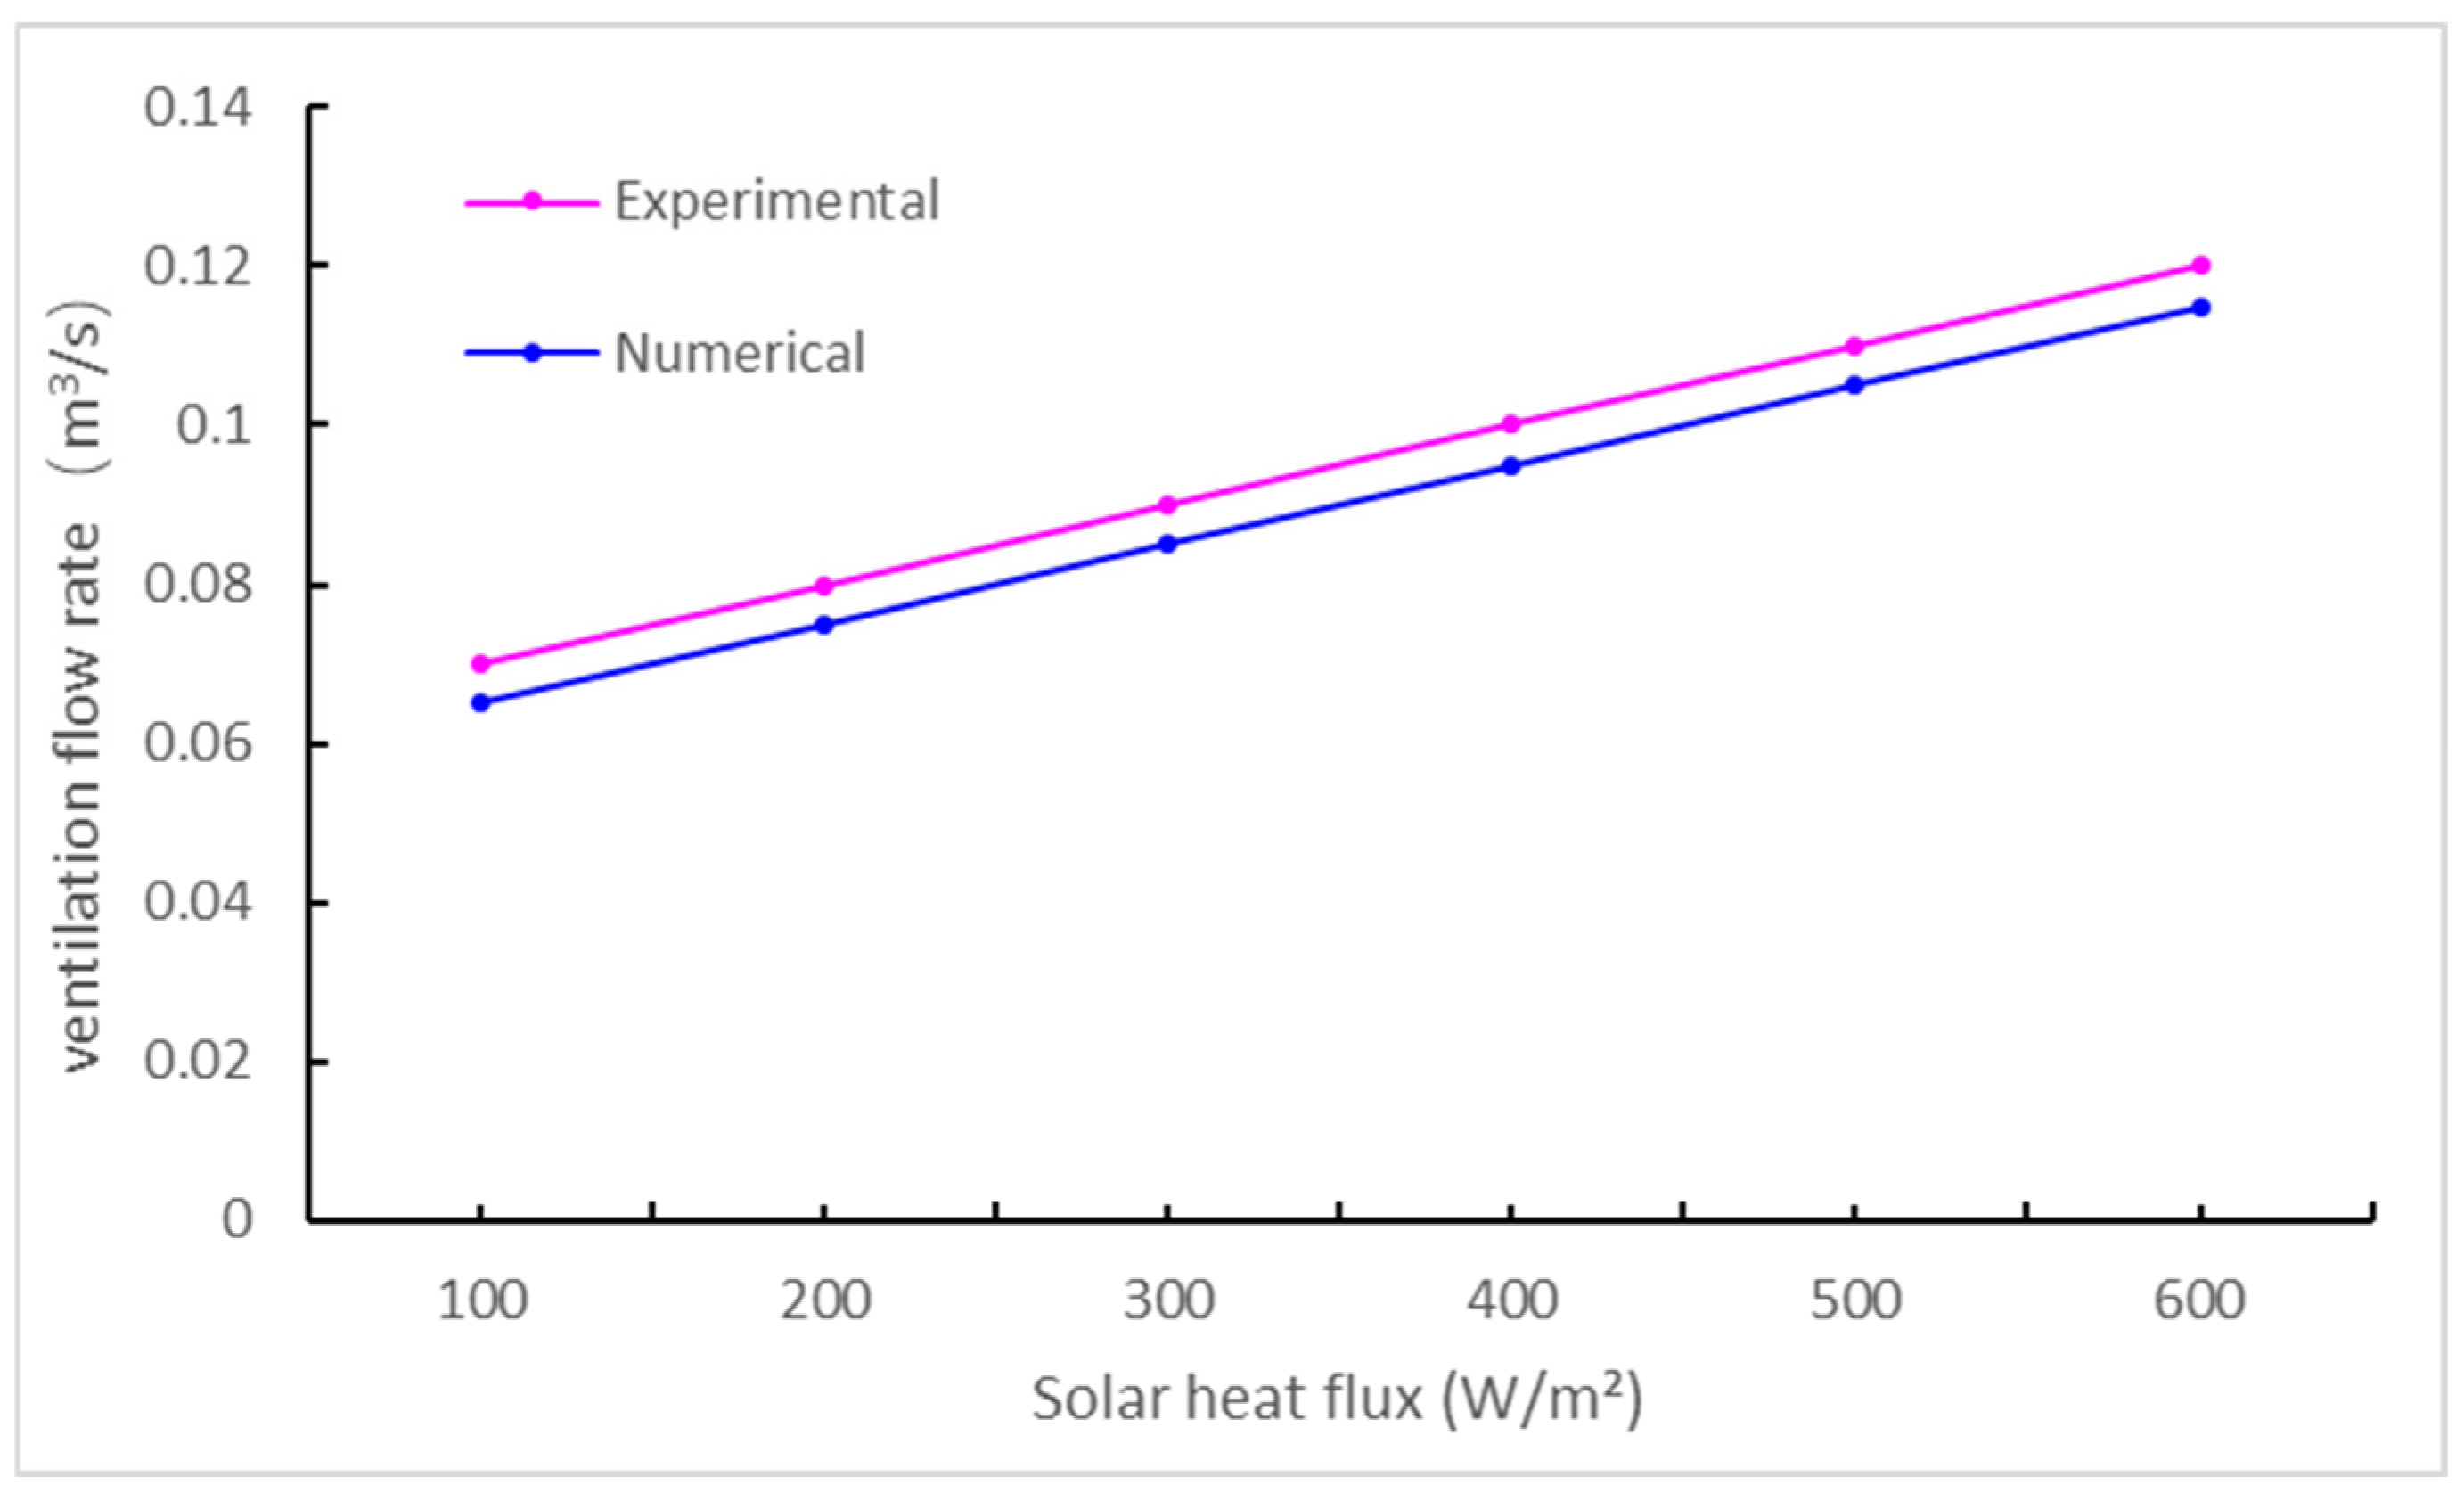
3.2. Validation of the Simulation Method
4. Results
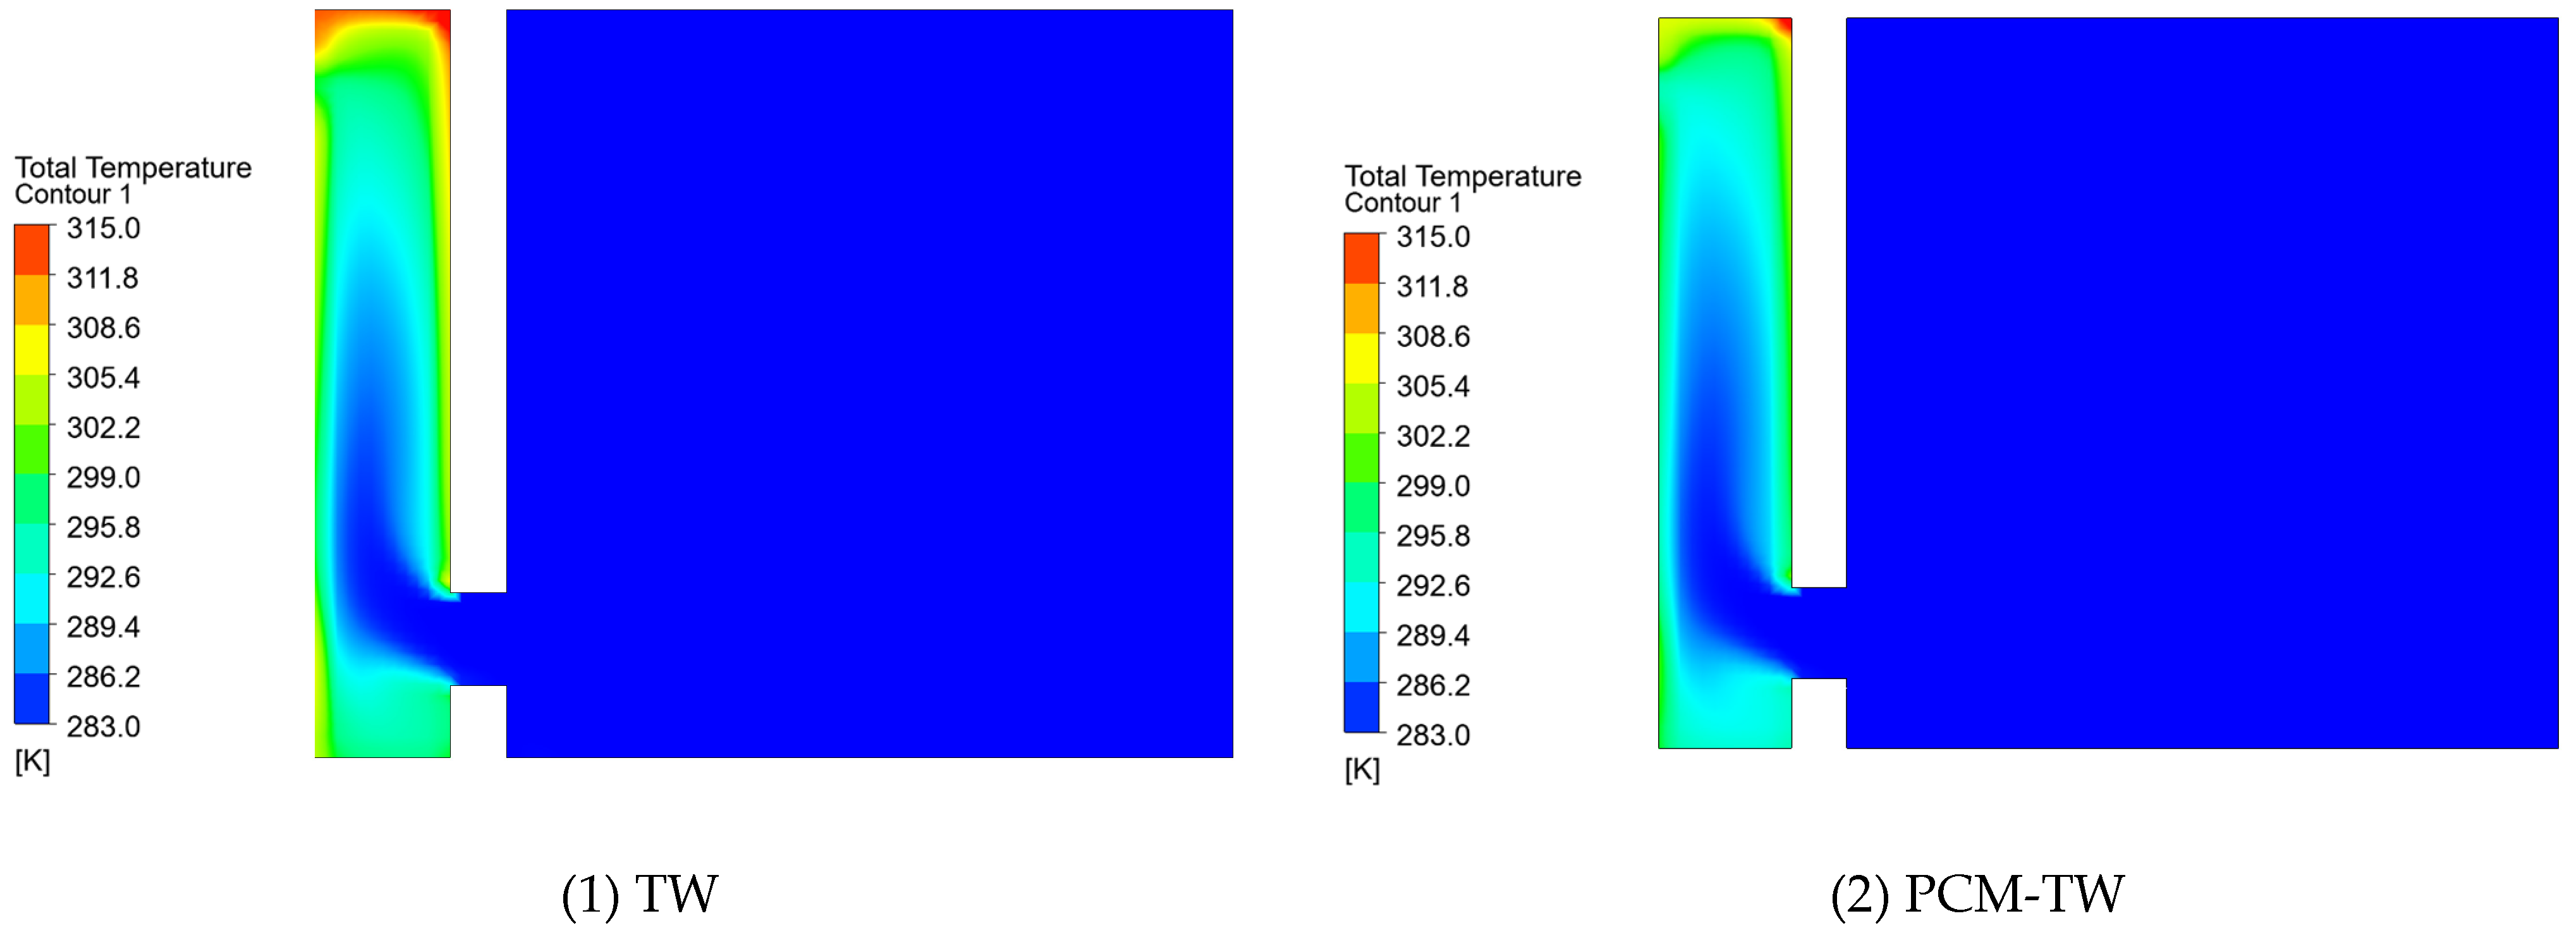
4.1. Temperature Distribution Inside the Trombe Wall Structure
4.2. Airflow Velocity Distribution Within the Trombe Wall Structure
5. Discussion
5.1. Comparison of Grashof Numbers in Air Ducts
5.2. Ventilation Rate Variation in the Air Duct
6. Conclusions
- (1)
- Due to the phase-change process of the phase-change material, the PCM-TW effectively mitigates temperature fluctuations within the air channel. Compared to traditional TW systems, the PCM-TW reduces the impact of solar radiation on the enhanced ventilation effect of the Trombe wall, significantly lowering the peak air channel temperature by approximately 8.3 °C and delaying the temperature drop rate in the air channel by about one hour. This effect is primarily attributed to the phase-change material absorbing and releasing heat during the phase-change process, reducing the impact of temperature fluctuations on the system.
- (2)
- Under the combined influence of specific heat capacity and thermal conductivity, the heat flux density of the TW system is higher than that of the PCM-TW system. This indicates that the traditional TW system has higher heat flux density and stronger heat exchange capability during heat conduction. However, the natural convection intensity of the PCM-TW system is slightly weaker than that of the TW system. Consequently, under the same conditions, the TW system generates greater air buoyancy and forms stronger natural convection, leading to higher air velocity.
- (3)
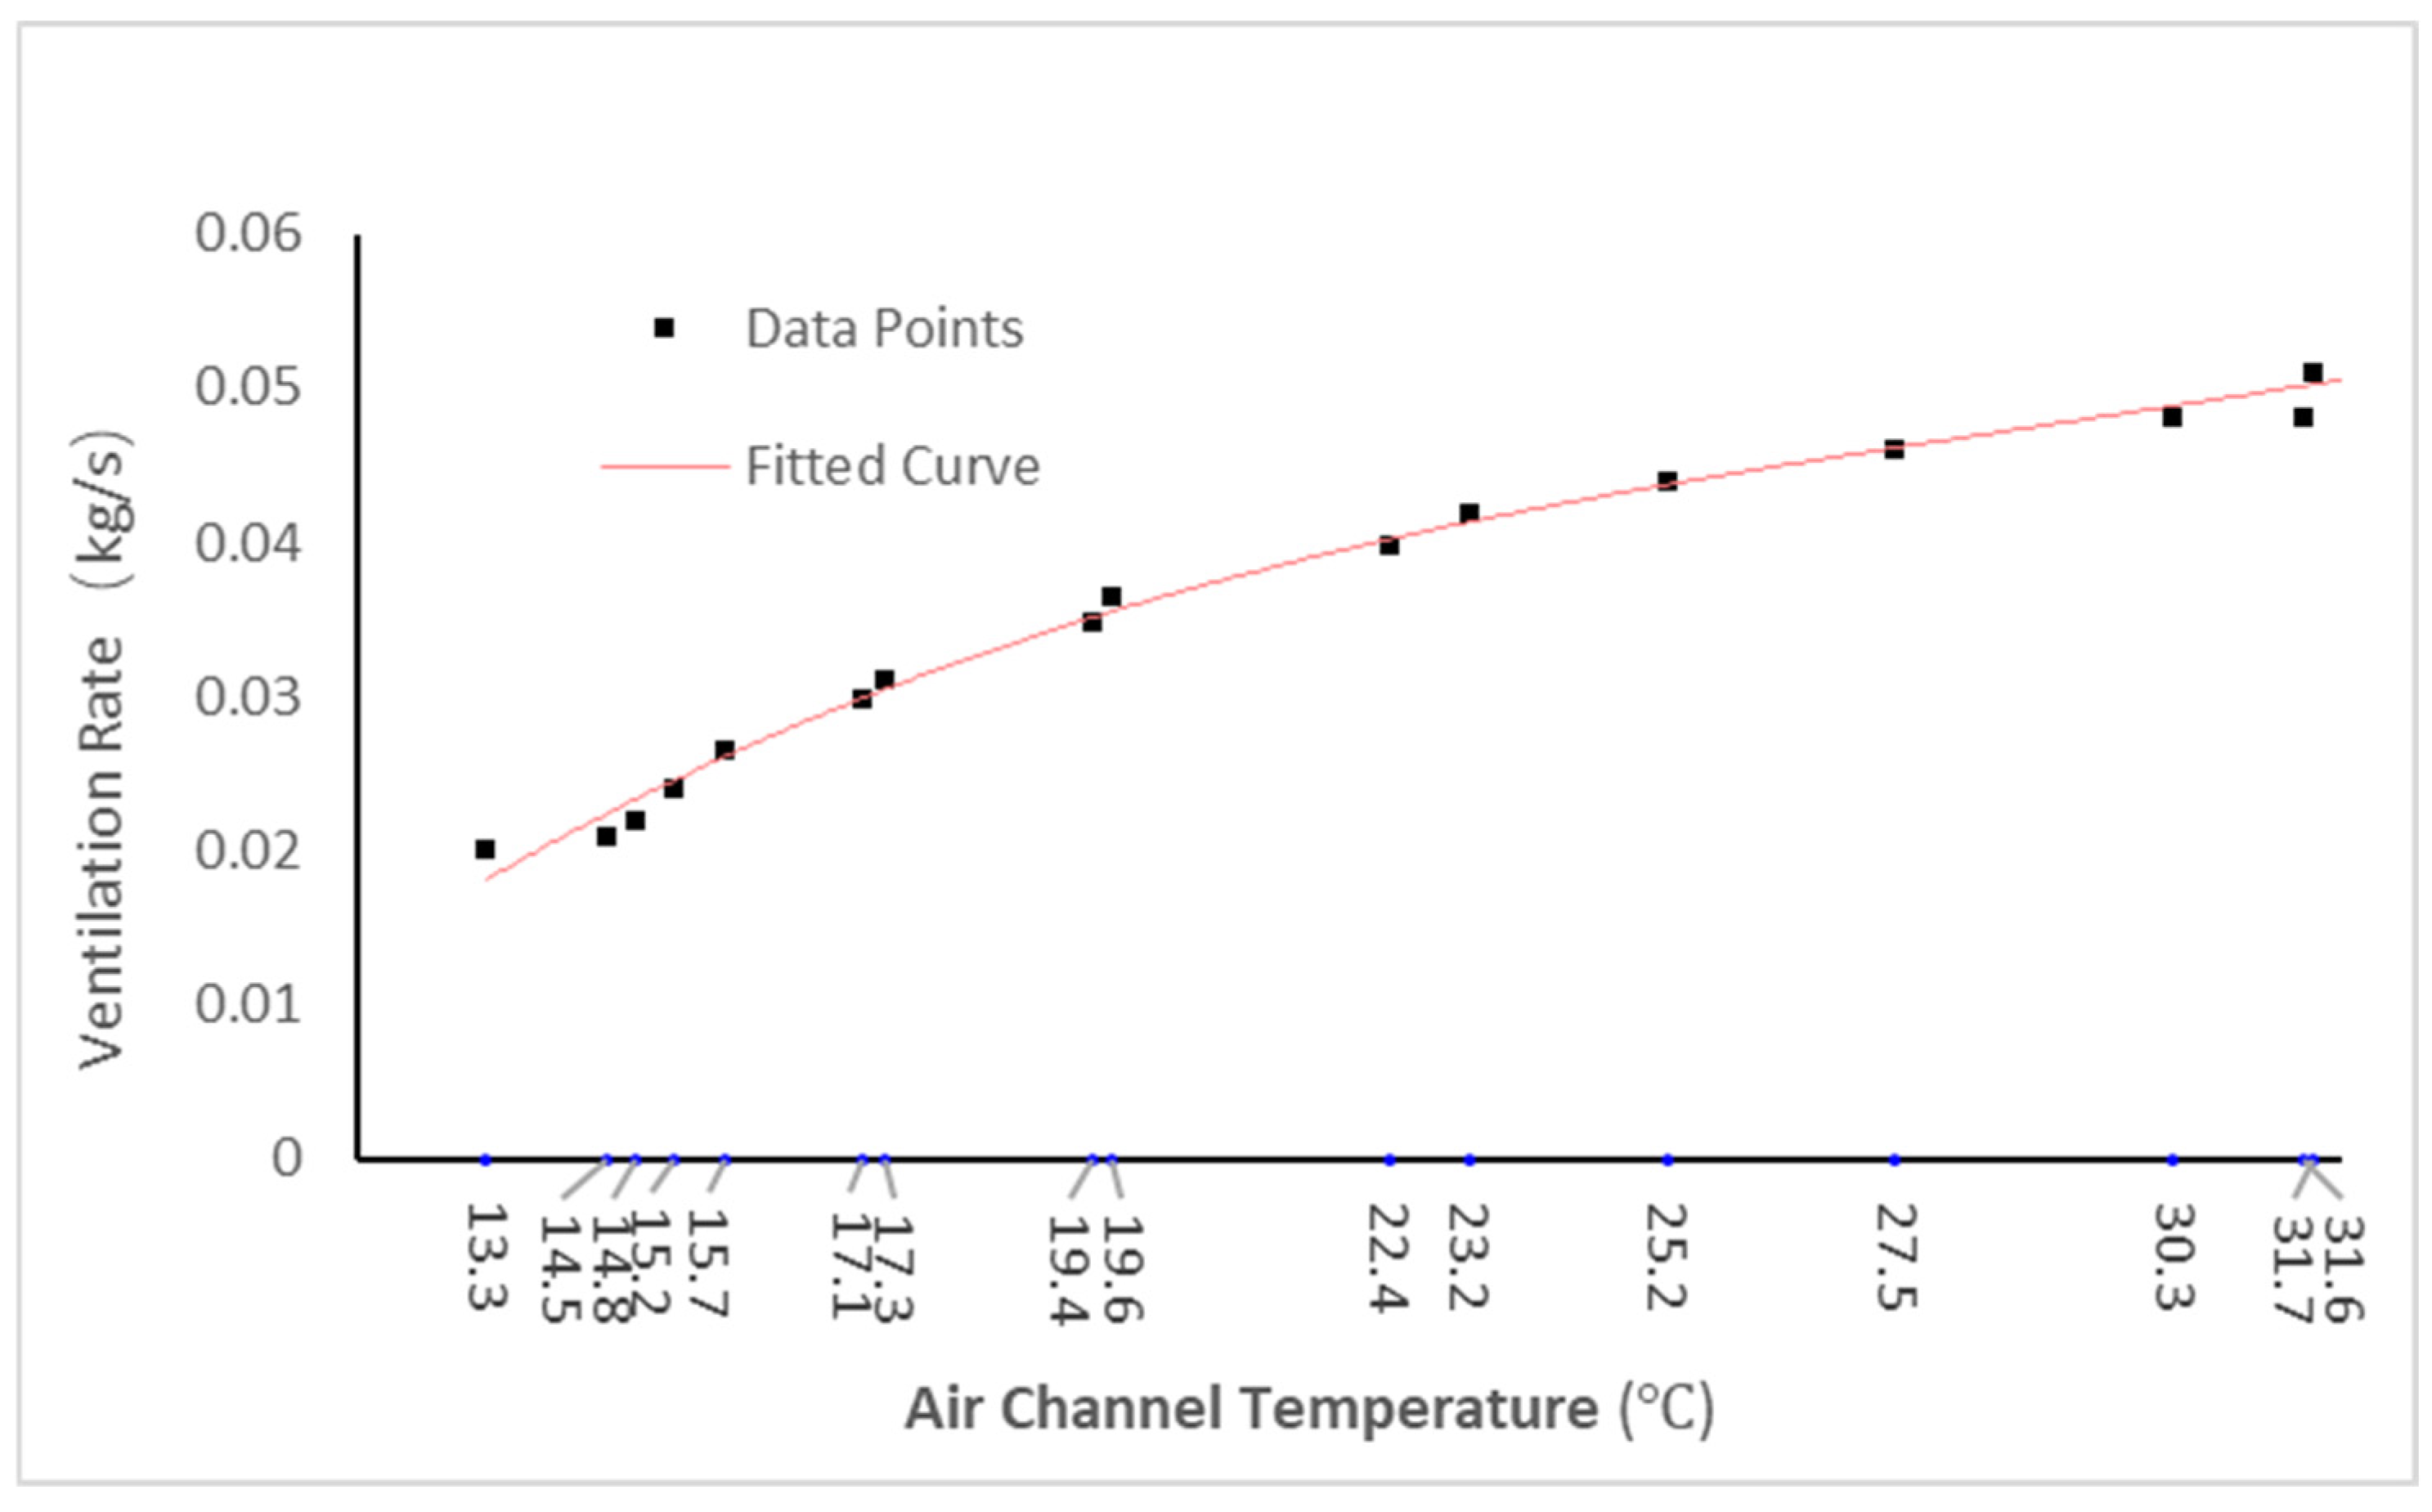
- The peak ventilation rate of the PCM-TW system is approximately 0.052 kg/s, slightly lower than the 0.06 kg/s of the TW system. However, the PCM-TW system exhibits a slower rate of increase in ventilation, with its peak occurring around 15:00, later than the peak time for the TW system. Moreover, the PCM-TW system maintains higher ventilation rates for a longer duration compared to the TW system. Due to the phase-change process slowing the temperature decrease, the ventilation rate of the PCM-TW system declines at a slower pace, stabilizing between 19:00 and 20:00, about one hour later than the TW system. Further analysis reveals that the ventilation rate of the PCM-TW system is positively correlated with air channel temperature, where an increase in channel temperature directly promotes an increase in ventilation.
6.1. Research Limitations
6.2. Future Research
Author Contributions
Funding
Data Availability Statement
Conflicts of Interest
References
- Zhang, T.; Tan, Y.; Yang, H.; Zhang, X. The application of air layers in building envelopes: A review. Appl. Energy 2016, 165, 707–734. [Google Scholar] [CrossRef]
- Liu, X.; Zhou, Y.; Zhang, G. Numerical study on cooling performance of a ventilated Trombe wall with phase change materials. In Building Simulation; Tsinghua University Press: Beijing, China; pp. 677–694.
- Cao, X.; Dai, X.; Liu, J. Building energy-consumption status worldwide and the state-of-the-art technologies for zero-energy buildings during the past decade. Energy Build. 2016, 128, 198–213. [Google Scholar] [CrossRef]
- Annex, E. International Energy Agency Energy Conservation in Buildings and Community Systems Programme; U.S. Department of Energy Office of Scientific and Technical Information: Oak Ridge, TN, USA, 1994. [Google Scholar]
- Zhai, X.; Song, Z.; Wang, R. A review for the applications of solar chimneys in buildings. Renew. Sustain. Energy Rev. 2011, 15, 3757–3767. [Google Scholar] [CrossRef]
- Gan, G. A parametric study of Trombe walls for passive cooling of buildings. Energy Build. 1998, 27, 37–43. [Google Scholar] [CrossRef]
- Lee, K.H.; Strand, R.K. Enhancement of natural ventilation in buildings using a thermal chimney. Energy Build. 2009, 41, 615–621. [Google Scholar] [CrossRef]
- Al-Kayiem, H.H.; Sreejaya, K.; Gilani, S.I.U.-H. Mathematical analysis of the influence of the chimney height and collector area on the performance of a roof top solar chimney. Energy Build. 2014, 68, 305–311. [Google Scholar] [CrossRef]
- Shi, L.; Zhang, G.; Cheng, X.; Guo, Y.; Wang, J.; Chew, M.Y.L. Developing an empirical model for roof solar chimney based on experimental data from various test rigs. Build. Environ. 2016, 110, 115–128. [Google Scholar] [CrossRef]
- Shi, L.; Zhang, G.; Yang, W.; Huang, D.; Cheng, X.; Setunge, S. Determining the influencing factors on the performance of solar chimney in buildings. Renew. Sustain. Energy Rev. 2018, 88, 223–238. [Google Scholar] [CrossRef]
- Ding, W.; Hasemi, Y.; Yamada, T. Natural ventilation performance of a double-skin façade with a solar chimney. Energy Build. 2005, 37, 411–418. [Google Scholar] [CrossRef]
- Wei, D.; Qirong, Y.; Jincui, Z. A study of the ventilation performance of a series of connected solar chimneys integrated with building. Renew. Energy 2011, 36, 265–271. [Google Scholar] [CrossRef]
- Mathur, J.; Bansal, N.; Mathur, S.; Jain, M. Experimental investigations on solar chimney for room ventilation. Sol. Energy 2006, 80, 927–935. [Google Scholar] [CrossRef]
- Chen, Z.D.; Bandopadhayay, P.; Halldorsson, J.; Byrjalsen, C.; Heiselberg, P.; Li, Y. An experimental investigation of a solar chimney model with uniform wall heat flux. Build. Environ. 2003, 38, 893–906. [Google Scholar] [CrossRef]
- Spencer, S.; Chen, Z.; Li, Y.; Haghighat, F. Experimental investigation of a solar chimney natural ventilation system. AIR Distrubution Rooms Vent. Health Sustain. Enviorn. 2000, 2, 813. [Google Scholar]
- Bassiouny, R.; Koura, N.S. An analytical and numerical study of solar chimney use for room natural ventilation. Energy Build. 2008, 40, 865–873. [Google Scholar] [CrossRef]
- Aboulnaga, M.M. A roof solar chimney assisted by cooling cavity for natural ventilation in buildings in hot arid climates: An energy conservation approach in Al-Ain city. Renew. Energy 1998, 14, 357–363. [Google Scholar] [CrossRef]
- Miyazaki, T.; Akisawa, A.; Kashiwagi, T. The effects of solar chimneys on thermal load mitigation of office buildings under the Japanese climate. Renew. Energy 2006, 31, 987–1010. [Google Scholar] [CrossRef]
- Balocco, C. A simple model to study ventilated facades energy performance. Energy Build. 2002, 34, 469–475. [Google Scholar] [CrossRef]
- Chantawong, P.; Hirunlabh, J.; Zeghmati, B.; Khedari, J.; Teekasap, S.; Win, M.M. Investigation on thermal performance of glazed solar chimney walls. Sol. Energy 2006, 80, 288–297. [Google Scholar] [CrossRef]
- Nguyen, Y.; Wells, J.C. A numerical study on induced flowrate and thermal efficiency of a solar chimney with horizontal absorber surface for ventilation of buildings. J. Build. Eng. 2020, 28, 101050. [Google Scholar] [CrossRef]
- Zamora, B.; Kaiser, A.S. Thermal and dynamic optimization of the convective flow in Trombe Wall shaped channels by numerical investigation. Heat Mass Transf. 2009, 45, 1393–1407. [Google Scholar] [CrossRef]
- El-Sawi, A.; Wifi, A.; Younan, M.; Elsayed, E.; Basily, B. Application of folded sheet metal in flat bed solar air collectors. Appl. Therm. Eng. 2010, 30, 864–871. [Google Scholar] [CrossRef]
- Mathur, J.; Anupma, M.S. Experimental investigation on four different types of solar chimneys. Adv. Energy Res. 2006, 12, 151–156. [Google Scholar]
- Lee, D.-S.; Hung, T.-C.; Lin, J.-R.; Zhao, J. Experimental investigations on solar chimney for optimal heat collection to be utilized in organic Rankine cycle. Appl. Energy 2015, 154, 651–662. [Google Scholar] [CrossRef]
- Hatami, N.; Bahadorinejad, M. Experimental determination of natural convection heat transfer coefficient in a vertical flat-plate solar air heater. Sol. Energy 2008, 82, 903–910. [Google Scholar] [CrossRef]
- Ong, K. A mathematical model of a solar chimney. Renew. Energy 2003, 28, 1047–1060. [Google Scholar] [CrossRef]
- Arce, J.; Jiménez, M.; Guzmán, J.; Heras, M.; Alvarez, G.; Xamán, J. Experimental study for natural ventilation on a solar chimney. Renew. Energy 2009, 34, 2928–2934. [Google Scholar] [CrossRef]
- Liu, B.; Ma, X.; Wang, X.; Dang, C.; Wang, Q.; Bennacer, R. Experimental study of the chimney effect in a solar hybrid double wall. Sol. Energy 2015, 115, 1–9. [Google Scholar] [CrossRef]
- Li, N.; Cao, X.; Zhang, G.; Wang, Y.; Hu, X.; Liu, J.; Yu, B.; Ji, J.; Liu, X. The experimental and numerical study on a novel all-day PCM thermal-catalytic purified Trombe wall in winter. Energy 2024, 299, 131397. [Google Scholar] [CrossRef]
- Zhou, S.; Song, M.; Shan, K.; Razaqpur, A.G.; Huang, J.J. Parametric and optimization analyses of a dynamic trombe wall incorporating PCM to save heating energy under cold climate zones. Renew. Energy 2024, 237, 121537. [Google Scholar] [CrossRef]
- Afonso, C.; Oliveira, A. Solar chimneys: Simulation and experiment. Energy Build. 2000, 32, 71–79. [Google Scholar] [CrossRef]
- Liu, H.; Li, P.; Yu, B.; Zhang, M.; Tan, Q.; Wang, Y.; Zhang, Y. Contrastive analysis on the ventilation performance of a combined solar chimney. Appl. Sci. 2021, 12, 156. [Google Scholar] [CrossRef]
- Hodzic, N.; Pont, U.; Tahmasebi, F.; Mahdavi, A. Overheating mitigation in buildings: A computational exploration of the potential of phase change materials. In Proceedings of the 4th Central European Symposium on Building Physics (CESBP 2019), Prague, Czech Republic, 2–5 September 2019; p. 02028. [Google Scholar]
- Barzin, R.; Chen, J.J.; Young, B.R.; Farid, M.M. Application of PCM energy storage in combination with night ventilation for space cooling. Appl. Energy 2015, 158, 412–421. [Google Scholar] [CrossRef]
- Lam, J.C.; Yang, L.; Liu, J. Development of passive design zones in China using bioclimatic approach. Energy Convers. Manag. 2006, 47, 746–762. [Google Scholar] [CrossRef]
- Hou, Y.; Li, H.; Li, A. Experimental and theoretical study of solar chimneys in buildings with uniform wall heat flux. Sol. Energy 2019, 193, 244–252. [Google Scholar] [CrossRef]
- Zhao, S.-S.; He, W.-P. Performance evaluation of the simulated daily average temperature series in four seasons in China by Beijing Climate Center climate system model. Acta Phys. Sin. 2015, 64, 049201. [Google Scholar] [CrossRef]
- Nikas, K.-S.; Nikolopoulos, N.; Nikolopoulos, A. Numerical study of a naturally cross-ventilated building. Energy Build. 2010, 42, 422–434. [Google Scholar] [CrossRef]
- Sergei, K.; Shen, C.; Jiang, Y. A review of the current work potential of a trombe wall. Renew. Sustain. Energy Rev. 2020, 130, 109947. [Google Scholar] [CrossRef]
- Du, L.; Ping, L.; Yongming, C. Study and analysis of air flow characteristics in Trombe wall. Renew. Energy 2020, 162, 234–241. [Google Scholar] [CrossRef]
- Fluent, A. Ansys fluent theory guide. Ansys Inc. USA 2011, 15317, 724–746. [Google Scholar]
- Gowda, B.K.; Rajagopal, M.; Seetharamu, K. Heat transfer in a side heated trapezoidal cavity with openings. Eng. Sci. Technol. Int. J. 2019, 22, 153–167. [Google Scholar] [CrossRef]
- Nguyen, Y.Q.; Nguyen, V.T.; Tran, L.T.; Wells, J.C. CFD analysis of different ventilation strategies for a room with a heated wall. Buildings 2022, 12, 1300. [Google Scholar] [CrossRef]
- Bulmez, A.; Ciofoaia, V.; Năstase, G.; Dragomir, G.; Brezeanu, A.; Şerban, A. An experimental work on the performance of a solar-assisted ground-coupled heat pump using a horizontal ground heat exchanger. Renew. Energy 2022, 183, 849–865. [Google Scholar] [CrossRef]
- Singh, A.P.; Kumar, A.; Singh, O. Effect of integrating high flow naturally driven dual solar air heaters with Trombe wall. Energy Convers. Manag. 2021, 249, 114861. [Google Scholar] [CrossRef]
- Khanal, R.; Lei, C. A numerical investigation of buoyancy induced turbulent air flow in an inclined passive wall solar chimney for natural ventilation. Energy Build. 2015, 93, 217–226. [Google Scholar] [CrossRef]
- Evola, G.; Marletta, L.; Sicurella, F. A methodology for investigating the effectiveness of PCM wallboards for summer thermal comfort in buildings. Build. Environ. 2013, 59, 517–527. [Google Scholar] [CrossRef]
- Rabani, M.; Kalantar, V.; Faghih, A.K.; Rabani, M.; Rabani, R. Numerical simulation of a Trombe wall to predict the energy storage rate and time duration of room heating during the non-sunny periods. Heat Mass Transf. 2013, 49, 1395–1404. [Google Scholar] [CrossRef]
- Al-Saadi, S.N.; Zhai, Z.J. Modeling phase change materials embedded in building enclosure: A review. Renew. Sustain. Energy Rev. 2013, 21, 659–673. [Google Scholar] [CrossRef]
- Rabani, M.; Kalantar, V.; Rabani, M. Passive cooling performance of a test room equipped with normal and new designed Trombe walls: A numerical approach. Sustain. Energy Technol. Assess. 2019, 33, 69–82. [Google Scholar] [CrossRef]
- Khetib, Y.; Alotaibi, A.A.; Alshahri, A.H.; Cheraghan, G.; Sharifpur, M.; Meyer, J.P. Study on the effect of hole size of trombe wall in the presence of phase change material for different times of a day in winter and summer. Processes 2021, 9, 1886. [Google Scholar] [CrossRef]
- Lipnicki, Z.; Gortych, M.; Staszczuk, A.; Kuczyński, T.; Grabas, P. Analytical and experimental investigation of the solar chimney system. Energies 2019, 12, 2060. [Google Scholar] [CrossRef]
- Zeraati Dizjeh, S.; Brinkerhoff, J. Stability of buoyancy-driven flow in a vertical channel with one heated wall. Phys. Fluids 2021, 33, 084103. [Google Scholar] [CrossRef]
- Duan, S.; Jing, C.; Long, E. Transient flows in displacement ventilation enhanced by solar chimney and fan. Energy Build. 2015, 103, 124–130. [Google Scholar] [CrossRef]


| Material | Density (kg/m3) | Thermal Conductivity (W/m·K) | Specific Heat Capacity (J/(kg·K)) | Latent Heat of Phase-Change (kJ/kg) |
|---|---|---|---|---|
| Glass Cover | 2500 | 0.75 | 837.4 | - |
| Brick Layer | 1400 | 0.58 | 1050 | - |
| Phase-change Material | 1475 | 0.43 | 2200 | 155 |
| Insulation Material | 100 | 0.047 | 1380 | - |
| Time (h) | Absorber Surface Temperature 1 (°C) | Channel Temperature 1 (°C) | Absorber Surface Temperature 2 (°C) | Channel Temperature 2 (°C) |
|---|---|---|---|---|
| 6:00 | 15 | 13.3 | 15 | 15 |
| 7:00 | 16.2 | 14.5 | 17.5 | 16 |
| 8:00 | 17.1 | 14.8 | 20.8 | 18.2 |
| 9:00 | 19 | 15.7 | 25.4 | 21 |
| 10:00 | 22 | 17.3 | 30.6 | 25.5 |
| 11:00 | 25.9 | 19.6 | 38.2 | 30.2 |
| 12:00 | 31.8 | 22.4 | 45.1 | 35 |
| 13:00 | 36.9 | 25.2 | 50.1 | 38.5 |
| 14:00 | 42.1 | 30.3 | 54.2 | 40 |
| 15:00 | 45.9 | 32.1 | 49.5 | 38.2 |
| 16:00 | 43.8 | 31.7 | 43.1 | 34.5 |
| 17:00 | 41.5 | 31.6 | 35 | 28.5 |
| 18:00 | 37.2 | 27.5 | 23 | 22 |
| 19:00 | 32.1 | 23.2 | 20.5 | 19.5 |
| 20:00 | 25.2 | 19.4 | 18.5 | 18 |
| 21:00 | 21.3 | 17.1 | 17 | 17 |
| 22:00 | 17.2 | 15.2 | 16.5 | 16 |
| Condition | Traditional Trombe Wall | PCM Trombe Wall |
|---|---|---|
| 14:00 |  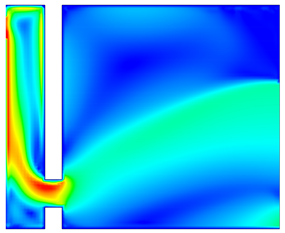 |  |
| 15:00 |  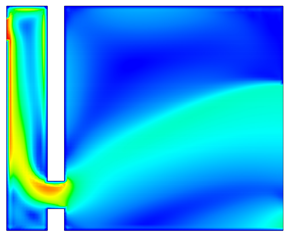 | 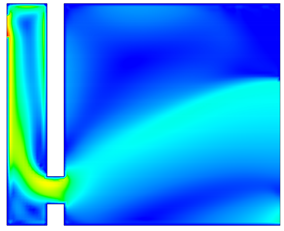 |
| 16:00 | 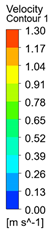 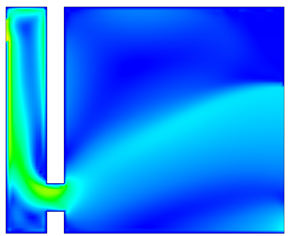 | 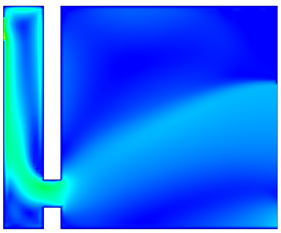 |
| 18:00 | 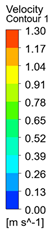  |  |
| 19:00 | 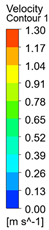  |  |
Disclaimer/Publisher’s Note: The statements, opinions and data contained in all publications are solely those of the individual author(s) and contributor(s) and not of MDPI and/or the editor(s). MDPI and/or the editor(s) disclaim responsibility for any injury to people or property resulting from any ideas, methods, instructions or products referred to in the content. |
© 2025 by the authors. Licensee MDPI, Basel, Switzerland. This article is an open access article distributed under the terms and conditions of the Creative Commons Attribution (CC BY) license (https://creativecommons.org/licenses/by/4.0/).
Share and Cite
Xu, R.; Zhang, Y.; Lou, S.; Chen, X.; Zhang, G.; Chen, Z. Simulation-Based Natural Ventilation Performance Assessment of a Novel Phase-Change-Material-Equipped Trombe Wall Design: A Case Study. Buildings 2025, 15, 1239. https://doi.org/10.3390/buildings15081239
Xu R, Zhang Y, Lou S, Chen X, Zhang G, Chen Z. Simulation-Based Natural Ventilation Performance Assessment of a Novel Phase-Change-Material-Equipped Trombe Wall Design: A Case Study. Buildings. 2025; 15(8):1239. https://doi.org/10.3390/buildings15081239
Chicago/Turabian StyleXu, Rui, Yanfei Zhang, Shaoyang Lou, Xu Chen, Guoyi Zhang, and Zhonggou Chen. 2025. "Simulation-Based Natural Ventilation Performance Assessment of a Novel Phase-Change-Material-Equipped Trombe Wall Design: A Case Study" Buildings 15, no. 8: 1239. https://doi.org/10.3390/buildings15081239
APA StyleXu, R., Zhang, Y., Lou, S., Chen, X., Zhang, G., & Chen, Z. (2025). Simulation-Based Natural Ventilation Performance Assessment of a Novel Phase-Change-Material-Equipped Trombe Wall Design: A Case Study. Buildings, 15(8), 1239. https://doi.org/10.3390/buildings15081239