Article

Indoor Air Pollution Source Localization Based on Small-Sample Training Convolutional Neural Networks

School of Architecture and Urban Planning, Huazhong University of Science and Technology, Wuhan 430074, China
*
Author to whom correspondence should be addressed.
Buildings 2025, 15(8), 1244; https://doi.org/10.3390/buildings15081244
Submission received: 11 March 2025 / Revised: 4 April 2025 / Accepted: 8 April 2025 / Published: 10 April 2025
(This article belongs to the Special Issue New Technologies in Assessment of Indoor Environment)

Abstract

:
In addressing the problem of indoor air pollution source localization, traditional methods have limitations such as strong sample dependence and low computational efficiency. This study uses a convolutional neural network to establish a pollution source inversion method based on small samples. By integrating computational fluid dynamics simulation data and deep learning techniques, a spatial pollution source identification model suitable for limited-sample conditions was constructed. In a benchmark scenario, the optimized model achieved a localization of 82.3% weighted accuracy within a prediction radius of 1 m, and the corresponding normalized error of the detected area was of less than 0.26%. In cross-scenario verification, the localization accuracy within a 1 m radius increased to 100%, and the corresponding predicted Euclidean distance error decreased by 21.43%. By using the optimal cutting ratio (α = 0.25) and a rotation-enhanced dataset (θ = 10°, n = 36), the model reduced the cross-space sample requirement to 1/5 of that of the benchmark scenario while ensuring the accuracy of spatial representation. The research findings provide an efficient and reliable deep learning solution for the localization of pollution sources in complex spaces.

1. Introduction

Inverse source identification (ISI) of indoor air pollution sources is a core topic in environmental safety. In the face of unexpected gas leakage or sudden release of harmful pollutants indoors, accurate identification of the source is crucial for minimizing the spread of pollution, to protect the health of occupants and formulate effective mitigation strategies [1]. For instance, in a large-scale industrial workshop or crowded commercial buildings, rapid and precise source identification can prevent potential disasters and ensure environmental safety [2,3,4,5,6,7]. In addition, in recent years, neural networks have also been extensively applied and studied in various industries. For example, in the field of air pollution, neural networks are used to optimize the number of sensors and predict the locations of pollution sources. For instance, by combining CFD and MILP, high-precision positioning of illegal e-waste incineration sites can be achieved [8]. In the intelligent detection of cracks in tunnel segments, the YOLOv8 algorithm is used to automatically extract crack shapes and perform high-precision measurements [8]. Moreover, in building structures, neural networks are used to predict the displacement response of building structures, etc. [9]. Moreover, neural networks excel in energy consumption simulation and pollution source finding. Lei et al. [10] put forward a building energy consumption prediction model integrating rough set theory and deep learning algorithms, enabling effective energy consumption analysis and prediction. For pollution source identification, Bakht et al. [11] developed a deep-learning-based indoor air quality forecasting framework for subway platforms, which aids in pinpointing pollution sources and enhancing air quality. Martin proposed a confusion-matrix-based classification error visualization method for CNN, and devaluated hierarchical classifiers. Small batch sizes, etc., improved accuracy, while learned color transformations’ impact was unconfirmed. The model beat state-of-the-art ones but existing methods had limitations [12]. Shiv Ram Dubey et al. presented diffGrad, an optimizer adjusting step-sizes by gradient differences. It outperformed others on datasets, yet its large-scale stability and scalability need verification [13]. Ossama Abdel-Hamid et al. extended CNN, developed a weighted softmax pooling layer. New CNN architectures outdid early DNNs in speech tasks, and the softmax layer showed improvement potential [14]. Gousia Habib et al. introduced CNN’s architecture evolution and three speed-up strategies (SGD, fast convolution, parallel tech), showing feasible training acceleration [15]. These studies advanced CNN and DCNN, enhancing large-scale training. But each method has flaws, like optimizer generalization and parallel algorithm issues needing attention.
Traditional inversion methods for ISI can be broadly classified into two main categories. The first is the gradient optimization method based on a fixed sensor network [16]. This approach relies on a preinstalled set of sensors placed at strategic locations throughout an indoor environment. These sensors continuously collect data on gas concentrations, and the gradient optimization algorithm uses them to estimate the source location. However, this method has several limitations. One of the most prominent problems is the time-consuming calculation of the Jacobian matrix. The Jacobian matrix is used to describe the relationship between the source parameters and measured data, and its computation involves complex mathematical operations that can take a long time, particularly when large-scale indoor spaces are involved. Moreover, the gradient optimization method has a strong tendency to fall into local optima. Consequently, the algorithm may converge to a suboptimal solution that is not the true source location because it becomes trapped in a local minimum of the objective function and fails to explore the entire solution space to find the global optimum [17].
The second category includes the active olfaction methods for mobile robots [18]. Mobile robots equipped with gas sensors can actively move around in an indoor environment and search for a gas source. This method has the distinct advantage of a dynamic search. Unlike fixed-sensor networks, mobile robots can adjust their paths according to the real-time gas concentration information they collect, which allows them to explore areas that are difficult to cover with a fixed-sensor layout. However, its applicability is limited in complex large-scale spaces. In such environments, numerous obstacles, complex airflow patterns, and large distances may exist. These factors can make it challenging for mobile robots to navigate effectively, leading them to consume a significant amount of energy during the search process. Additionally, the communication between mobile robots and control centers may be affected by interference in complex spaces, which can further reduce the efficiency of the source identification process [8,19,20,21].
The harm of air pollution to global public health presents multi-dimensional characteristics, covering both outdoor pollution and indoor air pollution problems. Multiple studies have confirmed that air pollutants cause systematic harm to human health through different exposure pathways [22]. Research shows that outdoor gaseous and particulate pollutants can significantly exacerbate the clinical symptoms of patients with respiratory diseases. Epidemiological data indicate a clear association between them and the incidence of asthma attacks and emergency department visit rates [23]. It is further pointed out that CO, SO2, NOx and inhalable particulate matter produced by the combustion of fossil fuels not only trigger acute respiratory symptoms but also lead to serious consequences such as chronic cardiopulmonary diseases and lung cancer, and even shorten the life expectancy. It is particularly noteworthy that [24] reveals the indoor air pollution crisis faced by developing countries. It points out that about half of the world’s population (mainly in developing countries) relies on biomass fuels (such as wood, manure, and crop residues) for cooking and heating. These fuels produce a large amount of harmful substances when incompletely burned, exposing women and children to high-concentration pollutants for a long time. This exposure not only significantly increases the risk of chronic obstructive pulmonary disease but is also an important cause of acute lower respiratory infections in children (the leading cause of death among children under 5 in developing countries). It is also closely related to health problems such as low birth weight, increased infant mortality, tuberculosis, nasopharyngeal cancer, and cataracts. Studies estimate that indoor air pollution causes nearly 2 million excess deaths in developing countries each year, accounting for 4% of the global disease burden. These studies together indicate that the health hazards of air pollution are complex and systematic, including outdoor pollution problems brought about by industrialization and the indoor pollution crisis caused by energy poverty [24]. Comprehensive environmental governance and public health intervention measures are needed. In indoor and urban settings, identifying and managing air pollution sources is vital for air quality and public health. Researchers worldwide use diverse methods to enhance accuracy and efficiency. Qin et al. [25] investigated indoor air pollution from household coal combustion, analyzing the tempo-spatial distribution of gaseous pollutants and semi-quantifying source contributions. Their study provides important insights into indoor air quality issues related to specific pollution sources. Cheng’s team used an adjoint-probability-based inverse tracking method to locate pollutants under unsteady airflow, solving the unknown release-time problem. Yet, high computational demands limit its practical use. Zhang and Yin proposed a CFD inversion method for quantifying pollutant release rates, but it depends on a stable flow field and known source locations [26,27]. Kim et al. [28] focused on the optimal location and performance prediction of portable air cleaners in composite room shapes using a convolutional neural network. This research is significant for improving indoor air quality through effective air-cleaning device deployment. For particulate source localization, Zhang’s group employed QR and LR models, with QR showing a slight edge in accuracy and computation. Yang’s automated robots with mobile sensors showed advantages in source location and dynamic monitoring, cutting infrastructure costs [29,30]. Fong et al. [31] used transfer learning and recurrent neural networks to predict air pollutant concentration levels. Their work offers a new approach to air quality prediction. Zhang’s team developed a new adjoint probability method to identify urban pollution sources, overcoming traditional limitations. They coupled building effect parameterization and energy models in the WRF model, verified in Hong Kong. It can quickly find sources with limited sensor data, offering new urban monitoring ideas. Despite needing detailed parameterization and having potential city-specific limitations, it is a significant advancement [32].
In recent years, significant progress has been made in the integration of computational fluid dynamics (CFD) and machine learning. Zhang et al. [33] constructed a contamination–machine learning (CONTAM-ML) hybrid model, achieving a 90% improvement in the accuracy of pollutant source tracing; however, prior information on source intensity is required. Zhou et al. [34] proposed a convolutional neural network (CNN)–physical coupling framework that reduces the positioning error in street canyons to 2.8 m; however, its generalization ability is restricted by the accuracy of the turbulence model. Lang et al. [35] developed a CFD–artificial neural network (ANN)–mixed-integer linear programming system, achieving 97.22% accuracy in the positioning of electronic waste, but it required more than 5000 training samples (n > 5000).
In general, existing methods focus on improving the accuracy of source tracing to reduce positioning errors and enhance positioning accuracy in different application scenarios. These benefits are evident in high-precision results and the ability to provide solutions for specific environmental problems. However, these methods exhibit two major limitations. First, data requirements are contradictory. Some methods require a large amount of training data, whereas others rely on prior information. Obtaining such data can be challenging, time-consuming, and costly. Second, the spatial generalization ability is limited. For example, the performance of the CNN–physical coupling framework is affected by the accuracy of the turbulence model in different spatial scenarios; therefore, it may not perform well in all types of spaces. Thus, future research should aim to address these two bottlenecks to develop more practical and widely applicable integration methods for CFD and machine learning [36].
In response to the above problems, this study used a CNN to establish a pollution source inversion method based on small samples. A finite representative dataset was generated through steady-state calculations based on CFD without considering the time factor. This dataset covers the spatial distribution characteristics of pollutants from different pollution sources in target space. Subsequently, a small-sample neural network optimization algorithm was used to optimize the generated data. Finally, a pollution source inversion neural network model was constructed for a specific space, with high accuracy (Figure 1).

2. Indoor Pollution Source Inversion CNN Method Based on Small-Sample Data

2.1. Data Generation and Augmentation

To construct an inversion method suitable for single-pollution-source localization in large-scale spaces under small-sample conditions, we first established an idealized rectangular space S i d e a l   = 30 × 40 × 4 m3 (Figure 2), with the scale conforming to that of a typical large-scale office space [37]. To ensure ideal conditions for fluid motion, no obstacles were set in S i d e a l , and an air inlet and outlet, each with a size of 1 × 1 m2, were set at symmetric positions on the side walls of the space [38].
To comprehensively characterize the spatial distribution characteristics of pollution sources, the target space was discretized into 48 pollution source units (0.1 × 0.1 m2). The boundary conditions were set to U i   =   V i   = 0.5 m/s. The convection-diffusion equation
· u C = D 2 C + Q s δ ( x x s ) )
was solved using a numerical simulation method. In Equation (1), u is the velocity field, and Q is the source intensity with a value of 0.01 kg/s. The distribution of the steady-state pollutant concentration field under 48 different pollution source locations was calculated (see Appendix A for details). Considering the wide applicability of CO2 as a tracer gas in the study of indoor airflow, CO2 was selected as the target pollutant [39].
In terms of the detection level setting and based on the principle of ergonomics, the pollutant concentration monitoring plane was set at a height of 1.5 m from the ground. This height is consistent with the height of the human breathing zone (mouth and nose) and effectively reflects the actual human exposure level. To simplify the computational complexity, this study focused on the two-dimensional pollutant concentration distribution characteristics in the X–Y plane. This assumption significantly reduces the computational burden on the model while ensuring computational accuracy [40].
In response to the requirements of data dimension simplification and concentration feature enhancement, a multistage data-preprocessing method was established. First, based on the linear positive correlation between the concentration and grayscale values, the concentration field C(x,y,z) was encoded into a grayscale image [17]:
I x , y = 255 × C x , y , 1.5 m C m i n C m a x C m i n
Subsequently, a grid-based cutting strategy was adopted to segment the original images. Each sub-image inherits the coordinate system information of the original image, and the data volume is expanded through spatial decomposition. To further expand the dataset, a data augmentation technique based on Galilean invariance was introduced; 36 rotation transformations were performed with a step size of θ = 10°, which improved sample diversity while maintaining the characteristics of the physical field. Finally, data with a low signal-to-noise ratio were screened based on the dynamic threshold mechanism, setting the grayscale threshold value to T = 250 (which can be adjusted according to the task requirements), and data samples with a minimum grayscale value below the threshold were removed [41].
For model construction, a CNN-based pollution source coordinate regression architecture was designed. The model used preprocessed pollutant distribution sub-images as the input. By cascading feature extraction and fully connected regression modules, the end-to-end prediction of the spatial coordinates (x, y) of the pollution source was realized [42]. Referring to previous research [43], the initial network architecture included one convolutional module and a fully connected layer. The 0–1 initialization method was used. By controlling the variables, different network architectures were compared and analyzed, focusing on optimizing key parameters, such as convolutional kernel size, number of channels, and the activation function [43].
In terms of the training strategy, a dynamic learning rate adjustment mechanism and a hybrid loss function optimization method were adopted. To prevent overfitting, the loss curve of the validation set was monitored using an early stopping method, and training was terminated when there was no improvement over 10 consecutive epochs. A multi-index joint evaluation system was used for performance evaluation, including the coefficient of determination R2, normalized Euclidean distance (NED), and weighted accuracy (WA) based on the probability density [44]. Notably, a negative R2 value indicates that the model’s prediction ability significantly deviates from the benchmark level. In this case, the Euclidean distance and WA indicators lose their statistical significance. Only the R2 of NED and WA were quantitatively compared [45,46]. All experiments were implemented using the PyTorch (2.1.1) framework, and the Adam optimizer was used for parameter updating.
This study optimized the pollution source location model through a three-stage operation, aiming to improve model performance and generalization ability in the pollution source location task and provide an effective solution for feature-sensitive remote sensing location tasks (Figure 1).
The first stage is data preprocessing based on small-sample methods. The main purpose of this stage is to address the issue of insufficient generalization ability of small-sample data by providing high-quality and diverse data for subsequent model training. This stage consists of two steps:
  • Image cutting: First, for the original image of size 40 × 30 m2, the cutting operation was applied with a cutting ratio of α = 0.25, determined by research. This operation accurately divides the original image into multiple sub-images with a size of 12 × 12 m2. This approach was adopted because an appropriate image segmentation size can capture the features related to the pollution source more precisely, avoiding the problem of feature information overdispersion due to overly large images or the loss of key information due to overly small images. Meanwhile, by using these methods, the amount of data can be significantly increased, and the learning efficiency of ResNet can be enhanced.
  • Data augmentation: After image cutting was completed, a rotation operation was used to augment the data of the cut sub-images. Specifically, the sub-images were rotated with a rotation step of θ = 10°, to generate n = 48 × 36 = 1728 augmented samples. The function of data augmentation is to increase the diversity and richness of the data, enabling the model to learn the features of pollution sources of different forms from different angles, thereby effectively improving model generalizability in practical applications, to better cope with various complex real-world scenarios (Figure 3).
The second stage is model construction. This stage centers around designing an efficient network structure to accurately extract the features of pollution sources, avoid feature redundancy, and improve model performance and efficiency. This stage consists of three steps (Figure 4).
  • Residual network design: A nine-layer residual network was designed. As the network depth increases, the model can extract more in-depth image feature information. In this model, the nine-layer residual network can effectively capture the complex features of the pollution sources. Because of the skip connection mechanism in the network, when the network depth reaches a certain level, the feature information can be directly transmitted to subsequent network layers through the shortcut path, avoiding problems such as gradient vanishing and ensuring that the model can still maintain a good performance improvement effect when the number of network layers is increased.
  • Convolutional kernel selection: After further research and experimental comparisons, a 4 × 4 convolutional kernel was selected because the size of this convolutional kernel is similar to the scale of the pollution source features and can capture the spatial features of the concentration distribution more accurately during the feature extraction process, thereby enabling the model to identify and locate pollution sources more accurately.
  • Simplification of the fully connected layer: The fully connected layer was simplified to a single layer (FC = 1). A single-layer fully connected network architecture exhibits better performance than a multilayer fully connected network. Therefore, in the CNN constructed in this study, the feature extraction layer fully captures highly relevant feature information. The number of neurons in the network was set at the optimal level. Simplifying the fully connected layer can avoid feature redundancy, reduce the computational complexity of the model, and improve training and inference efficiency.
The final stage entails performance verification. The main task of the performance verification stage is to evaluate the performance of the optimized model, comparing it with that of a baseline model to verify the effectiveness of the optimization method. This stage includes the following two steps:
  • Comparative evaluation: The optimized model was comprehensively compared with the baseline model ( N L = 1 ,   K S = 1 × 1 ). Model performance improvement was evaluated using WA, coefficient of determination (R2), and accuracy of the Euclidean distance between model-predicted coordinates and real coordinates.
  • Performance improvement results: The WA of the optimized model increased significantly (by 17%), indicating that the model’s performance in the overall classification and prediction tasks was greatly improved. Simultaneously, the accuracy of the Euclidean distance between the model-predicted and real coordinates within 1 m exceeded 75%, indicating that the positioning accuracy of the model was significantly improved, allowing the location of pollution sources to be determined more accurately. In addition, the coefficient of determination (R2) reached 0.99, indicating that the model fit to the data and explained the changes and laws in the data well [47].
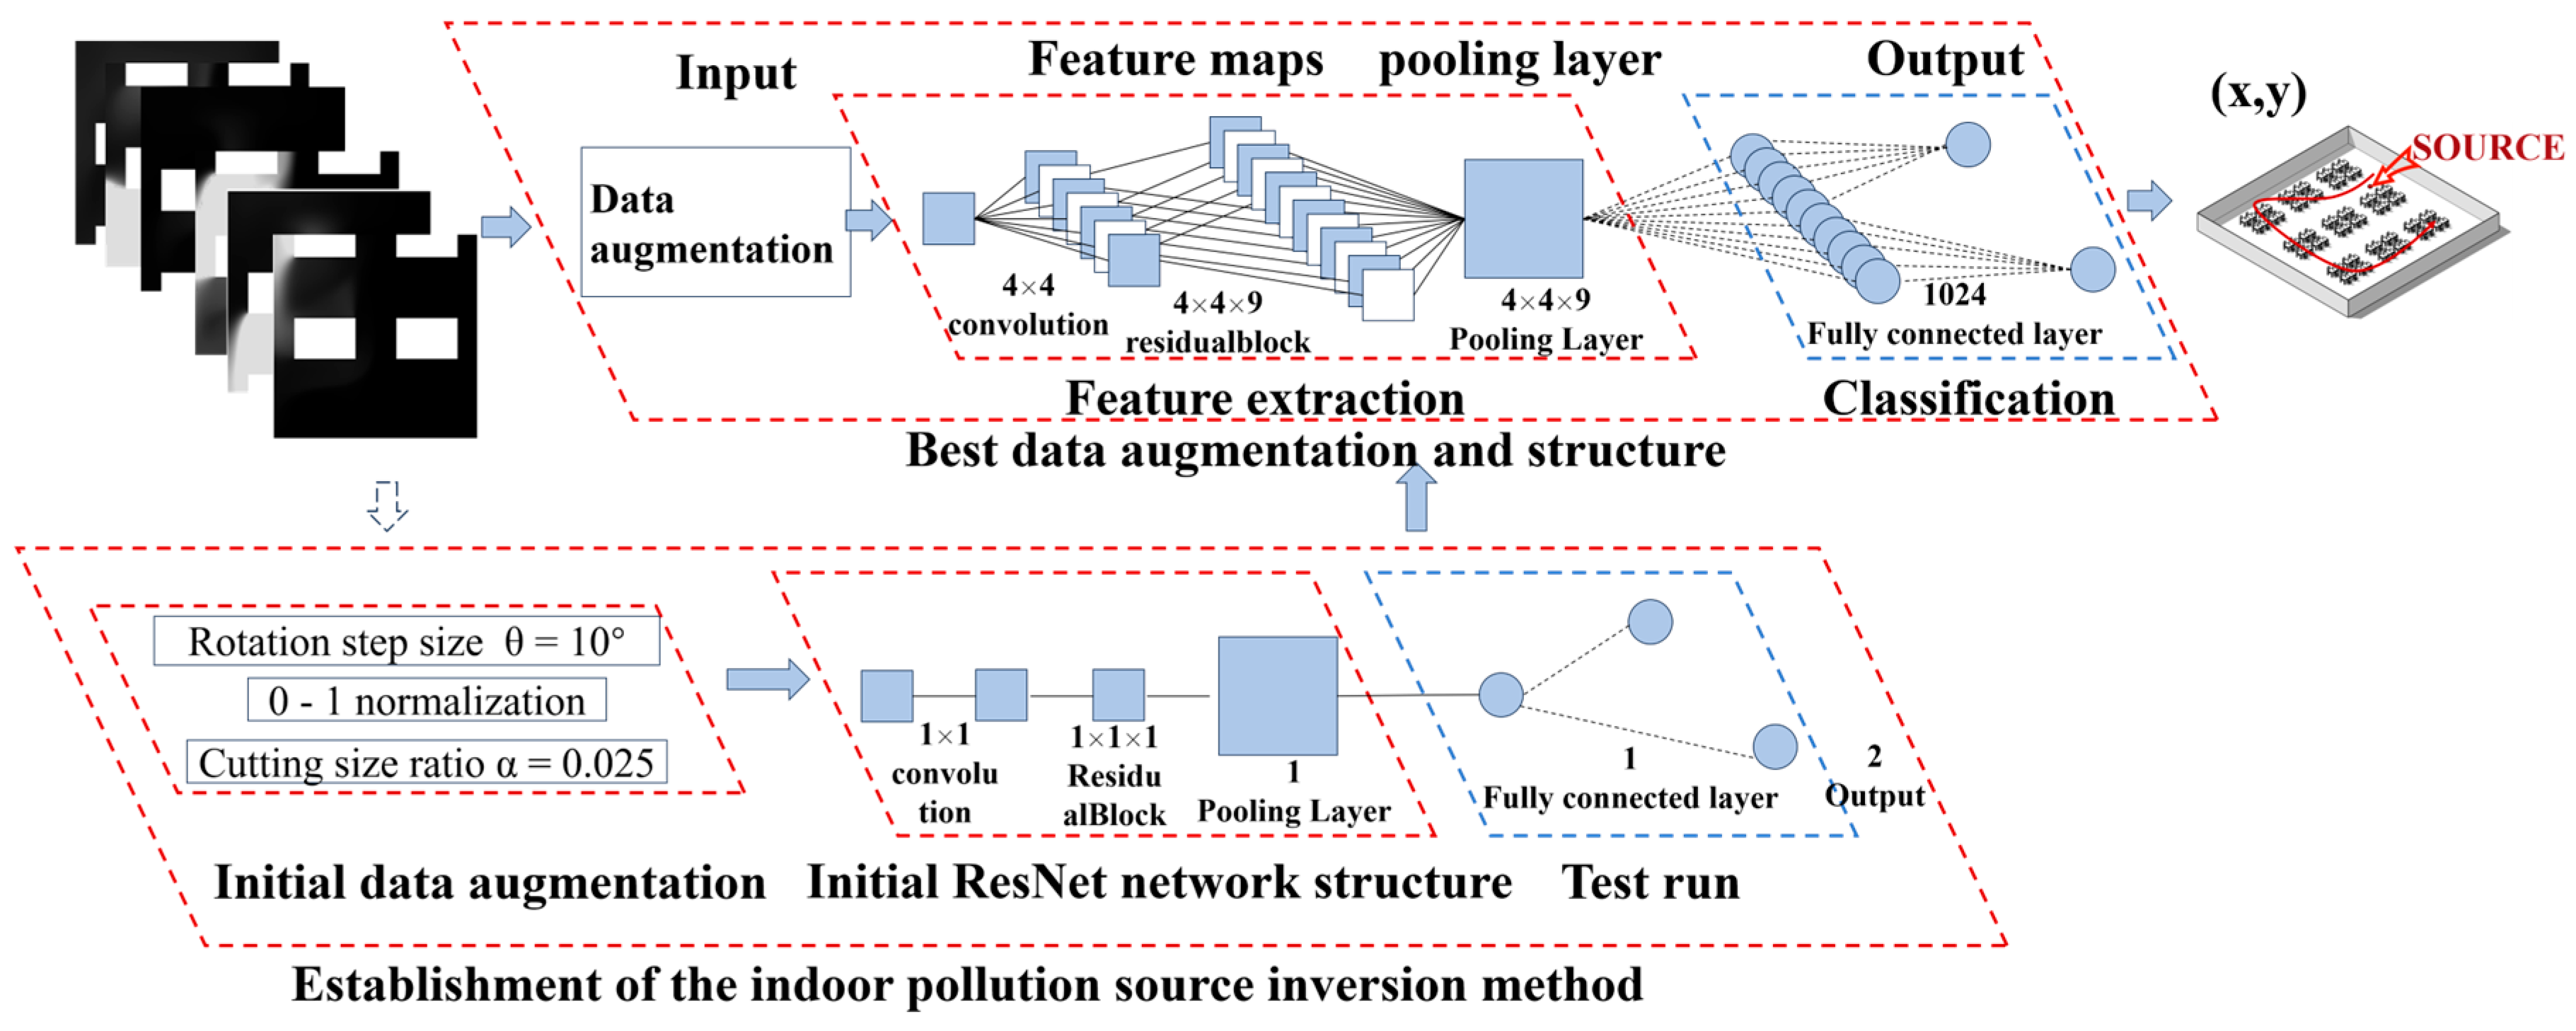
Figure 4. Process for pollution source inversion method.
Buildings 15 01244 g004

2.2. Results of Establishing the Source Inversion Method

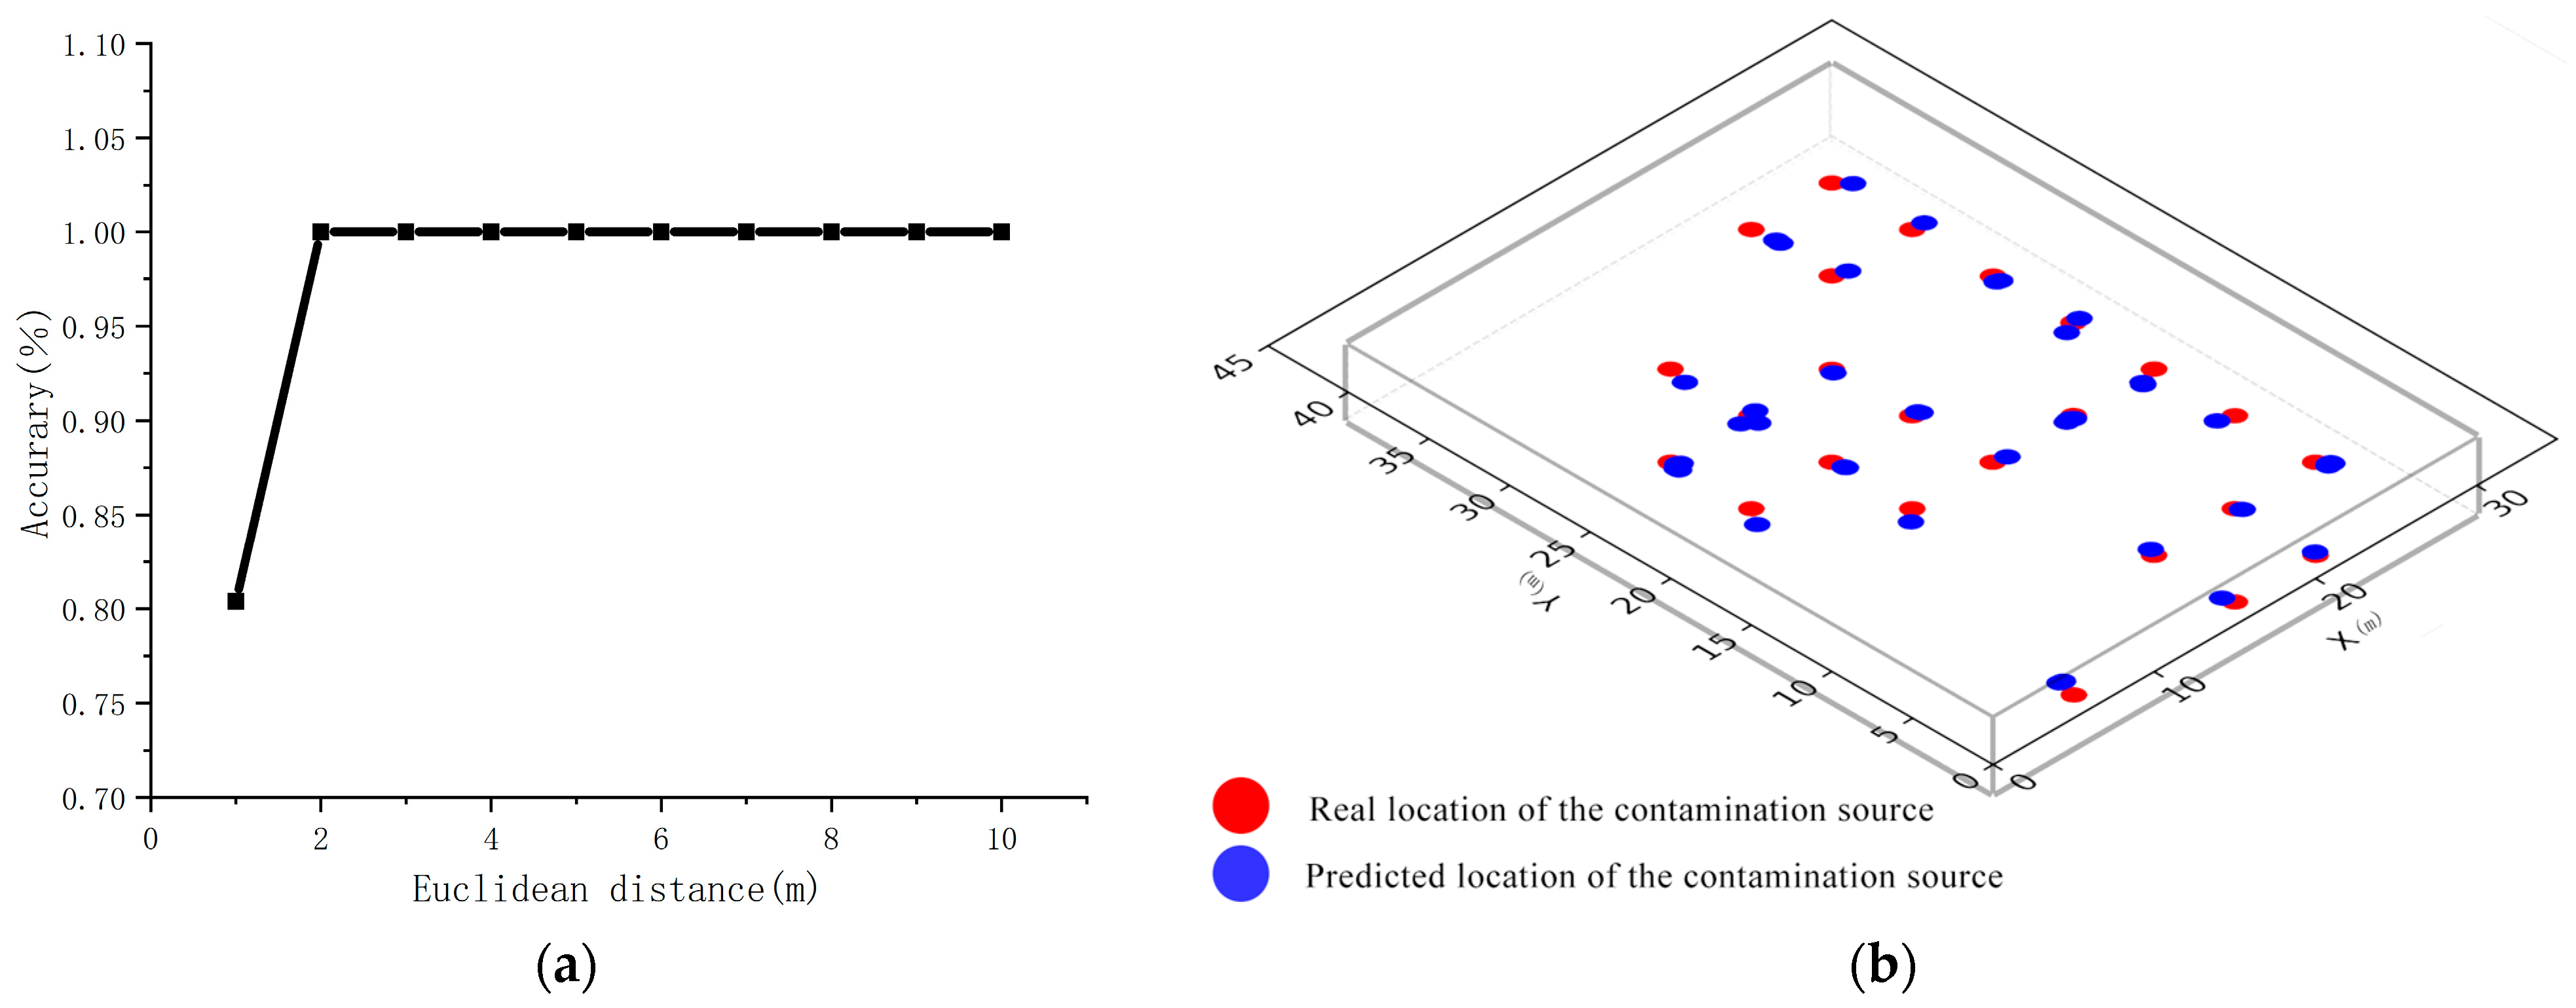
Through research, the optimal neural network parameters were determined as follows: optimal cutting ratio α   = 0.25, number of residual layers N l   = 9, convolution kernel size K s = 4 × 4, number of fully connected layers FC = 1, and rotation step size θ = 10°. The data were split at a 70:20:10 ratio for training, testing, and prediction, respectively. The prediction accuracy within the 1 m Euclidean distance exceeded 80%. The accuracy corresponding to a Normalized Euclidean distance of less than 0.82% reached 80%. This level of accuracy demonstrates the feasibility and reliability of this model in practical application scenarios and provides an effective solution for spatial prediction tasks in related fields (Figure 5).
The primary function of this method was to construct a pollution source sample library using representative spatial points and to build a deep learning model through data optimization and network training. This method not only ensures the accurate characterization of the spatial distribution characteristics of pollution sources but also significantly reduces the amount of data required, thus lowering the difficulty and cost of data collection. Next, we applied this method to a case study from previous work and compared it to further verify its practicality and effectiveness.

3. Application of Indoor Pollution Source Inversion CNN Method Based on Small-Sample Data

3.1. Case Setting and Verification

To verify the feasibility of the proposed method, the method used by Wang et al. [21] was adopted as a comparison benchmark. The proposed method was applied to the same spatial scenario to achieve pollution source inversion. To ensure the pertinence of the comparison, this study only selected the case of a constantly releasing pollution source for comparative analysis.
The office scenario proposed by Wang et al. [48] was selected as the benchmark case (Figure 6). The spatial size of the office was S s t u d y = 10 × 5 × 3 m3. In this scenario, six desks and six computers are placed in a room. The air inlet and outlet are located on both sides of the far end of the room, respectively, and both have a size of 1.5 × 1.0 m2. The coordinates of the pollution source S are (4, 2.5, 0) [48]. In this study, FLUENT was used to conduct an unsteady-state simulation of a room with point S as the pollution source. The boundary condition settings were consistent with those in the original study. The specific parameters are detailed in Appendix B.
In a reference paper [48], Gaussian noise ϵ was added to the curve of concentration change with time. For an effective comparison, this study calculated the upper and lower bounds of the Gaussian noise, denoted as S + S d , t 3 and S S d , t 3 , respectively, and a comparative analysis was conducted with the results in the original paper [48]. The curves of pollutant concentration changing with time were compared at monitoring points D1, D2, and D3. The results showed that the two were highly consistent, verifying the reliability of using this method for data generation (Figure 7).

3.2. Method Application and Results

To generate a dataset suitable for the proposed method, 12 candidate pollution sources were evenly arranged in the target space, as shown in Figure 6. Through CFD simulations, the steady-state concentration field at t = 50 s was obtained, and a training set D t r a i n = I ( x , y ) , x I i = 1 12 was constructed, where I ( x , y ) is the concentration distribution map at t = 50 s, and x I is the coordinate of its corresponding pollution source. The data were processed and learned using this method. The optimal cutting size ratio α was determined, as follows:
α = L c r o p L s p a c e = 0.4 ( L c r o p = 4 m )
When α   = 0.4, the feature retention rate η f = 92.7 %. Further analysis showed that, as the spatial size L s p a c e increased, the optimal cutting ratio satisfied the following relationship:
α o p t = 0.38 exp 0.021 L s p a c e ( R 2 = 0.96 )
This result indicates that for larger spatial sizes, a more refined local feature extraction method is required, because in a larger space, the influence range of the pollution source is wider. Therefore, a more refined cutting strategy is required to accurately capture the location of the pollution sources.
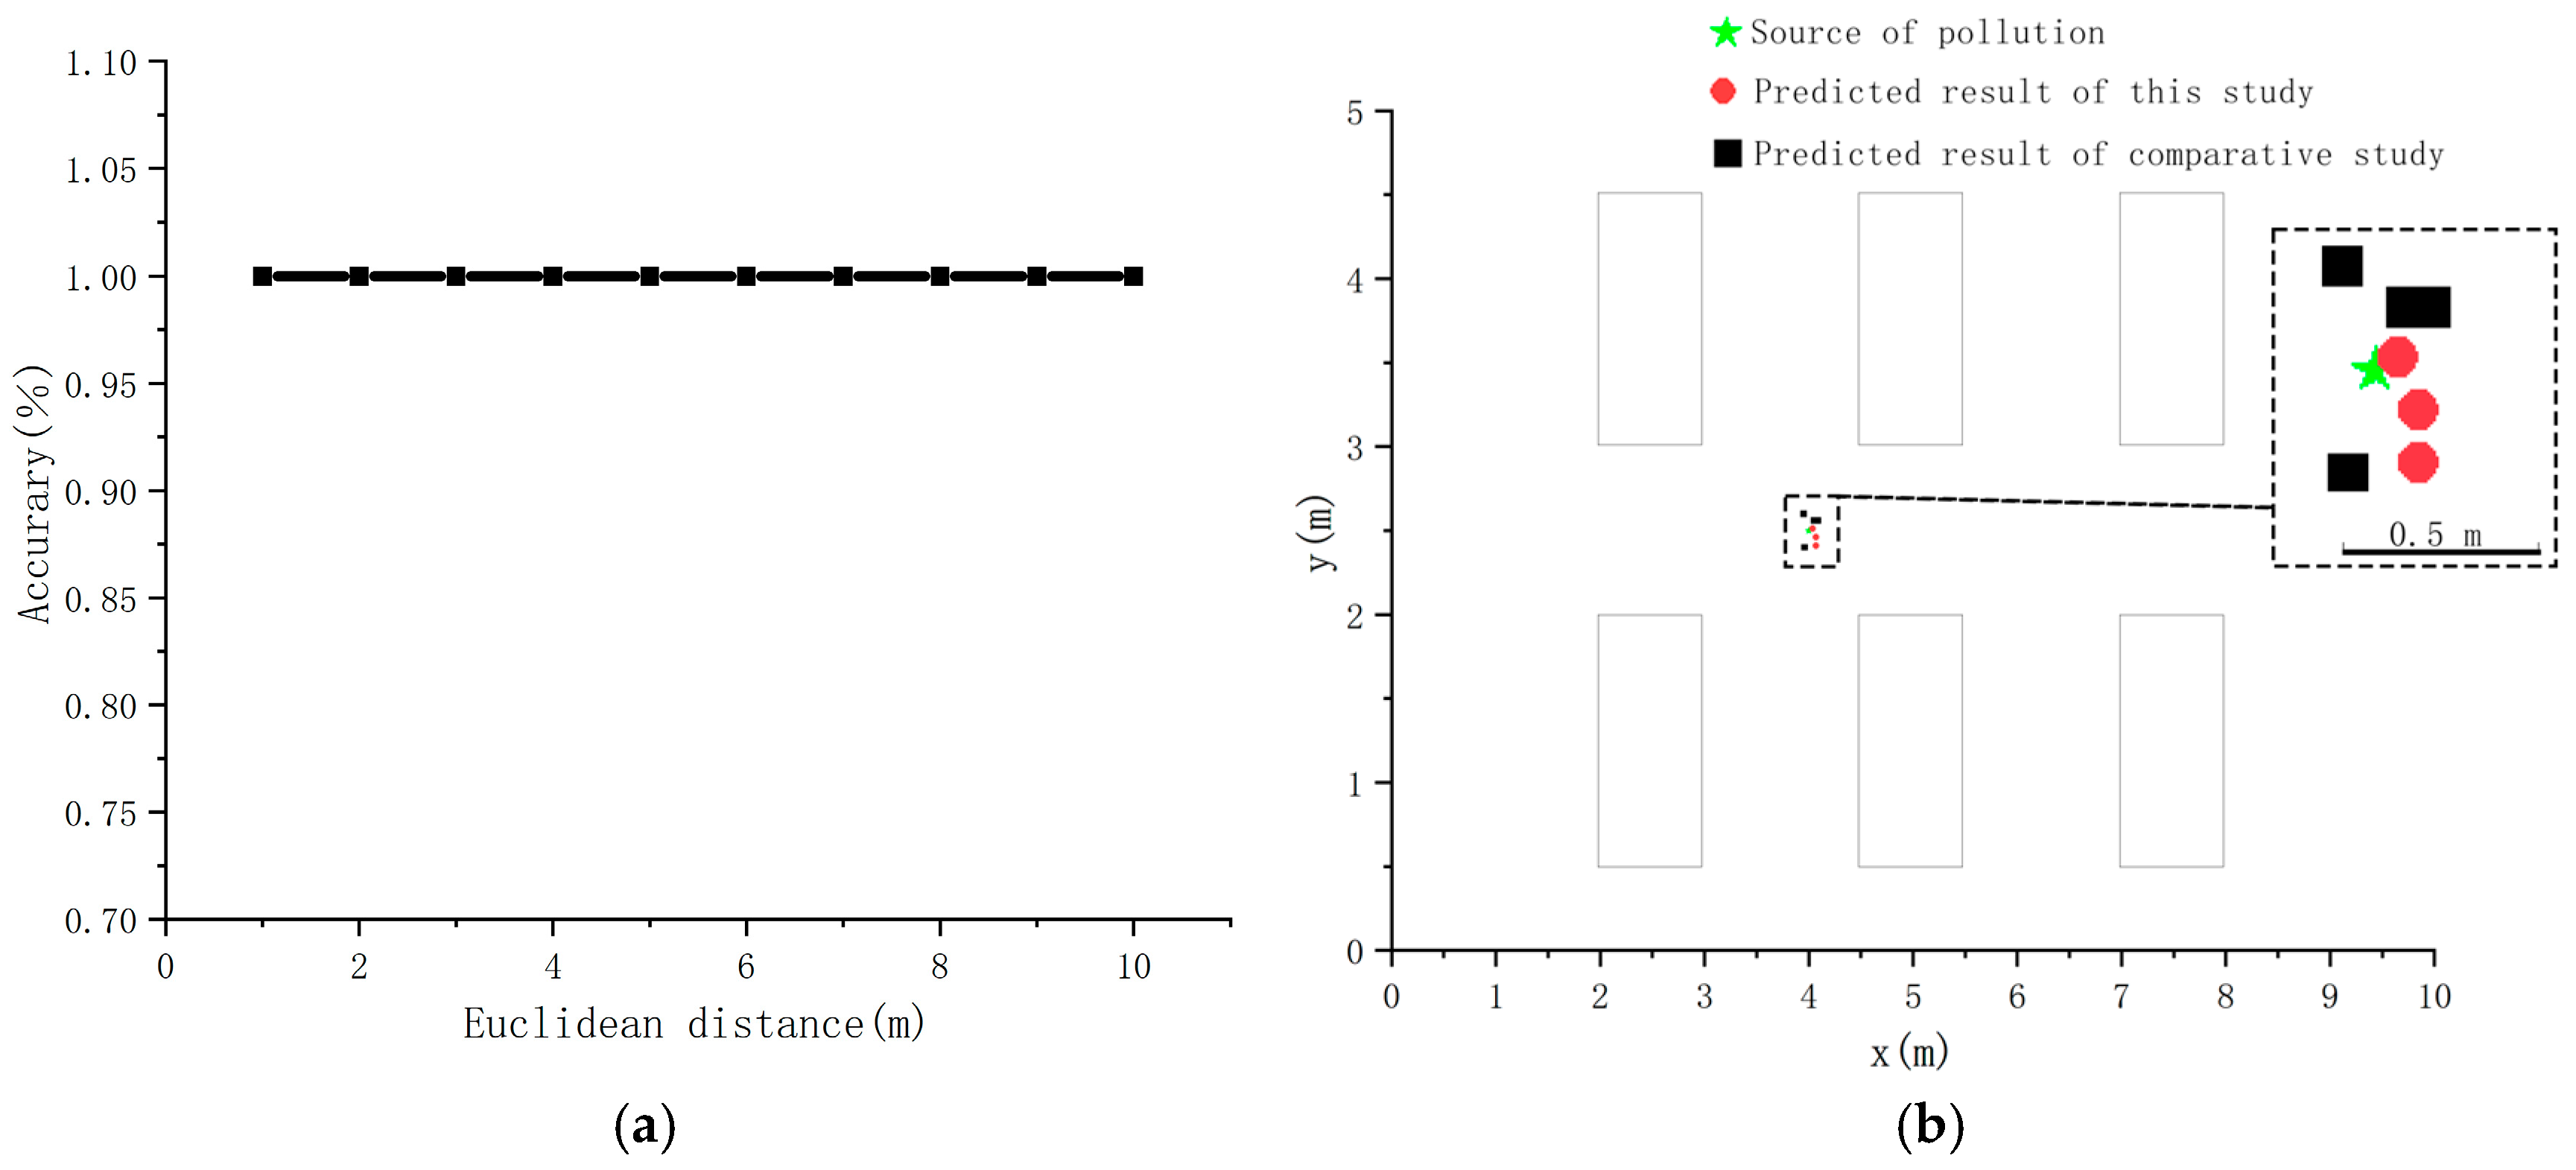
After the learning process, the probability that the pollution source inversion method used in this study can predict the location of the pollution source within an accuracy of 1 m reached 100%. Therefore, the method can effectively learn based on the pollutant distribution data at any given moment. In addition, when the furniture occlusion rate ρ = 30%, the anti-interference ability of the method still had a WA higher than 95%.
Compared with traditional methods, the method established in this study showed significant advantages in terms of both calculation time and computational complexity. Moreover, its prediction accuracy was better than the best results reported in the literature, with the corresponding NED reduced by 21.43%. These results demonstrate that the proposed method exhibits a remarkable performance (Figure 8).

4. Conclusions

This study was based on a small-sample CNN. Through CFD simulations and multi-scenario experimental verification, an efficient inversion of large-space pollution sources was achieved. The main conclusions are as follows.
  • Efficiency and Accuracy of Residual Neural Network for Indoor Air Pollution Source Localization
This research clearly shows that the residual neural network is highly efficient and accurate in localizing indoor air pollution sources. By optimizing the network structure and carefully processing the data, we can make high-precision predictions even when the number of available samples is limited. In practical terms, this means that in real-world scenarios where collecting a large number of samples is difficult or costly, our method can still provide reliable results. For example, in a large industrial workshop where installing numerous sensors to collect data is not feasible, this neural network can effectively localize pollution sources with the limited data obtained from a small number of sensors.
2.
Prediction Performance Metrics
The model achieved a weighted average (WA) of 82.3% within a 1 m prediction radius, and the Normalized Euclidean Distance (NED) was of less than 0.26%. This indicates that the model can accurately predict the location of the pollution source within a relatively small area. In practical applications, such as in a large office building, this high-precision prediction can help quickly identify the source of indoor air pollution, such as a malfunctioning ventilation system or a chemical leak, enabling prompt measures to be taken to improve air quality.
3.
Dynamic Adjustment Formula for the Cutting Ratio
This research proposed a dynamic adjustment formula for the cutting ratio: α o p t = 0.38 exp 0.021 L s p a c e ( R 2 = 0.96 ) . This formula can support adaptive feature extraction for spatial sizes L s p a c e ranging from 4 to 40 m. In real-world scenarios, different spaces have different sizes, such as small meeting rooms and large exhibition halls. This formula allows the model to adaptively extract features according to the actual size of the space, improving the model’s performance in various spatial environments. For example, in a large shopping mall with different-sized store areas, the model can adjust itself to better localize pollution sources.
4.
Reduction in Cross-Space Sample Requirement
Compared with existing methods, our model reduced the cross-space sample requirement to 1/5 of that of the benchmark scenario method while ensuring spatial representation accuracy. This significant reduction in sample requirements means that in practical applications, less time and resources are needed to collect data. For example, in an urban area where there are many different-sized buildings, it is much easier and quicker to collect the necessary data for our model, which can then efficiently localize pollution sources in these buildings.
5.
Robustness in Complex Scenarios
For a furniture occlusion rate of 30%, the WA still remained above 95%. This verifies the robustness of the proposed method in complex scenarios. In real-world indoor environments, there are often various obstacles, such as furniture in an office or partitions in a factory. Our model can still accurately localize pollution sources even in the presence of such obstacles, which is very useful in practical applications. For example, in a cluttered warehouse with a lot of stored goods, the model can still effectively find the source of air pollution.
6.
Improvement in Prediction Accuracy and Real-Time Localization
The prediction accuracy improved by 21.43% compared with the optimal results in the literature, and only 50 s of unsteady-state CFD data were required for training, meeting the requirements for real-time localization. In applications where real-time information is crucial, such as in a chemical plant where a sudden leak may occur, our model can quickly and accurately localize the pollution source based on a short period of data, enabling timely response and prevention of potential disasters.
This study only conducted local training on highly concentrated spatial areas and did not incorporate the dynamic features of sparsely concentrated areas, which may limit the generalizability of the model in global inversion. In the future, the full-space sampling strategy can be expanded to achieve pollution source localization driven by the pollutant concentration data in any area. The applicability of the method to other gaseous pollutants, such as volatile organic compounds and particulate matter (PM2.5), can be verified in multisource diffusion scenarios. Finally, lightweight network architectures and edge-computing deployment can be explored to further enhance engineering application potential.

Author Contributions

T.Y.: Writing—Original Draft, Visualization, Validation, Software, Resources, Methodology, Formal Analysis, Data Curation. M.H.: Supervision, Investigation, Writing—Review and Editing, Funding Acquisition. All authors have read and agreed to the published version of the manuscript.

Funding

This research was funded by the National Natural Science Foundation of China, grant number 52208059.

Data Availability Statement

Research data will be made available on reasonable request.

Conflicts of Interest

The authors declare no conflicts of interest.

Abbreviations

The following abbreviations were used in this manuscript:
SymbolDefinitionFormulaUnit/Range
α Cutting size ratio α = L c r o p L o r i g α ( 0 , 1 )
R2Coefficient of determination R 2 = 1 ( y i y ^ i ) 2 ( y i y ¯ ) 2 -
N l Number of residual layers- N l ( 1 , 12 )
WAWeighted accuracy W A = w k A w w k %
EDEuclidean distance d = ( x p r e d i c t e d x r e a l ) 2 + ( y p r e d i c t e d y r e a l ) 2 m
NEDNormalized Euclidean distance N E D = x p x t L s p a c e -
K s Convolution kernel size- K s ( 1 , 5 )
t s Simulation time step- t s = 50   s
FCFully connected layer- F C ( 1 , 5 )
S s t u d y Research scenario space-10 × 5 × 3 m3
S i d e a l Ideal large-scale space-30 × 40 × 4 m3
Q s Pollution source intensity- Q s = 0.01   k g / s
D s Detector location- D s R n x 3
U i Inlet air velocity- U i = 0.5   m / s
V i Outlet air velocity- V i = 0.5   m / s
C t Pollutant concentration- C t = f ( x , y , z , t )
ϵ Noise disturbance ε d , t ∼Gau[0, ( S d , t 3 ) 2 ] σ = 0.01
SCorresponding pollution source location in article--
TGray threshold- T ( 0 , 255 )
L s p a c e Feature range L s p a c e = m a x ( x p x t ) -

Appendix A

Table A1. CFD boundary conditions for the ideal space simulation.
Item Settings
Simulation modelSimulation domain40 (x) × 30 (y) × 4 (z) m3
Number of simulation grids156,400
Solver settingsTurbulence modelStandard k-ε model
Pressure–velocity couplingSIMPLE
Discretization scheme for advection termSecond-order upwind
Discretization scheme for
diffusion term
Second-order upwind
Near-wall treatmentStandard wall functions
Residual1 × 10−4
Boundary conditionsAir inletVelocity inlet
Exhaust outletFree outflow
Source0.01 kg/s
Walls and groundNo-slip wall

Appendix B

Table A2. CFD boundary conditions in verification space simulation.
Item Settings
Simulation modelSimulation domain10 (x) × 5 (y) × 3 (z) m3
Number of simulation grid1,803,338
Solver settingsTurbulence modelStandard k-ε model
Pressure–velocity couplingSIMPLE
Discretization scheme for advection termSecond-order upwind
Discretization scheme for diffusion termSecond-order upwind
Near-wall treatmentStandard wall functions
Time step size0.005 s
Residual1 × 10−5
Boundary conditionsAir inletVelocity inlet

References

  1. Liu, S.; Novoselac, A. Lagrangian particle modeling in the indoor environment: A comparison of RANS and LES turbulence methods (RP-1512). HVACR Res. 2014, 20, 480–495. [Google Scholar] [CrossRef]
  2. Yu, S.; He, L.; Cui, Y.; Zhang, G.; Feng, G. Influence of Sensor Location on Indoor Air Pollution Source Identification Results. J. Environ. Eng. 2019, 145, 04019082. [Google Scholar] [CrossRef]
  3. Yu, S.; He, L.; Feng, G. Review of Identification Methods for Indoor Pollutant Sources. Procedia Eng. 2016, 146, 303–309. [Google Scholar] [CrossRef]
  4. Zeng, L.; Gao, J.; Lv, L.; Du, B.; Zhang, Y.; Zhang, R.; Ye, W.; Zhang, X. Localization and characterization of intermittent pollutant source in buildings with ventilation systems: Development and validation of an inverse model. Build. Simul. 2021, 14, 841–855. [Google Scholar] [CrossRef]
  5. Yang, Y.; Feng, Q.; Cai, H.; Xu, J.; Li, F.; Deng, Z.; Yan, C.; Li, X. Experimental study on three single-robot active olfaction algorithms for locating contaminant sources in indoor environments with no strong airflow. Build. Environ. 2019, 155, 320–333. [Google Scholar] [CrossRef]
  6. Jing, Y.; Li, F.; Gu, Z.; Tang, S. Identifying spatiotemporal information of the point pollutant source indoors based on the adjoint-regularization method. Build. Simul. 2023, 16, 589–602. [Google Scholar] [CrossRef]
  7. Cai, H.; Tong, C.; Li, Z.; Guo, X.; Shi, Y.; Jiang, M.; Lin, B. Efficient particulate matter source localization in dynamic indoor environments: An experimental study by a multi-robot system. J. Build. Eng. 2024, 92, 109712. [Google Scholar] [CrossRef]
  8. Lang, Y.; Ng, M.X.Y.; Yu, K.X.; Chen, B.; Tan, P.C.; Tan, K.W.; Lam, W.H.; Siwayanan, P.; Kim, K.S.; Choong, T.S.Y.; et al. A novel CFD-MILP-ANN approach for optimizing sensor placement, number, and source localization in large-scale gas dispersion from unknown locations. Digit. Chem. Eng. 2025, 14, 100216. [Google Scholar] [CrossRef]
  9. Oh, B.K.; Park, Y.; Park, H.S. Seismic response prediction method for building structures using convolutional neural network. Struct. Control. Health Monit. 2020, 27, e2519. [Google Scholar] [CrossRef]
  10. Lei, L.; Chen, W.; Wu, B.; Chen, C.; Liu, W. A building energy consumption prediction model based on rough set theory and deep learning algorithms. Energy Build. 2021, 240, 110886. [Google Scholar] [CrossRef]
  11. Bakht, A.; Sharma, S.; Park, D.; Lee, H. Deep Learning-Based Indoor Air Quality Forecasting Framework for Indoor Subway Station Platforms. Toxics 2022, 10, 557. [Google Scholar] [CrossRef] [PubMed]
  12. Thoma, M. Analysis and Optimization of Convolutional Neural Network Architectures. arXiv 2017, arXiv:1707.09725. [Google Scholar] [CrossRef]
  13. Dubey, S.R.; Chakraborty, S.; Roy, S.K.; Mukherjee, S.; Singh, S.K.; Chaudhuri, B.B. diffGrad: An Optimization Method for Convolutional Neural Networks. IEEE Trans. Neural Netw. Learn. Syst. 2020, 31, 4500–4511. [Google Scholar] [CrossRef] [PubMed]
  14. Abdel-Hamid, O.; Deng, L.; Yu, D. Exploring convolutional neural network structures and optimization techniques for speech recognition. In Interspeech; ISCA: Singapore, 2013; pp. 3366–3370. [Google Scholar] [CrossRef]
  15. Habib, G.; Qureshi, S. Optimization and acceleration of convolutional neural networks: A survey. J. King Saud Univ.—Comput. Inf. Sci. 2022, 34, 4244–4268. [Google Scholar] [CrossRef]
  16. Feng, Q.; Zhang, C.; Lu, J.; Cai, H.; Chen, Z.; Yang, Y.; Li, F.; Li, X. Source localization in dynamic indoor environments with natural ventilation: An experimental study of a particle swarm optimization-based multi-robot olfaction method. Build. Environ. 2019, 161, 106228. [Google Scholar] [CrossRef]
  17. Zhou, Y.; An, Y.; Huang, W.; Chen, C.; You, R. A combined deep learning and physical modelling method for estimating air pollutants’ source location and emission profile in street canyons. Build. Environ. 2022, 219, 109246. [Google Scholar] [CrossRef]
  18. Hutchinson, M.; Oh, H.; Chen, W.-H. A review of source term estimation methods for atmospheric dispersion events using static or mobile sensors. Inf. Fusion 2017, 36, 130–148. [Google Scholar] [CrossRef]
  19. Wawrzynczak, A.; Berendt-Marchel, M. Application of the artificial neural network in the forecasting of the airborne contaminant. J. Phys. Conf. Ser. 2019, 1391, 012092. [Google Scholar] [CrossRef]
  20. Reich, S.L.; Gomez, D.R.; Dawidowski, L.E. Articial neural network for the identication of unknown air pollution sources. Atmos. Environ. 1999, 33, 3045–3052. [Google Scholar] [CrossRef]
  21. Lin, J.C.; Fasoli, B.; Mitchell, L.; Bares, R.; Hopkins, F.; Thompson, T.M.; Alvarez, R.A. Towards hyperlocal source identification of pollutants in cities by combining mobile measurements with atmospheric modeling. Atmos. Environ. 2023, 311, 119995. [Google Scholar] [CrossRef]
  22. Bernstein, J.A.; Alexis, N.; Barnes, C.; Bernstein, I.L.; Bernstein, J.A.; Nel, A.; Peden, D.; Diaz-Sanchez, D.; Tarlo, S.M.; Williams, P.B. Health effects of air pollution. J. Allergy Clin. Immunol. 2004, 114, 1116–1123. [Google Scholar] [CrossRef] [PubMed]
  23. Kampa, M.; Castanas, E. Human health effects of air pollution. Environ. Pollut. 2008, 151, 362–367. [Google Scholar] [CrossRef] [PubMed]
  24. Bruce, N.; Perez-Padilla, R.; Albalak, R. Indoor air pollution in developing countries: A major environmental and public health challenge. Bull. World Health Organ. 2000, 78, 1078–1092. [Google Scholar]
  25. Qin, L.; Zhai, M.; Cheng, H. Indoor air pollution from the household combustion of coal: Tempo-spatial distribution of gaseous pollutants and semi-quantification of source contribution. Sci. Total Environ. 2023, 882, 163502. [Google Scholar] [CrossRef] [PubMed]
  26. Cheng, J.; Wang, H.; Lu, S.; Zhai, Z. Inverse Modeling of Indoor Instantaneous Airborne Contaminant Source Location and Releasing Time in Unsteady Airflow. Procedia Eng. 2017, 205, 2289–2296. [Google Scholar] [CrossRef]
  27. Zhang, T.; Yin, S.; Wang, S. An inverse method based on CFD to quantify the temporal release rate of a continuously released pollutant source. Atmos. Environ. 2013, 77, 62–77. [Google Scholar] [CrossRef]
  28. Kim, N.K.; Kang, D.H.; Kim, B.W.; Kang, H.W. Optimal location and performance prediction of portable air cleaner in composite room shapes using convolutional neural network. Build. Environ. 2023, 242, 110500. [Google Scholar] [CrossRef]
  29. Zhang, T.; Li, H.; Wang, S. Inversely tracking indoor airborne particles to locate their release sources. Atmos. Environ. 2012, 55, 328–338. [Google Scholar] [CrossRef]
  30. Yang, Y.; Liu, J.; Wang, W.; Cao, Y.; Li, H. Incorporating SLAM and mobile sensing for indoor CO2 monitoring and source position estimation. J. Clean. Prod. 2021, 291, 125780. [Google Scholar] [CrossRef]
  31. Fong, I.H.; Li, T.; Fong, S.; Wong, R.K.; Tallón-Ballesteros, A.J. Predicting concentration levels of air pollutants by transfer learning and recurrent neural network. Knowl.-Based Syst. 2020, 192, 105622. [Google Scholar] [CrossRef]
  32. Zhang, H.-L.; Li, B.; Shang, J.; Wang, W.-W.; Zhao, F.-Y. Source term estimation for continuous plume dispersion in Fusion Field Trial-07: Bayesian inference probability adjoint inverse method. Sci. Total Environ. 2024, 915, 169802. [Google Scholar] [CrossRef] [PubMed]
  33. Wang, F.; Zhou, X.; Kikumoto, H.; Okaze, T. Detector configuration optimization based on wind tunnel tests using normalized adjoint concentration gradient for urban spatial source parameters estimation. Build. Environ. 2024, 248, 111094. [Google Scholar] [CrossRef]
  34. Chen, Y.C.; Cai, H.; Chen, Z.L.; Feng, Q. Indoor Time-Varying Pollution Source Location Method Based on Active Olfaction. J. PLA Univ. Sci. Technol. (Nat. Sci. Ed.) 2016, 17, 257–263. [Google Scholar]
  35. Zhang, H.G. Research on the Identification of Indoor Pollution Source Characteristics Using Machine Learning Methods. Ph.D. Thesis, Nanjing University, Nanjing, China, 2018. [Google Scholar] [CrossRef]
  36. Bayat, B.; Crasta, N.; Li, H.; Ijspeert, A. Optimal search strategies for pollutant source localization. In Proceedings of the 2016 IEEE/RSJ International Conference on Intelligent Robots and Systems (IROS), Daejeon, Republic of Korea, 9–14 October 2016. [Google Scholar]
  37. Dai, Y.; Zhang, F.; Wang, H. Identification of source location in a single-sided building with natural ventilation: Case of interunit pollutant dispersion. J. Build. Eng. 2023, 68, 106049. [Google Scholar] [CrossRef]
  38. Waeytens, J.; Sadr, S. Computer-aided placement of air quality sensors using adjoint framework and sensor features to localize indoor source emission. Build. Environ. 2018, 144, 184–193. [Google Scholar] [CrossRef]
  39. Yang, Y.; Yang, H.; Li, Q.; Zhang, L.; Dong, Z. Simulation Study on Airflow Organization and Environment in Reconstructed Fangcang Shelter Hospital Based on CFD. Buildings 2023, 13, 1269. [Google Scholar] [CrossRef]
  40. Yang, J.; Ding, T.; Deng, Q.; Li, Z.; Wang, Y.; Wu, J.; Shi, M. A Multi-UAV Indoor Air Real-Time Detection and Gas Source Localization Method Based on Improved Teaching–Learning-Based Optimization. Atmos. Environ. 2024, 318, 120200. [Google Scholar] [CrossRef]
  41. Xu, X.; Li, Q.; Li, S.; Kang, F.; Wan, G.; Wu, T.; Wang, S. Crack Width Recognition of Tunnel Tube Sheet Based on YOLOv8 Algorithm and 3D Imaging. Buildings 2024, 14, 531. [Google Scholar] [CrossRef]
  42. Wang, H.; Lu, S.; Cheng, J.; Zhai, Z. Inverse modeling of indoor instantaneous airborne contaminant source location with adjoint probability-based method under dynamic airflow field. Build. Environ. 2017, 117, 178–190. [Google Scholar] [CrossRef]
  43. Yan, T.; Shen, S.-L.; Zhou, A. Data augmentation-assisted muck image recognition during shield tunnelling. Undergr. Space 2025, 21, 370–383. [Google Scholar] [CrossRef]
  44. Li, J.; Guo, J.; Li, B.; Meng, L. Novel Instance-Based Transfer Learning for Asphalt Pavement Performance Prediction. Buildings 2024, 14, 852. [Google Scholar] [CrossRef]
  45. Xiang, Z. Research on the Optimization of LeNet—5 Convolutional Neural Network Based on Particle Swarm Algorithm. Master’s Thesis, Huazhong University of Science and Technology, Wuhan, China, 2016. [Google Scholar]
  46. Imani, A.; Hosseinzadeh, M.; Kasiri, N.; Khalili-Garakani, A. Production of dimethyl ether from synthesis gas in membrane fixed bed reactor using mathematical model, artificial neural networks, and response surface methodology. Fuel 2025, 381, 133539. [Google Scholar] [CrossRef]
  47. Zhao, H.; Bing, H. Prediction of the Unconfined Compressive Strength of Salinized Frozen Soil Based on Machine Learning. Buildings 2024, 14, 641. [Google Scholar] [CrossRef]
  48. Wang, F.; Zhou, X.; Kikumoto, H. Improvement of optimization methods in indoor time-variant source parameters estimation combining unsteady adjoint equations and flow field information. Build. Environ. 2022, 226, 109710. [Google Scholar] [CrossRef]
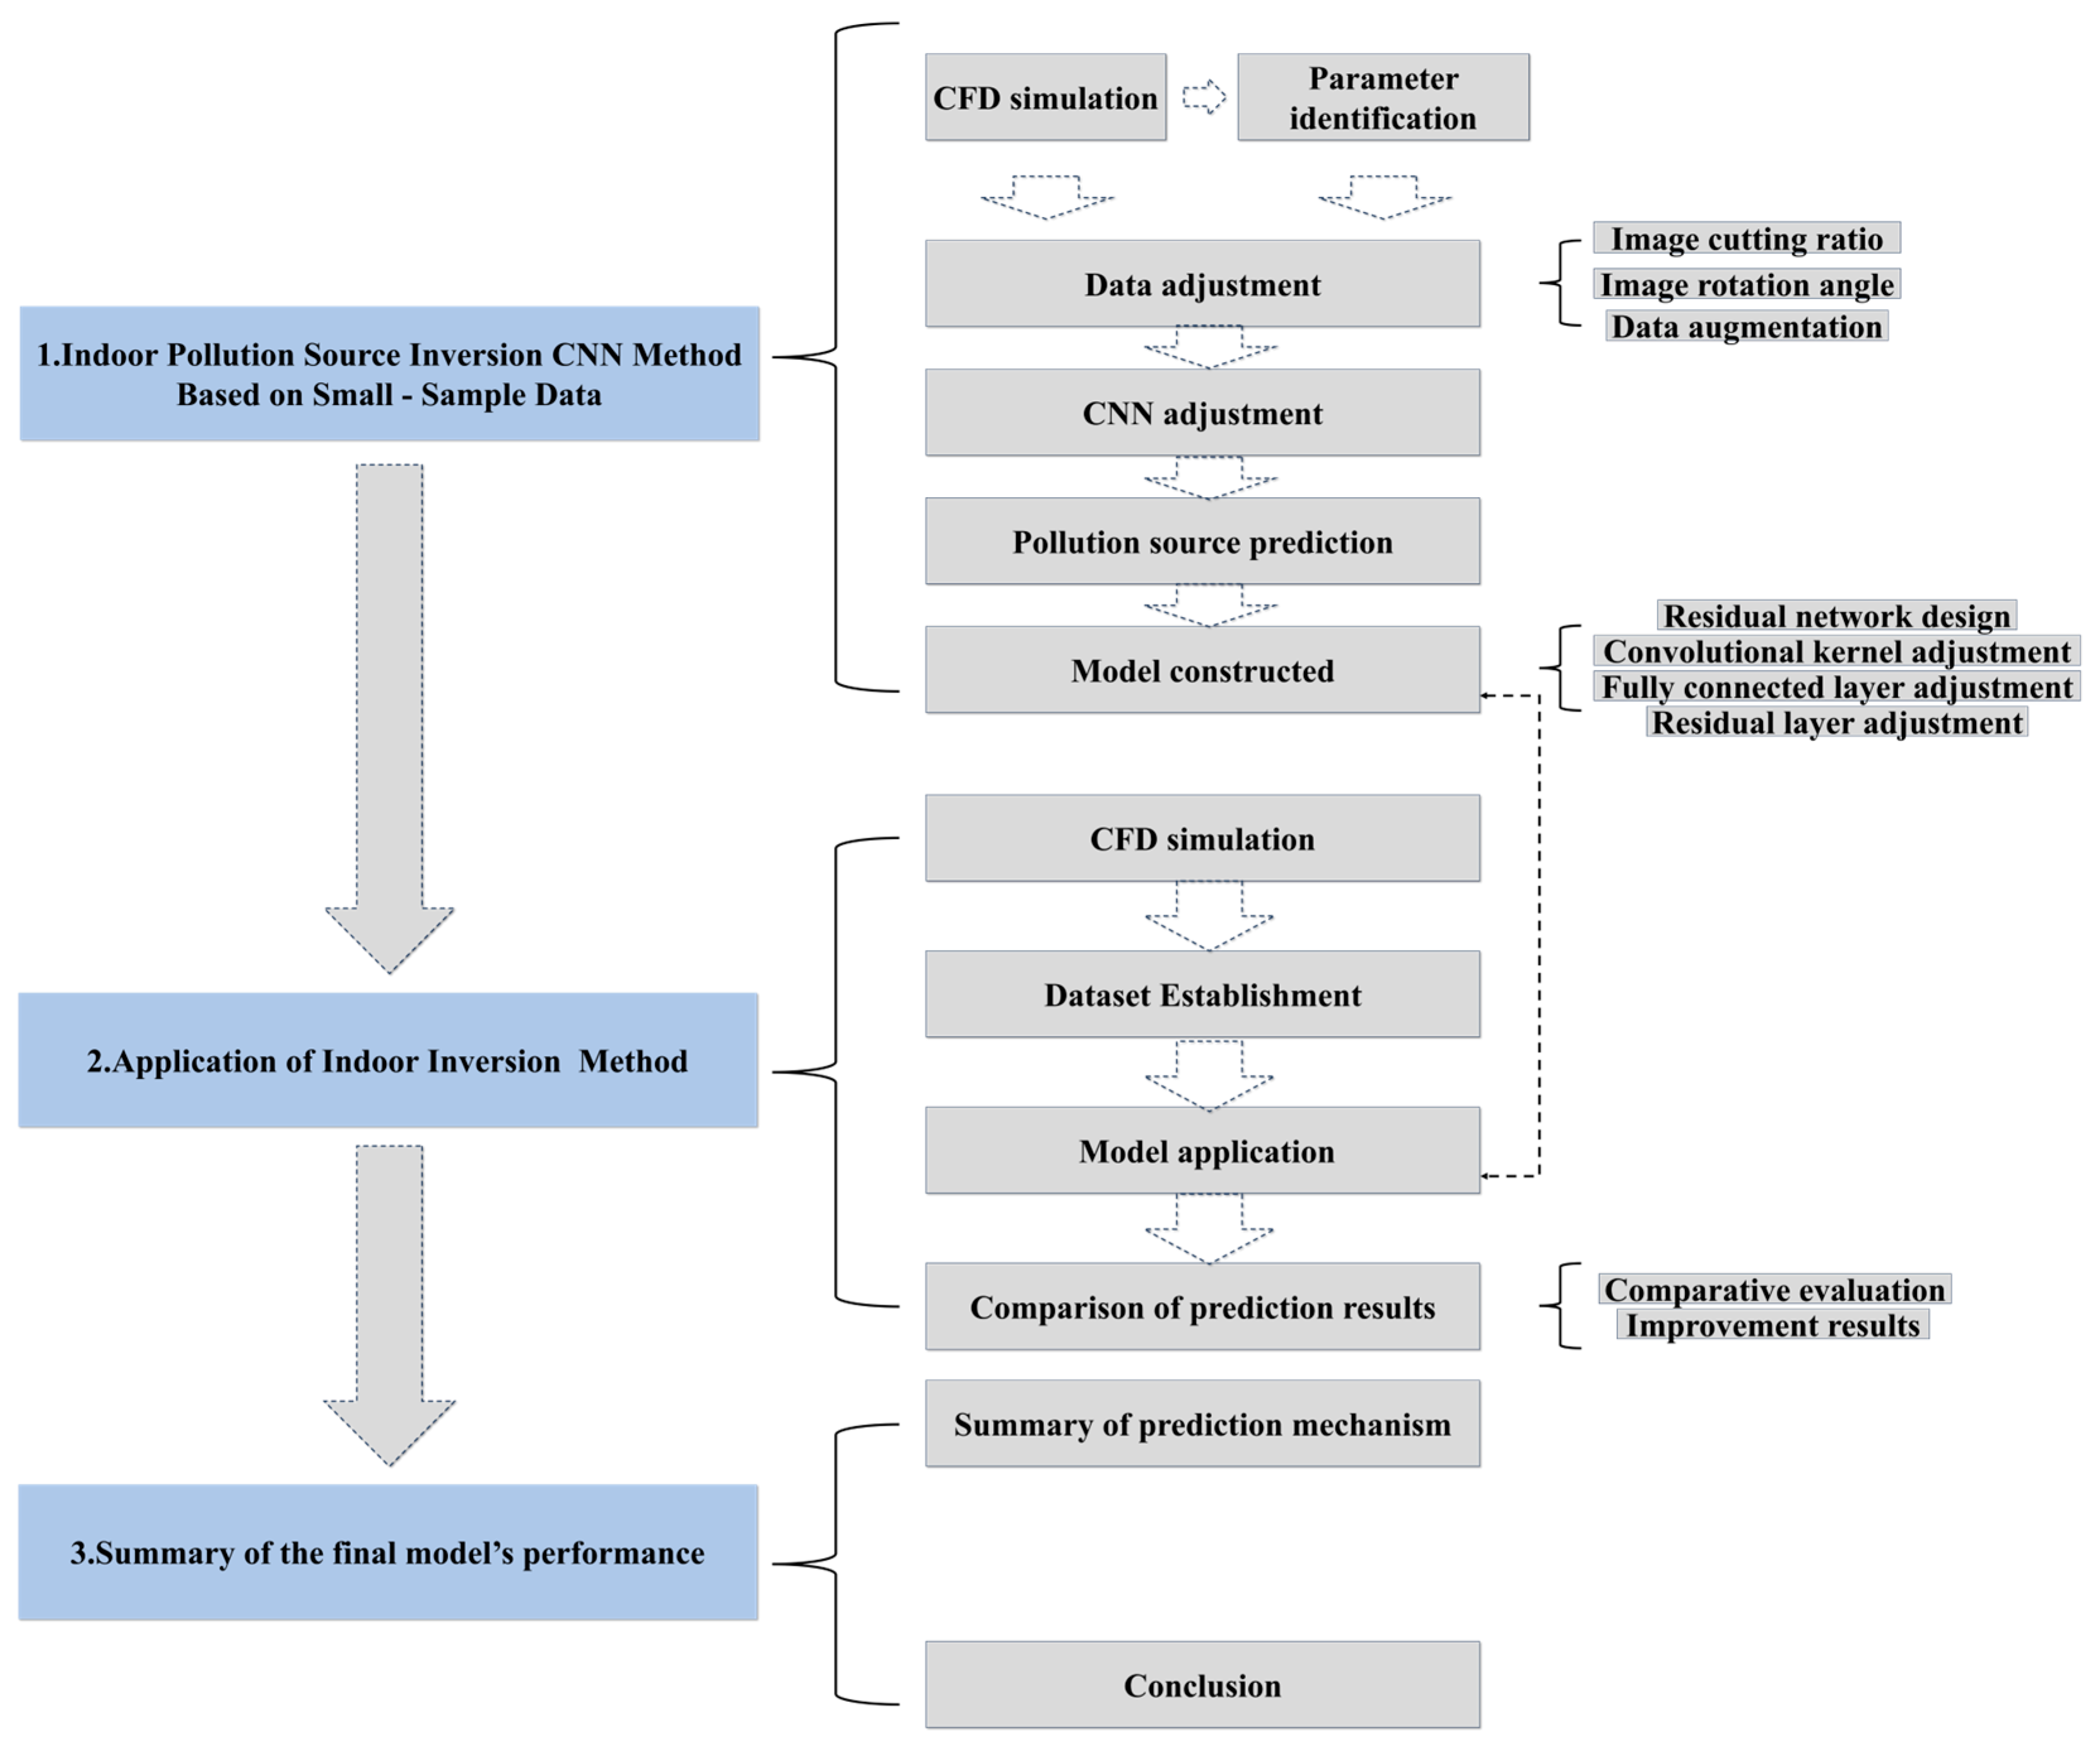
Figure 1. Overall flowchart.
Buildings 15 01244 g001
Figure 2. Schematic of the space and location of the pollution source.
Buildings 15 01244 g002
Figure 3. The result of small-sample method. (a) The influence of image cutting size and the number of residual layers on R2. (b) Comparison between the optimized results and the initial situation.
Buildings 15 01244 g003
Figure 5. Schematic of the best result: (a) prediction accuracy, (b) best prediction result; accuracy: W A = w k A w w k ; Euclidean distance: d = ( x p r e d i c t e d x r e a l ) 2 + ( y p r e d i c t e d y r e a l ) 2 .
Buildings 15 01244 g005
Figure 6. Schematic of the best result and layout of pollution sources.
Buildings 15 01244 g006
Figure 7. Comparison of the concentration changes over time between the corresponding article (Wang et al. [48]) at monitoring points D1, D2, and D3 and those of this paper. Comparison of pollutant concentrations detected by the detector at the following positions: (a) D1; (b) D2; (c) D3.
Buildings 15 01244 g007
Figure 8. Comparison of pollution source inversion results using the proposed method. (a) Inversion accuracy of the proposed method; (b) comparison with previous studies.
Buildings 15 01244 g008
Disclaimer/Publisher’s Note: The statements, opinions and data contained in all publications are solely those of the individual author(s) and contributor(s) and not of MDPI and/or the editor(s). MDPI and/or the editor(s) disclaim responsibility for any injury to people or property resulting from any ideas, methods, instructions or products referred to in the content.