Abstract
Offshore wind energy is a key contributor to sustainable energy, yet its development faces significant technological challenges, particularly in the design of substructures that interface with the marine environment. In this study, a comprehensive numerical analysis was conducted to investigate the mechanical behavior of a high-rise pile cap foundation under hydrostatic loading conditions. A high batter pile bearing foundation model was employed to examine the effects of pile inclinations, embedment depths, lateral loads, and cap elevations on foundation performance. The results indicate that the displacement and bending moment at the pile head decrease significantly as the pile inclination gradually increases. Similarly, as the embedding depth increases gradually, both the displacement and bending moment decrease significantly. Additionally, a positive batter pile exhibits greater bending moments and displacements than a negative batter pile, with the maximum bending moment occurring in the lower one-third of pile below the mudline. These findings provide valuable theoretical guidance for the design of offshore wind turbine foundations, recommending an inclination angle of 8–12° and an embedment depth of 12–15 m to enhance structural stability, economic efficiency, and construction feasibility.
1. Introduction
Offshore wind power, a critical component of renewable energy, offers a range of significant advantages. Abundant offshore wind resources, characterized by higher wind speeds, create optimal conditions for efficient energy production. Offshore wind farm projects do not require the occupation of land resources, thereby minimizing land usage. Additionally, strategic marine spatial allocation minimizes environmental impacts. Global wind power development has experienced rapid expansion. In 2020, onshore wind power capacity increased by 106 GW and offshore wind power capacity grew by 10.8 GW, raising the total global wind power capacity to over 1021 GW [1]. This growth underscores wind power’s critical role in driving the energy transition, particularly in mitigating climate change and achieving sustainable development goals.
China has become a major user of wind power [2]. Since 2009, China has consistently ranked first worldwide in both newly installed and cumulative wind power capacity. The expansion of offshore wind power in China not only reflects technological and industrial advancements, but also signifies a pivotal trend driving energy transition and socio-economic development [3,4]. The adoption of progressive energy policy frameworks has been instrumental in optimizing China’s energy matrix structure and catalyzing pathways toward a low-carbon economic transition.
High-inclination pile cap foundations are widely adopted in offshore wind farms for their structural reliability and mature construction methods [5,6]. These foundations effectively transfer wind turbine loads, thereby ensuring both stability and safety [7]. Optimizing project designs is essential for improving economic feasibility and promoting the sustainable development of offshore wind energy installations.
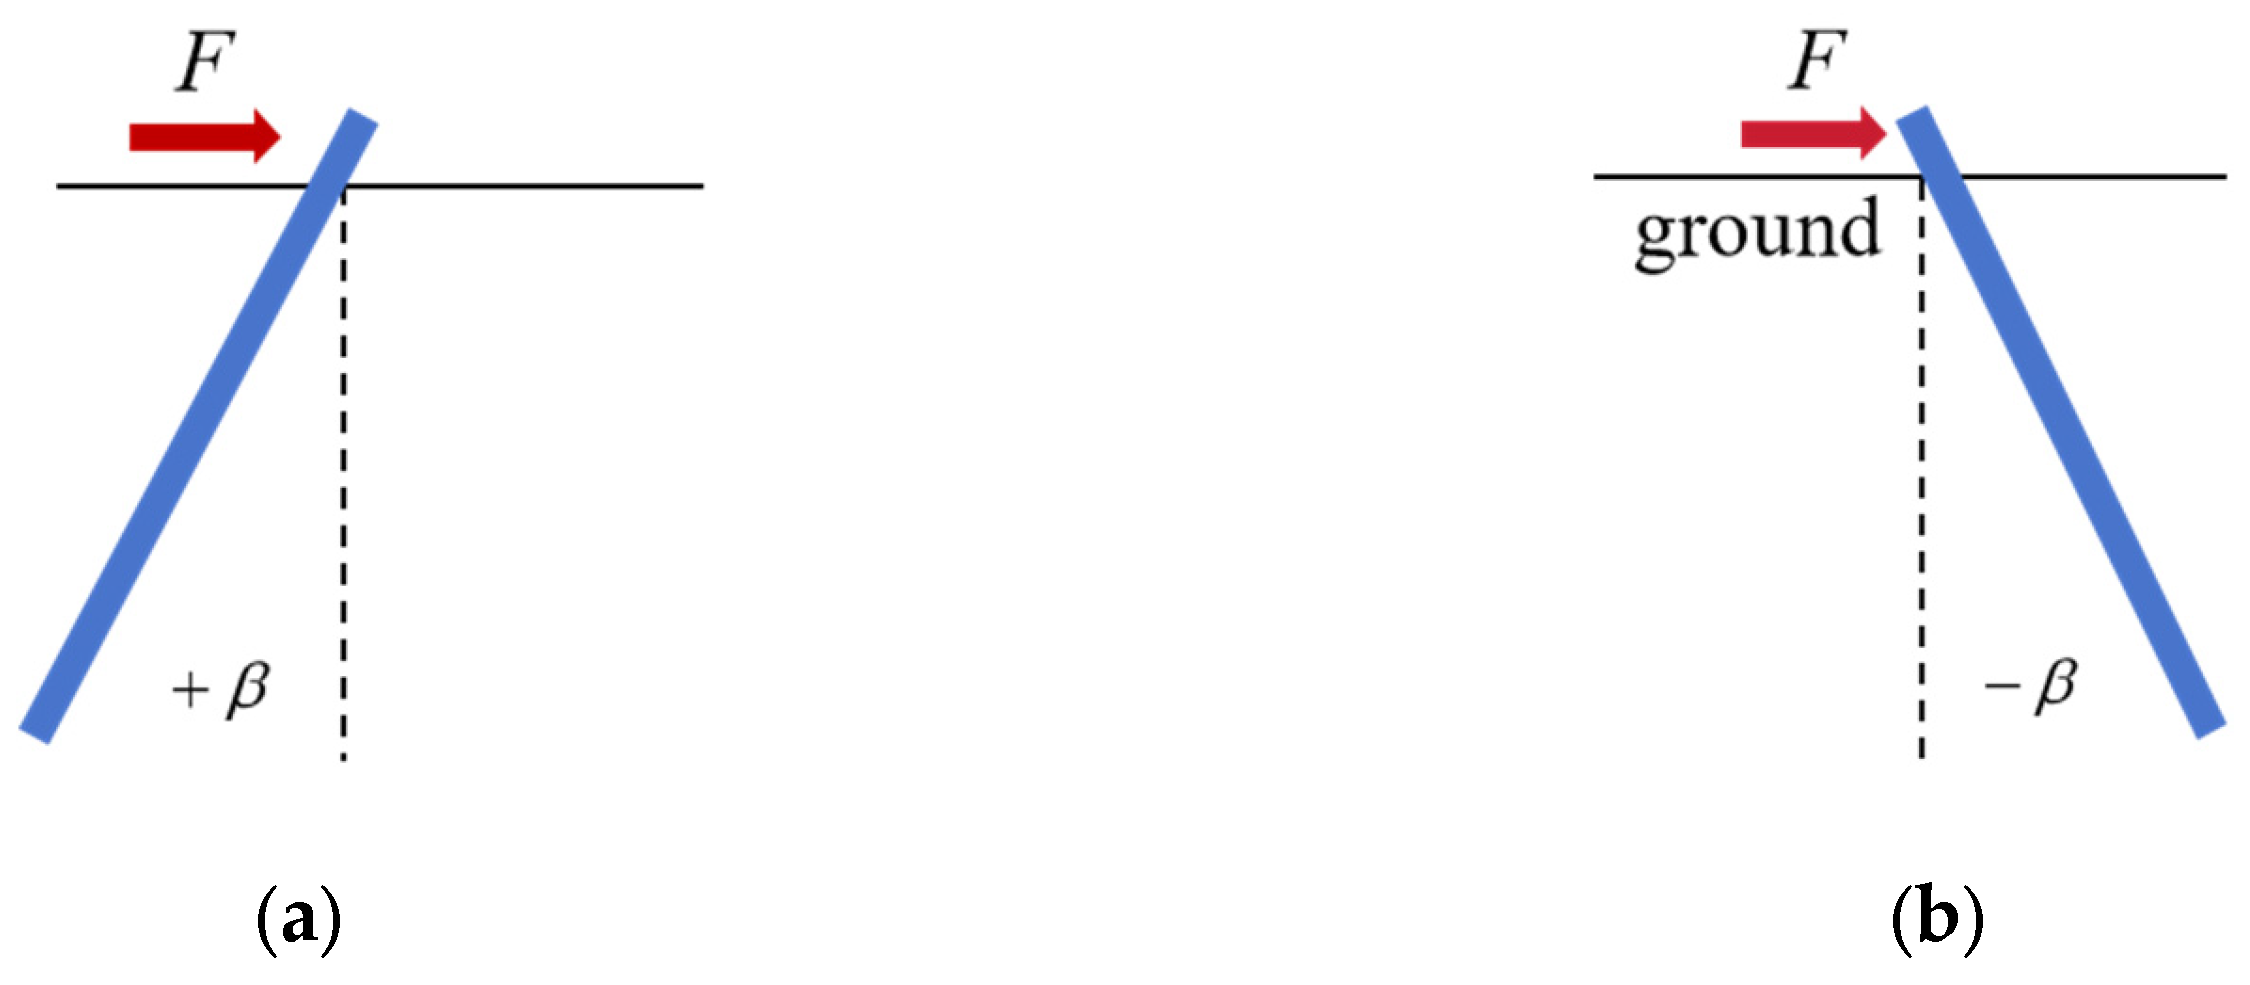
Recent studies have investigated the horizontal loading behavior of batter piles; however, different methodologies and underlying assumptions have resulted in inconsistent findings. Although batter piles are classified as either positive or negative based on the alignment between their inclination direction and applied loading, terminological discrepancies remain prevalent in the literature. This study employs the classification criteria presented in Figure 1.
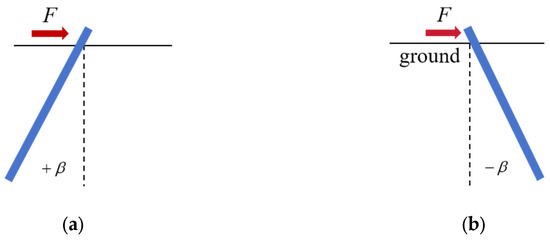
Figure 1.
Definition of batter pile direction. (a) Positive batter pile; (b) negative batter pile.
The orientation of pile inclination significantly influences the horizontal bearing capacity of batter piles, underscoring the need to clearly define the relationship between horizontal loading and pile inclination. In this study, piles inclined toward the horizontal load are classified as positive batter piles, whereas those inclined in the opposite direction are classified as negative batter piles (see Figure 1). Under horizontal loading, positive batter piles compress the soil ahead, thereby densifying it and enhancing its strength [8]. In contrast, negative batter piles induce soil uplift, which loosens the soil and diminishes its strength. Consequently, positive batter piles exhibit higher initial stiffness owing to increased lateral resistance in the surrounding soil. In contrast, negative batter piles experience localized soil uplift, which leads to a reduction in bearing capacity. Furthermore, numerical simulations reveal that positive batter piles exhibit a distinct moment distribution pattern, closely linked to structural modifications in their load-bearing mechanism under dynamic loading conditions.
Using controlled numerical sand model tests, Palammal and Senthilkumar [9] systematically evaluated the load-bearing performance of vertical and batter pile groups under combined vertical and horizontal loads. Although their experimental methodology yielded valuable insights, the small pile diameter (8 mm) introduced significant size effects that might limit the generalizability of the findings. Subsequent studies by Bajaj et al. [10] expanded the loading conditions to include uplift forces. These studies revealed that positive batter piles, with a length-to-diameter ratio of 38° and an inclination angle of 35°, exhibited superior load-carrying capacity under multidirectional loading scenarios. Notably, their parametric analysis identified an optimal inclination angle for improved structural efficiency. Cao W et al. [8] developed a hyperbolic p-y curve for batter piles in sandy soil using model tests. Their results show that for positive batter piles, the lateral displacement of the pile head decreased with increasing inclination angle, whereas for negative batter piles, the lateral displacement increased. Vertical compression and uplift loads significantly influenced the behavior of batter piles.
Recent studies have primarily focused on the static load-bearing performance of batter piles under constant loading conditions. Offshore batter pile cap foundations entail complex interactions. These foundations have multiple closely spaced batter piles. The interactions occur between the pile foundation, the surrounding soil, and the wind turbine structure. Characterizing load distribution patterns in marine environments is crucial for analyzing foundation load-bearing mechanisms. However, systematic research on this subject remains limited.
The interaction between soil and piles under horizontal loads is typically characterized by p-y curves, which have been extensively studied in global geotechnical research. McClelland et al. [11] proposed a correlation between the p-y curve and the Δσ–ε curve. Wang H et al. [12] normalized the hyperbolic p-y curve and the Δσ–ε curve from the Duncan–Chang model, thereby establishing their relationship and deriving the p-y curve for vertically loaded piles in cohesive soil. O’Neill et al. [13] compared various p-y curves for vertical piles in sandy soil, and concluded that a hyperbolic tangent function effectively describes the p-y curve. Kim et al. [14] conducted small-scale model tests on horizontally loaded vertical piles and developed a hyperbolic p-y curve for vertical piles in sandy soil based on Konder’s [15] hyperbolic stress–strain relationship. Wu J et al. [16] emphasized the importance of incorporating advanced technologies such as artificial intelligence, deep learning, and big data into p-y curve model research. However, most existing studies focus on vertical and batter piles on land, and there is limited research addressing high-inclination piles for offshore wind turbines.
Currently, finite element numerical simulation techniques significantly aid in solving various engineering problems. Vaghefi, M et al. [17] employed LS-DYNA numerical simulations to elucidate the key mechanism of soil–structure interaction under blast loading; they found that soil not only transmits shock waves, but also, through its reflective effect, significantly intensifies damage to the underside of the bridge deck slab. Alhassan, M.A et al. [18] developed a fast and accurate finite element model to propose an efficient nonlinear model for analyzing RC slab behavior under monotonic loads and various boundary conditions. Hájek R et al. [19] combined numerical simulations using LS-DYNA with experimental data to reveal the unique energy dissipation mechanism in heterogeneous concrete structures under blast loading, offering a novel perspective for protective engineering design. Mobaraki, B et al. [20] investigated the dynamic response of underground tunnel structures to surface explosions using numerical techniques.
The load transfer mechanism of offshore pile cap foundations was investigated through a stepwise loading analysis of pile behavior conducted with FLAC3D 7.0, a finite-difference-based software. The interaction between high-inclination pile groups and the surrounding soil during staged loading was systematically examined. This examination elucidated the load transfer process within the foundation. A scientific basis was established to support the design of more cost-effective batter cap foundations, thereby enhancing the performance of offshore wind farms.
2. Materials and Methods
In geotechnical engineering, the numerical method mainly includes FEM [21,22,23,24] and the FDM [25,26]. The commonly used FEM softwares, including ABAQUS [27], ANSYS [28], ADINA [29], PLAXIS 3D [30], and FLAC3D, a widely used FDM software, have demonstrated high efficiency in analysis [31]. In recent decades, numerical simulation has attracted significant attention and has been successfully applied across various fields.
2.1. Numerical Simulation and Analysis
Table 1 summarizes the geotechnical parameters of the marine soil. Here c denotes cohesion, ψ represents the friction angle, and E is the Young’s modulus (commonly E = 400–600 for cohesive soils). Cu corresponds to the undrained shear strength of clay, while the values for sandy silts and silts are determined using empirical relationships. Qsk refers to the ultimate side friction resistance, and Qpk represents the ultimate end-bearing capacity. A 4.0 MW wind turbine is installed atop the structure.

Table 1.
Soil layer parameters.
2.2. Material Properties and Dimensions
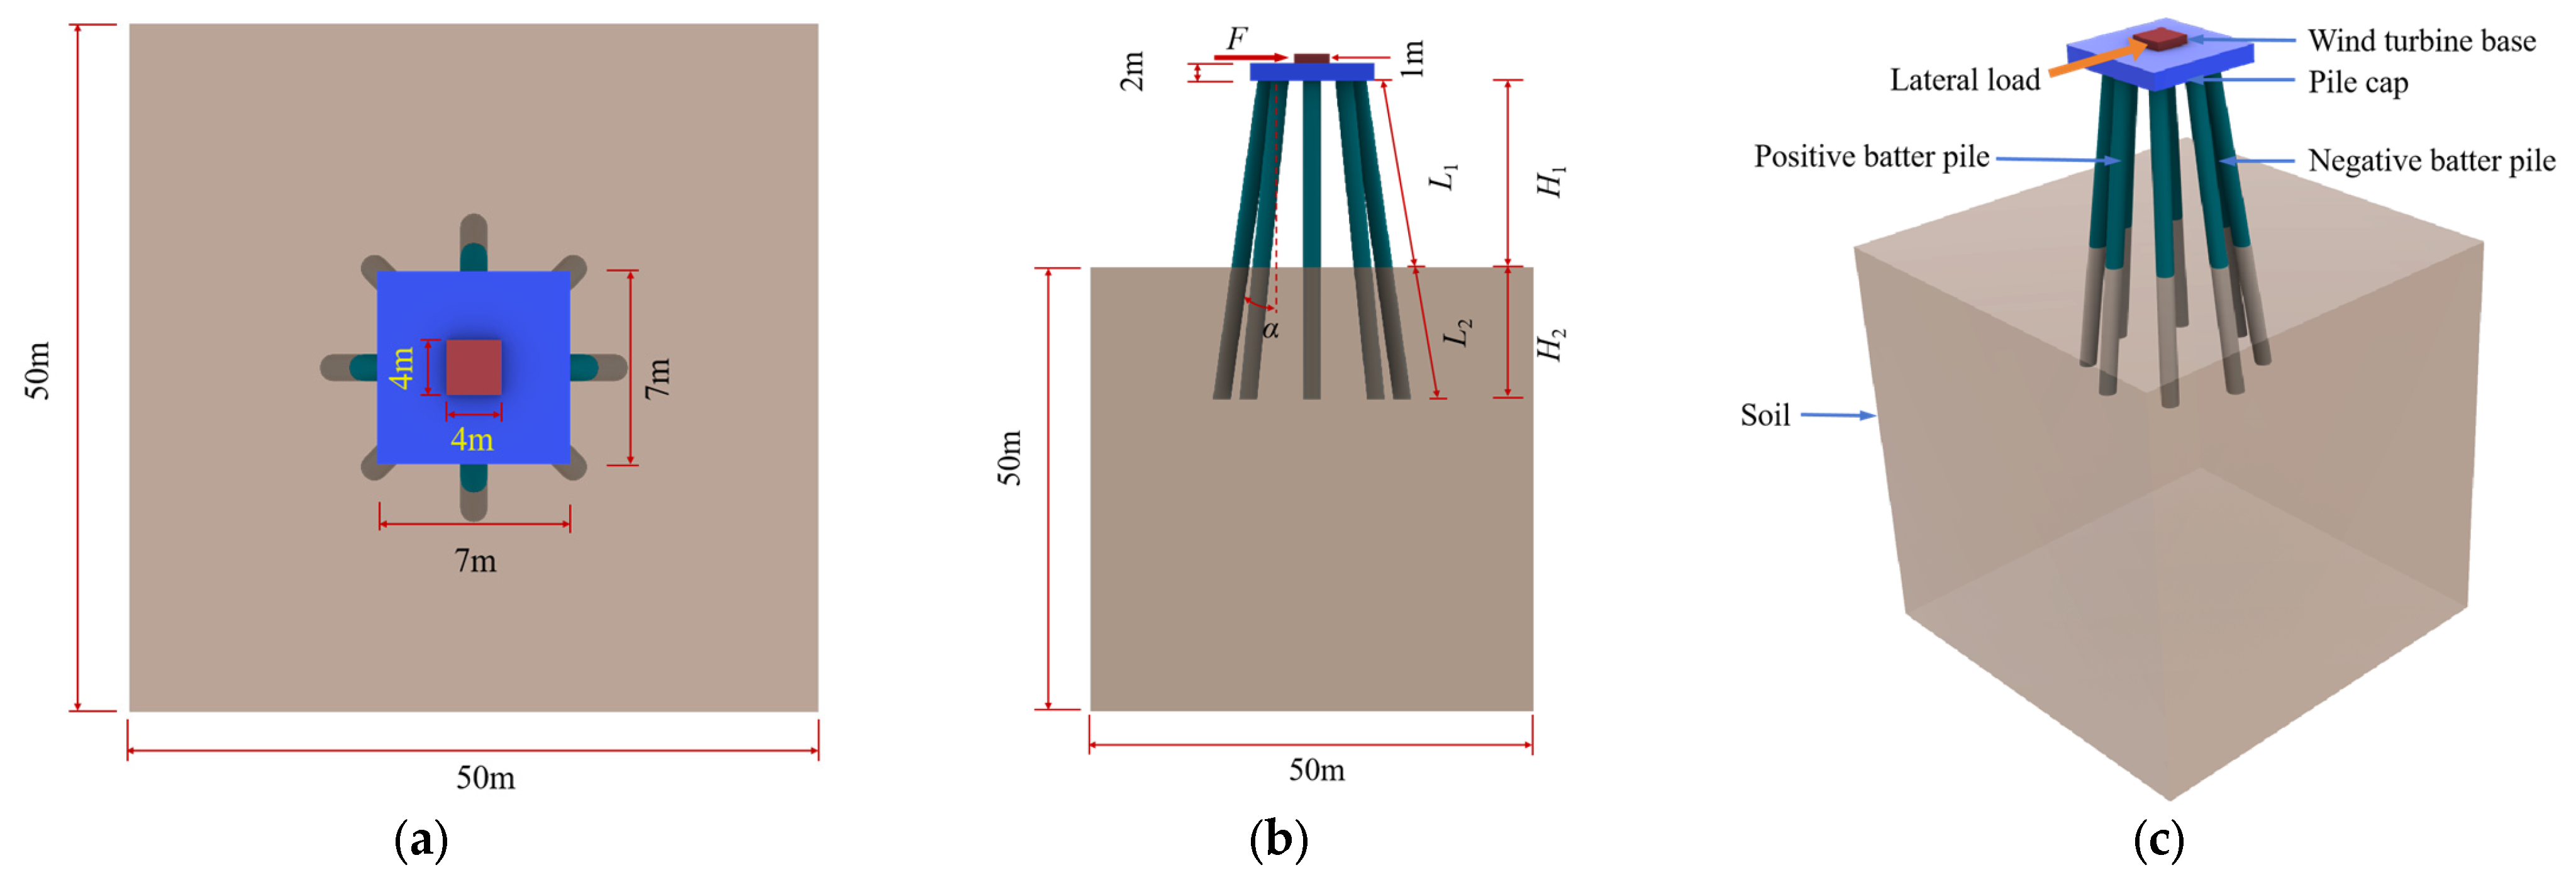
Figure 2 illustrates the geometric dimensions and mesh configuration of the high-inclination pile cap foundation for the offshore wind turbine. An eight-pile high-rise pile group (HRPG) model was developed, featuring pile cap embedment depths of 9 m, 12 m, 15 m, 18 m, and 21 m. The HRPG piles possess a diameter of 2 m and are available in lengths of 30 m, 33 m, 36 m, 39 m, and 42 m. The cases analyzed are shown in Table 2, where cases 1 to 5 represent embedment depth of 9 m to 21 m, respectively. The total pile length (Pp) comprises two components: the exposed length (L1) and the embedment length (L2). For vertical piles, the exposed length is equivalent to the exposed depth (H1), while the embedment length (L2) corresponds to the embedment depth (H2). For batter piles, the exposed and embedment depths, (H1) and (H2), are calculated using Formulas (1) and (2).
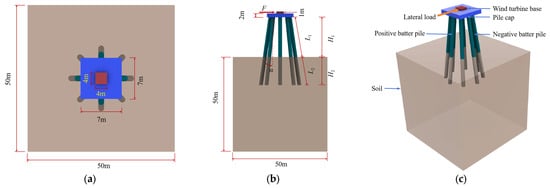
Figure 2.
High-inclination pile cap foundation for the offshore wind turbine. (a) Plan; (b) elevation; (c) three-dimensional views.
Table 2.
Case analyzed.
The soil medium is modeled as a cube with side lengths of 50 m, whereas the pile cap is represented as a square structure with a radius of 7 m and a height of 2 m. The wind turbine base is supported by a square pile cap measuring 4 m by 4 m and 1 m in height. Linear elasticity is assumed for both the pile and cap. The Mohr–Coulomb constitutive model is employed to represent the soil medium, as it effectively captures the yielding behavior of soft marine soils under three-dimensional stress states, including deformations induced by both vertical and lateral loads. The steel pipe piles, fabricated from Q345C steel, have a wall thickness of 30 mm. Detailed characteristics of the piles are presented in Table 3.
Table 3.
Pile characteristics.
A polyhedral volume mesh was used to model the HRPG and the soil medium, with mesh refinement applied near the HRPG. In FLAC3D, the interaction between the HRPG and the soil was modeled using interface elements that simulate sliding or separation along the contact plane. Depending on the pile inclination angle, embedment depth, and cap elevation, the model comprised approximately 70,000 grid points and around 11,000 zones. The model defines four region groups. The horizontal boundaries (in the x and y directions) were fixed, whereas the vertical boundary was left free. The bottom boundary was fully fixed, and the top surface was free in all directions. An idealized model was created for each specified case.
2.3. Simulation Procedure
Both the solid element and the pile element exhibit distinct advantages and limitations. The solid element consists of closed geometric regions defined by surface boundaries, with nodes located at their vertices. While displacements can be calculated relatively straightforwardly using solid elements, determining bending moments remains more complex. In contrast, the pile element consists of two nodes, each with six degrees of freedom, making them more convenient for calculating bending moments. To leverage these strengths, the numerical simulation was divided into two parts: one for deformation analysis and one for bending moment calculations. For the deformation analysis, piles were modeled with solid elements, whereas pile elements were employed for bending moment calculations. Both types of elements were used in separate calculation groups. The pile parameters—including mass, density, Young’s modulus, cross-sectional area, Poisson’s ratio, second moment of area, and polar moment of inertia—remain constant. The numerical process for obtaining deformation data is summarized as follows.
Step 1: Generate the mesh and assign the regions to designated groups. These groups facilitate the identification of distinct model components and enable the systematic naming and categorization of objects. Four groups were defined, namely, “Soil”, “Pile”, “Pile Cap”, and “Wind Turbine Base Platform”. The model uses unstructured meshes dominated by quadrangular elements (contains a mixture of triangles and quadrilaterals). The aspect ratio is 1:1.5 in the model.
Step 2: Define the model, its boundary conditions, and initial conditions. After generating the mesh and partitioning the regions, constitutive models and material properties were assigned to the corresponding groups. This study employed two constitutive models: the Elastic model and the Mohr–Coulomb model. The Elastic model represents isotropic elastic behavior, whereas the Mohr–Coulomb model characterizes the stress–strain relationship for soils and rocks. Rolling boundary conditions were applied to the symmetrical lateral boundaries of the model, while the bottom boundary was fully fixed in all directions. The initial stress state was induced by gravity to simulate in-situ stress conditions, assuming a static earth pressure coefficient K0 of 0.5. The Mohr–Coulomb model was applied to the region beneath the surface of the soil grouping model.
Step 3: Replace the Mohr–Coulomb model with the Elastic model for the solid element in the pile and pile cap groups to represent C35 grade concrete. The pile–soil interface was activated, and a high stiffness value was assigned to prevent relative displacement between materials. This step simulates the installation process of the high-inclination pile cap foundation for the offshore wind turbine.
Step 4: Initialize the displacement and velocity of the mesh points, excluding pile deformation caused by gravity.
Step 5: Apply lateral loads horizontally to the pile cap in the direction of the wind turbine base platform. The load was incrementally increased by 300 kN per step, with the model iterating automatically until the average unbalanced force ratio dropped below 1 × 10⁻⁵. After each step, the model state was saved, and the process was repeated five times until the load reached 1500 kN.
The process for obtaining bending moments is analogous to the one described above, with the primary difference being the use of pile elements built into FLAC3D for simulating the piles. Additional details are available in the FLAC3D user manual.
2.4. Mesh Convergence
In FLAC3D, the equilibrium state refers to a steady condition where forces and strains in the system no longer change, meaning there is no further displacement or stress variation. The equilibrium state in the simulation typically indicates the stability and convergence of the model during computation. In this paper, we use the equilibrium state to represent mesh convergence. Mesh convergence refers to the process whereby simulation results, such as stress and displacement, stabilize as the mesh size (number of elements) is progressively refined. When the mesh is refined, the computational results converge to a fixed value. Under this condition, the model is considered to converge effectively. The accuracy of the results improves because of this convergence. Displacement is recorded for each grid size during simulations with different grid divisions. The grid count is divided into five groups, ranging from 14,000 to 84,000 with intervals of 14,000, at an embedment depth of 15 m and an inclination angle of 8 degrees. The results are presented in Figure 3.
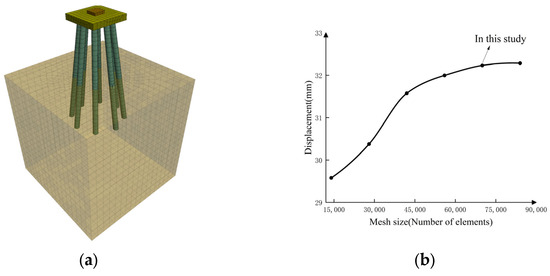
Figure 3.
Mesh plot. (a) Mesh of the model. (b) Mesh convergence plot.
2.5. Validation of Numerical Models
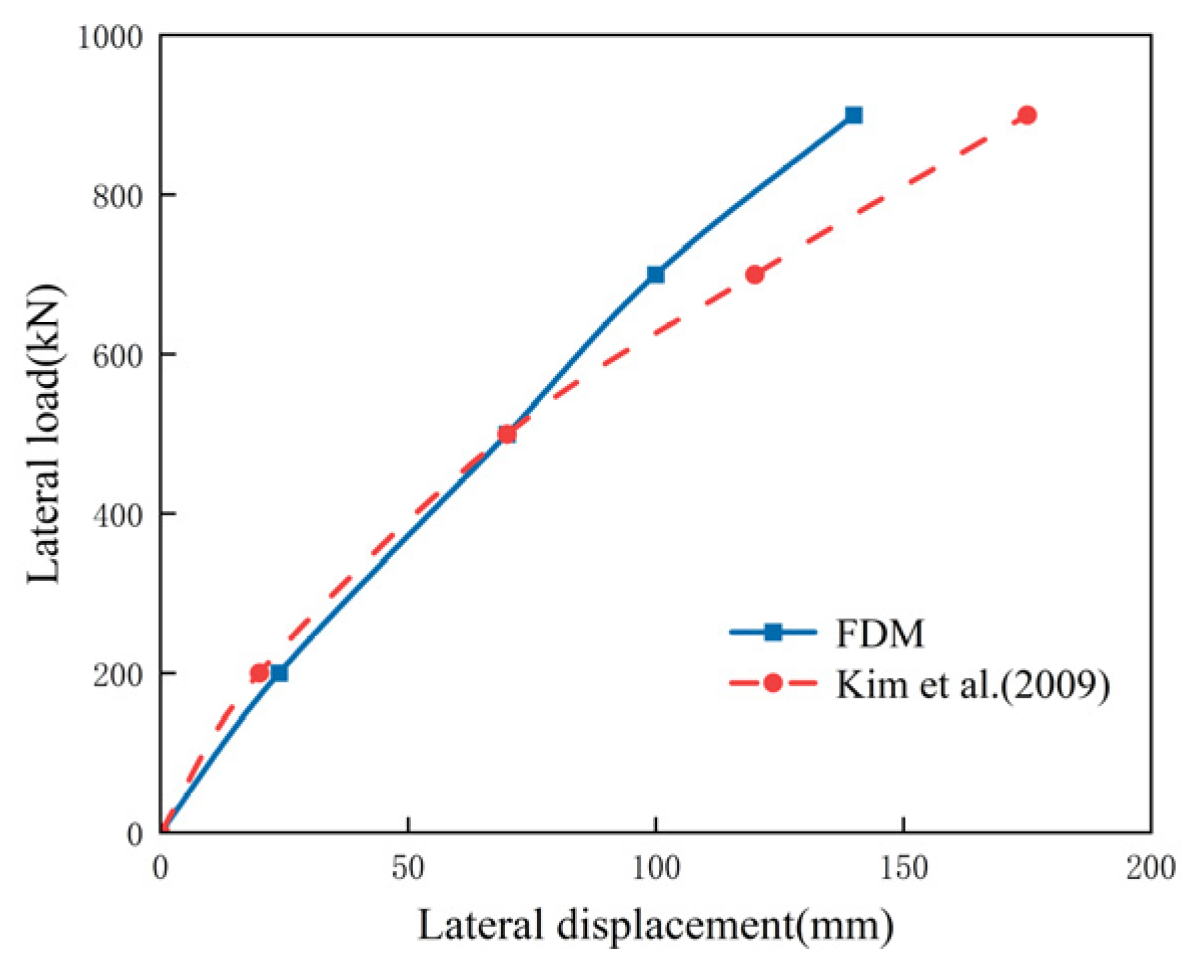
To verify the activity of our Finite Difference Method (FDM) FLAC3D, the response of load–displacement resulting from the numerical model is compared with the results in the available literature. The results were compared. Kim et al. [32] reported on field tests of steel pipe piles under lateral loads installed at the Incheon Bridge site in South Korea. The pipe piles had an outer diameter of 1.016 m and a wall thickness of 16 mm. The bending stiffness of the pile section was 1,260,000 kN·m2. Each pile was driven using an oil pressure hammer and a 1.0 m-long pile head remained above the ground surface. The final depth of the driven piles was recorded as 25.6 m. The mapped local geology is that of a marine deposit. The lateral load was applied at a point 0.5 m above the ground surface and increased substantially up to a maximum load of 900 kN. Figure 4 shows the comparison of the pile head deflection versus lateral load curves derived from the field testing and computed by the presented method. Reasonable agreement with testing results has been achieved by the present model under likely working conditions. Thus, the lateral response loading of offshore piles can be investigated = using this model.
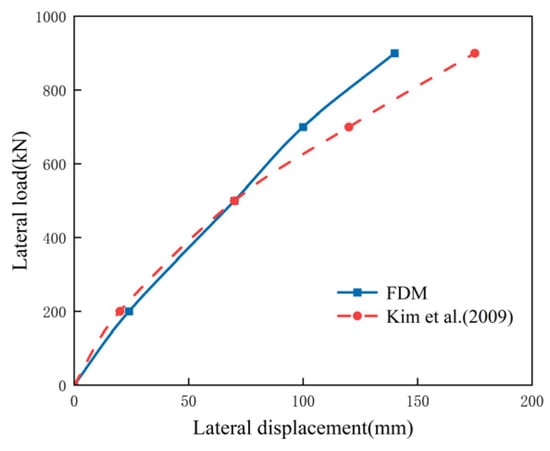
Figure 4.
Pile head lateral deflection versus lateral load [32].
3. Results
This study investigates the response of high-rise pile groups (HRPG) subjected to lateral loading, emphasizing the effects of different inclination angles, cap elevations, embedment depths, and load magnitudes while maintaining constant soil properties. Additionally, pile spacing, row spacing, and pile diameter were kept constant. The design considerations for laterally loaded piles primarily include two key parameters, namely, maximum bending moment and displacement. These parameters were analyzed in detail to underscore the benefits of employing a high-inclination pile cap foundation for offshore wind turbines.
3.1. The Displacement Results of HRPG
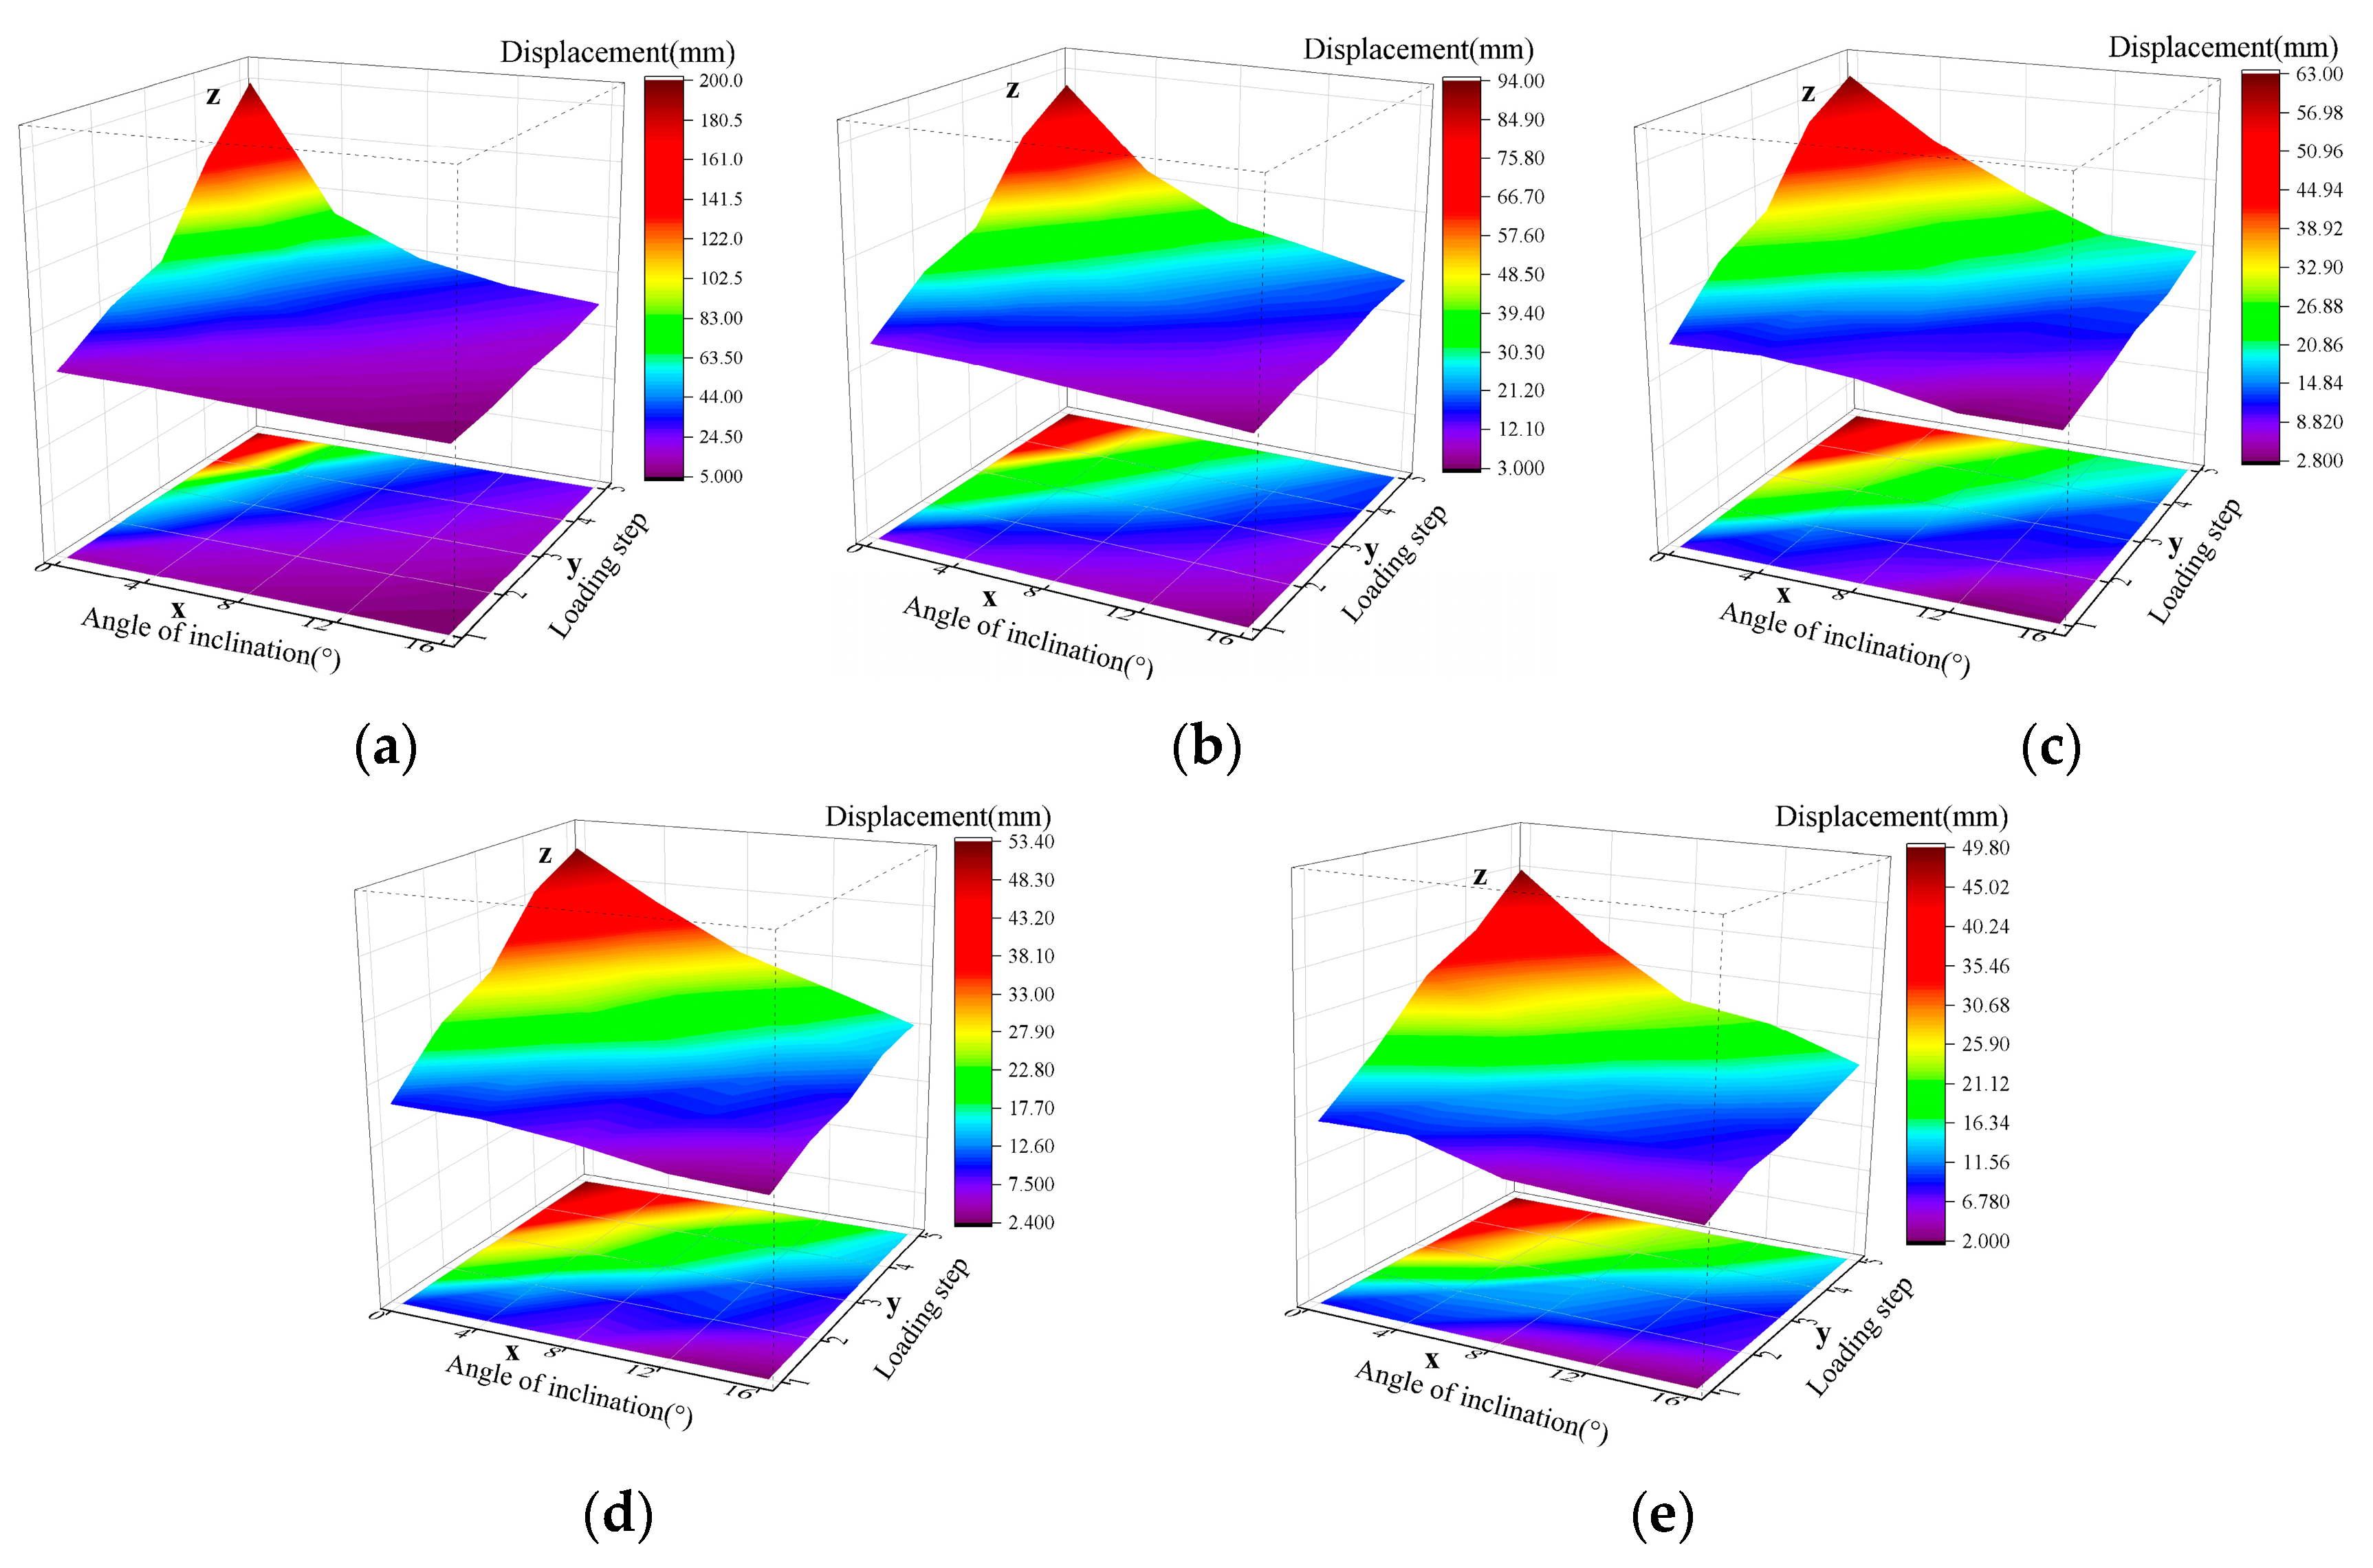
Figure 5 shows the displacement contour of HRPG over a range of embedment depths from 9 m to 21 m. It is a three-dimensional Cartesian coordinate system. As shown in Figure 3, the X-axis is the incline angle, the Y-axis is the loading step, and the Z-axis is the lateral displacement of the pile cap. Usually, the pile cap has the maximum deformation. Figure 5a–e illustrates the maximum displacement of the HRPG for embedment depths of 9 m, 12 m, 15 m, 18 m, and 21 m. Here, “D” denotes the embedment depth of the pile foundation and “9” denotes depth. The analysis of the HRPG shows that increasing the pile inclination and the number of loading stages significantly reduces the displacement. For vertical piles in the fifth step of loading, the maximum displacements were 199.07 mm (D9) and 93.51 mm (D12), respectively. In contrast, for piles inclined at 16° in the first step of loading, the maximum displacement decreases sharply to 5.42 mm (D9) and 3.47 mm (D12). When the inclination was 4°, the displacement was again maintained at relatively high levels of 81.51 mm (D9) and 55.21 mm (D12). This result highlights a critical point: below 4° of inclination, the displacement decreased faster, while above 4° it decreased more slowly, and between 12° and 16° it slowed down further. Observations indicate that increasing the embedment depth from 9 m to 12 m consistently reduced pile head displacement. At the first step of loading, displacement decreased from 13.68 mm at an embedment depth of 9 m to 11.35 mm at 12 m; at the fifth step of loading, they decreased from 199.07 mm to 93.51 mm. Similar trends were observed for inclinations between 4° and 16°. Specifically, at the first step of loading, displacement was 12.78 mm at 9 m versus 11.11 mm at 12 m; at the second step, they increased to 22.06 mm (9 m) and 18.44 mm (12 m); and at the fifth step, displacement reached 81.51 mm at 9 m and 55.21 mm at 12 m. These findings indicate that deeper embedment enhances structural stiffness and improves resistance to deformation under higher loads. Observations indicate that the influence of pile inclination on displacement becomes more pronounced above 8°, reaching an optimum at 12°. For loads below 600 kN, minimal displacement is maintained; however, significant increases occur between the third and fifth steps of loading. At an embedment depth of 12 m, the displacement is approximately 50–75% of that at 9 m, suggesting that deeper embedment improves deformation resistance under large loads.
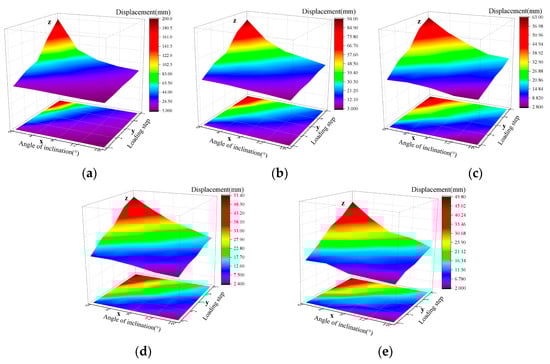
Figure 5.
Displacement contour of HRPG. (a) Embedment depth 9 m; (b) embedment depth 12 m; (c) embedment depth 15 m; (d) embedment depth 18 m; (e) embedment depth 21 m.
The displacement contours for an embedment depth of 15 m (Figure 5c and 18 m Figure 5d) further confirm this trend. At an embedment depth of 15 m, the pile head displacement decreased from 9.75 mm at 0° to 4.89 mm at 16° during the first step of loading; similar reductions were observed in subsequent steps of loading. Enhanced stability and deformation control were achieved with a 15 m embedment depth, as evidenced by consistently smaller displacements across all step loadings, particularly under higher inclination angles and loads, compared to shallower depth. At an embedment depth of 18 m, the pile head displacement during the first step loading decreased from 9.66 mm at 0° to 2.40 mm at 16°, marking the smallest displacement among all evaluated depths, especially at 16°. Although displacement at the fifth step of loading increased from 53.37 mm at 0° to 15.77 mm at 16°, the 18 m embedment depth consistently yielded lower displacements than those observed at 9, 12, and 15 m, confirming its superior resistance to deformation under inclined loading. Similarly, at an embedment depth of 21 m, the pile head displacement during the first step of loading decreased from 8.77 mm at 0° to 2.13 mm at 16°, and by the fifth step of loading, it increased from 49.77 mm at 0° to 14.68 mm at 16°. In both cases, the minimum displacement occurred at a 16° inclination, suggesting that a greater embedment depth significantly improves deformation resistance. Figure 5 demonstrates that for vertical piles, pile head displacement decreases as embedment depth increases. At the first step loading, displacement decreased from 13.68 mm at a 9 m embedment depth to 8.77 mm at a 21 m embedment depth, with the minimum displacement observed at 21 m indicating enhanced performance. At the fifth step of loading, displacement decreased from 199.07 mm at a 9 m embedment depth to 49.77 mm at a 21 m embedment depth, confirming that deeper embedment significantly reduces displacement, particularly under higher loads. For inclination angles between 4° and 16°, the pile head displacement at the first step of loading decreased from 12.78 mm at 9 m depth to 9.21 mm at 21 m depth, indicating enhanced deformation resistance with greater embedment. At the fifth step of loading, displacement decreased from 199.07 mm at 9 m to 49.77 mm at 21 m, confirming that deeper piles effectively reduced displacement under higher loads and larger inclinations. When the pile inclination was 8° and the fifth step of loading was reached, the horizontal displacement at the pile head decreased sequentially—47.21 mm at 9 m, 35.25 mm at 12 m (D12, a 25.32% reduction), 32.23 mm at 15 m (D15, an 8.67% reduction from D12), 29.79 mm at 18 m (D18, a 7.85% reduction from D15), and 23.95 mm at 21 m (D21, a 19.6% reduction from D18). Under primary loading conditions, the pile head displacement decreased from 5.42 mm at 9 m to 3.47 mm at 12 m (a 36.40% reduction), and then to 2.99 mm at 15 m (a 14.07% reduction), 2.4 mm at 18 m (a 20.10% reduction), and finally to 2.13 mm at 21 m (an 11.25% reduction).
3.2. The Moment of the HRPG
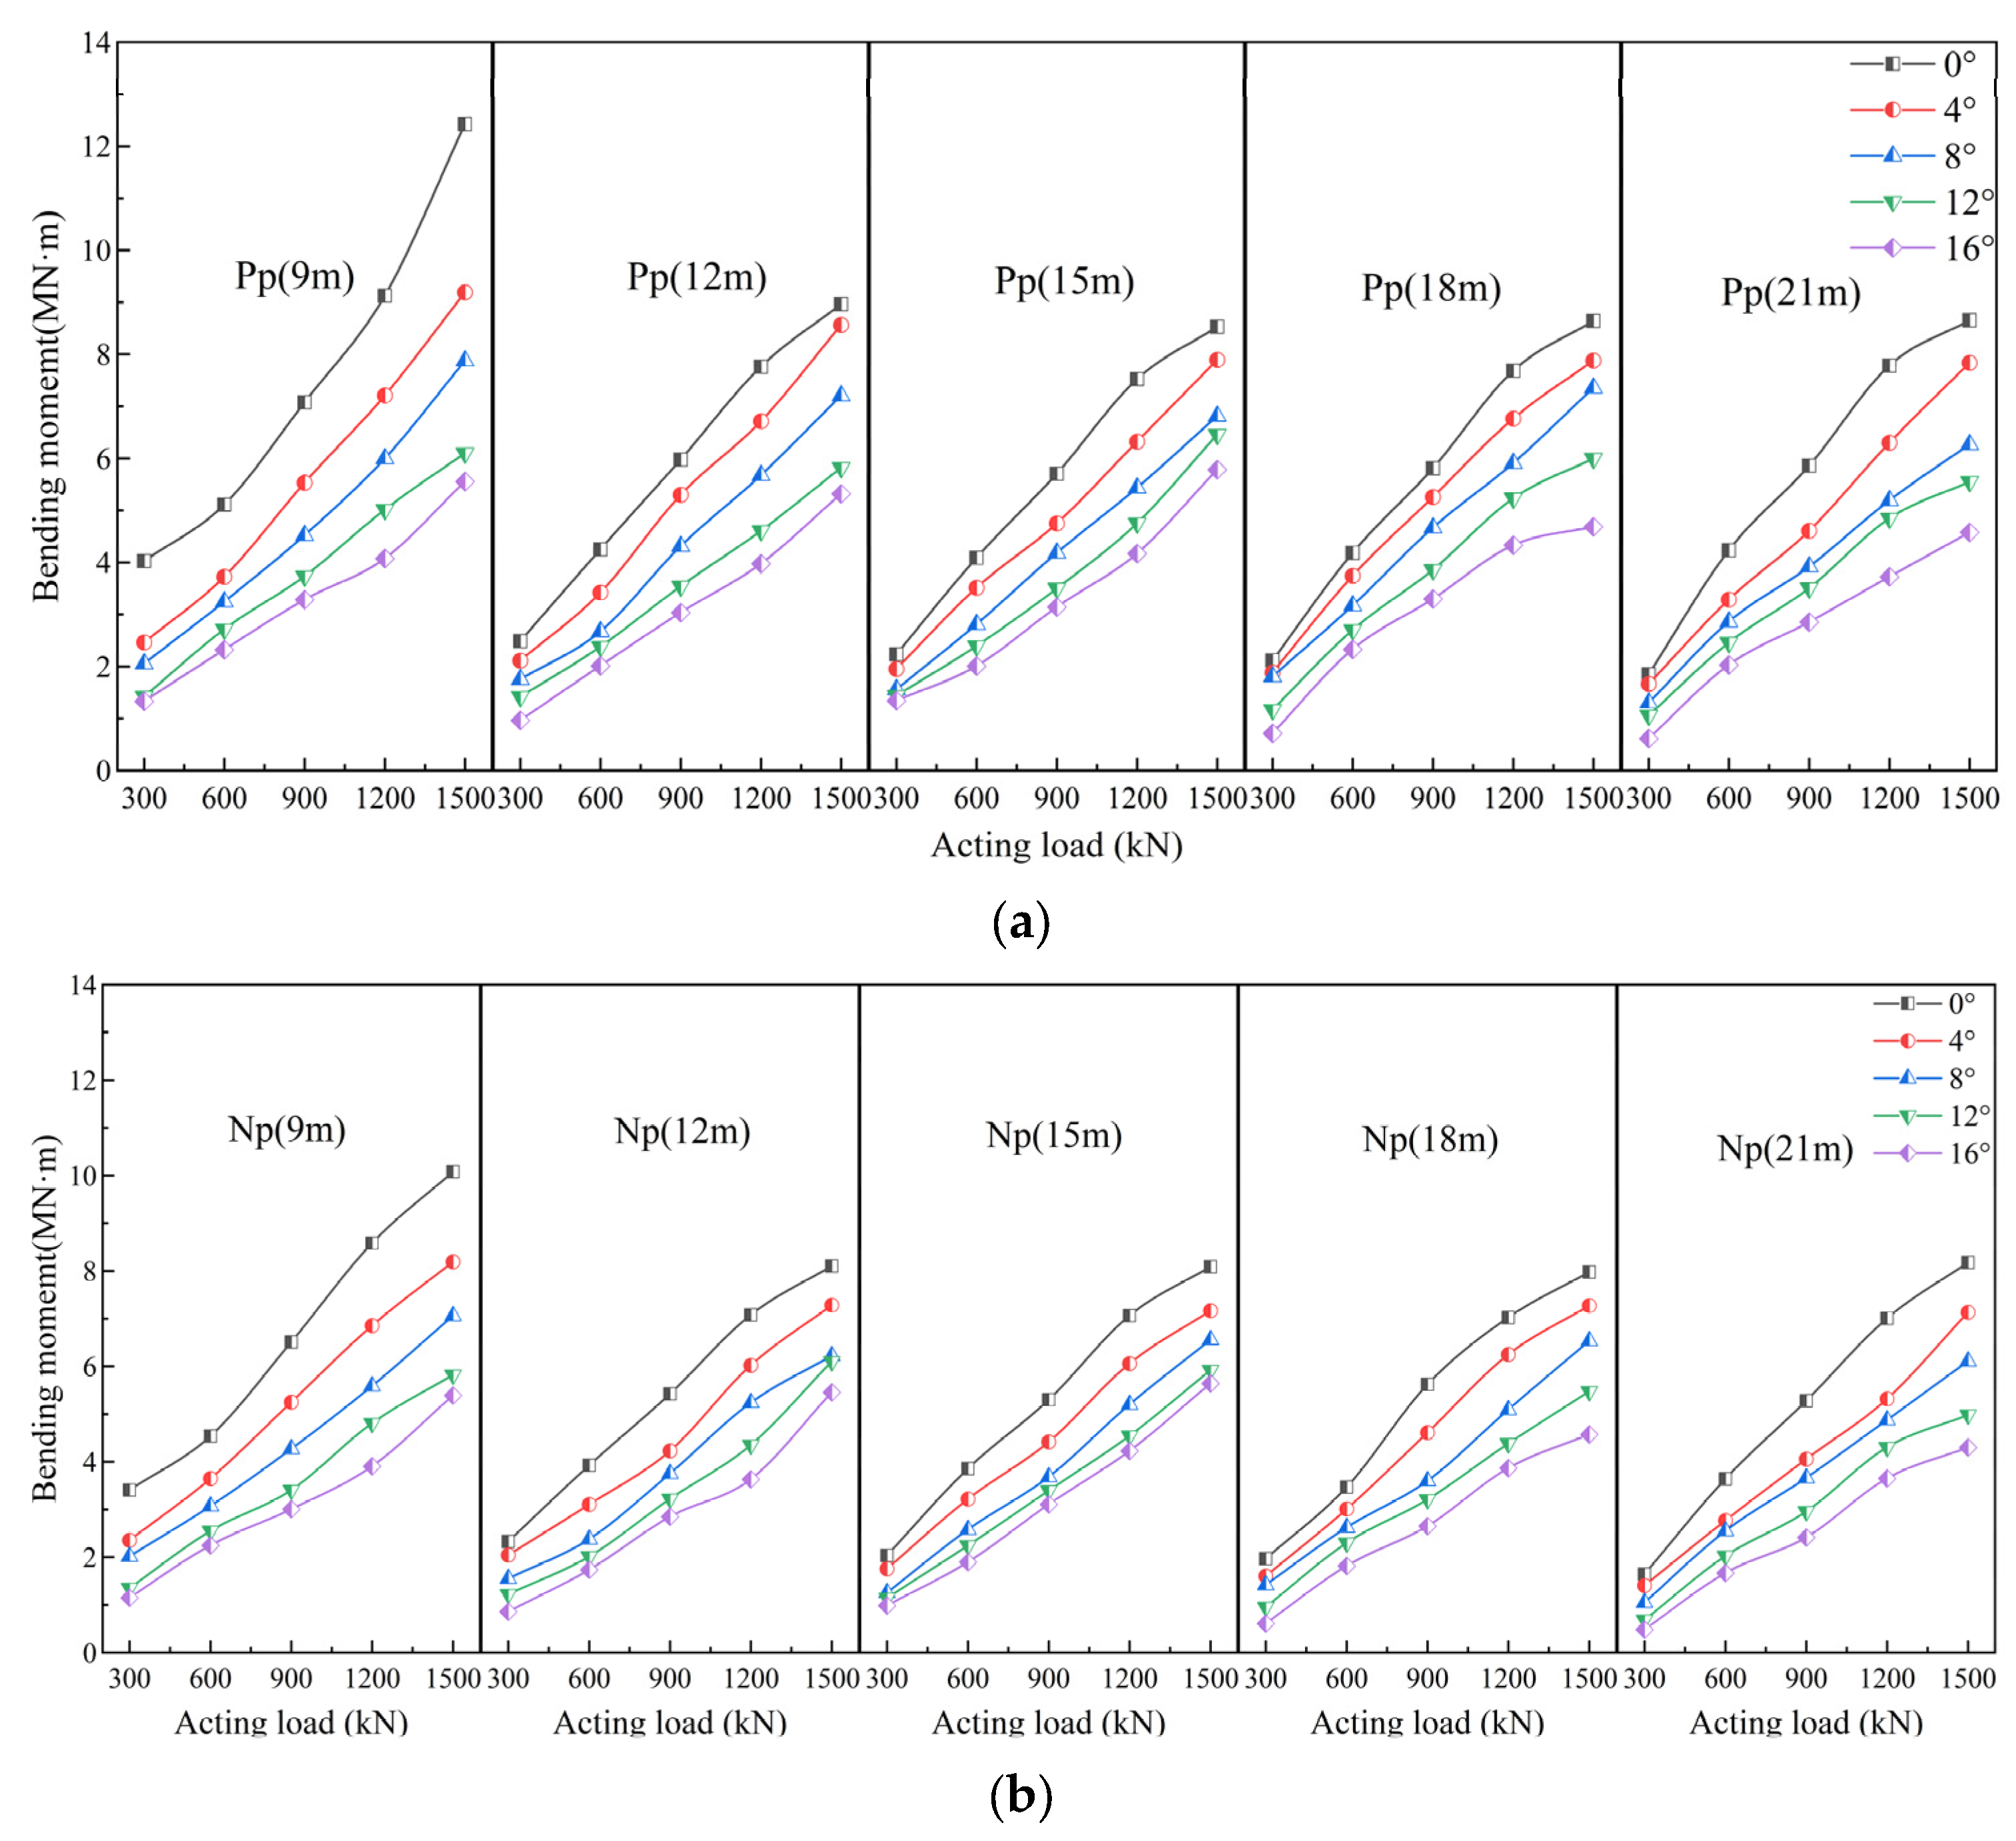
Figure 6 illustrates the maximum bending moment of the HRPG at different embedment depths. In this context, “9 m” denotes a 9 m embedment of the offshore wind turbine high-raise pile foundation, whereas “Pp” and “Np” refer to positive and negative batter piles, respectively. Absolute values are employed for comparison. The figure is organized into two rows—one for “Pp” and one for “Np”—and five columns corresponding to embedment depths of 9, 12, 15, 18, and 21 m.
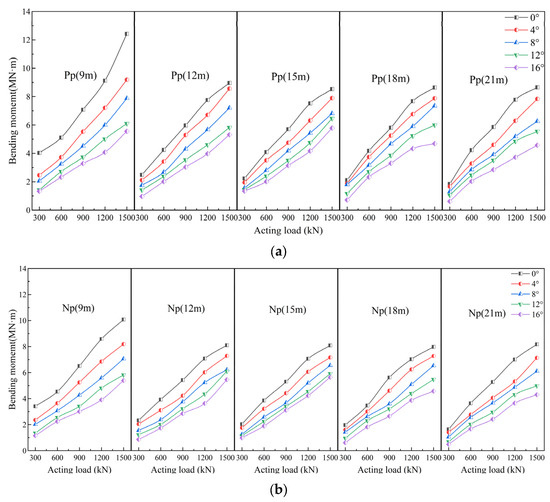
Figure 6.
Maximum bending moment of HRPG. (a) Positive batter pile; (b) negative batter pile.
The maximum bending moment of the positive batter pile at an embedment depth of 9 m was 12.422 MN·m, while the maximum bending moment of the negative batter pile was 10.078 MN·m. When the pile inclination was 16°, the maximum bending moment of the positive batter pile was 5.84 MN·m, and the maximum bending moment of the negative batter pile was 5.54 MN·m, representing 47% and 54.9% of the bending moment at 0°, respectively. At an embedment depth of 12 m, the maximum bending moment of the positive batter pile was 8.796 MN·m, and the maximum bending moment of the negative batter pile was 8.1 MN·m. At an inclination angle of 16°, the maximum bending moments were 5.45 MN·m and 5.31 MN·m, representing 61.9% and 65.5% of the bending moment at 0°, respectively. At an embedment depth of 15 m, the maximum bending moment of the positive batter pile was 8.53 MN·m, and the maximum bending moment of the negative batter pile was 8.09 MN·m. At an inclination angle of 16°, the maximum bending moment was 5.8 MN·m, representing 68.1% of the bending moment at 0°. When the embedment depth was 18 m, the maximum bending moment of the positive inclined pile was 8.50 MN·m, and that of the negative batter pile was 7.97 MN·m. At an inclination angle of 16°, the maximum bending moments were 4.87 MN·m and 4.68 MN·m, representing 57.3% and 58.7% of the bending moment at 0°, respectively. At an embedment depth of 21 m, the maximum bending moment of the positive batter pile was 8.45 MN·m, and the maximum bending moment of the negative batter pile was 8.17 MN·m. At an inclination angle of 16°, the maximum bending moments were 4.6 MN·m and 4.5 MN·m, representing 54.4% and 55.1% of the bending moments at 0°, respectively. The bending moment of the HRPG decreased as the embedment depth increased. Moreover, greater embedment depth and steeper pile foundation inclinations significantly reduced the bending moment. Positive batter piles experienced higher bending moments than negative batter piles, indicating that they were subjected to greater lateral forces. For positive batter piles, the inclined upper section showed a greater combined effect of horizontal and vertical forces, which increases the bending moment, especially in softer soils where bending is more pronounced.
4. Discussion
4.1. Effect of Embedment Depth on HRPG
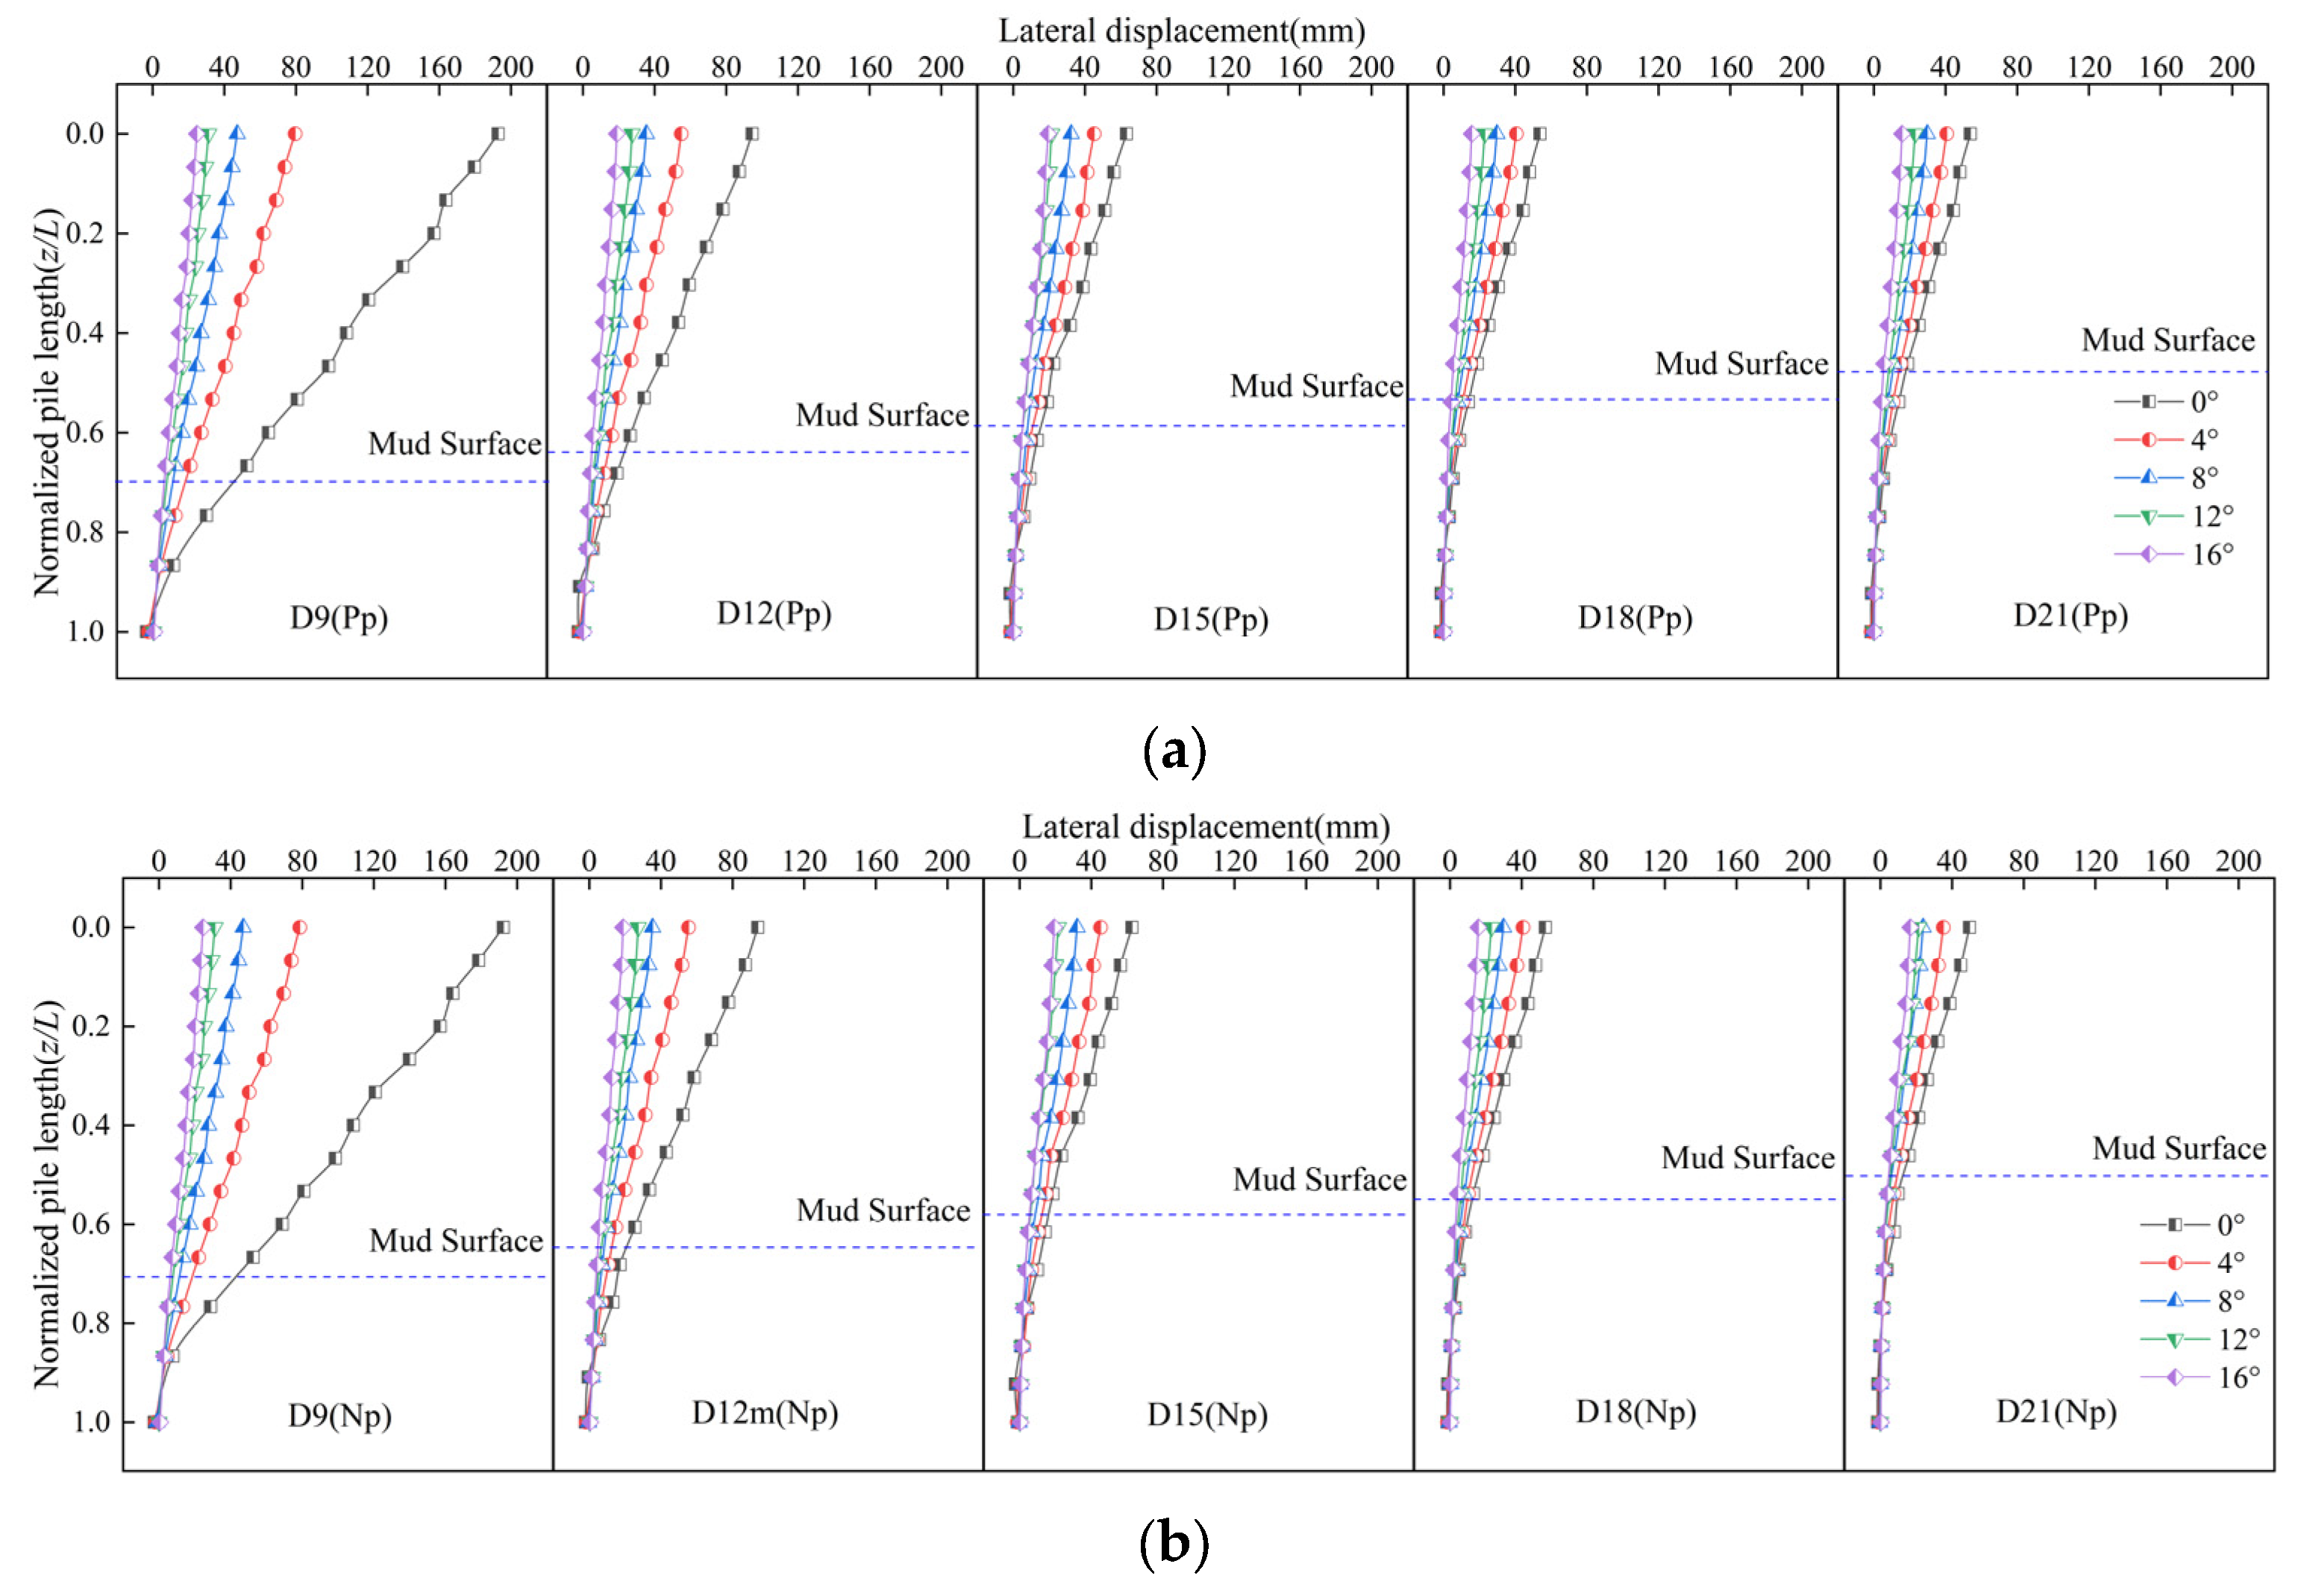
To investigate the effects of embedment depth on HRPG performance, Figure 7 presents the lateral displacement at various embedment depths under two fixed loading conditions. The analysis is centered on the fifth step loading (1500 kN) and normalized to the pile length. The figure is organized into two rows and five columns; the first row depicts the lateral displacement of the positive batter pile (Pp), while the second row illustrates those of the negative batter pile (Np). Each column corresponds to the lateral displacement of the pile at a specific embedment depth. For both positive and negative batter piles, lateral displacement was similar, with the highest values observed at the pile head and the lowest at the pile end. Lateral displacement decreased with increasing embedment depth, with the maximum values at 9 m and the lowest at 21 m. The effect of pile inclination on lateral displacement was more pronounced at shallower embedment depths; however, at 21 m, the variation among different inclination angles was minimal. For example, at 0° inclination, the maximum lateral displacement of positive batter piles decreased from 192.88 mm at a 9 m embedment depth to 94.48 mm at 12 m, 63.25 mm at 15 m, 53.87 mm at 18 m, and 50.01 mm at 21 m. Additionally, positive batter piles exhibited larger lateral displacement than vertical piles. For 8° positive batter piles, the maximum lateral displacement decreased from 47.2 mm at a 9 m embedment depth to 35.32 mm at 12 m, 32.31 mm at 15 m, 29.87 mm at 18 m, and 23.88 mm at 21 m. A significant reduction was observed between 9 m and 12 m embedment depths, whereas further increases from 12 m to 21 m resulted in progressively smaller reductions. The observations indicate that pile displacement variations became more pronounced as pile inclination decreased. When the angle is large, the applied load is decomposed into a component parallel to the pile axis and one perpendicular to it. Consequently, the horizontal displacement of the pile is reduced. Increasing the embedment depth enlarges the contact area between the pile and the surrounding soil, thereby significantly enhancing lateral support. In summary, embedment depths between 9 m and 15 m effectively mitigate the horizontal load’s effects on pile foundations, while depths beyond 15 m yield diminishing benefits relative to the increased construction challenges; however, moderate increases in embedment depth can still reduce horizontal displacement.
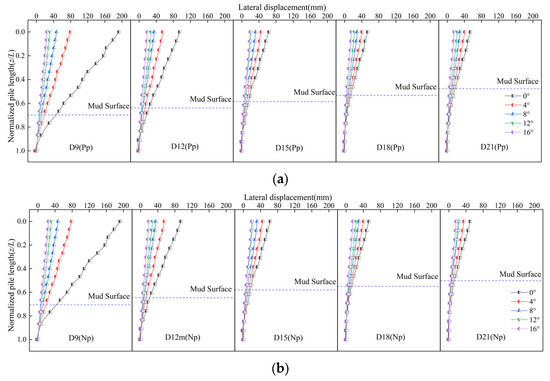
Figure 7.
Transverse displacement at different inclination angles under transverse loading conditions. (a) Positive batter pile; (b) negative batter pile.
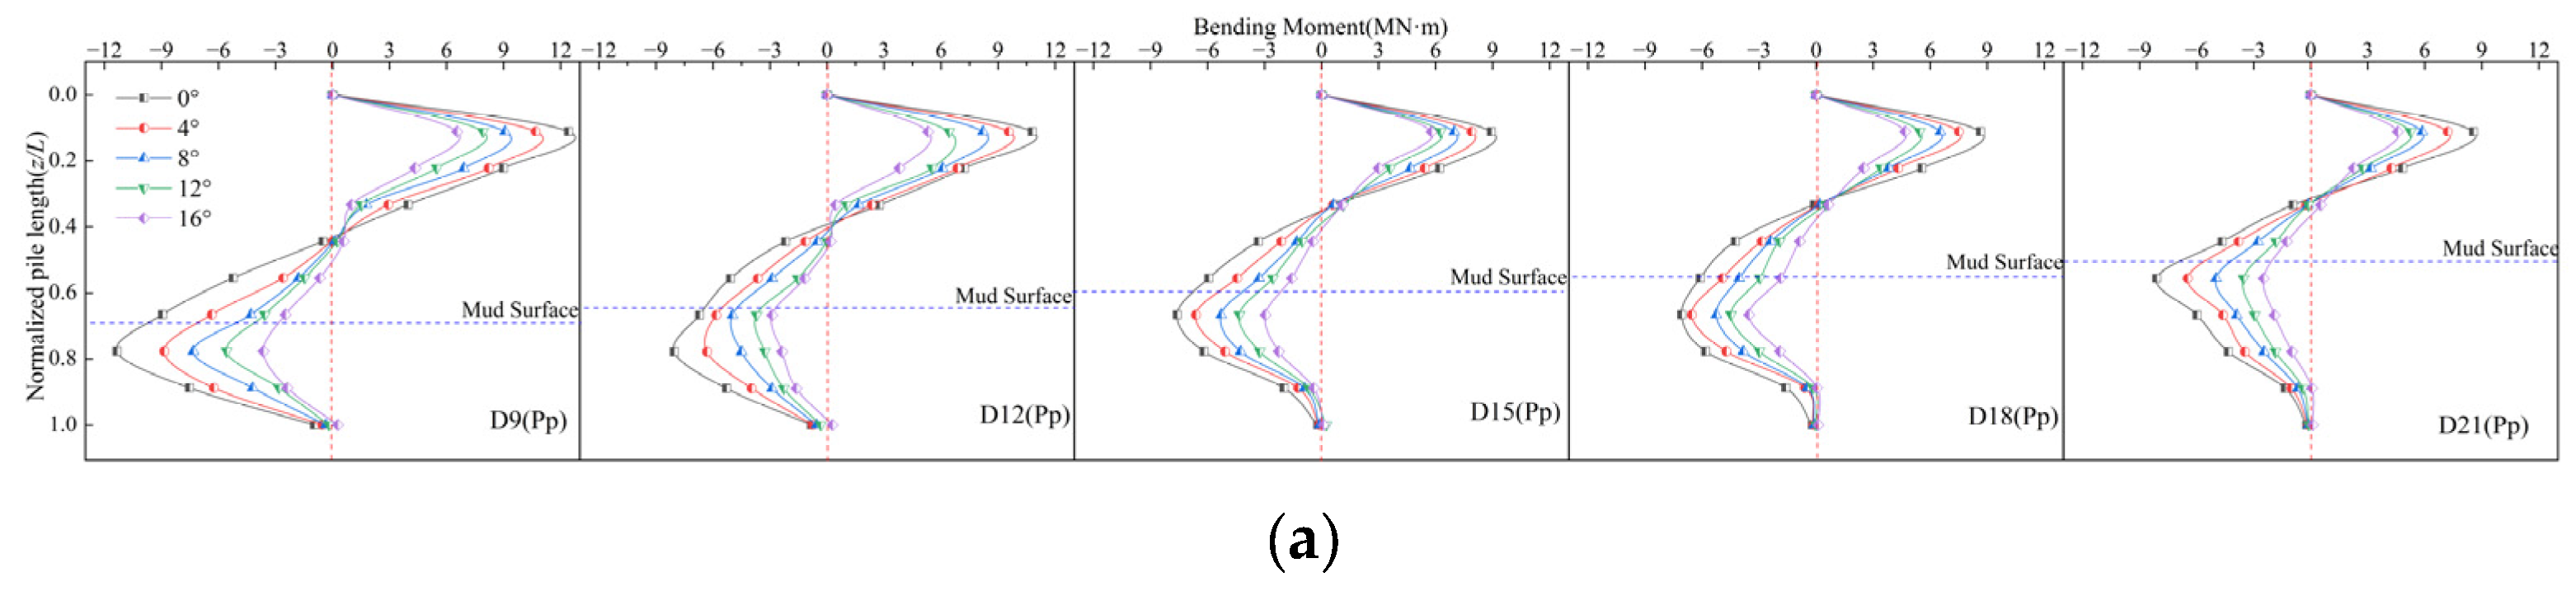
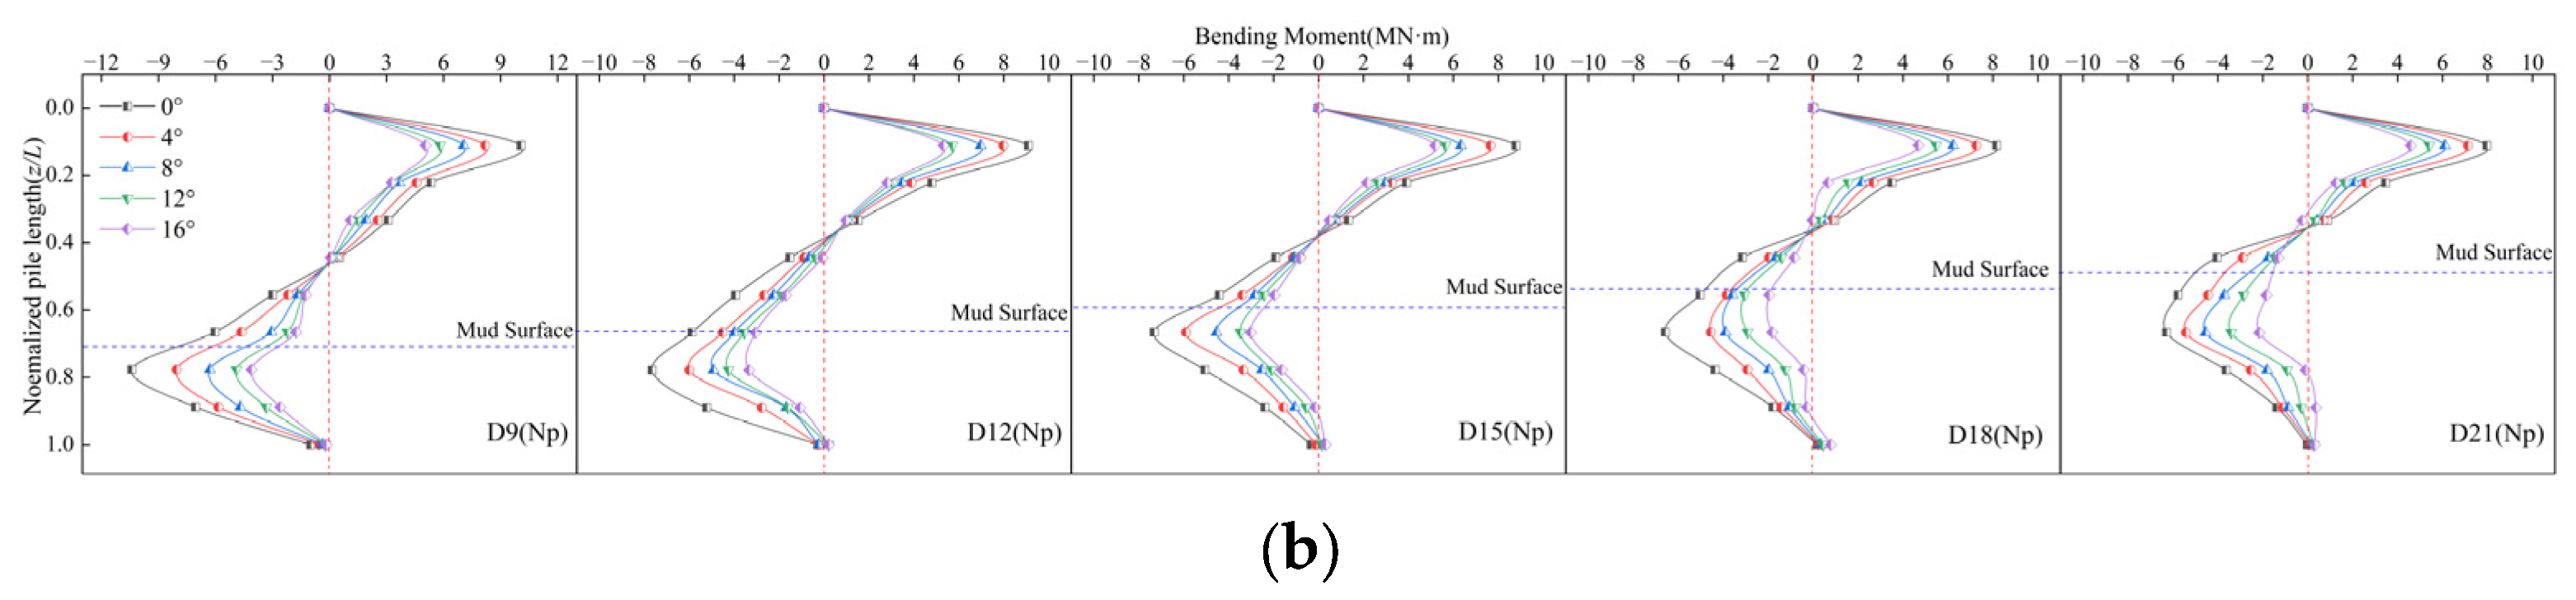
Figure 8 shows that as the embedment depth increases, the maximum bending moment decreases while keeping the loading magnitude constant. This data are normalized with respect to the pile length. The bending moment above the mud surface is primarily positive, while that below the surface is primarily negative. For an embedment depth of 9 m, the maximum bending moment for positive batter piles was −11.34 MN·m, while for negative batter piles, it was −10.49 MN·m. Increasing the embedment depth to 21 m reduced the maximum bending moment for positive batter piles to −6.5 MN·m and for negative batter piles to −6.24 MN·m. The greatest reduction occurred for embedment depths between 9 m and 12 m. The greatest reduction was seen in positive batter piles. The reduction was 33% for positive batter piles and 27.6% for negative batter piles. These results indicate that the reduction in bending moment is more significant for positive batter piles than for negative batter piles. Moreover, increasing the embedment depth reduces internal forces and increases horizontal bearing capacity. The effect of embedment depth on pile head displacement and bending moment exhibited a non-linear decreasing trend. This was primarily because the interaction zone between the pile foundation and the surrounding soil expanded with increasing embedment depth, whereas the soil strength exerted a limited effect on the additional constraints.
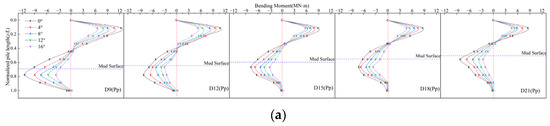
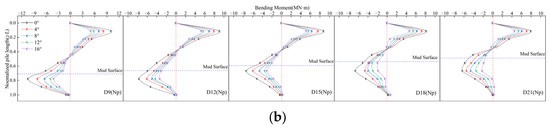
Figure 8.
Bending moments at different inclination angles under transverse loading conditions. (a) Positive batter pile; (b) negative batter pile.
4.2. Effect of Inclined Pile Angle on HRPG
To investigate the effects of batter pile inclination on HRPG performance, the pile’s displacement and bending moment at a 15 m embedment depth were analyzed (see Figure 7 and Figure 8), revealing a systematic decrease as the inclination angle increased from 0° to 16°. For positive batter piles, the pile head displacement was 63.25 mm at 0°, decreasing systematically to 45.14 mm at 4°, 32.31 mm at 8°, 21.45 mm at 12°, and 19.54 mm at 16°. For negative batter piles, the displacement decreased systematically from 62.75 mm at 0° to 19.37 mm at 16°. In addition, the bending moment of positive batter piles decreased from −3.31 MN·m at 0° to −0.85 MN·m at 16°, while that of negative batter piles decreased from −2.9 MN·m at 0° to −0.45 MN·m at 16°, highlighting the efficiency of batter piles in mitigating internal forces.
4.3. Effect of Horizontal Load on HRPG
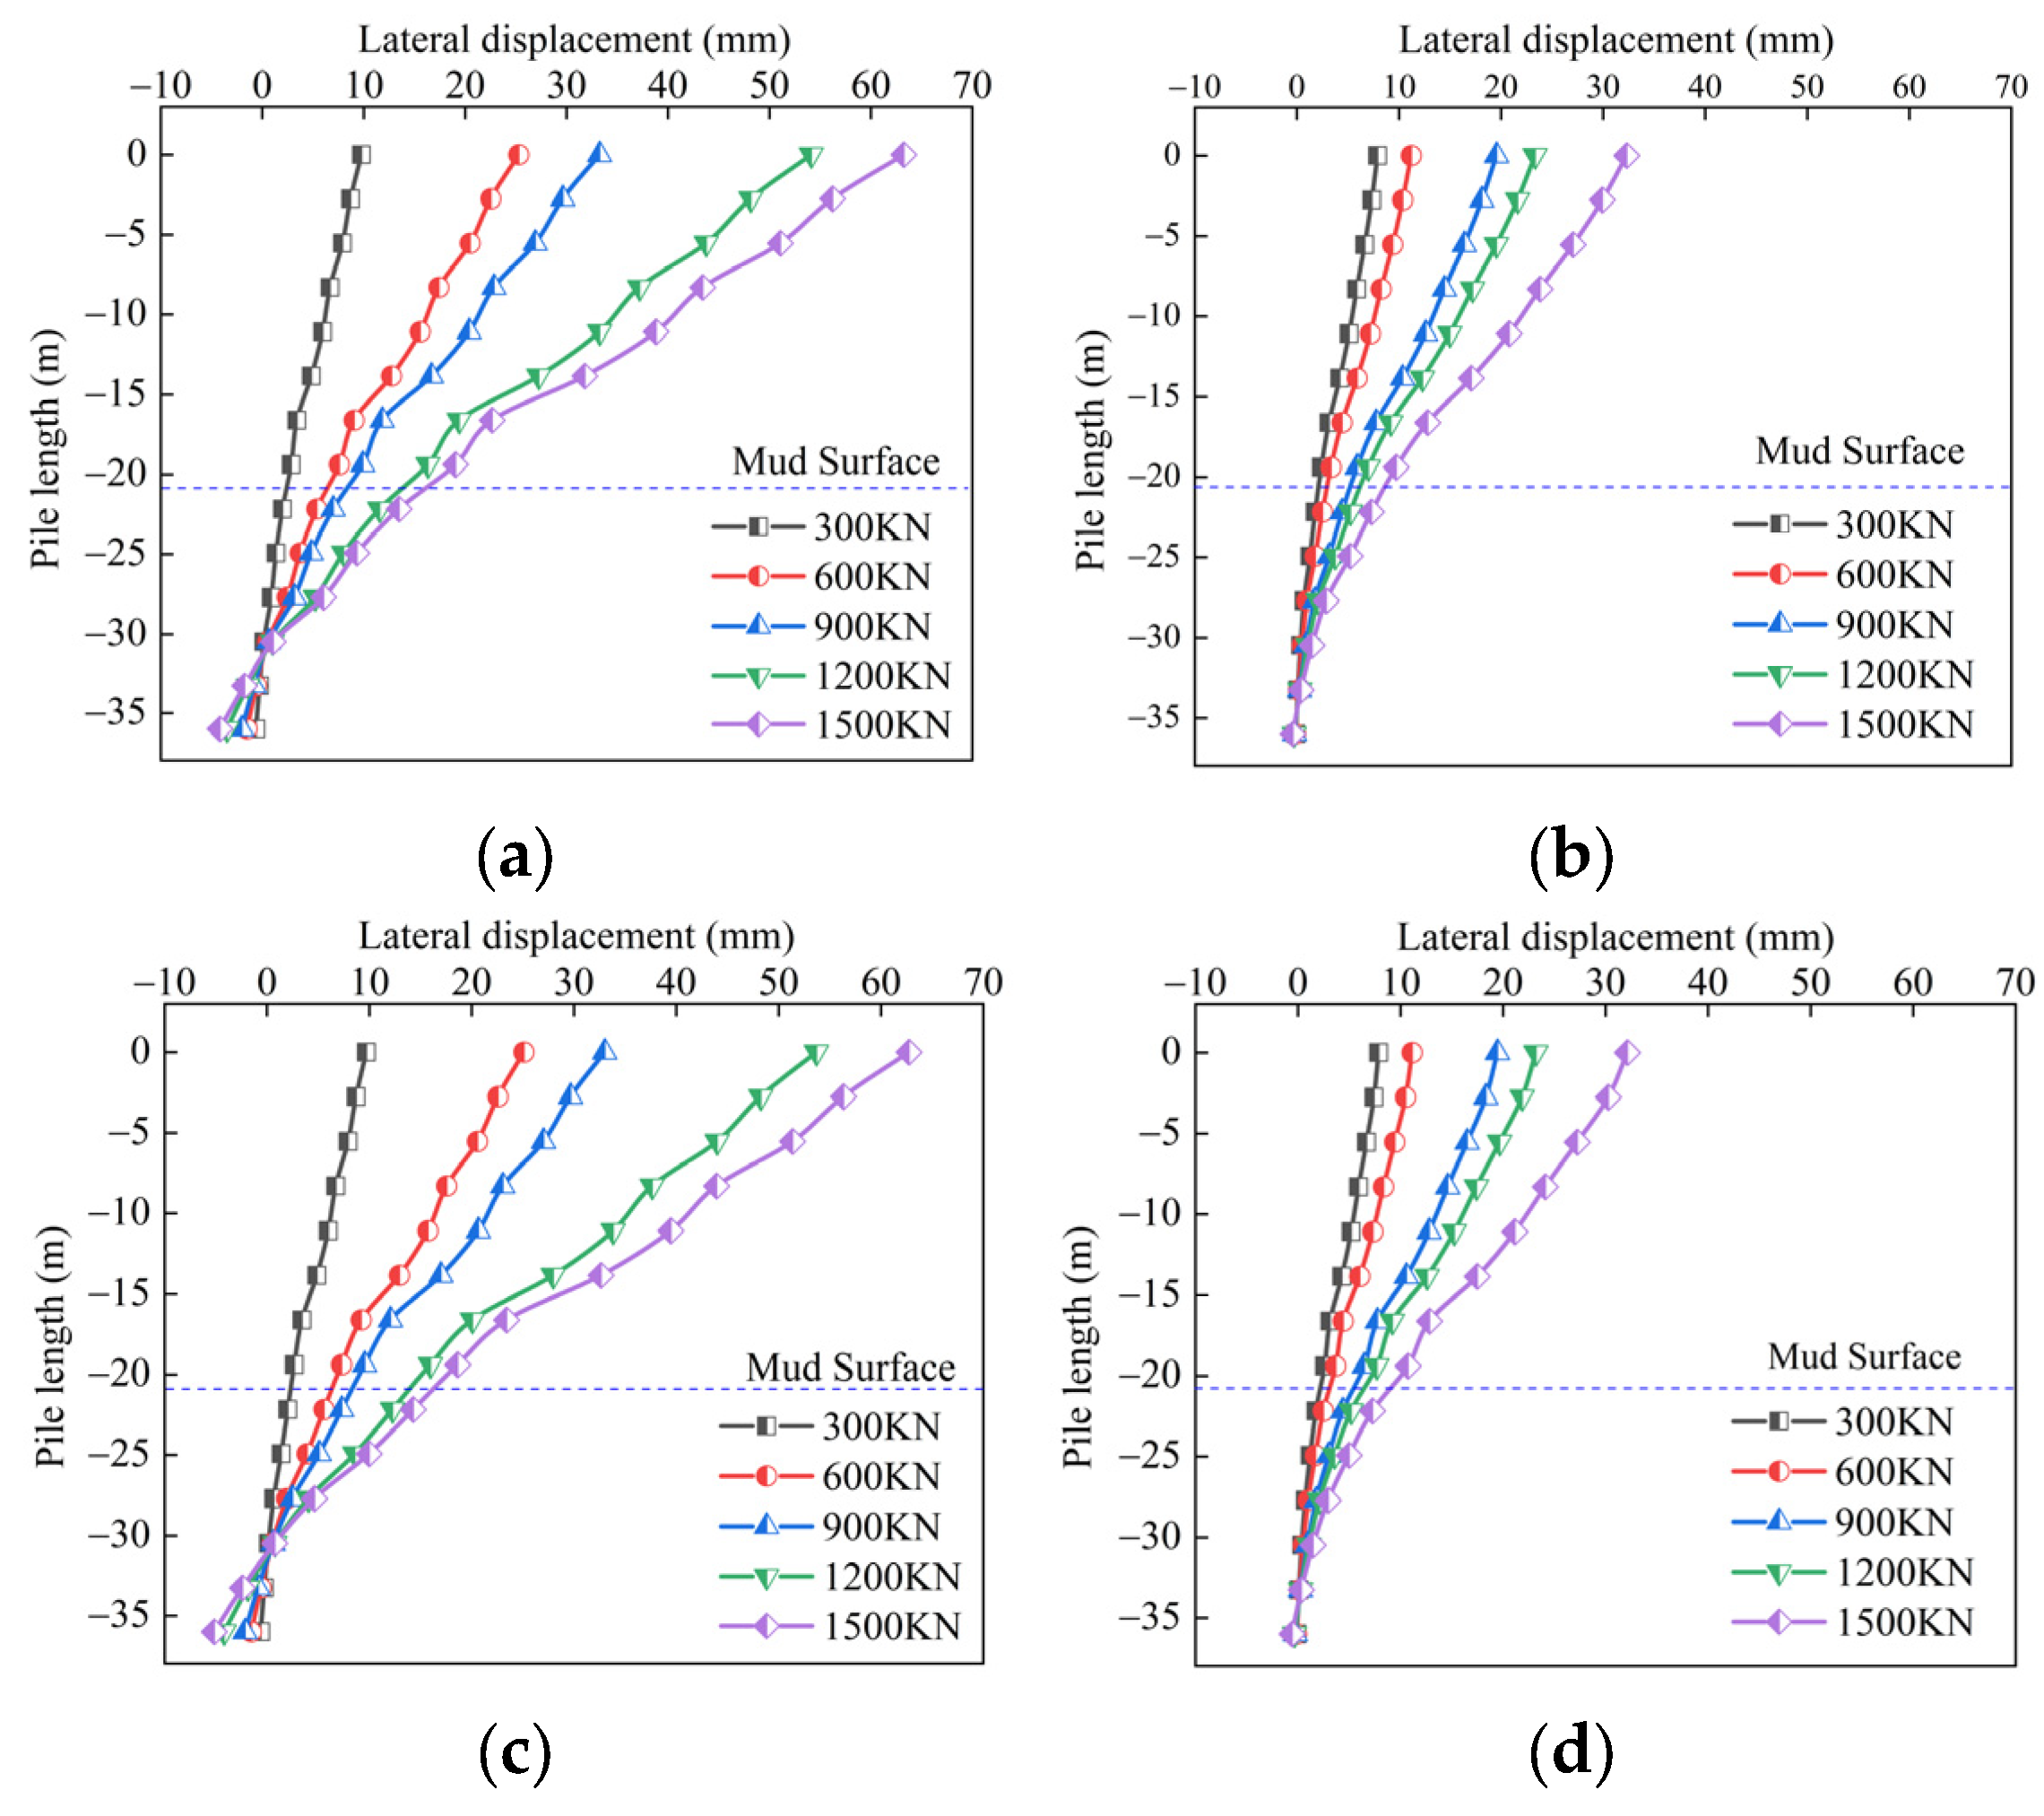
To assess the effects of load magnitude, Figure 9 presents the displacement characteristics of HRPG under different lateral loads at a fixed embedment depth of 15 m for inclination angles of 0° (vertical pile) and 8°. The figure is divided into two rows and two columns; the first row displays the displacement results for positive batter piles, while the second row displays those for negative batter piles. The first column corresponds to the displacement at an inclination angle of 0°, and the second column corresponds to that at an inclination angle of 8° (with embedment depth fixed at 15 m).
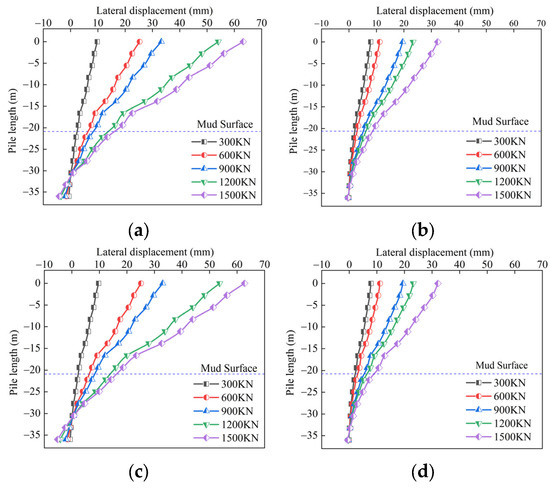
Figure 9.
Lateral displacement of HRPG under different lateral loads: (a) inclination angle 0° (Pp); (b) inclination angle 8° (Pp); (c) inclination angle 0° (Np); (d) inclination angle 8° (Np).
At an inclination angle of 8°, lateral displacement increased gradually with lateral load, with maximum displacement at the pile head and nearly 0 mm at the pile base. At the same angle, the difference in displacement between positive and negative batter piles was minimal. For vertical piles (0°), displacement increased with lateral load; however, vertical piles exhibited significantly larger displacement and greater incremental increases compared to batter piles. Special attention should be paid to the pile inclination angle and load magnitude when designing batter pile foundations highly resistant to significant lateral loads. Notably, pile displacement at the mudline was significantly greater than below the mudline, underscoring the soil’s effectiveness in limiting foundation displacement.
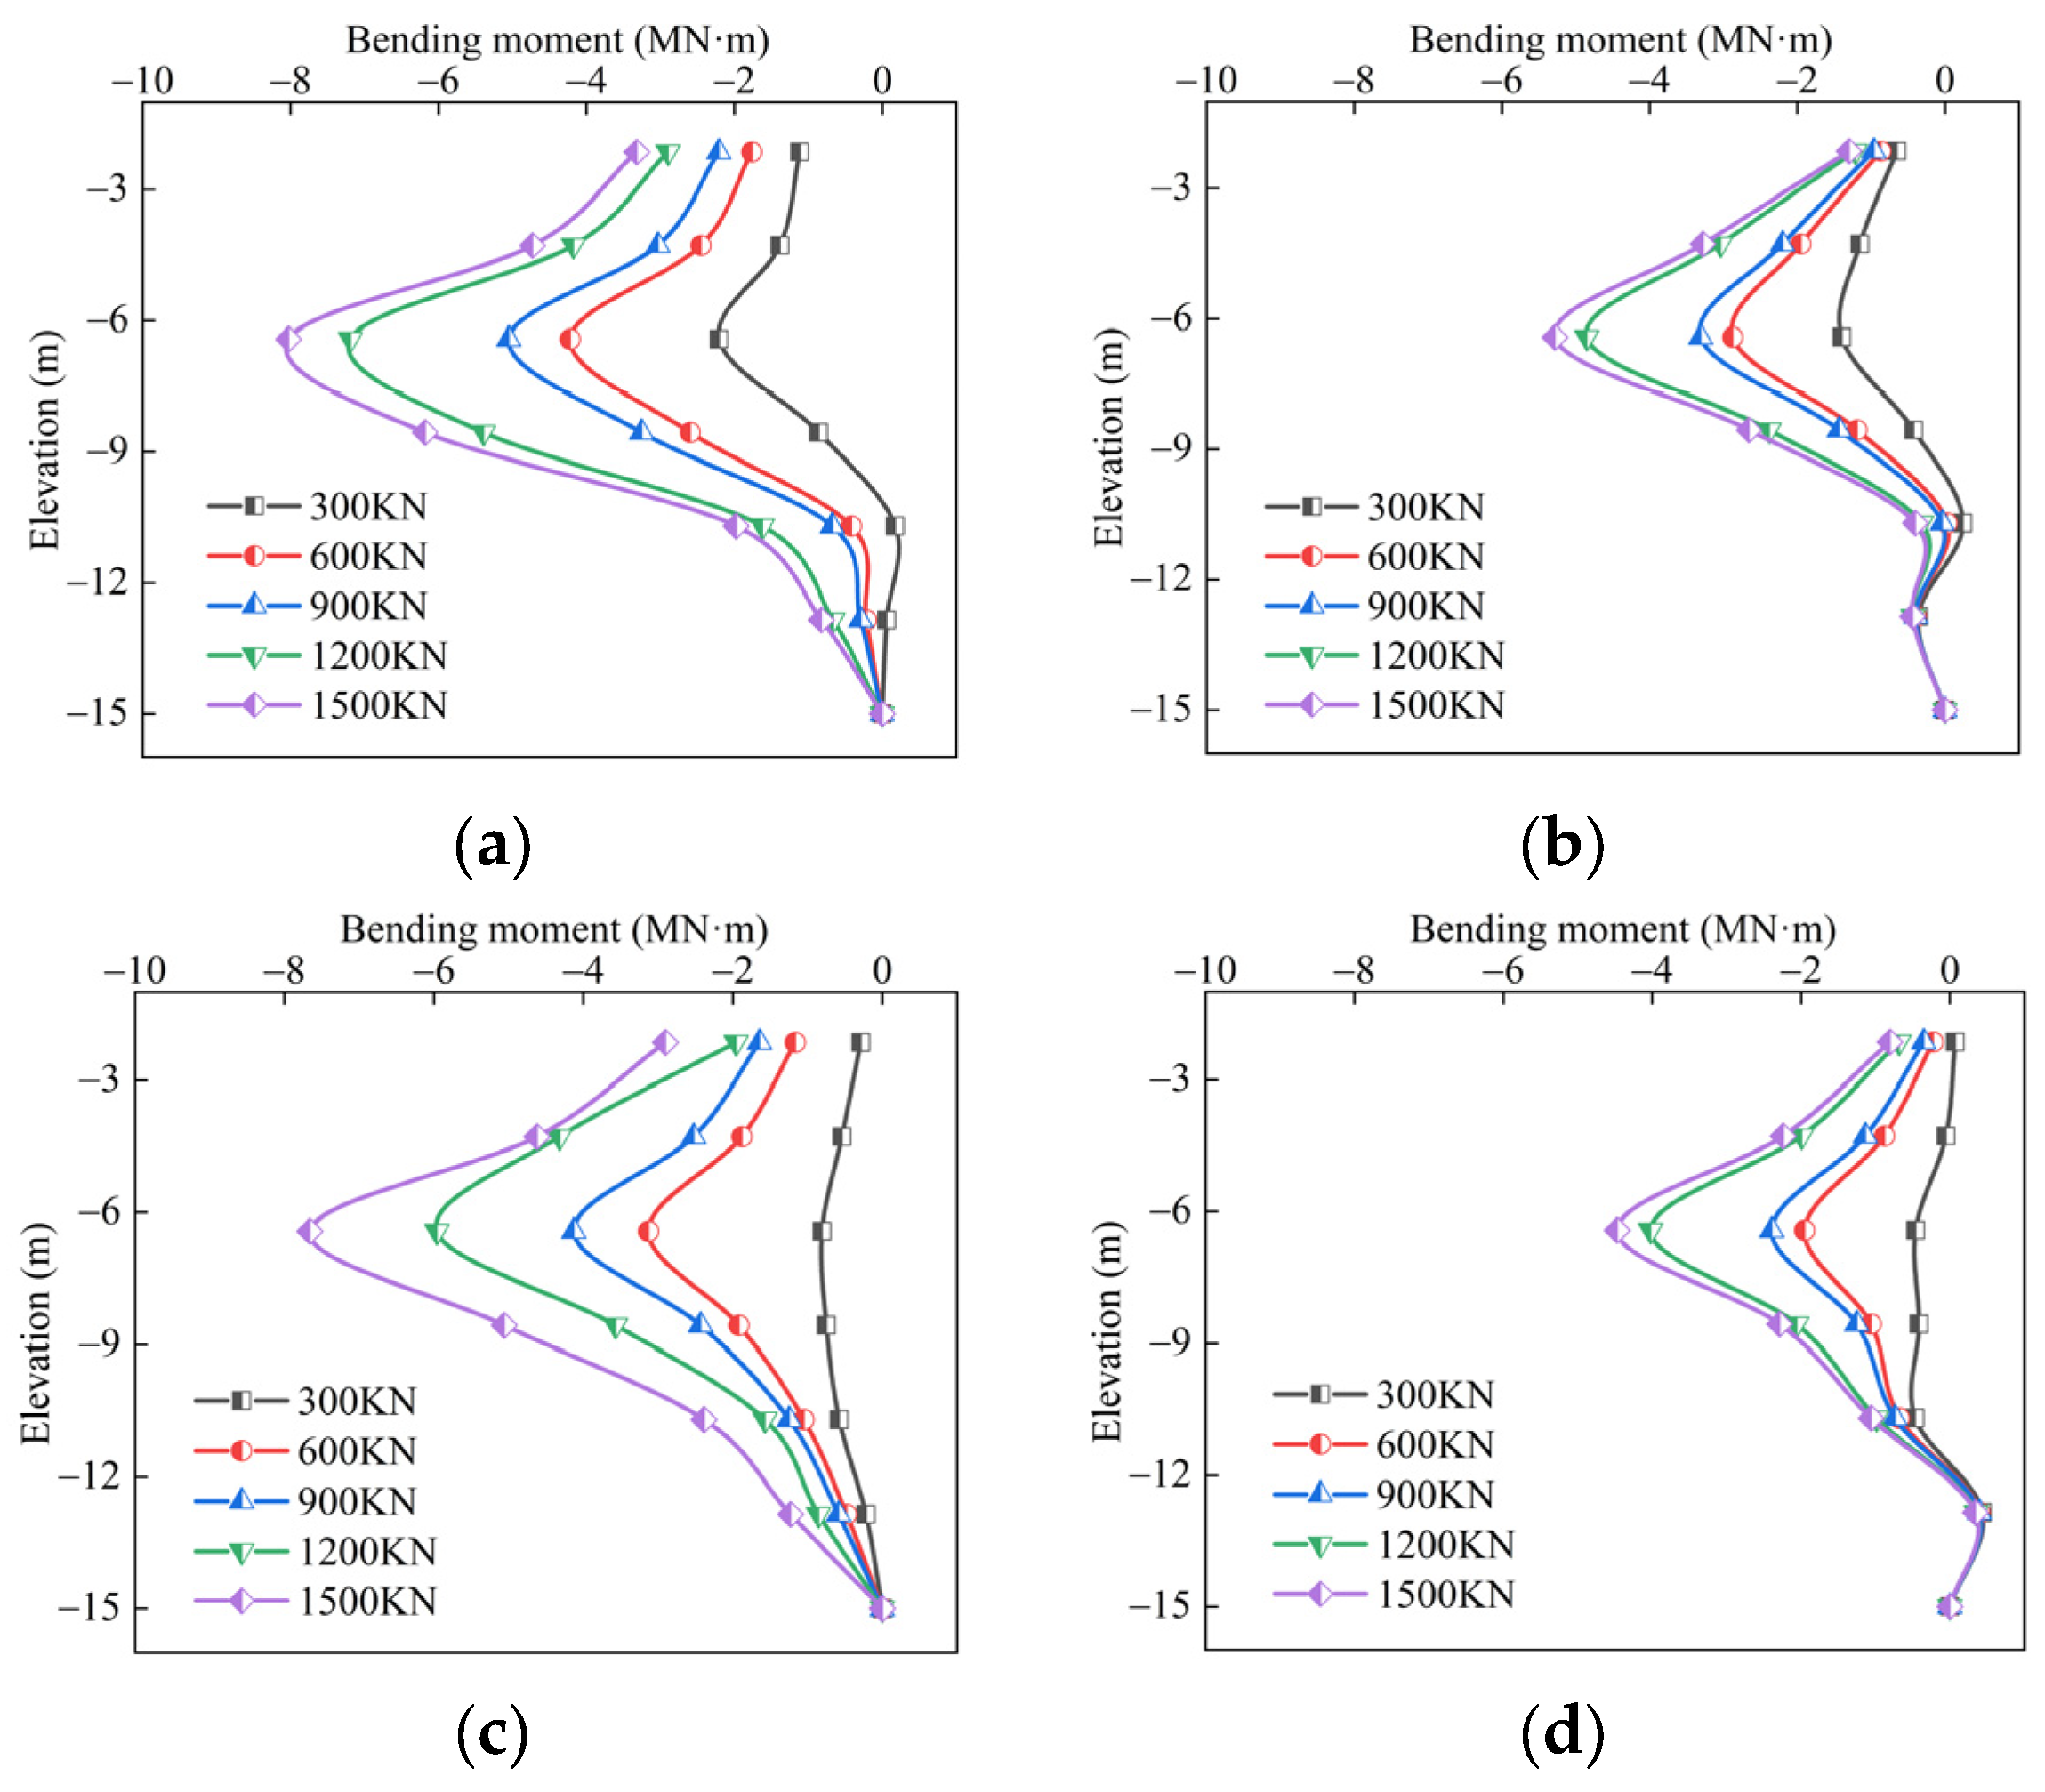
Figure 10 shows the bending moment behavior of the HRPG under different lateral loads. In a pile foundation with a 15 m embedment depth, the bending moment of the high batter pile increased steadily with increasing lateral load. The maximum bending moment occurred at about one-third of the pile depth below the mudline, while the minimum bending moment was observed at the pile tip, emphasizing the need to focus on the upper section of the pile. For instance, under a lateral load of 1500 kN, negative batter piles showed a maximum bending moment of −7.66 MN·m at 0° inclination, which decreased to −4.48 MN·m at 8° inclination. In contrast, positive batter piles showed maximum bending moments of −8.1 MN·m at 0° and −5.2 MN·m at 8°. In general, the bending moment increased with higher lateral loads and decreased as the inclination angle increases.
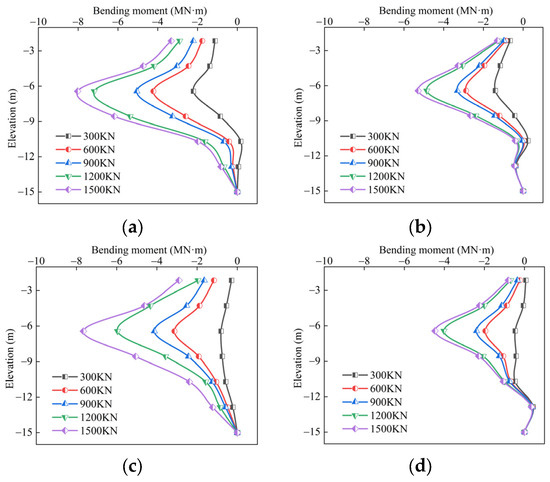
Figure 10.
Bending moment of HRPG under different lateral loads: (a) 15m0 (Pp); (b) 15m8 (Pp); (c) 15m0 (Np); (d) 15m8 (Np).
4.4. Effect of Cap Elevation on HRPG
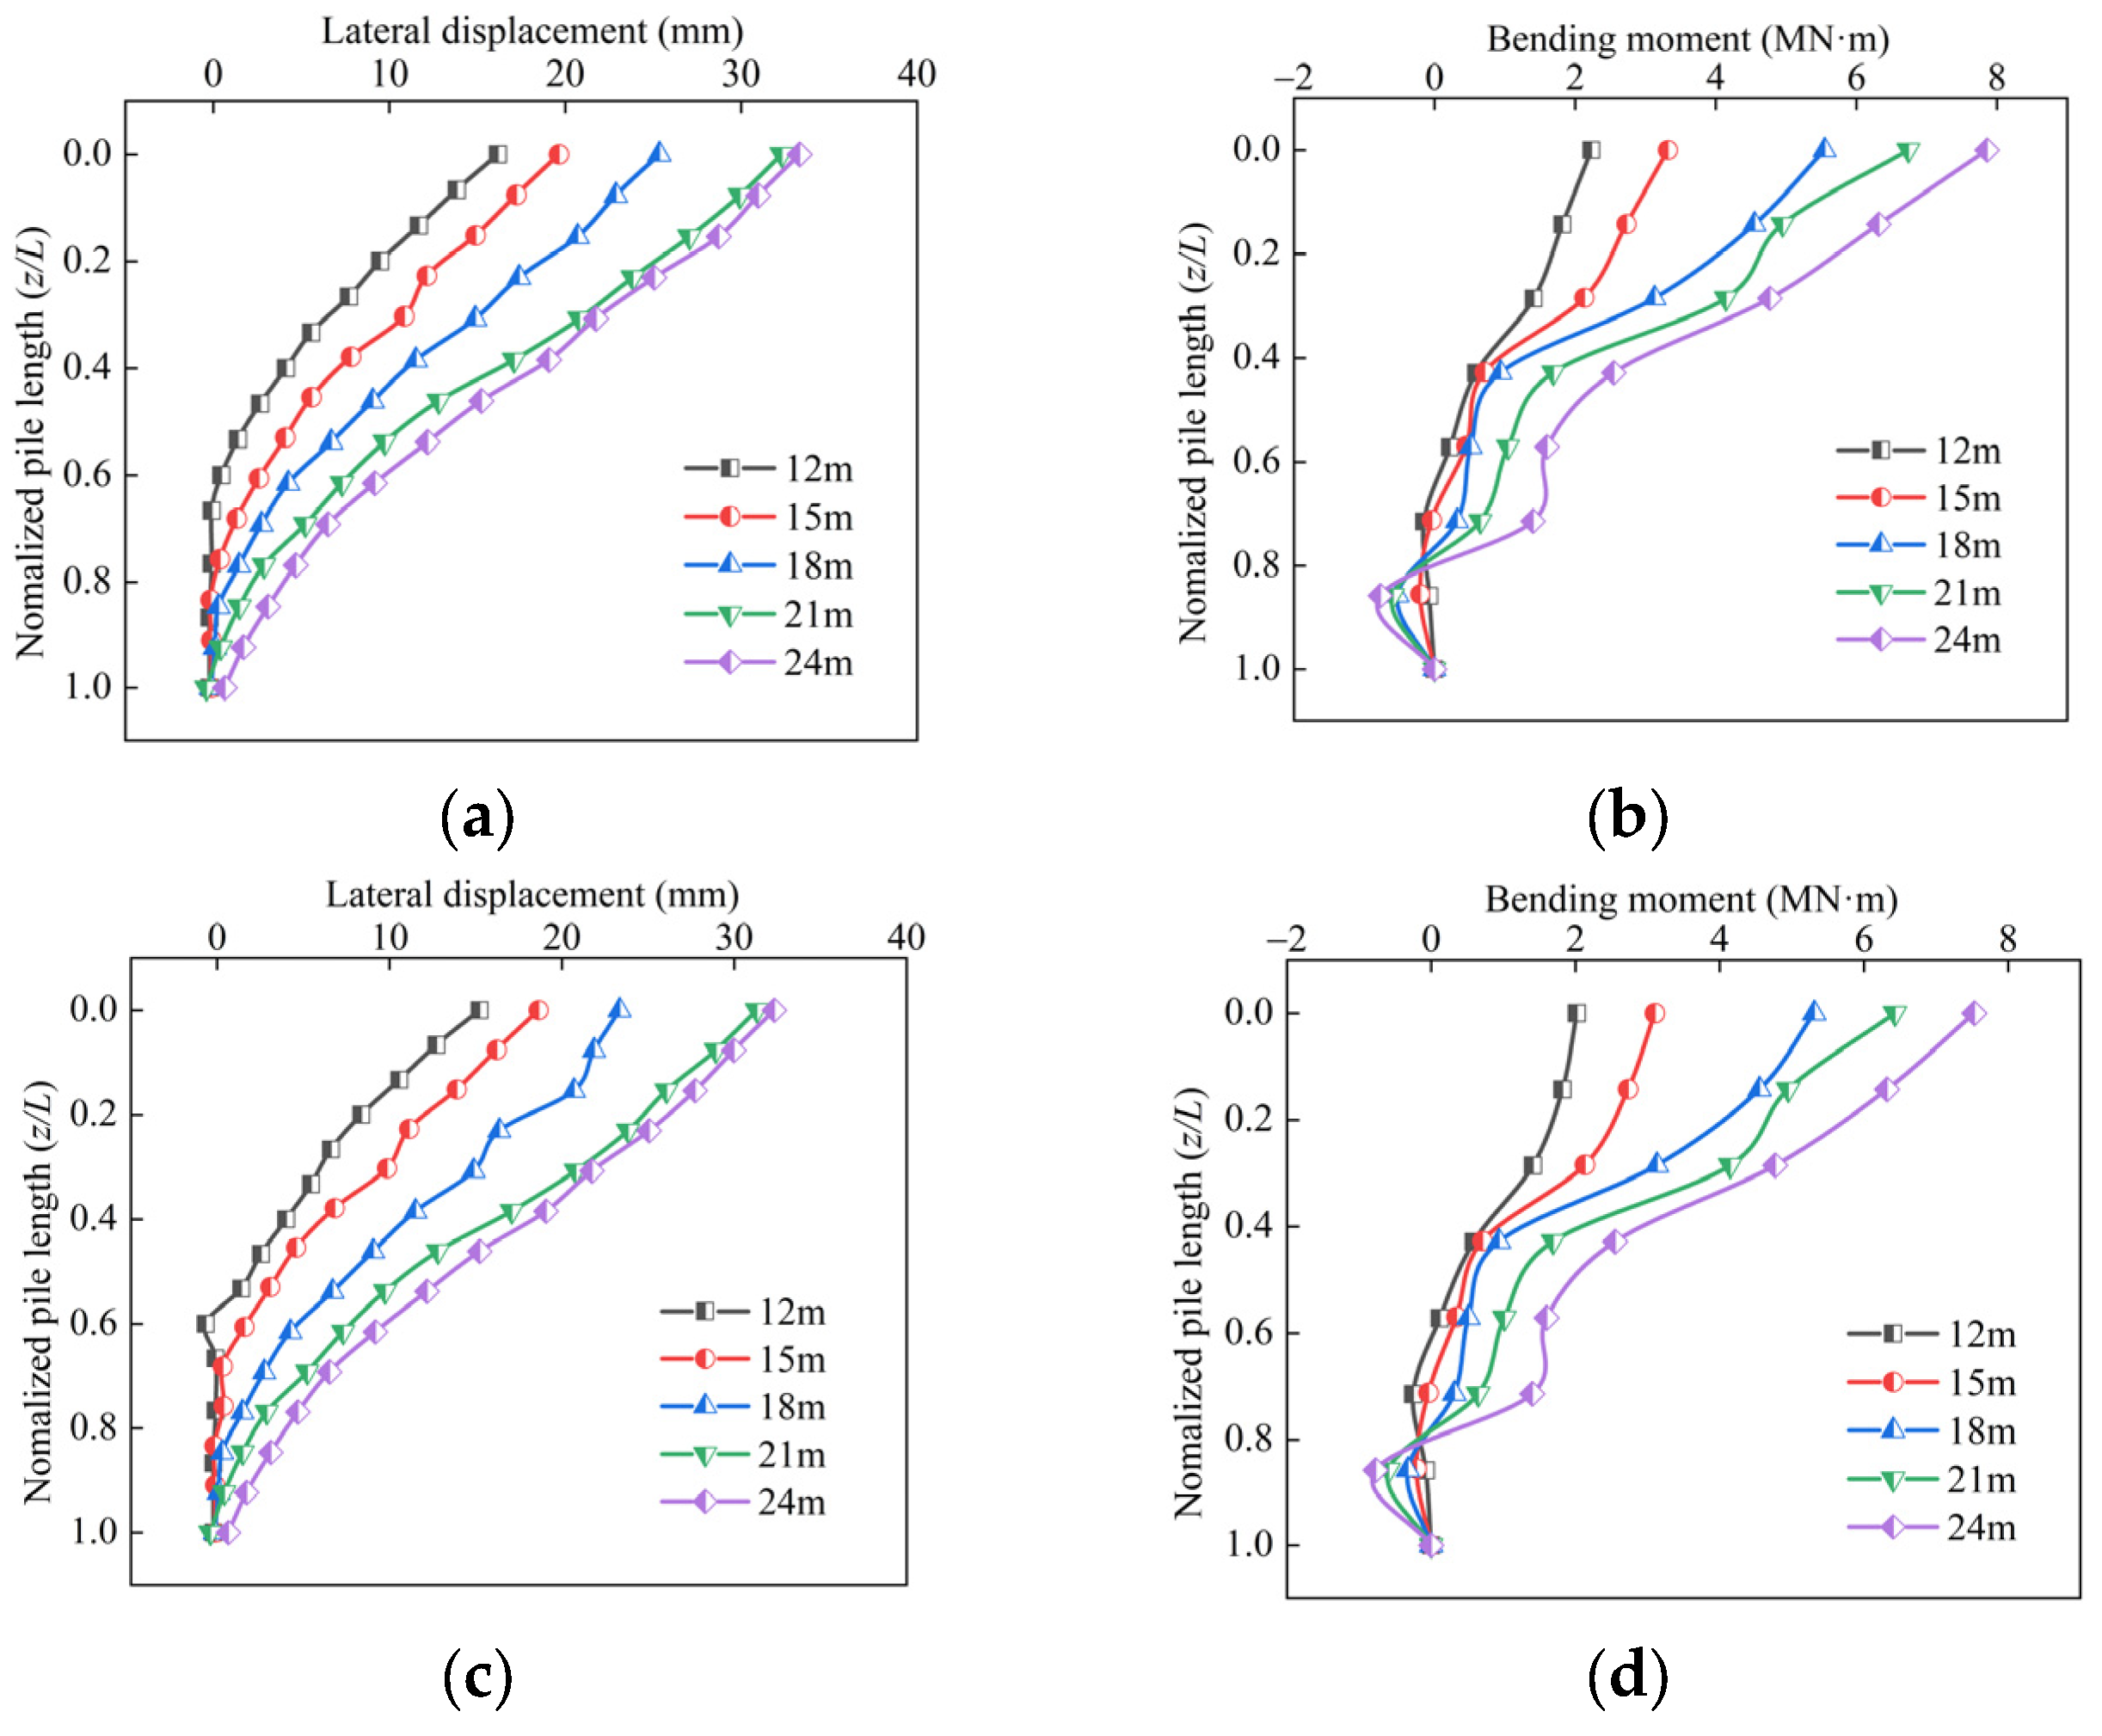
Based on a 15 m embedment depth, an 8° inclination angle, and the analysis of the fifth step loading (1500 kN), the following results were obtained. These data are normalized with respect to the pile length. Figure 11a,c illustrate the lateral displacement of HRPG for positive and negative batter piles across various bearing platform heights. The displacement of the positive batter pile is slightly larger than that of the negative batter pile. The bottom of the pile cap varied in height from 12 m to 24 m. For positive batter piles, the pile head lateral displacement was 16.18 mm, 19.65 mm, 25.35 mm, 32.31 mm, and 33.32 mm corresponding to pile cap elevations of 12 m, 15 m, 18 m, 21 m, and 24 m, respectively. The pile’s lateral displacement increased significantly as the pile cap elevation increased. Figure 11b,d illustrate the bending moment of HRPG for positive and negative batter piles at various pile cap elevations. The bending moment of the positive batter pile was slightly larger than that of the negative batter pile. At pile cap elevations of 12 m, 15 m, 18 m, 21 m, and 24 m, the bending moment of the piles were 2.23, 3.32, 5.55, 6.74, and 7.86 MN·m, respectively, indicating that bending moment increased as the pile cap elevation increased. Overall, both the lateral displacement and bending moment of the HRPG increased significantly with an increase in pile cap elevation.
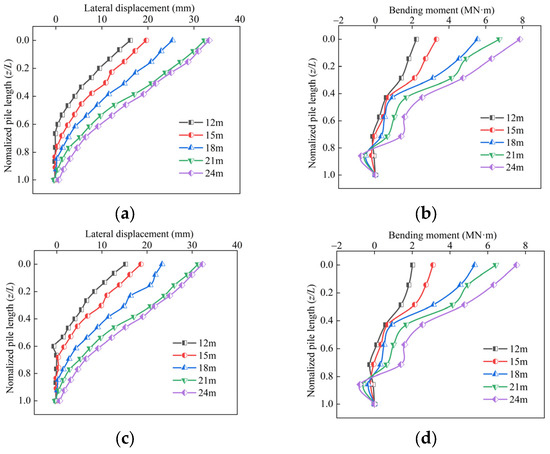
Figure 11.
Displacement and bending moment at different cap elevation: (a) lateral displacement (Pp); (b) bending moment (Pp); (c) lateral displacement (Np); (d) bending moment (Np).
4.5. Research Limitation
Despite the insights provided, this study has some limitations. Firstly, the numerical model used in this study assumes the linear elastic behavior for the pile and soil, which may not accurately represent the non-linear and time-dependent behavior of soils under varying loading conditions. Furthermore, the study’s results are based on idealized boundary conditions, and real-world scenarios with complex soil profiles, water table variations, and environmental factors could yield different outcomes. Finally, the study focuses on static loading conditions, and dynamic effects such as wave forces or seismic events, which are critical for offshore structures, were not included in the analysis.
5. Conclusions
This study developed a numerical model to assess high-inclination pile foundations for offshore wind turbines, focusing on how pile inclination, embedment depth, lateral load, and cap elevation affect displacement and bending moment.
(1) Increasing the pile inclination from 0° to 8° markedly reduces displacement and bending moment, with the greatest improvement observed between 8° and 12°. Thus, an optimal inclination range of 8–12° is recommended.
(2) Greater embedment depth significantly reduces displacement and bending moment, especially for vertical piles, with optimal performance achieved at 12–15 m.
(3) Increasing lateral load results in sharply higher displacement and bending moment, highlighting the need for careful design—especially near the pile head.
(4) The maximum bending moment occurs at approximately one-third of the pile’s embedment length below the mudline. As the lateral load increases, both the displacement and bending moment at the pile head increase significantly. The structural strength of the pile below one-third of its mudline-embedment length demands heightened design scrutiny. Positive batter piles demonstrate markedly elevated force–deformation responses compared to negative batter piles, necessitating systematic quantification in stability assessments.
(5) Higher pile cap elevations increase both displacement and bending moment, necessitating strict lateral load control.
The structural performance of steep batter offshore wind pile foundations is improved through three key modifications, namely, increasing embedment depth, optimizing the inclination angle, and adjusting the pile cap elevation. These modifications result in increased lateral stiffness while reducing both bending moments and deformations, and the extent of these benefits is directly proportional to the applied lateral load intensity. Future research should explore the dynamic response of high-inclination pile foundations under varying environmental conditions, such as wave loading and seismic forces. Additionally, investigating the long-term performance and durability of these foundations, particularly in aggressive marine environments, would provide valuable insights for enhancing the design of offshore wind turbine substructures.
Author Contributions
Conceptualization, J.Y. (Jinbi Ye), Y.W. and X.Z.; methodology, S.L.; software, S.L.; formal analysis, S.L. and J.Y. (Jinbi Ye); investigation, C.C., Y.C., J.L. and J.Y. (Jin Yu); data curation, S.L.; writing—original draft preparation, S.L.; writing—review and editing, S.L.; visualization, S.L.; supervision, J.Y. (Jinbi Ye); project administration, J.Y. (Jinbi Ye) and X.Z.; funding acquisition, X.Z. All authors have read and agreed to the published version of the manuscript.
Funding
This study was financially supported by the Fujian Provincial Department of Science and Technology Guiding (Key) Project (No. 2023Y0077), the Xiamen Science and Technology Program Project (No. 2023CXY0401), and the National Natural Science Foundation of China (Grants No. 52278351, 42077254 and 52374090). The research was also supported by the Xiamen Key Laboratory of Transportation Infrastructure Health and Safety, Xiamen University of Technology.
Data Availability Statement
Data are contained within the article.
Acknowledgments
We fully appreciate the editors and all anonymous reviewers for their constructive comments on this manuscript.
Conflicts of Interest
The authors declare no conflicts of interest.
References
- Lee, J.; Zhao, F. Global Wind Energy Council Global Wind Report 2021; Global Wind Energy Council [GWEC]: Brussels, Belgium, 2021. [Google Scholar]
- Wang, K.; Sun, L.; Wang, J.; Liu, L. The electricity, industrial, and agricultural sectors under changing climate: Adaptation and mitigation in China. Natl. Sci. Open 2024, 3, 20230023. [Google Scholar] [CrossRef]
- Cai, X.; Duan, H.; Ma, Y.; Li, Q.; Xie, M. Environmental impact assessment of wind turbine blades analysis based on life cycle. J. Shenzhen Univ. Sci. Eng. 2023, 40, 40–47. [Google Scholar]
- Zhang, X.-l.; Zhou, R.; Zhang, G.-l.; Han, Y. A corrected py curve model for large-diameter pile foundation of offshore wind turbine. Ocean Eng. 2023, 273, 114012. [Google Scholar] [CrossRef]
- Marge, T.; Lumbreras, S.; Ramos, A.; Hobbs, B.F. Integrated offshore wind farm design: Optimizing micro-siting and cable layout simultaneously. Wind Energy 2019, 22, 1684–1698. [Google Scholar] [CrossRef]
- Ma, C.; Ban, J.; Zi, G. Comparative study on the dynamic responses of monopile and jacket-supported offshore wind turbines considering the pile-soil interaction in transitional waters. Ocean Eng. 2024, 292, 116564. [Google Scholar] [CrossRef]
- Li, C.; Chi, Y.; Sun, X.; Han, Y.; Chen, X.; Zhao, L.; Zhang, H. Construction technology of high-rise pile cap foundation of offshore wind power in Taiwan Strait. In Proceedings of the IOP Conference Series: Earth and Environmental Science; IOP Publishing: Bristol, UK, 2017; p. 012037. [Google Scholar]
- Cao, W.; Xia, B.; Zhao, M.; Geo, X. Py curves of laterally loaded batter piles in sand and its application. Chin. J. Rock Mech. Eng. 2018, 37, 743–753. [Google Scholar]
- Subanantharaj Palammal, J.; Senthilkumar, P.K. Behavioural analysis of vertical and batter pile groups under vertical and lateral loading in sand. Arab. J. Geosci. 2018, 11, 706. [Google Scholar] [CrossRef]
- Bajaj, P.; Yadu, L.; Chouksey, S.K. Behavior of vertical and batter piles under lateral, uplift and combined loads in non-cohesive soil. Innov. Infrastruct. Solut. 2019, 4, 55. [Google Scholar] [CrossRef]
- McClelland, B.; Focht, J.A., Jr. Soil modulus for laterally loaded piles. Trans. Am. Soc. Civ. Eng. 1958, 123, 1049–1063. [Google Scholar] [CrossRef]
- Wang, H.; Wu, D.; Tian, P. A new united method of p–y curves of laterally statically loaded piles in clay. J. Hohai Univ. 1991, 1, 9–17. [Google Scholar]
- O’Neill, M.W.; Murchison, J.M. An Evaluation of Py Relationships in Sands; University of Houston: Houston, TX, USA, 1983. [Google Scholar]
- Tak Kim, B.; Kim, N.-K.; Jin Lee, W.; Su Kim, Y. Experimental load–transfer curves of laterally loaded piles in Nak-Dong River sand. J. Geotech. Geoenviron. Eng. 2004, 130, 416–425. [Google Scholar] [CrossRef]
- Kondner, R.L. Hyperbolic stress-strain response: Cohesive soils. J. Soil Mech. Found. Div. 1963, 89, 115–143. [Google Scholar] [CrossRef]
- Wu, J.; Pu, L.; Zhai, C. A Review of Static and Dynamic p-y Curve Models for Pile Foundations. Buildings 2024, 14, 1507. [Google Scholar] [CrossRef]
- Vaghefi, M.; Mobaraki, B. Evaluation of the effect of explosion on the concrete bridge deck using LS-DYNA. Int. Rev. Civil. Eng. 2021, 12, 135. [Google Scholar] [CrossRef]
- Alhassan, M.A.; Al-Rousan, R.Z.; Hejazi, M.A. Novel Nonlinear model for analysis of RC slabs with various boundary conditions under monotonic loading. Int. Rev. Civil. Eng. 2018, 9, 218. [Google Scholar] [CrossRef]
- Hájek, R.; Horníková, K.; Foglar, M. Numerical assessment of the response of a heterogeneous concrete-based composite bridge deck to a near field explosion. Eng. Struct. 2020, 225, 111206. [Google Scholar] [CrossRef]
- Mobaraki, B.; Vaghefi, M. Numerical study of the depth and cross-sectional shape of tunnel under surface explosion. Tunnel. Undergr. Space Technol. 2015, 47, 114–122. [Google Scholar] [CrossRef]
- Granados, J.J.; Martinez, X.; Nash, N.; Bachour, C.; Manolakis, I.; Comer, A.; Di Capua, D. Numerical and experimental procedure for material calibration using the serial/parallel mixing theory, to analyze different composite failure modes. Mech. Adv. Mater. Struct. 2021, 28, 1415–1433. [Google Scholar] [CrossRef]
- Hayati, Y.; Havaei, G.; Eslami, A.; Filippi, M. 3D soil-structure interaction analysis with a combined substructure-FEM under external forces and seismic waves. Mech. Adv. Mater. Struct. 2022, 29, 3773–3793. [Google Scholar] [CrossRef]
- De Luca, V.; Della Chiesa, A. A creep non-linear FEM analysis of glulam timber. Mech. Adv. Mater. Struct. 2013, 20, 489–496. [Google Scholar] [CrossRef]
- Süsler, S.; Kurtaran, H.; Türkmen, H.S.; Kazancı, Z.; Lopresto, V. An experimentally validated numerical method for investigating the air blast response of basalt composite plates. Mech. Adv. Mater. Struct. 2020, 27, 441–454. [Google Scholar] [CrossRef]
- Basu, D.; Salgado, R. Elastic analysis of laterally loaded pile in multi-layered soil. Geomech. Geoengin. Int. J. 2007, 2, 183–196. [Google Scholar] [CrossRef]
- Demirbaş, M.D.; Ekici, R.; Apalak, M.K. Thermoelastic analysis of temperature-dependent functionally graded rectangular plates using finite element and finite difference methods. Mech. Adv. Mater. Struct. 2020, 27, 707–724. [Google Scholar] [CrossRef]
- Xu, X.; Fallahi, N.; Yang, H. Efficient CUF-based FEM analysis of thin-wall structures with Lagrange polynomial expansion. Mech. Adv. Mater. Struct. 2022, 29, 1316–1337. [Google Scholar] [CrossRef]
- Dong, Z.-Q.; Li, G.; Song, B.; Lu, G.-H.; Li, H.-N. Failure risk assessment method of masonry structures under earthquakes and flood scouring. Mech. Adv. Mater. Struct. 2022, 29, 3055–3066. [Google Scholar] [CrossRef]
- Jia, Y.; Chen, C.; Zhang, D. Experimental study on deformation characteristics of collapsible loess under isotropic stress. Mech. Adv. Mater. Struct. 2020, 27, 1278–1288. [Google Scholar] [CrossRef]
- Sivapriya, S.; Gandhi, S. Soil–structure interaction of pile in a sloping ground under different loading conditions. Geotech. Geol. Eng. 2020, 38, 1185–1194. [Google Scholar] [CrossRef]
- Lin, Y.-L.; Cheng, X.-M.; Yang, G.-L.; Li, Y. Seismic response of a sheet-pile wall with anchoring frame beam by numerical simulation and shaking table test. Soil Dyn. Earthq. Eng. 2018, 115, 352–364. [Google Scholar] [CrossRef]
- Kim, Y.; Jeong, S.; Won, J. Effect of lateral rigidity of offshore piles using proposed py curves in marine clay. Mar. Georesour. Geotechnol. 2009, 27, 53–77. [Google Scholar] [CrossRef]

Disclaimer/Publisher’s Note: The statements, opinions and data contained in all publications are solely those of the individual author(s) and contributor(s) and not of MDPI and/or the editor(s). MDPI and/or the editor(s) disclaim responsibility for any injury to people or property resulting from any ideas, methods, instructions or products referred to in the content. |
© 2025 by the authors. Licensee MDPI, Basel, Switzerland. This article is an open access article distributed under the terms and conditions of the Creative Commons Attribution (CC BY) license (https://creativecommons.org/licenses/by/4.0/).