


Performance Study and Reliability Analysis of Desert Sand Concrete Under FTC


Abstract
1. Introduction
2. Materials and Methods
2.1. Experimental Material Properties
2.2. Mixed Proportion Design
2.3. Test Method
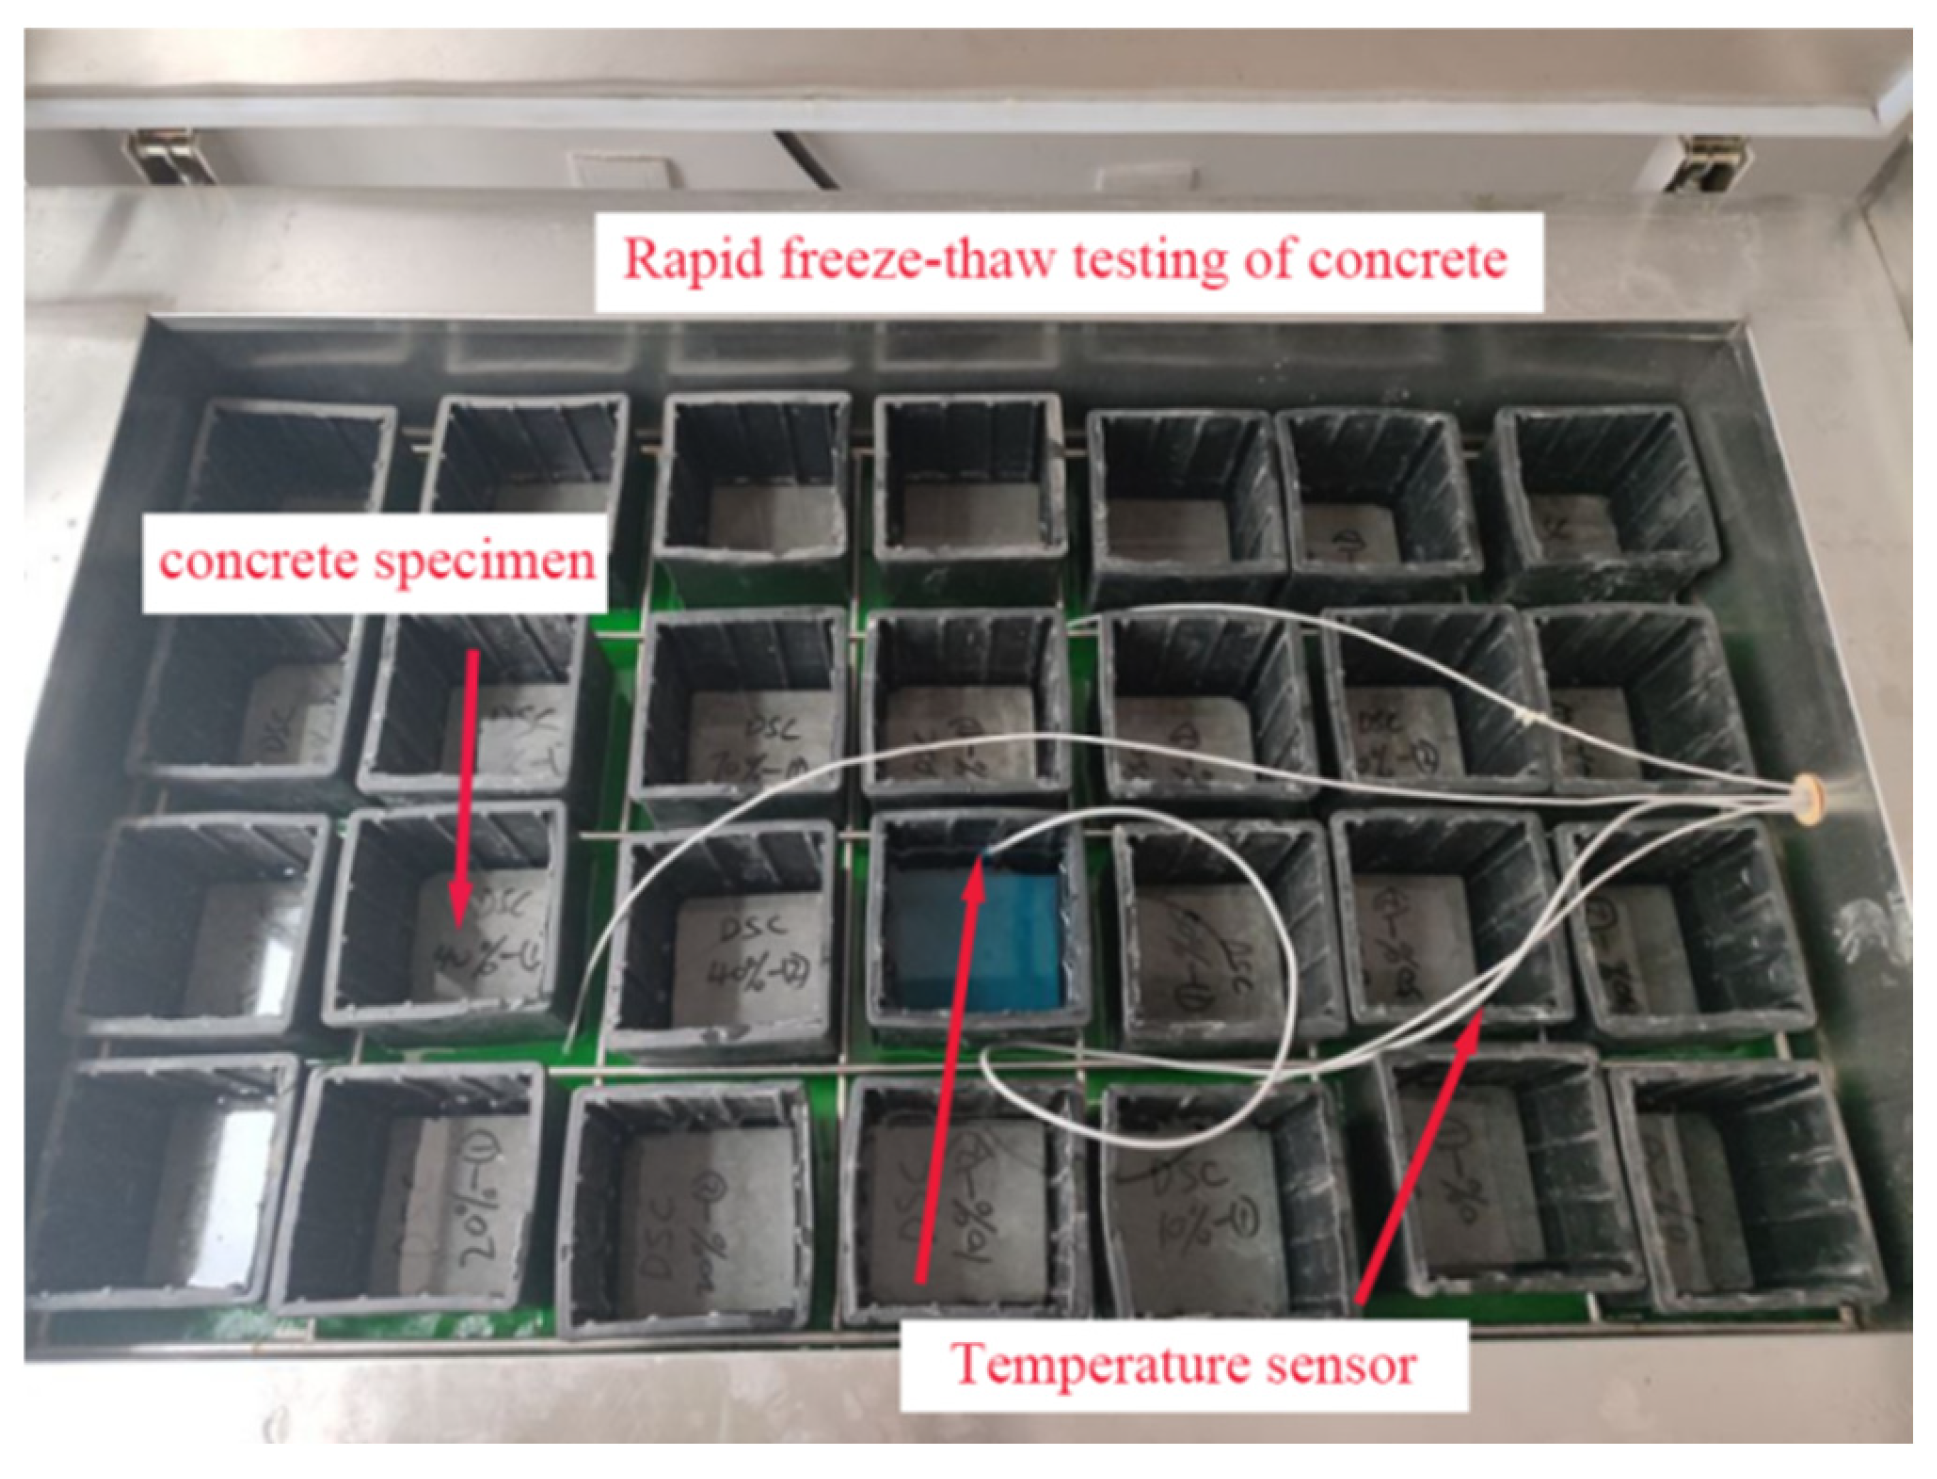
2.3.1. FTC Test
2.3.2. Mass and Relative Dynamic Elastic Modulus (RDEM) Test
2.3.3. Compressive Strength Test
2.3.4. Scanning Electron Microscope Tests
3. Experimental Results and Analysis
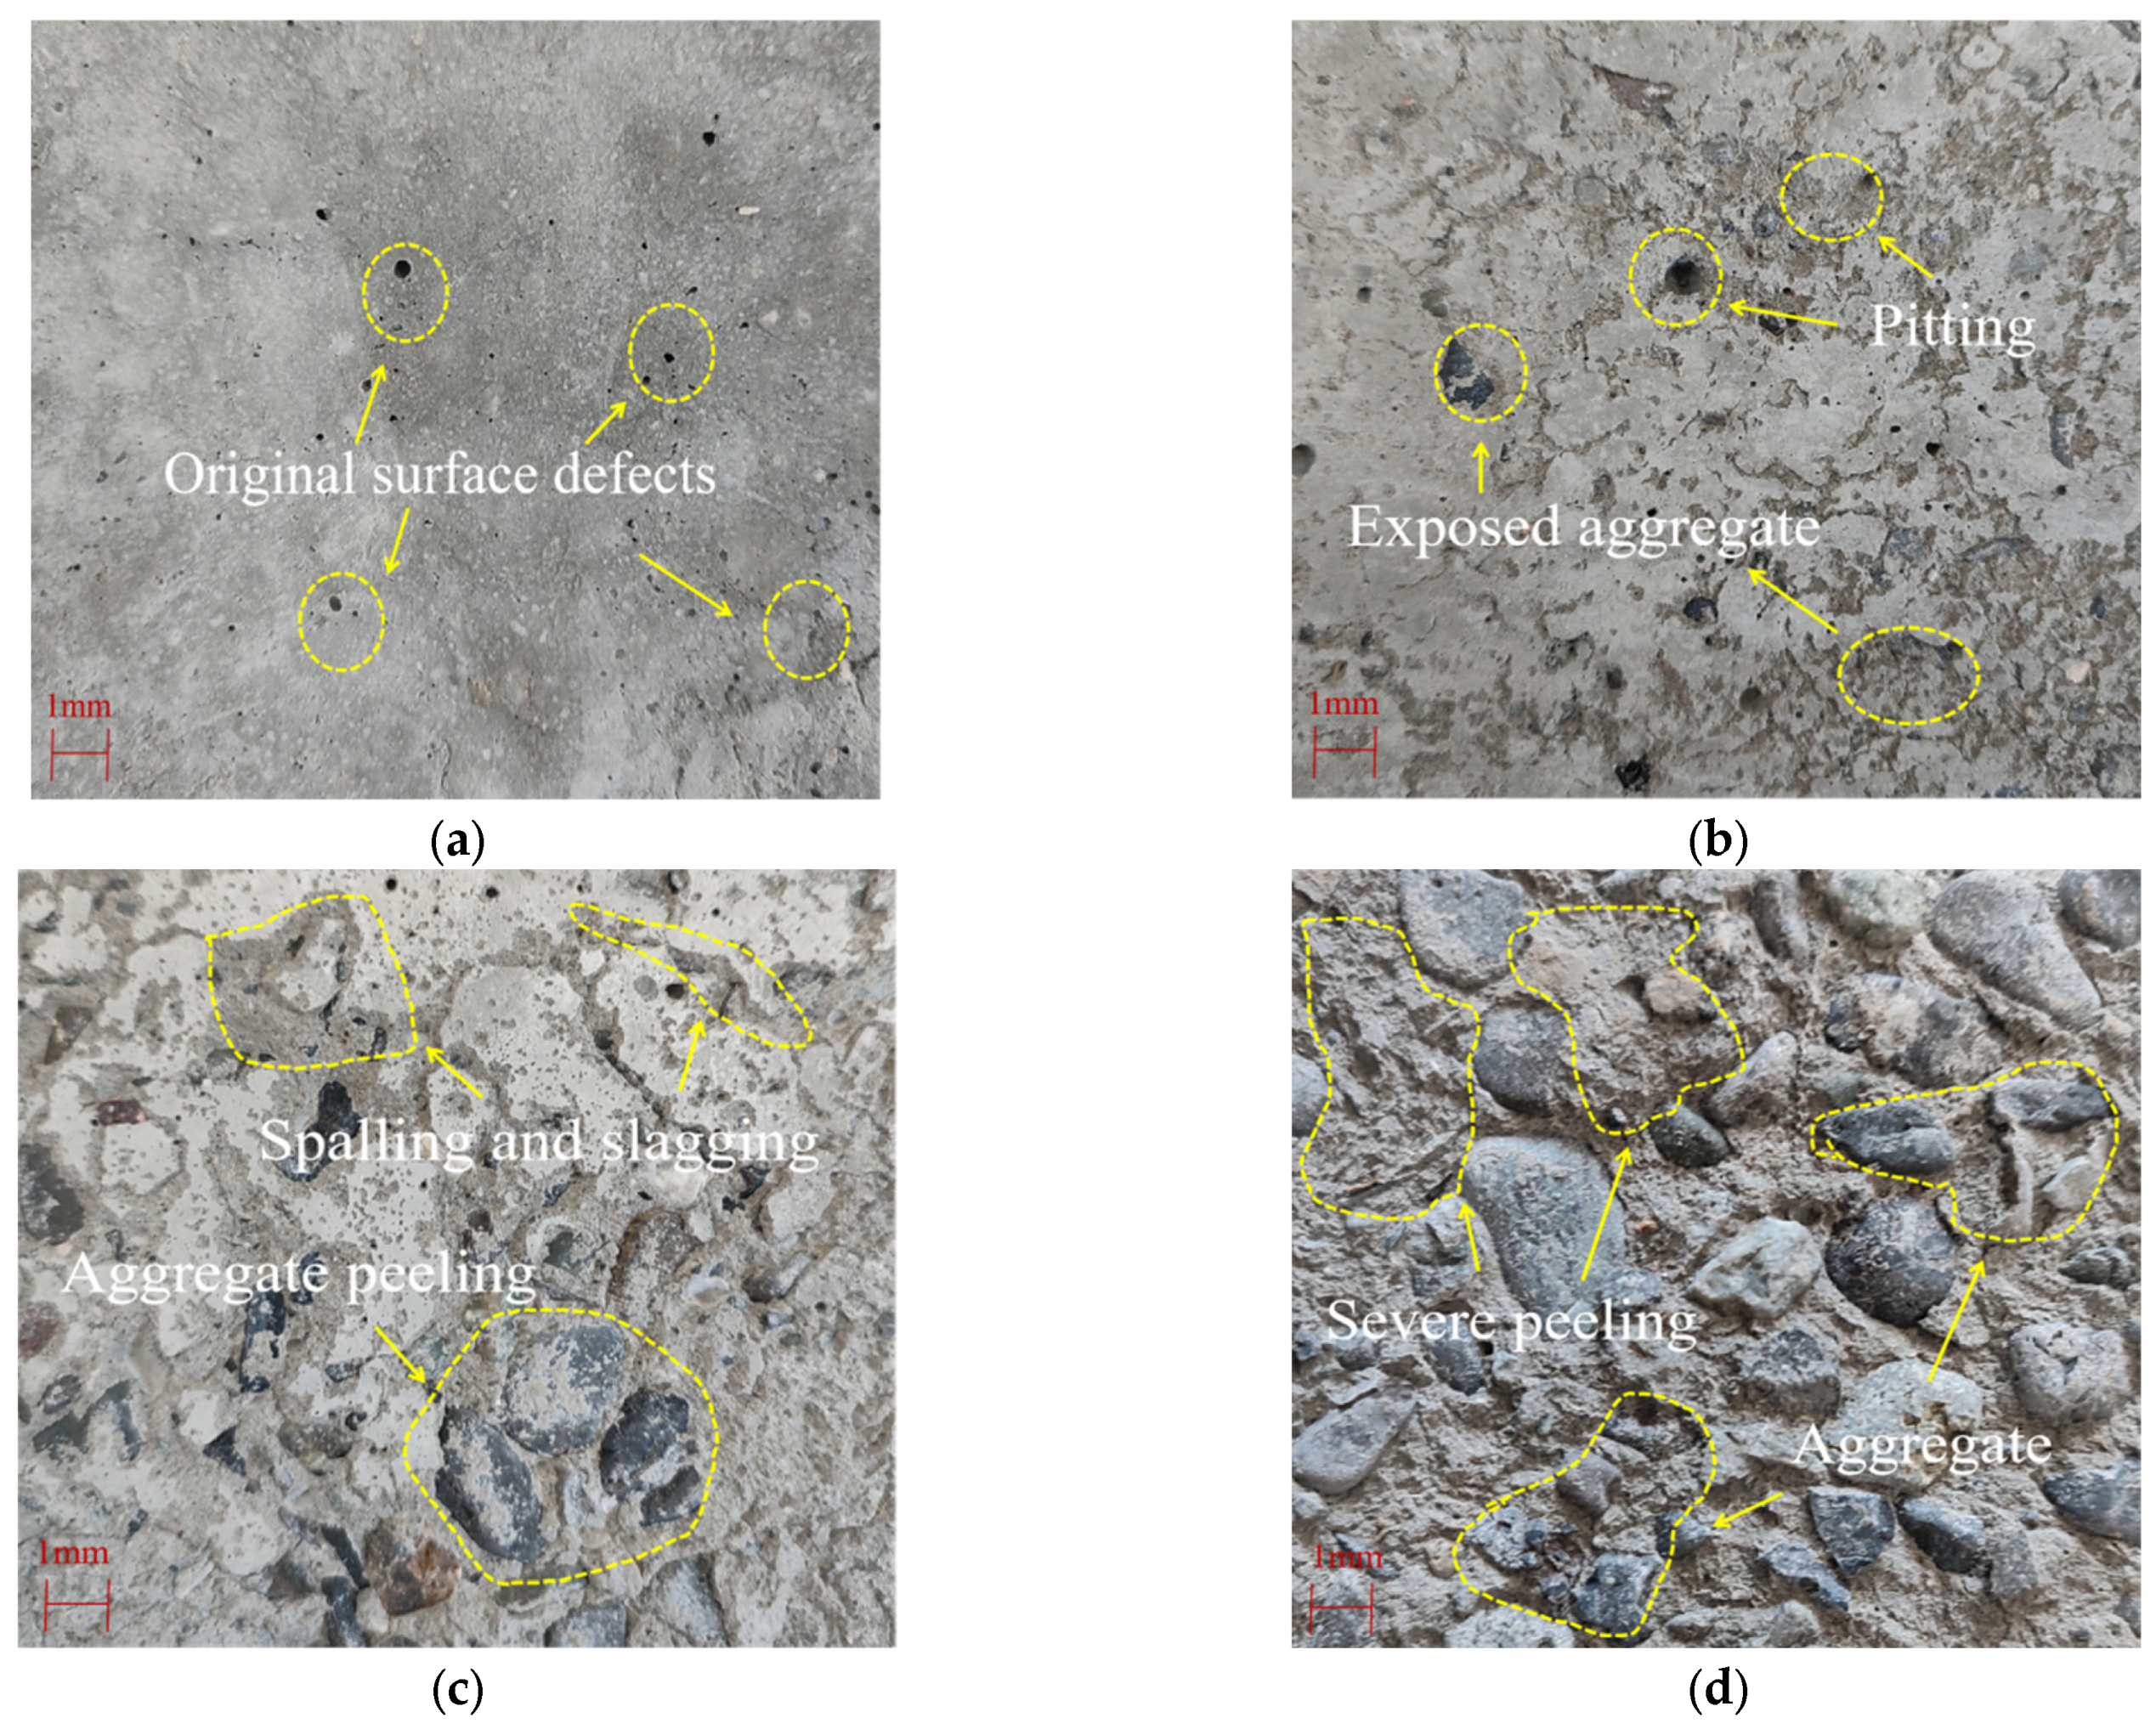
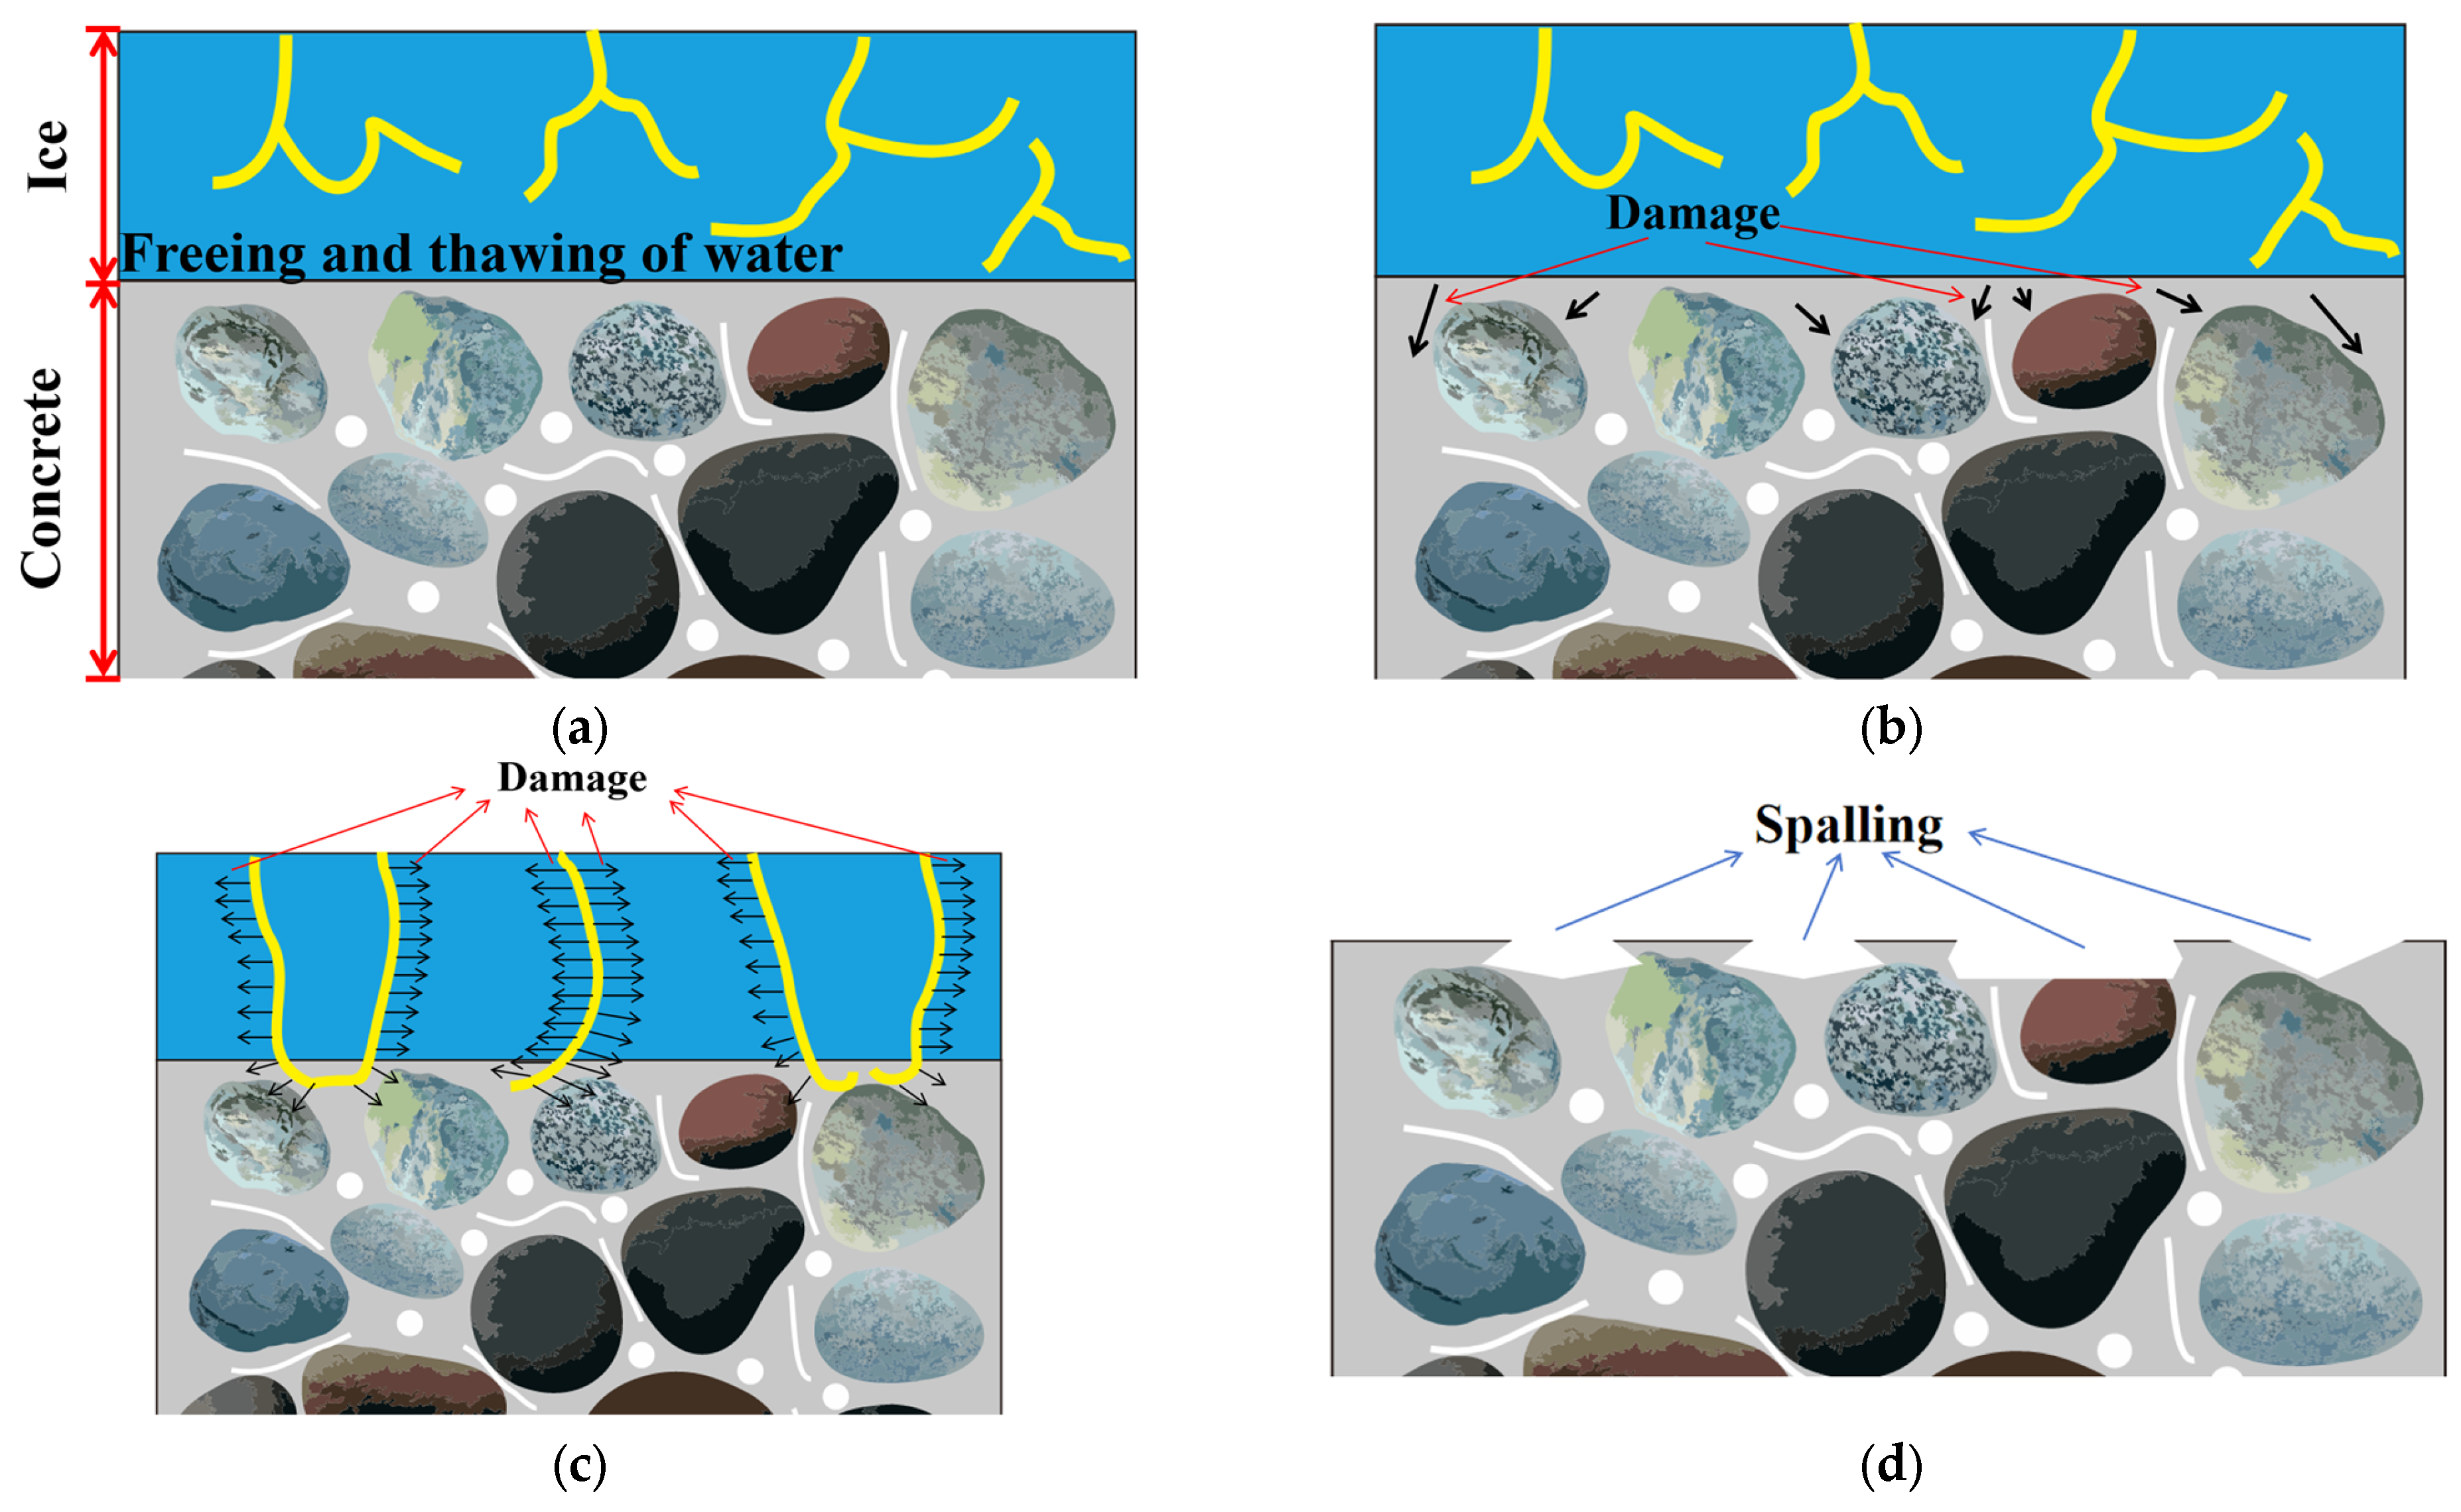
3.1. Appearance Damage
3.2. Freeze–Thaw Damage of DSC
3.2.1. Mass Loss Rate (MLR)
3.2.2. Relative Dynamic Elastic Modulus (RDEM)
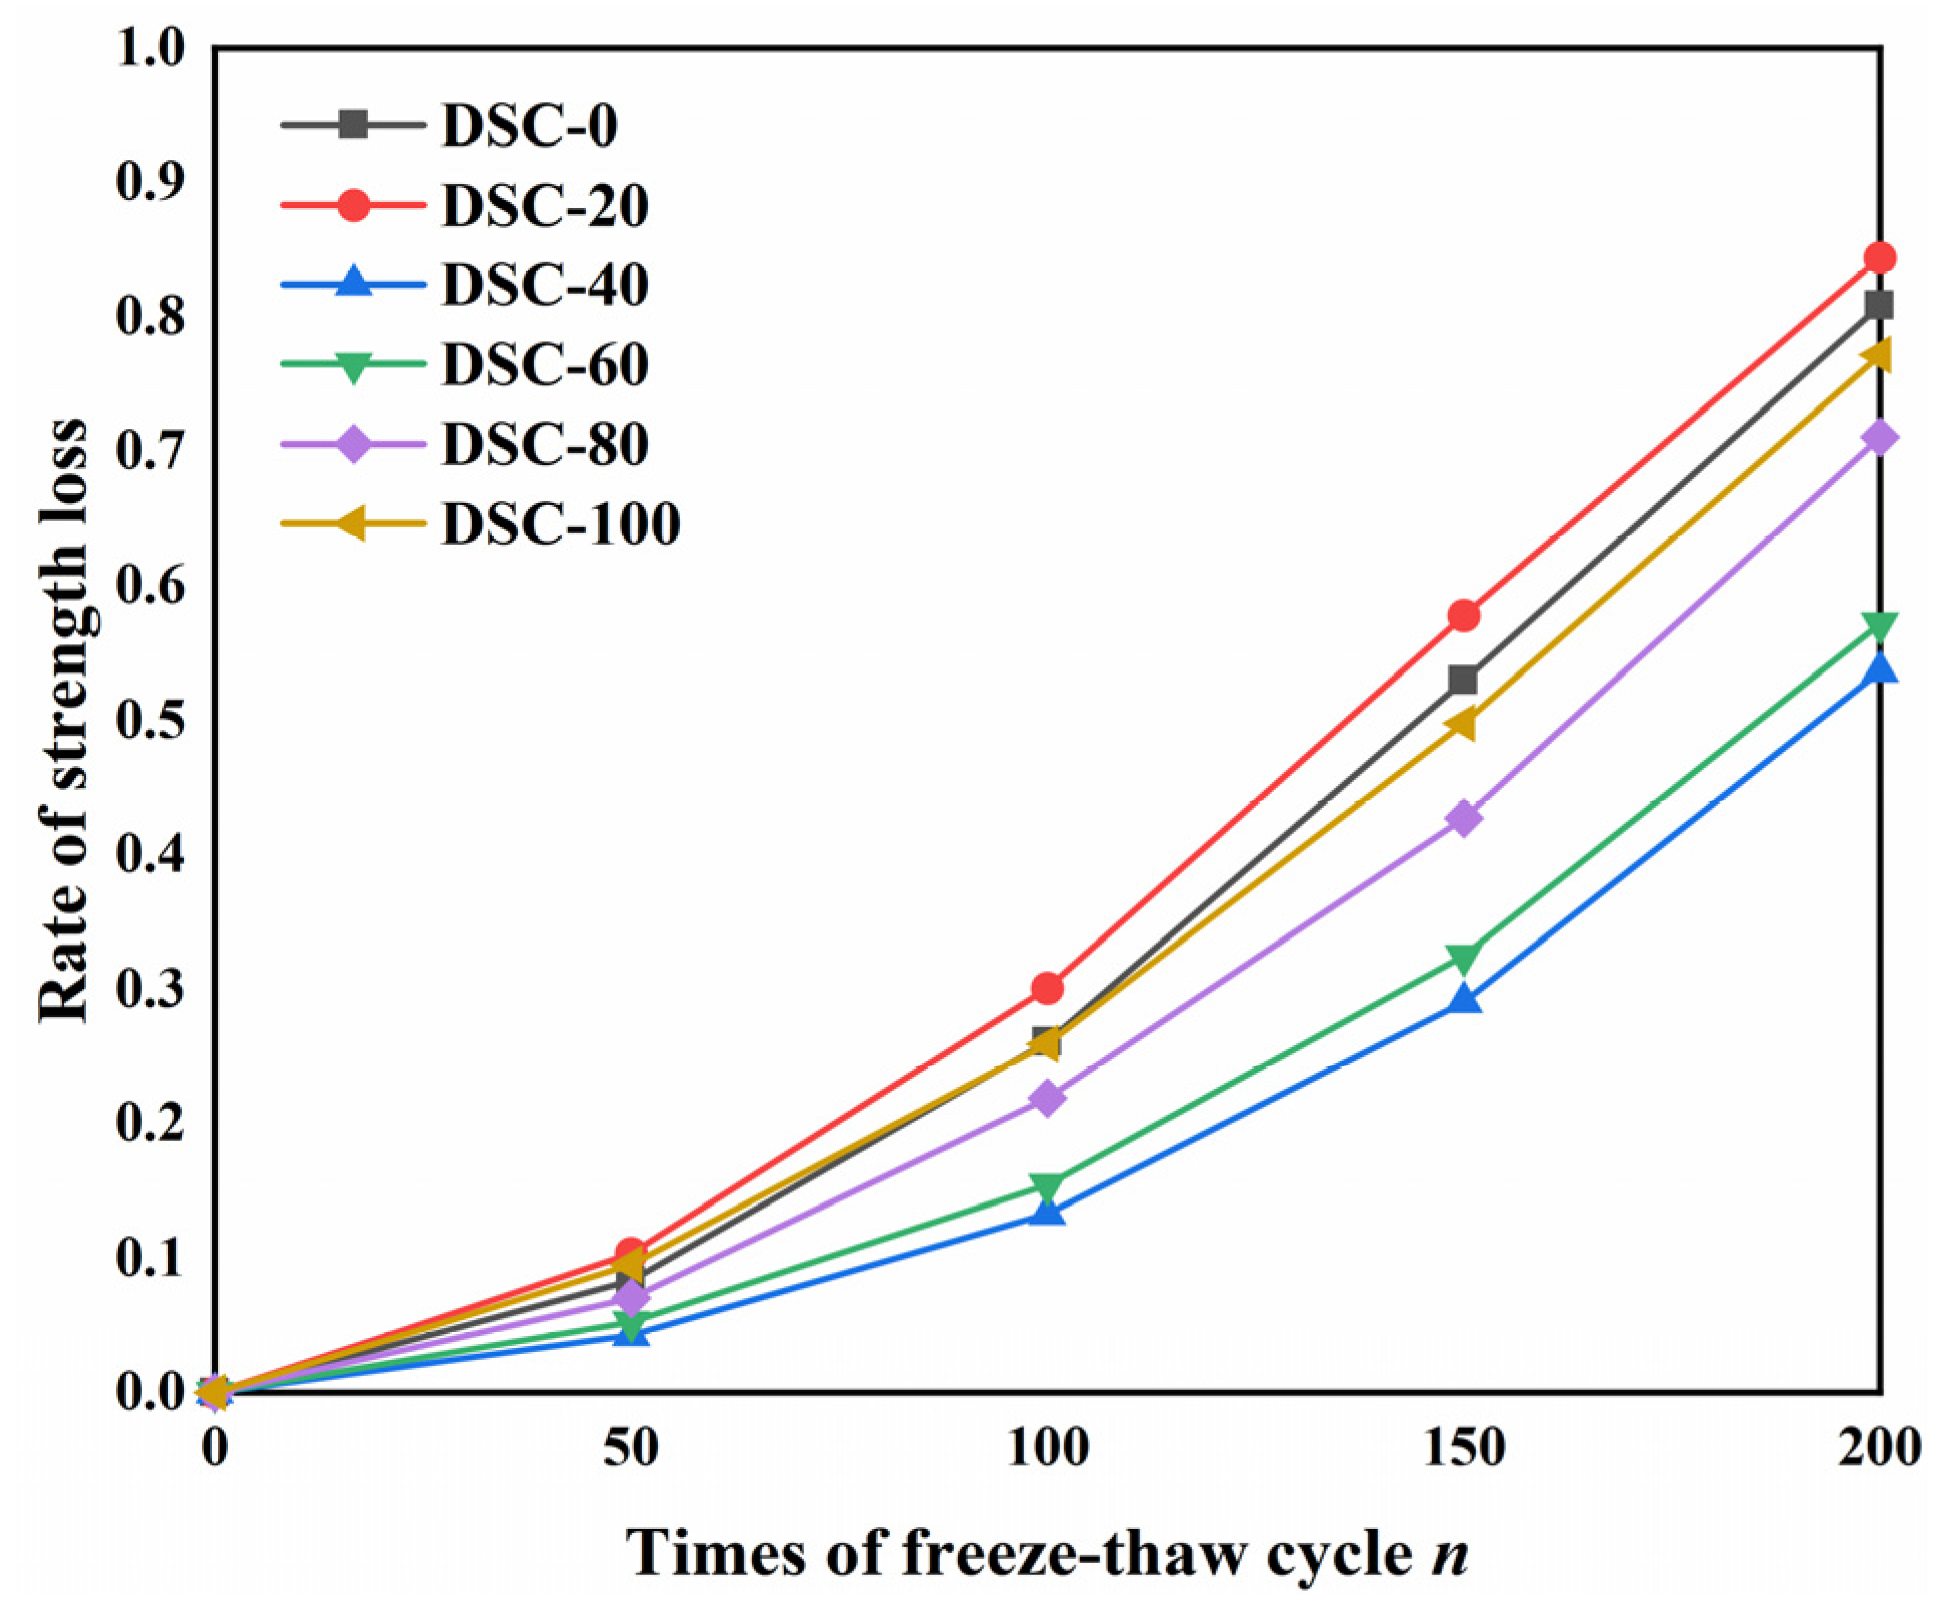
3.2.3. Compressive Strength
- Stage I (Elastic Domain): At stress levels below 30% of peak capacity, initial crack formation occurred preferentially at pre-existing microdefects. No discernible surface deformation was observed, with the material maintaining linear elastic behavior.
- Stage II (Elastoplastic Transition): Between 30 and 85% ultimate load, the micro-crack grew. The surface crack emerged.
- Stage III (Stress Localization): At 90–100% peak load, vertical macrocracks aligned with principal stress vectors became visible, accompanied by localized crushing of surface aggregates.
- Stage IV (Structural Failure): Post-peak strength degradation occurred through progressive shear band formation. Dominant diagonal cracks propagated, culminating in a complete loss of structural integrity.
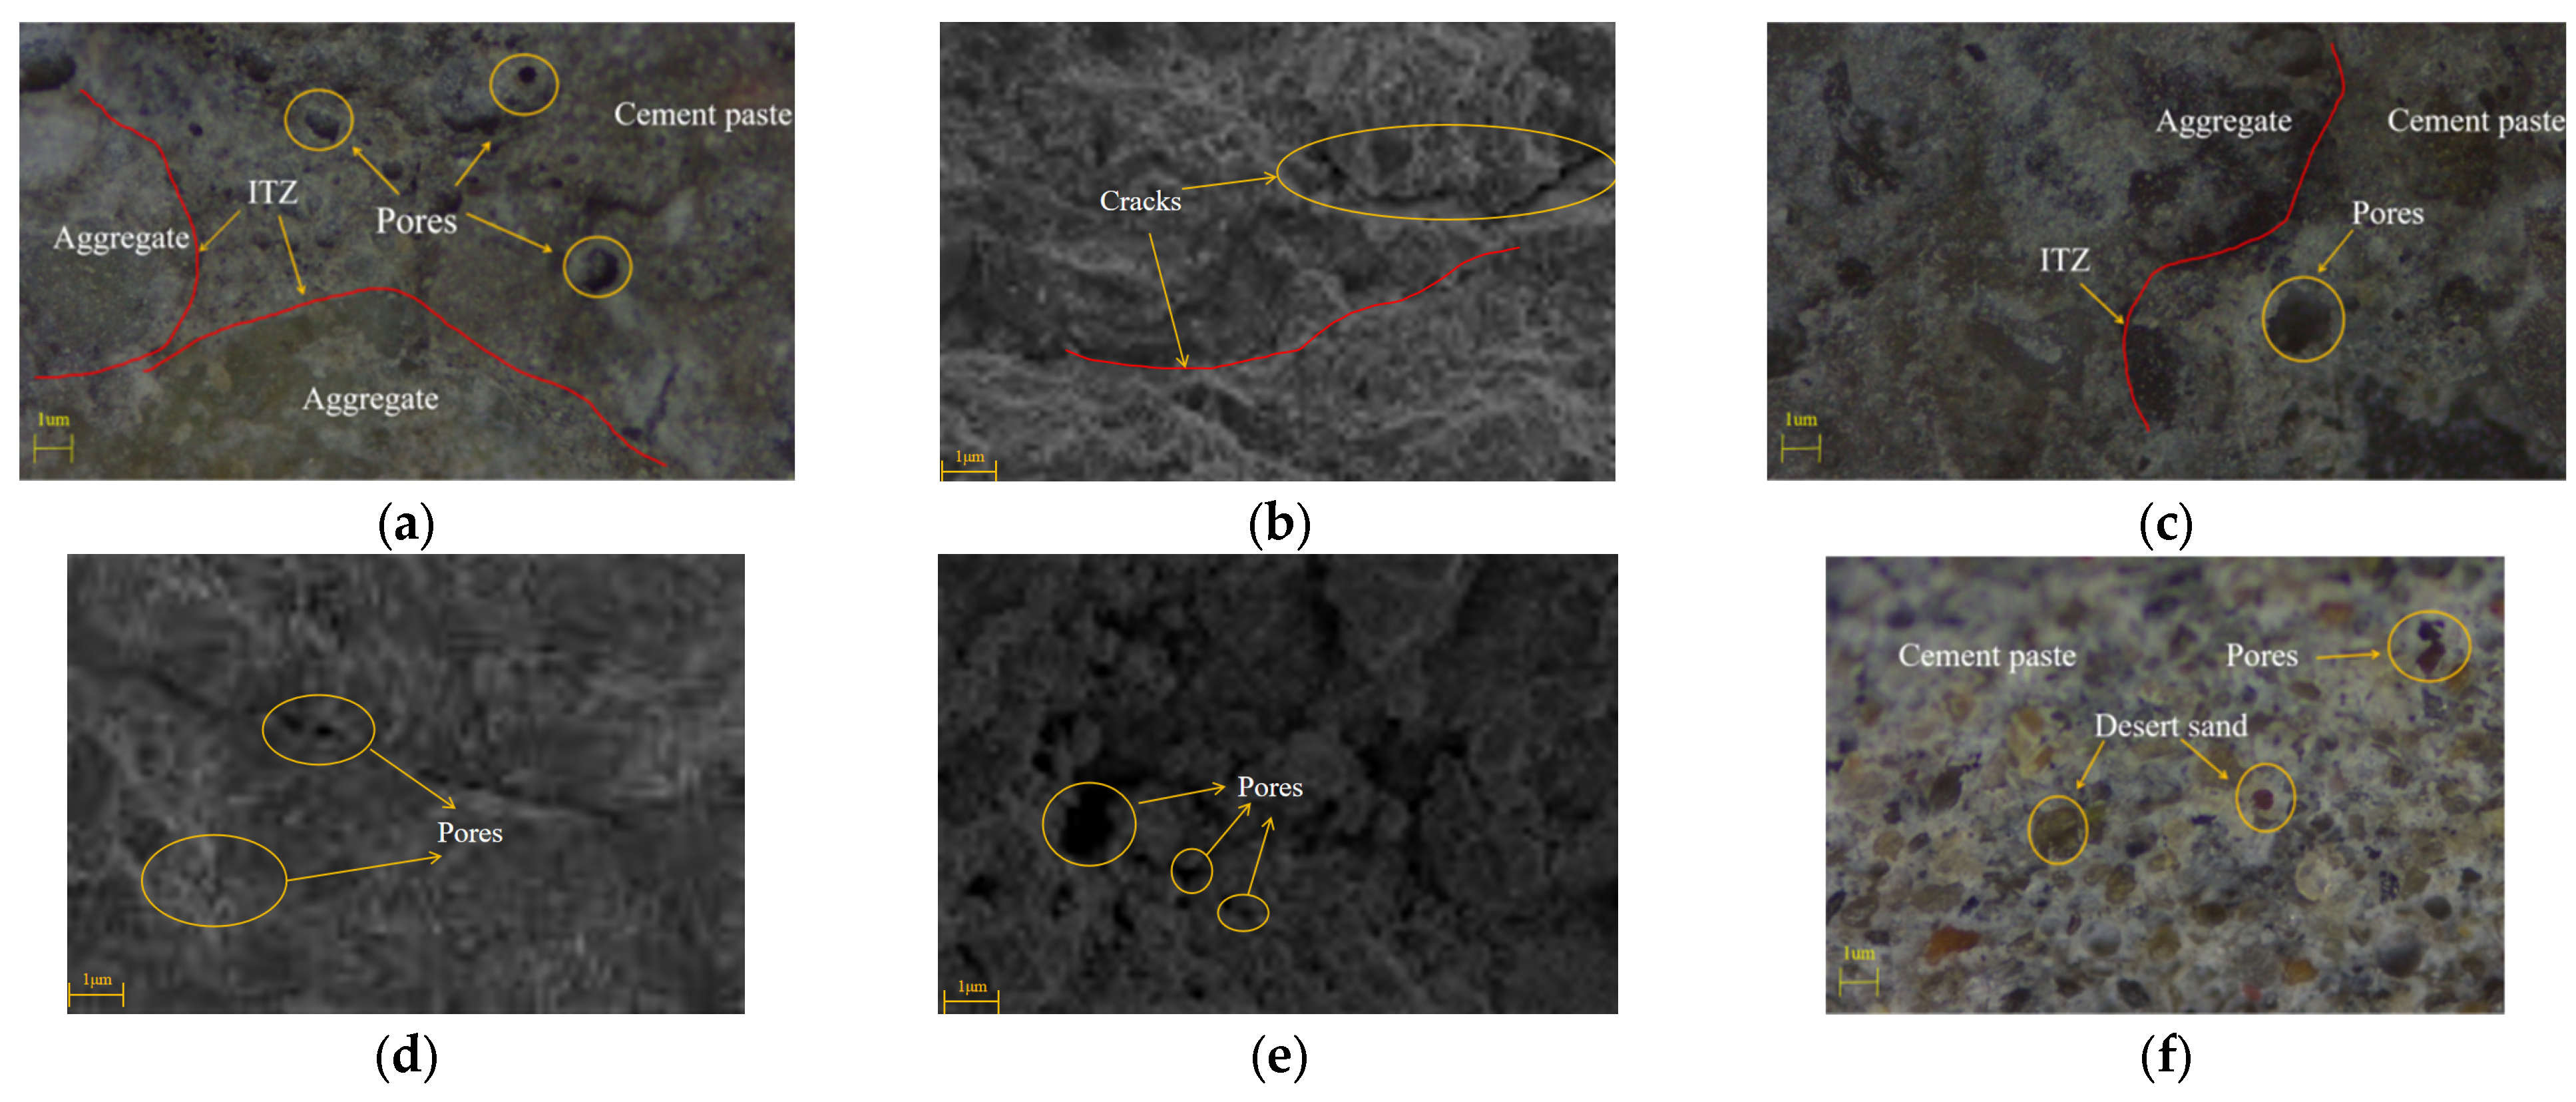
3.3. Microscopic Analysis
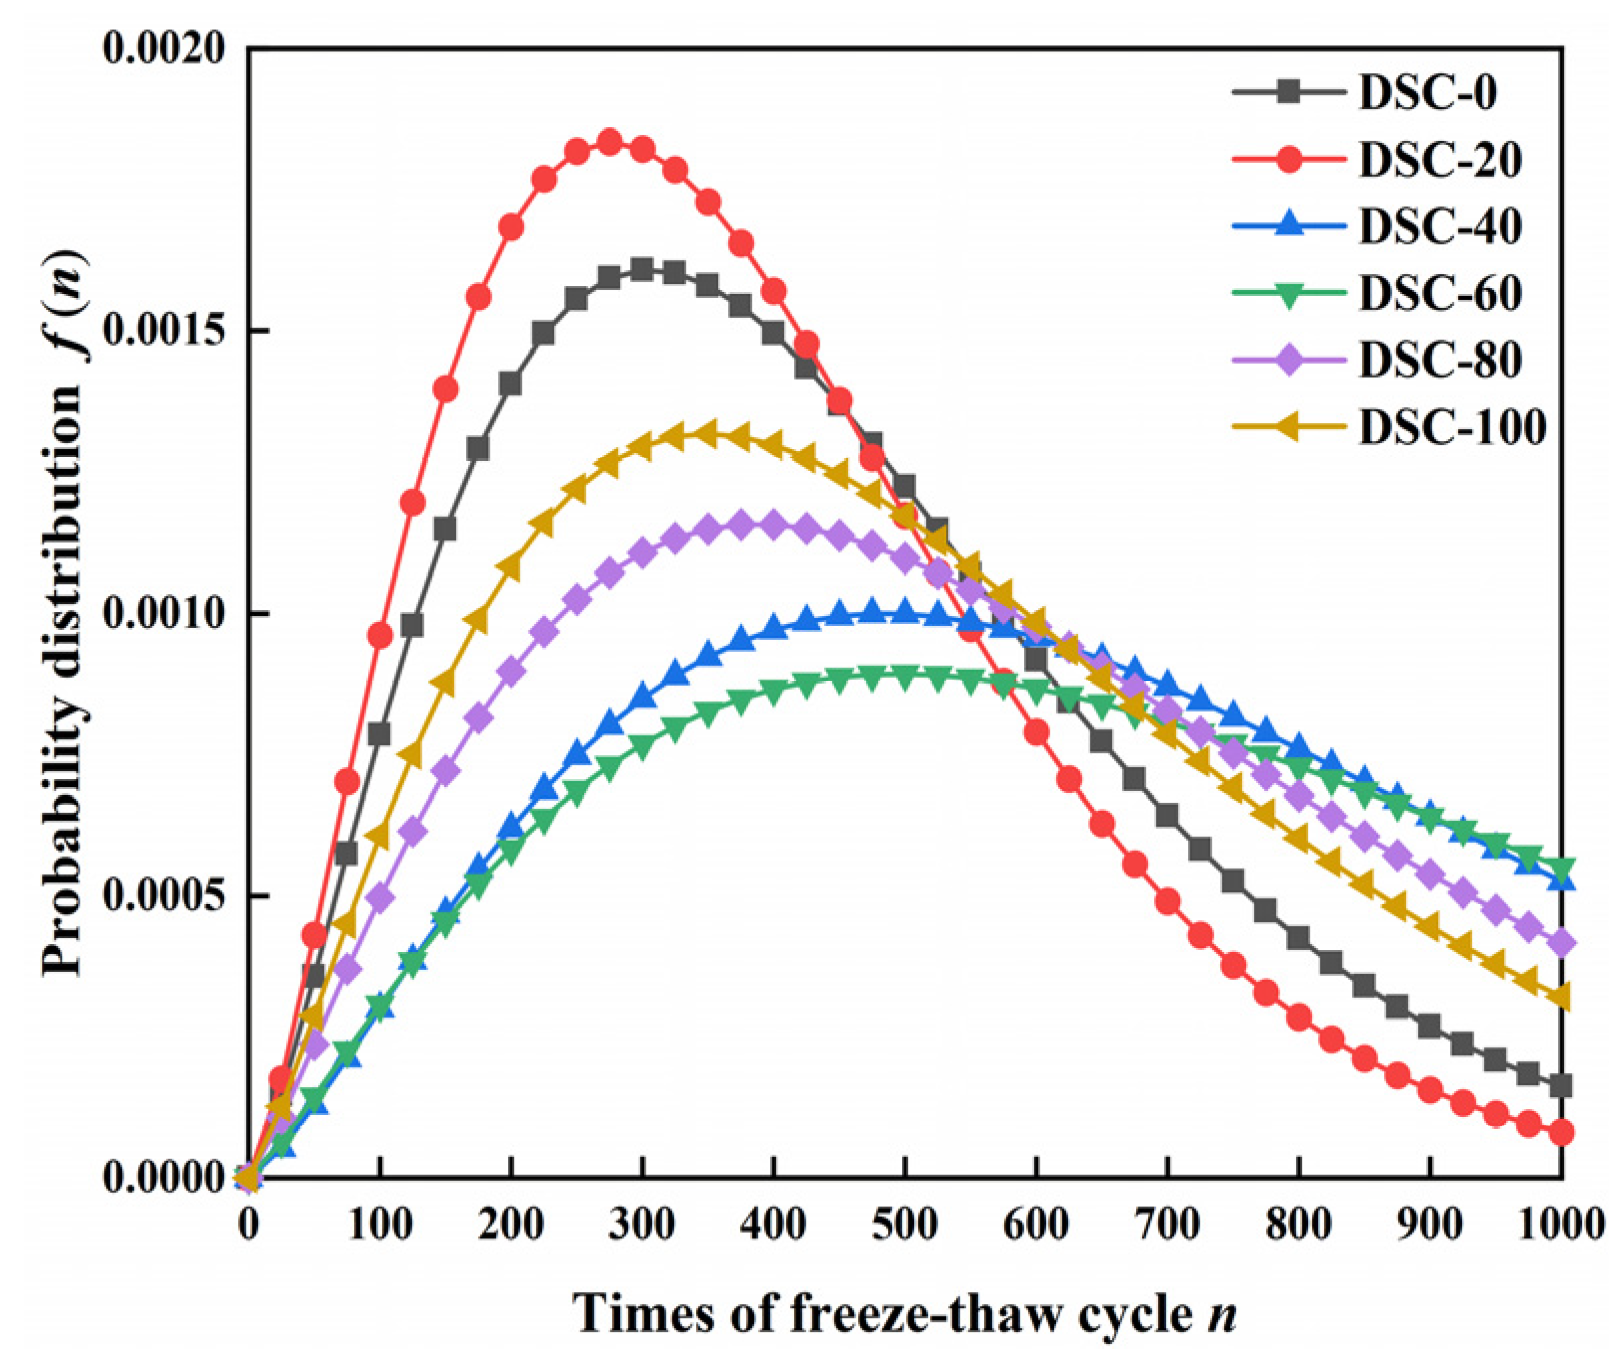
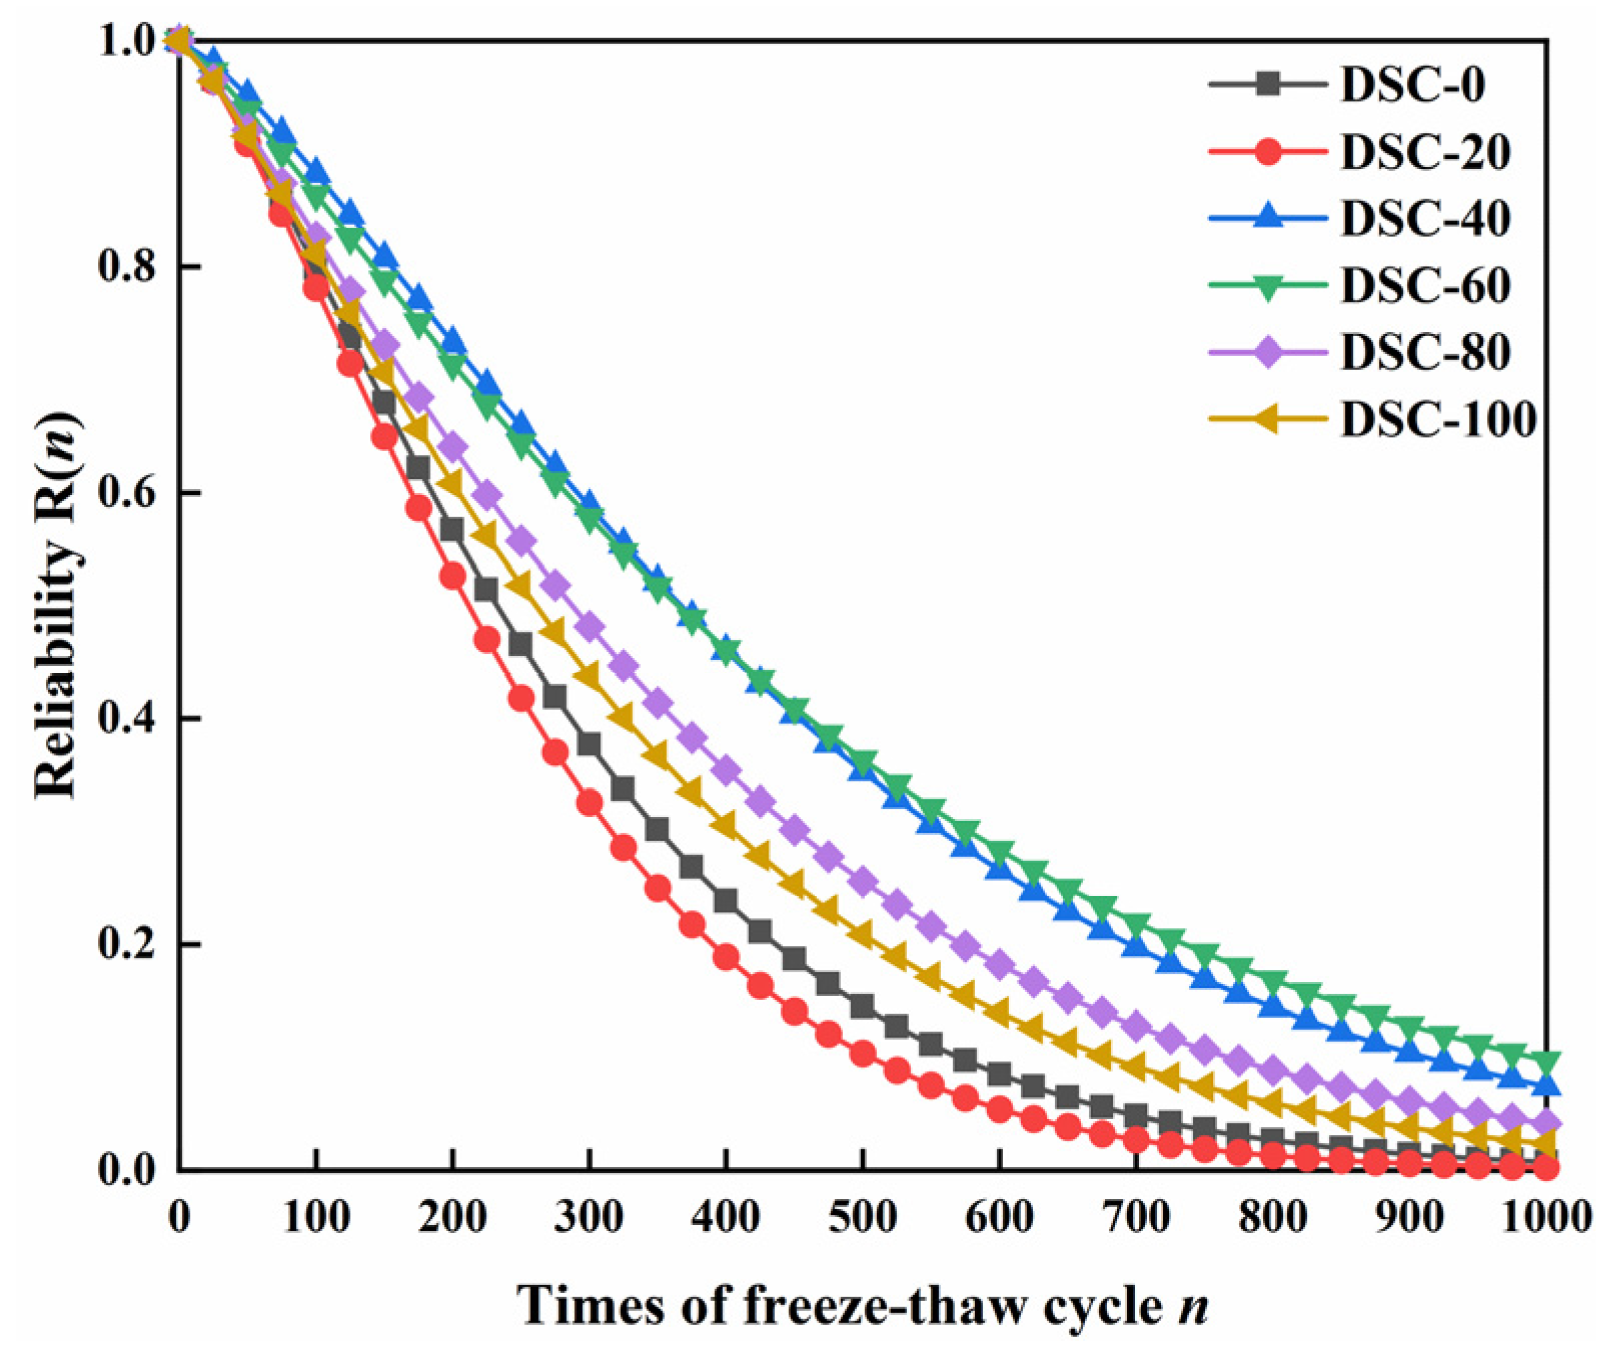
4. Reliability Analysis Model
- (1)
- When a < 1, the failure probability decreased with the increase in FTCs, corresponding to the initial stage of freeze–thaw micro-crack initiation. At this time, the damage caused by the ice expansion of pore water in the material had not formed a dominant damage path. The failure mode was a random failure.
- (2)
- When a = 1, the failure probability did not change when the FTCs increased, corresponding to the stable damage stage. The micro-crack growth and self-healing effects (such as partial pore closure) in the material reached a dynamic balance. The failure mode was an early failure.
- (3)
- When a > 1, the failure probability increased with FTCs, corresponding to the damage acceleration stage in the late freeze–thaw period. At this time, micro-cracks are connected to form macroscopic cracks. The failure mode was a loss failure.
5. Conclusions
- (1)
- As the FTCs increased, the MLR of concrete increased, while the RDEM and compressive strength decreased. Among the samples, DSC-40 showed the best resistance to the FTC. After 200 FTCs, the changes in mass, RDEM, and compressive strength of DSC-40 were 2.73%, 15.19%, and 27.2% lower than those of DSC0. The results showed that incorporating DS can improve the internal structure of concrete and effectively increase the resistance of concrete to CSE.
- (2)
- Damage to DSC was caused by the diminished adhesion effect of ITZ and the growth of cracks in cement mortar structures. According to the microscopic analysis, the addition of desert sand can optimize the concrete particle gradation and improve the initial defects of cement mortar and ITZ.
- (3)
- A reliability analysis model of DSC under FTC was developed based on the Weibull probability distribution. According to the model, the damage probability and damage degree of DSC accumulated simultaneously during the FTC. According to the results of the model, DSC-40 had the highest reliability, and its failure life was 287 FTCs. The results showed that the addition of DS can effectively increase the failure life of concrete under CSE.
Author Contributions
Funding
Data Availability Statement
Conflicts of Interest
Abbreviations
| DS | desert sand |
| DSC | desert sand concrete |
| FTC | FTC |
| RDEM | relative dynamic elastic modulus |
| ASC | aeolian sand concrete |
| ITZ | interface transition zone |
| DSRR | desert sand replacement rate |
| MLR | Mass Loss Rate |
| CSLR | compressive strength loss rate |
References
- Li, Z.; Zhang, R.; Zhou, Y.; Ji, F. Axial compressive properties analysis and strength evaluation of reinforced concrete short columns with dune sand. Structures 2025, 73, 108472. [Google Scholar] [CrossRef]
- Li, Z.; Gan, D. Cyclic behavior and strength evaluation of RC columns with dune sand. J. Build. Eng. 2022, 47, 103801. [Google Scholar] [CrossRef]
- Li, Z.; Zhai, D.; Li, J. Seismic behavior of the dune sand concrete beam-column joints under cyclic loading. Structures 2022, 40, 1014–1024. [Google Scholar] [CrossRef]
- Sadat, S.I.; Ding, F.-X.; Lyu, F.; Lessani, N.; Liu, X.; Yang, J. Unified prediction models for mechanical properties and stress-strain relationship of dune sand concrete. Comput. Concr. 2023, 32, 595–606. [Google Scholar] [CrossRef]
- Sadat, S.I.; Ding, F.-X.; Lyu, F.; Wang, E.; Sun, H.; Akhunzada, K.; Lessani, N. Axial compression behavior and reliable design approach of rectangular dune sand concrete-filled steel tube stub columns. Dev. Built Environ. 2024, 18, 100437. [Google Scholar] [CrossRef]
- Bai, J.; Xu, R.; Zhao, Y.; Shi, J. Flexural fatigue behavior and damage evolution analysis of aeolian sand concrete under freeze–thaw cycle. Int. J. Fatigue 2023, 171, 107583. [Google Scholar] [CrossRef]
- Bai, J.; Zhao, Y.; Shi, J.; He, X. Damage degradation model of aeolian sand concrete under freeze–thaw cycles based on macro-microscopic perspective. Constr. Build. Mater. 2022, 327, 126885. [Google Scholar] [CrossRef]
- Bai, J.; Zhao, Y.; Shi, J.; He, X. Cross-scale Study on the Mechanical Properties and Frost Resistance Durability of Aeolian Sand Concrete. KSCE J. Civ. Eng. 2021, 25, 4386–4402. [Google Scholar] [CrossRef]
- Li, Y.; Zhang, H.; Chen, S.; Wang, H.; Liu, G. Multi-scale study on the durability degradation mechanism of aeolian sand concrete under freeze–thaw conditions. Constr. Build. Mater. 2022, 340, 127433. [Google Scholar] [CrossRef]
- Li, Y.; Xia, W.; Liu, X.; Zhang, H.; He, P.; Wang, H.; Meng, X.; Cao, Y. Durability deterioration mechanism of aeolian sand concrete under carbonization & freeze-thaw conditions. Case Stud. Constr. Mater. 2025, 22, e04489. [Google Scholar] [CrossRef]
- Liu, H.; Ma, Y.; Ma, J.; Yang, W.; Che, J. Frost Resistance of Desert Sand Concrete. Adv. Civ. Eng. 2021, 2021, 6620058. [Google Scholar] [CrossRef]
- Dong, W.; Wang, J. Research on capillary water absorption characteristics of aeolian sand concrete under sulfate freeze-thaw coupling based on fractal theory. Constr. Build. Mater. 2024, 455, 139184. [Google Scholar] [CrossRef]
- Dong, W.; Shen, X.-D.; Xue, H.-J.; He, J.; Liu, Y. Research on the freeze-thaw cyclic test and damage model of Aeolian sand lightweight aggregate concrete. Constr. Build. Mater. 2016, 123, 792–799. [Google Scholar] [CrossRef]
- Qiao, L.; Miao, P.; Xing, G.; Luo, X.; Ma, J.; Farooq, M.A. Interpretable machine learning model for predicting freeze-thaw damage of dune sand and fiber reinforced concrete. Case Stud. Constr. Mater. 2023, 19, e02453. [Google Scholar] [CrossRef]
- Gong, L.; Bu, Y.; Xu, T.; Zhao, X.; Yu, X.; Liang, Y. Research on freeze resistance and life prediction of Desert sand–Crushed stone fine aggregate concrete. Case Stud. Constr. Mater. 2024, 21, e03896. [Google Scholar] [CrossRef]
- Wang, L.; Xiao, W.; Wang, Q.; Jiang, H.; Ma, G. Freeze-thaw resistance of 3D-printed composites with desert sand. Cem. Concr. Compos. 2022, 133, 104693. [Google Scholar] [CrossRef]
- Ji, Y.; Qasem, M.G.S.; Xu, T.; Mohammed, A.O.Y. Mechanical properties investigation on recycled rubber desert sand concrete. J. CO2 Util. 2024, 88, 102939. [Google Scholar] [CrossRef]
- Wang, Y.; He, M.; Wang, Y.; Liu, J.; Liu, J. The effect of graphene oxide on dune sand cementitious composites reflected in enhancing freeze–thaw resistance: An experimental study. Struct. Concr. 2023, 24, 6392–6404. [Google Scholar] [CrossRef]
- Hou, L.; Jian, S.; Huang, W. The Effect of Polypropylene Fiber and Glass Fiber on the Frost Resistance of Desert Sand Concrete. KSCE J. Civ. Eng. 2023, 28, 342–353. [Google Scholar] [CrossRef]
- Wei, L.; Yao, Z.; Li, H.; Guo, H.; Li, Y. Mechanical Properties of Aeolian Sand Concrete Made from Alkali-Treated Aeolian Sand and Zeolite Powder. Materials 2024, 17, 1537. [Google Scholar] [CrossRef]
- GB/T50082-2009; Standard for Test Methods of Long-Term Performance and Durability of Ordinary Concrete. China Architecture and Building Press: Beijing, China, 2009. (In Chinese)
- GB/T50081-2019; Standard for Test Methods of Concrete Physical Andmechanical Properties. China Architecture and Building Press: Beijing, China, 2019. (In Chinese)
- Li, Y.; Zhang, H.; Chen, S.; Hu, D.; Gao, W. Multi-scale degradation mechanism of aeolian sand concrete under salt-frost condition. Acta Mater. Compos. Sin. 2023, 40, 2331–2342. (In Chinese) [Google Scholar]
- Xiao, Q.H.; Cao, Z.Y.; Guan, X.; Li, Q.; Liu, X.L. Damage to recycled concrete with different aggregate substitution rates from the coupled action of freeze-thaw cycles and sulfate attack. Constr. Build. Mater. 2019, 221, 74–83. [Google Scholar] [CrossRef]
- Zhang, S.; Fan, Y.; Shah, S.P. Study on Deformation Characteristics and Damage Model of NMK Concrete under Cold Environment. Buildings 2022, 12, 1431. [Google Scholar] [CrossRef]
- Xue, H.; Shen, X.; Liu, Q.; Wang, R.; Liu, Z. Analysis of the Damage to the Aeolian sand Concrete Surfaces Caused by Wind-Sand Erosion. J. Adv. Concr. Technol. 2017, 15, 724–737. [Google Scholar] [CrossRef]
- Zhang, P.; Wittmann, F.H.; Vogel, M.; Müller, H.S.; Zhao, T. Influence of freeze-thaw cycles on capillary absorption and chloride penetration into concrete. Cem. Concr. Res. 2017, 100, 60–67. [Google Scholar] [CrossRef]
- Song, H.; Yao, J.; Xiang, J. The role of aggregate and cement paste in the deterioration of the transitional interface zone of pervious concrete during freeze-thaw cycles. Case Stud. Constr. Mater. 2022, 16, e01086. [Google Scholar] [CrossRef]
- Alhozaimy, A.; Jaafar, M.; Al-Negheimish, A.; Abdullah, A.; Taufiq-Yap, Y.; Noorzaei, J.; Alawad, O. Properties of high strength concrete using white and dune sands under normal and autoclaved curing. Constr. Build. Mater. 2012, 27, 218–222. [Google Scholar] [CrossRef]
- Gong, F.; Sicat, E.; Zhang, D.; Ueda, T. Stress Analysis for Concrete Materials under Multiple Freeze-Thaw Cycles. J. Adv. Concr. Technol. 2015, 13, 124–134. [Google Scholar] [CrossRef]
- Li, Y.; Liu, Y.; Guo, H.; Li, Y. Investigation of the freeze-thaw deterioration behavior of hydraulic concrete under various curing temperatures. J. Build. Eng. 2024, 95, 110247. [Google Scholar] [CrossRef]
- Elipe, M.G.M.; López-Querol, S. Aeolian sands: Characterization, options of improvement and possible employment in construction—The State-of-the-art. Constr. Build. Mater. 2014, 73, 728–739. [Google Scholar] [CrossRef]
- Abu Seif, E.-S.S.; Sonbul, A.R.; Hakami, B.A.H.; El-Sawy, E.K. Experimental study on the utilization of dune sands as a construction material in the area between Jeddah and Mecca, Western Saudi Arabia. Bull. Eng. Geol. Environ. 2016, 75, 1007–1022. [Google Scholar] [CrossRef]
- Yoon, J.; Kim, H.; Sim, S.-H.; Pyo, S. Characterization of Porous Cementitious Materials Using Microscopic Image Processing and X-ray CT Analysis. Materials 2020, 13, 3105. [Google Scholar] [CrossRef] [PubMed]
- Wu, Y.-C.; Xiao, J. The effect of microscopic cracks on chloride diffusivity of recycled aggregate concrete. Constr. Build. Mater. 2018, 170, 326–346. [Google Scholar] [CrossRef]
- Zhou, M.; Dong, W. Grey relativity correlations between the pore structures and compressive strength of aeolian sand concrete undergoing carbonation and freeze-thaw cycles. J. Build. Eng. 2023, 77, 107515. [Google Scholar] [CrossRef]
- Seif, E.-S.S.A. Assessing the engineering properties of concrete made with fine dune sands: An experimental study. Arab. J. Geosci. 2013, 6, 857–863. [Google Scholar] [CrossRef]
- Tian, J. Better reliability assessment and prediction through data clustering. IEEE Trans. Softw. Eng. 2002, 28, 997–1007. [Google Scholar] [CrossRef]
- Jia, Y.; Liu, G.; Yang, Y.; Gao, Y.; Yang, T.; Tang, F. Degradation reliability modeling of plain concrete for pavement under flexural fatigue loading. Adv. Concr. Constr. 2020, 9, 469–478. [Google Scholar]
- Li, Q.; Fang, J.; Liu, D.; Tang, J. Failure probability prediction of concrete components. Cement. Concr. Res. 2003, 33, 1631–1636. [Google Scholar] [CrossRef]
- Guo, X.; Qiao, H.; Zhu, B.; Wang, P.; Wen, S. Accelerated Life Testing of Concrete based on Three-parameter Weibull Stochastic Approach. KSCE J. Civ. Eng. 2019, 23, 1682–1690. [Google Scholar] [CrossRef]
- Lu, C.; Danzer, R.; Fischer, F.D. Influence of threshold stress on the estimation of the Weibull statistics. J. Am. Ceram. Soc. 2002, 85, 1640–1642. [Google Scholar] [CrossRef]


| Types of Sand | Apparent Density (kg/m3) | Stacking Density (kg/m3) | Fineness Modulus (mm) | Mud Content (%) | Water Absorption (%) |
|---|---|---|---|---|---|
| River sand | 2038 | 1350 | 2.58 | 2.2 | 0.8 |
| Desert sand | 2630 | 1615 | 0.198 | 1.9 | 2.1 |
| Specimen Number | Water–Binder Ratio | Sand Rate | Water (kg/m3) | Cement (kg/m3) | Water Reducer (kg/m3) | Coarse Aggregates (kg/m3) | River Sand (kg/m3) | Desert Sand (kg/m3) |
|---|---|---|---|---|---|---|---|---|
| DSC-0 | 0.4 | 0.3 | 160 | 400 | 1.6 | 1288 | 552 | 0 |
| DSC-20 | 0.4 | 0.3 | 160 | 400 | 1.6 | 1288 | 441.6 | 110.4 |
| DSC-40 | 0.4 | 0.3 | 160 | 400 | 1.6 | 1288 | 331.2 | 220.8 |
| DSC-60 | 0.4 | 0.3 | 160 | 400 | 1.6 | 1288 | 220.8 | 331.2 |
| DSC-80 | 0.4 | 0.3 | 160 | 400 | 1.6 | 1288 | 110.4 | 441.6 |
| DSC-100 | 0.4 | 0.3 | 160 | 400 | 1.6 | 1288 | 0 | 552 |
| FTCs/n | 0 | 25 | 50 | 75 | 100 | 125 | 150 | 175 | 200 | 225 | 250 | |
|---|---|---|---|---|---|---|---|---|---|---|---|---|
| MLR/% | DSC-0 | 0 | 0.314 | 0.671 | 1.287 | 2.012 | 2.892 | 3.570 | 4.303 | 5.375 | 6.652 | 7.741 |
| DSC-20 | 0 | 0.224 | 0.762 | 1.240 | 2.264 | 3.125 | 3.859 | 4.681 | 5.764 | 6.968 | 8.365 | |
| DSC-40 | 0 | 0.102 | 0.212 | 0.422 | 0.690 | 1.067 | 1.432 | 1.879 | 2.715 | 3.637 | 5.016 | |
| DSC-60 | 0 | 0.216 | 0.362 | 0.461 | 0.832 | 1.171 | 1.540 | 2.118 | 3.046 | 4.049 | 5.607 | |
| DSC-80 | 0 | 0.236 | 0.627 | 0.993 | 1.387 | 1.861 | 2.399 | 3.241 | 4.086 | 5.289 | 6.675 | |
| DSC-100 | 0 | 0.243 | 0.647 | 1.173 | 1.743 | 2.282 | 2.964 | 3.635 | 4.786 | 5.931 | 7.180 | |
| FTCs/n | 0 | 25 | 50 | 75 | 100 | 125 | 150 | 175 | 200 | 225 | 250 | |
|---|---|---|---|---|---|---|---|---|---|---|---|---|
| RDEM/% | DSC-0 | 0.00 | 3.29 | 8.39 | 16.25 | 20.88 | 26.72 | 30.35 | 35.20 | 41.32 | 48.48 | 56.39 |
| DSC-20 | 0.00 | 3.07 | 10.42 | 16.42 | 23.70 | 29.41 | 34.62 | 38.64 | 45.14 | 52.31 | 58.62 | |
| DSC-40 | 0.00 | 2.42 | 4.32 | 7.51 | 11.44 | 14.38 | 18.20 | 21.62 | 25.63 | 32.03 | 41.20 | |
| DSC-60 | 0.00 | 3.27 | 5.32 | 9.41 | 12.77 | 17.10 | 20.14 | 24.17 | 27.59 | 32.95 | 41.98 | |
| DSC-80 | 0.00 | 3.90 | 7.11 | 12.89 | 16.96 | 21.65 | 24.69 | 29.90 | 34.52 | 42.15 | 50.31 | |
| DSC-100 | 0.00 | 3.80 | 8.06 | 14.70 | 18.14 | 23.35 | 27.20 | 31.92 | 36.96 | 46.31 | 53.87 | |
| Specimen Number | A | b |
|---|---|---|
| DSC-0 | 1.33568 | 305.5357 |
| DSC-20 | 1.37716 | 276.1621 |
| DSC-40 | 1.31762 | 484.6548 |
| DSC-60 | 1.201 | 495.1015 |
| DSC-80 | 1.22052 | 387.9058 |
| DSC-100 | 1.25195 | 349.4554 |
Disclaimer/Publisher’s Note: The statements, opinions and data contained in all publications are solely those of the individual author(s) and contributor(s) and not of MDPI and/or the editor(s). MDPI and/or the editor(s) disclaim responsibility for any injury to people or property resulting from any ideas, methods, instructions or products referred to in the content. |
© 2025 by the authors. Licensee MDPI, Basel, Switzerland. This article is an open access article distributed under the terms and conditions of the Creative Commons Attribution (CC BY) license (https://creativecommons.org/licenses/by/4.0/).
Share and Cite
Luo, Y.; Zhang, R.; Wu, Y.; Li, Z. Performance Study and Reliability Analysis of Desert Sand Concrete Under FTC. Buildings 2025, 15, 1317. https://doi.org/10.3390/buildings15081317
Luo Y, Zhang R, Wu Y, Li Z. Performance Study and Reliability Analysis of Desert Sand Concrete Under FTC. Buildings. 2025; 15(8):1317. https://doi.org/10.3390/buildings15081317
Chicago/Turabian StyleLuo, Yun, Ruichen Zhang, Yanping Wu, and Zhiqiang Li. 2025. "Performance Study and Reliability Analysis of Desert Sand Concrete Under FTC" Buildings 15, no. 8: 1317. https://doi.org/10.3390/buildings15081317
APA StyleLuo, Y., Zhang, R., Wu, Y., & Li, Z. (2025). Performance Study and Reliability Analysis of Desert Sand Concrete Under FTC. Buildings, 15(8), 1317. https://doi.org/10.3390/buildings15081317