Abstract
Sick building syndrome (SBS) poses a significant challenge in hospital settings, adversely affecting staff health, operational efficiency, and environmental quality. This study aims to investigate the prevalence and risk factors of SBS among medical staff in Chinese hospitals, advancing the literature by pinpointing actionable environmental and psychological factors tailored to this occupational group within China’s distinct regional context. A survey questionnaire was administered to 615 medical staff members across seven private hospitals located in the eastern coastal region of China. Data were collected using structured questionnaires. The survey encompassed 27 factors across four aspects, with respondents being asked to self-assess the severity of four types of SBS symptoms (never, rarely, occasionally, often). Multivariable binary logistic regression analysis was carried out to identify factors associated with SBS, based on odds ratios (OR) with a significance level of p < 0.05. The prevalence rates for skin symptoms, mucosal symptoms, and general symptoms were 32.8%, 61%, and 71.1%, respectively. Gender, psychological mood, visibility of water systems and greenery from the workspace, outdoor noise environment, indoor air quality, indoor natural lighting, department of occupancy, design of workspace, cleanliness, and control over the indoor environment (temperature, lighting) were identified as risk factors related to SBS symptoms. These findings underscore the critical role of modifiable building design and psychological factors in SBS occurrence, offering a novel perspective on hospital-specific risks in China compared to global studies. Enhancing indoor and outdoor environments—through increased greenery, noise reduction, improved air quality, better lighting, and greater environmental control—emerges as a vital strategy to mitigate SBS, with implications for hospital management and staff well-being.
1. Introduction
The World Health Organization defines health as a state of complete physical, mental, and social well-being, beyond merely the absence of disease or infirmity [1]. The sudden outbreak of COVID-19 in 2020 has once again highlighted the importance of creating healthy buildings [2,3,4]. Building a truly healthy building is a significant challenge for the construction industry. The indoor environment directly affects human health levels [5], and poor environments can easily lead to sick building syndrome [6]. SBS refers to a series of non-specific symptoms, including discomfort in the eyes, nose, and throat, mental fatigue, headaches, nausea, dizziness, and skin discomfort. These symptoms usually do not manifest as objective physiological abnormalities but can cause discomfort and reduced efficiency [7]. Research on SBS in hospitals is of profound significance in enhancing hospital environmental quality, ensuring personnel health, reducing operational costs, and fully leveraging the social functional role of hospitals.
Currently, there is no unified standard for the classification of SBS, and most existing studies focus on residential [8,9,10,11,12,13,14] and office buildings [15,16]. Research indicates that up to 30% of new and renovated buildings suffer from SBS [8]. Even when indoor environments meet current standard requirements, the occurrence of SBS cannot be effectively prevented. The classification of SBS varies across different regions and studies. Generally, SBS can be divided into general symptoms (GS), mucosal symptoms (MS), and skin symptoms (SS). The incidence rate of SBS varies widely across different regions, building types, and case studies [17,18,19,20,21].
Research on the influencing factors of sick building syndrome has always been a hot topic in domestic and international studies. Since the 1970s, the reporting frequency of sick building syndrome has been increasing, as older, naturally ventilated buildings have gradually been replaced by air-conditioned and sealed buildings [7]. Currently, no single environmental parameter has been identified as the sole cause of a specific type of sick building syndrome. Existing research indicates that sick building syndrome is the result of the combined effects of multiple factors and long-term exposure of users [22].
The influencing factors of sick building syndrome mainly include five aspects: indoor environmental factors (physical and non-physical) [23,24,25,26], biological factors [27], chemical factors [25], psychological factors [16,22], and individual differences [22]. Numerous studies have focused on common physical environmental parameters, such as sound, light, heat, and air quality, and pointed out that they are all directly related to the incidence of sick building syndrome and can affect the health and work efficiency of users [28,29,30,31,32]. However, in indoor environments, lower CO2 concentrations, pollutant concentrations, and suitable temperature and humidity levels help reduce the occurrence of sick building syndrome.
In China, hospital medical staff face high personnel density and heavy workloads [33], rendering them particularly vulnerable to sick building syndrome (SBS). However, current hospital environmental design strategies in China prioritize basic comfort requirements, with insufficient attention to SBS prevention and control. Consequently, recurring SBS issues in hospital buildings remain inadequately analyzed and addressed. While most existing studies target residential and office environments, research on SBS in hospitals—especially in the Chinese context—remains scarce. Chinese hospitals are characterized by dense occupancy, intense workloads, and distinct architectural designs that differ markedly from those in other countries, necessitating region-specific investigations. Moreover, the influence of non-physical environmental factors on SBS, such as spatial layout, building orientation, landscape views, and greenery, has been largely overlooked.
This study aims to quantify the prevalence and risk factors of SBS among medical staff in Chinese hospitals, with a focus on both physical and non-physical environmental parameters, and to provide evidence-based recommendations for retrofitting hospital designs to enhance staff health and well-being. By addressing these gaps, this research offers a novel contribution to understanding SBS in an underexplored occupational and regional setting.
2. Materials and Methods
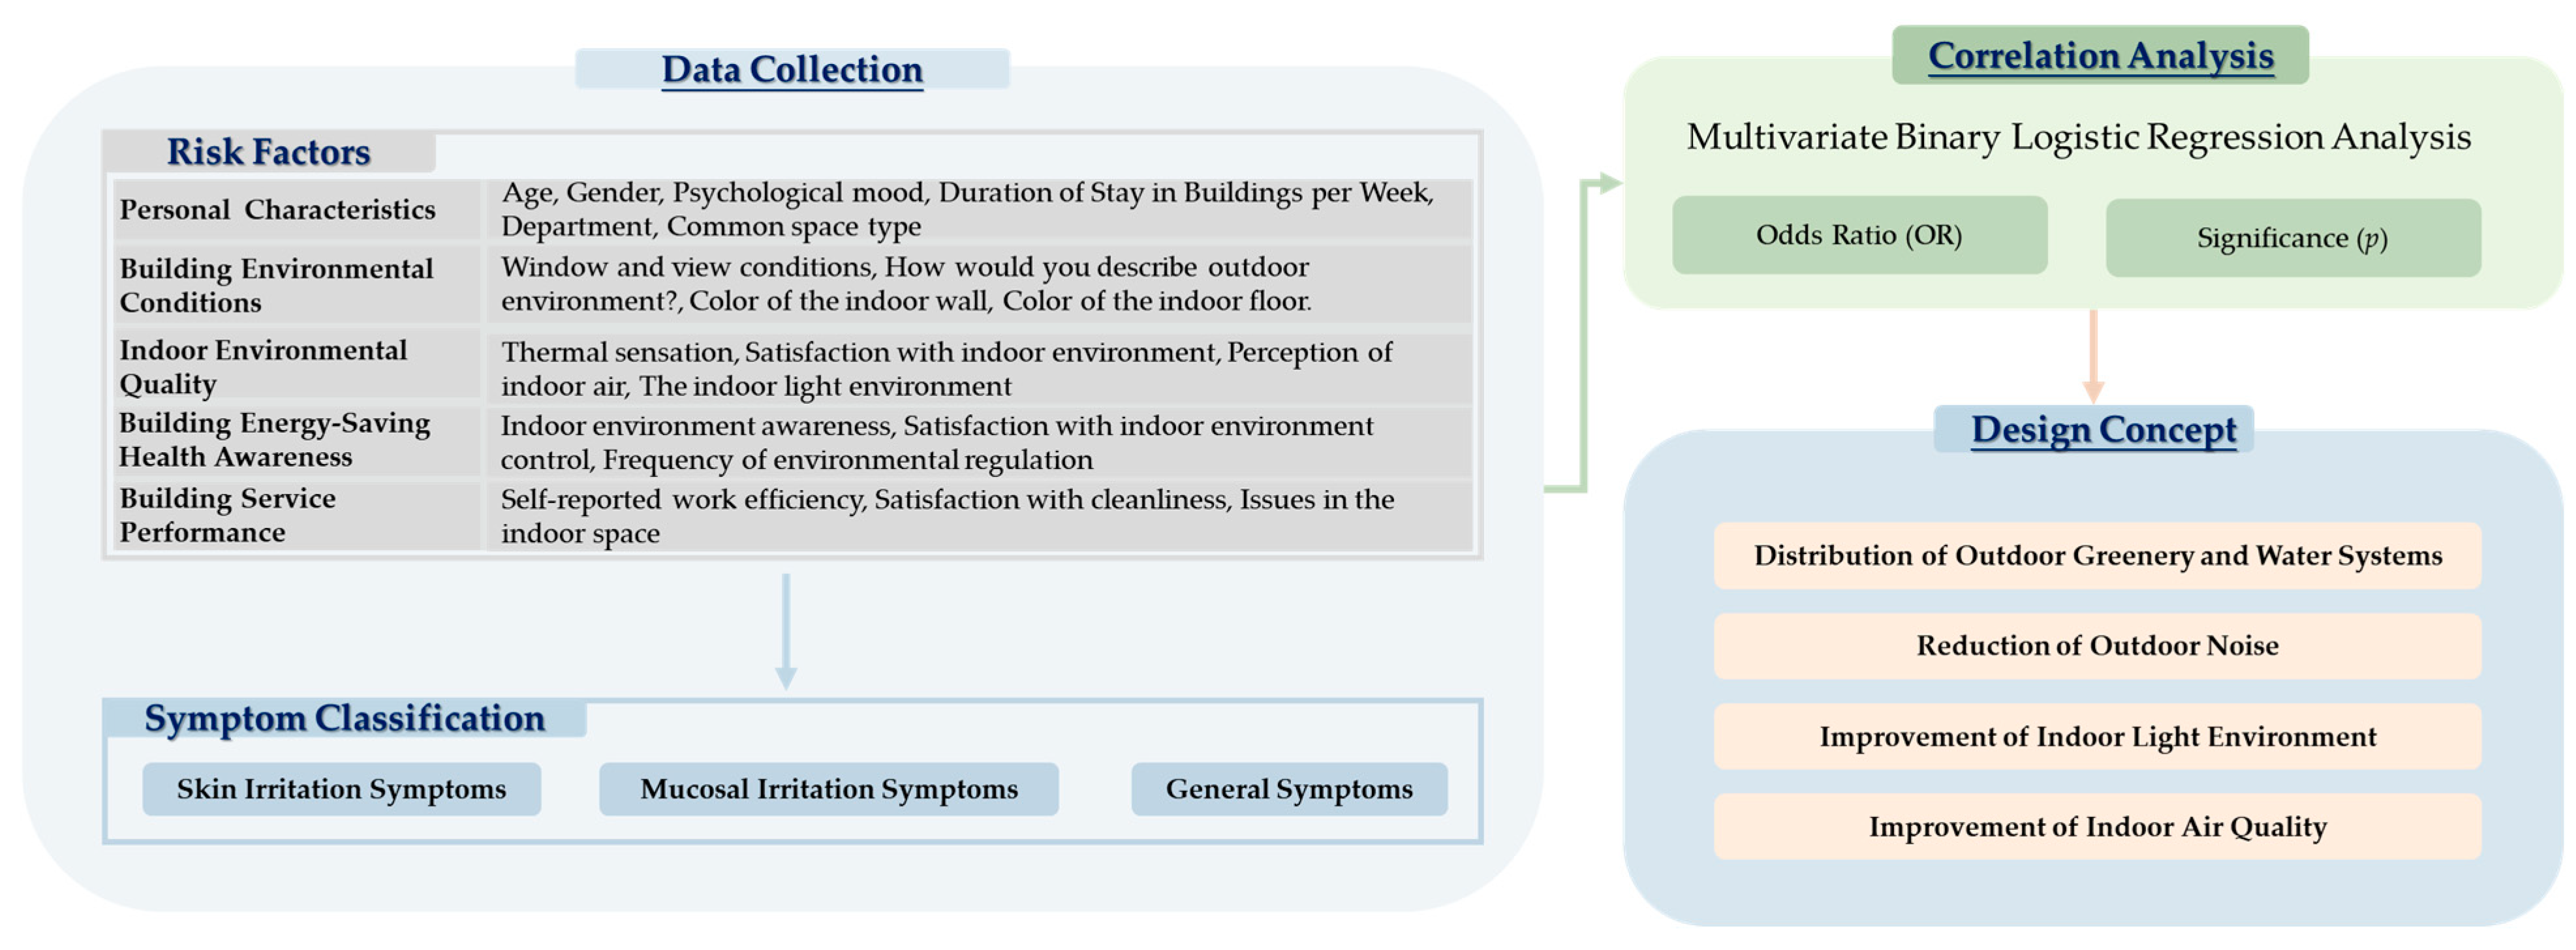
The research framework, depicted in Figure 1, integrates these environmental and occupational factors to assess their combined impact on SBS. By addressing these gaps, this research offers a novel contribution to understanding SBS in an underexplored occupational and regional setting of China.
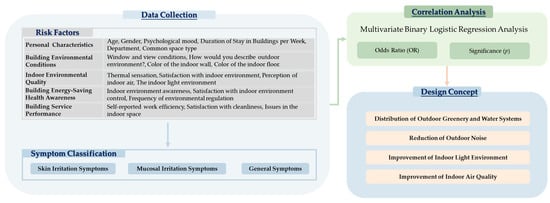
Figure 1.
Research framework diagram.
2.1. Study Locations, Participants, and Questionnaire Design
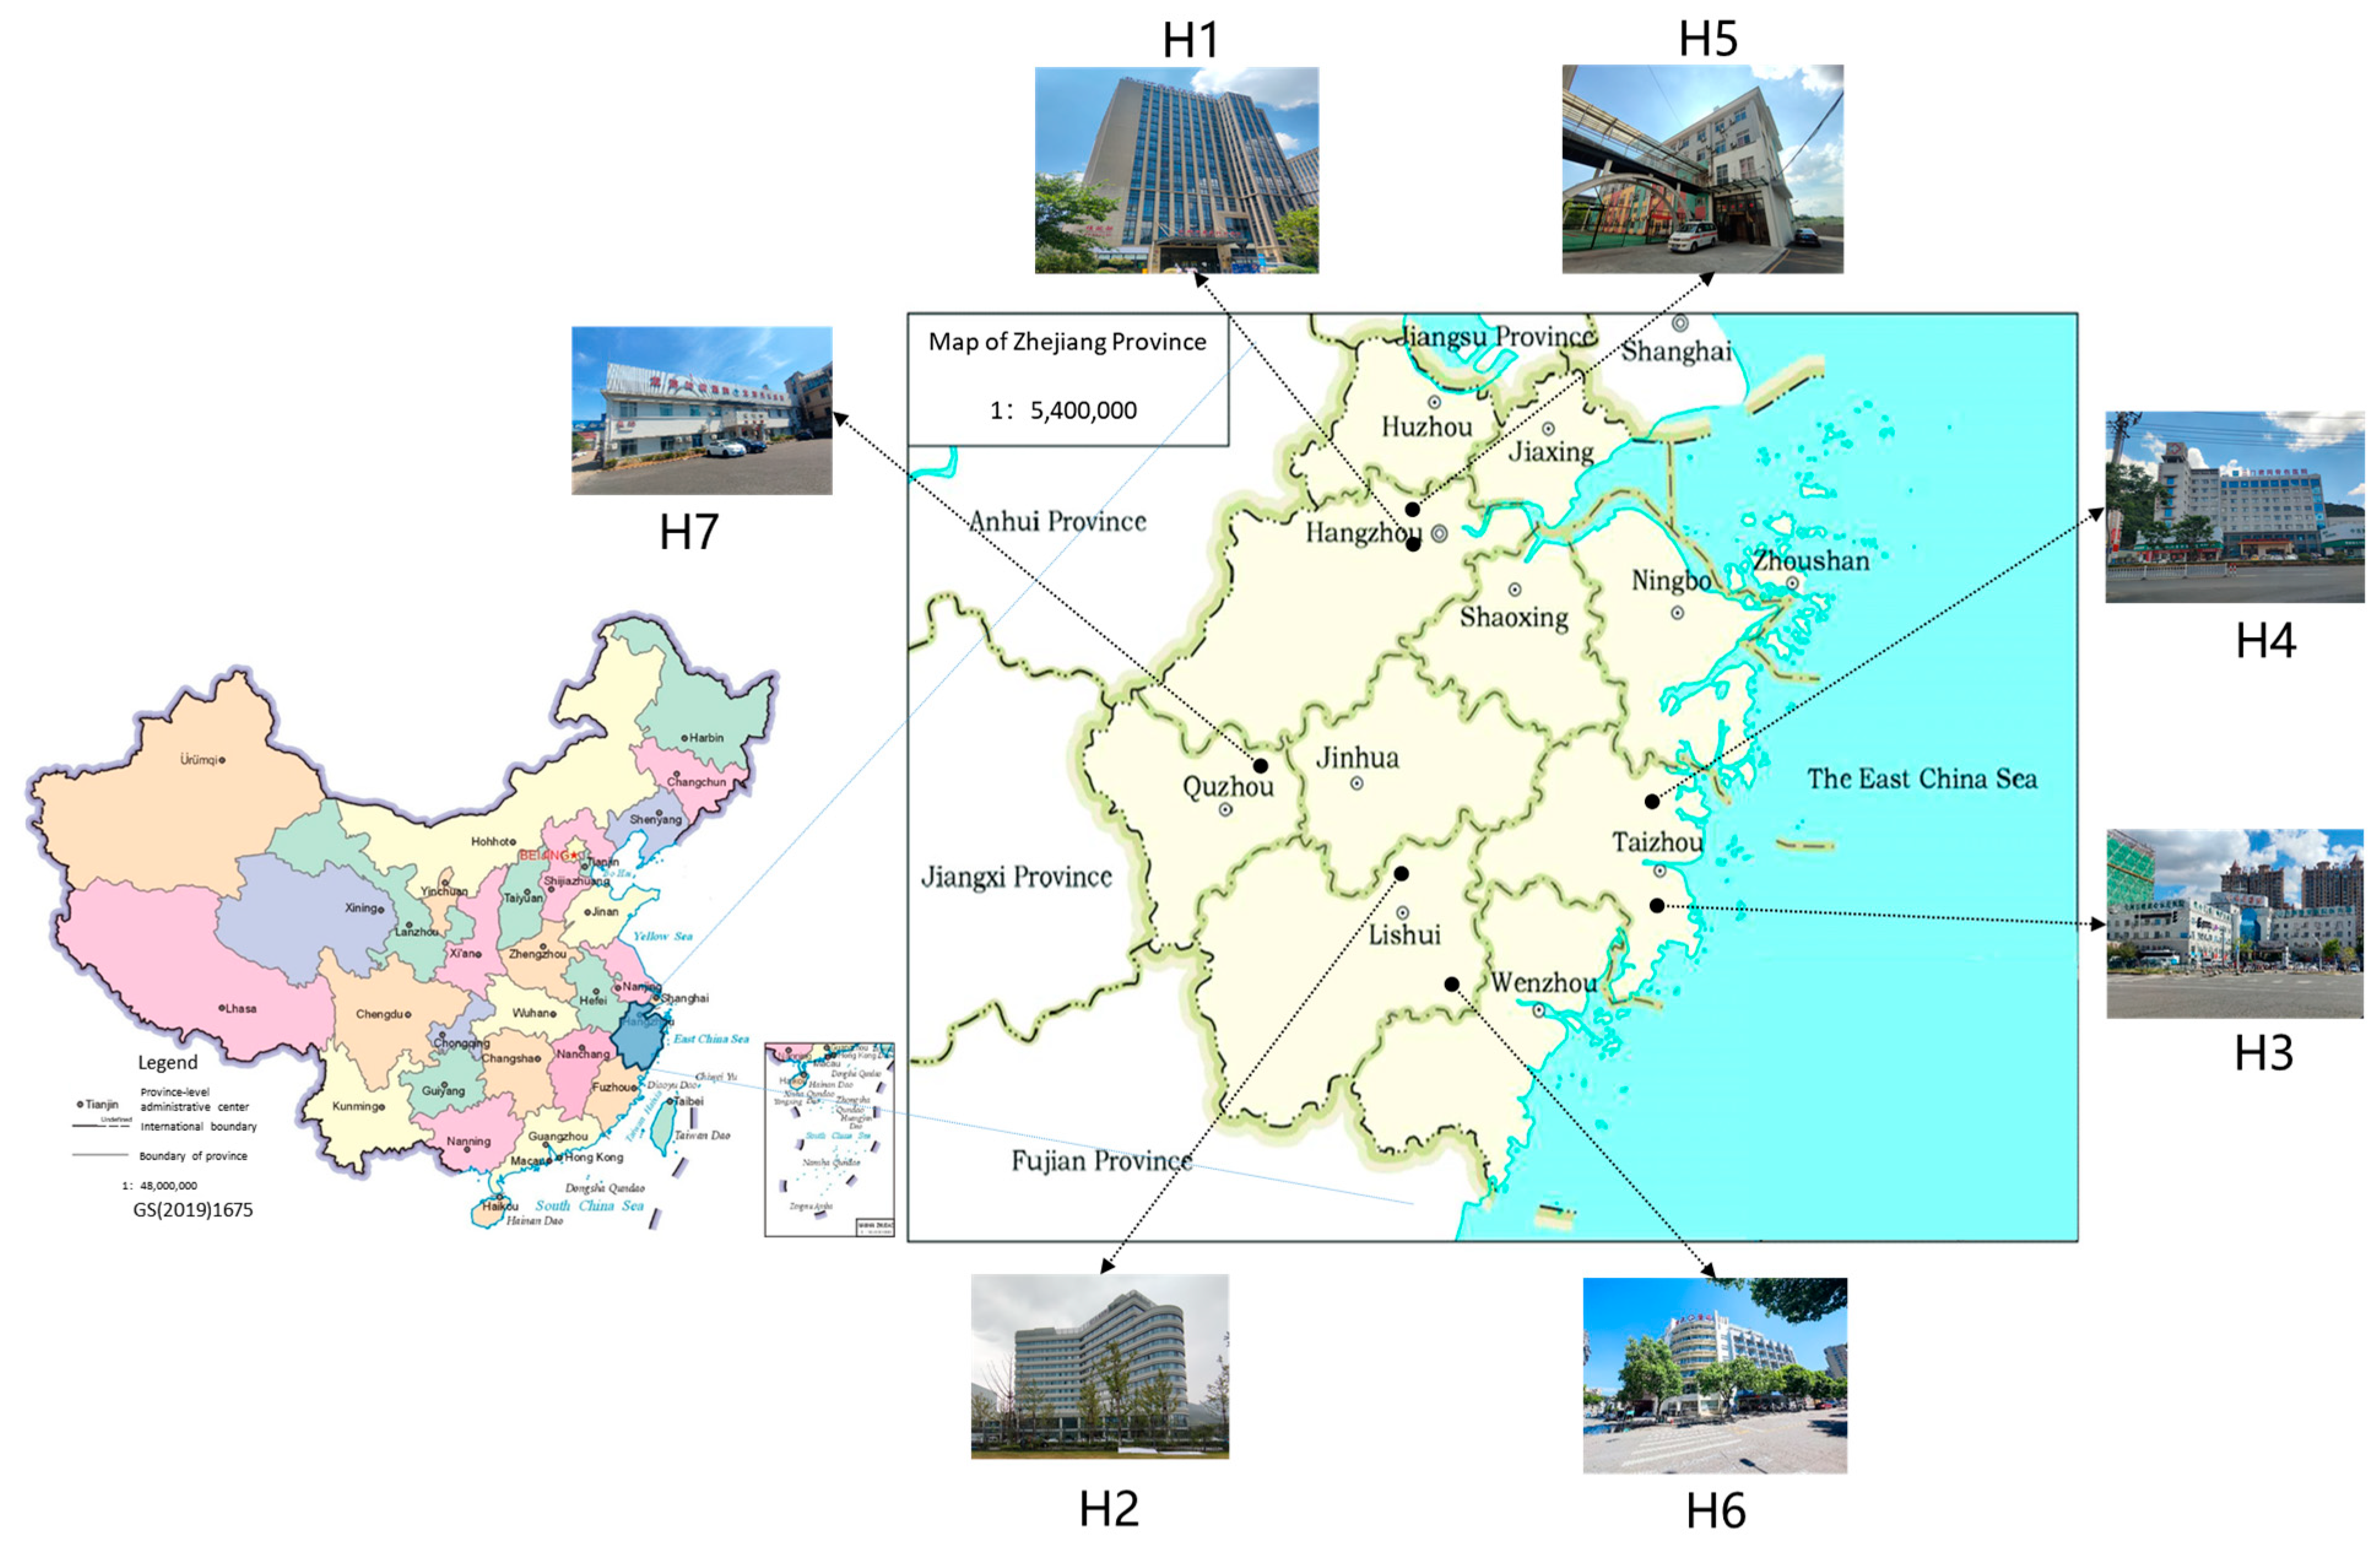
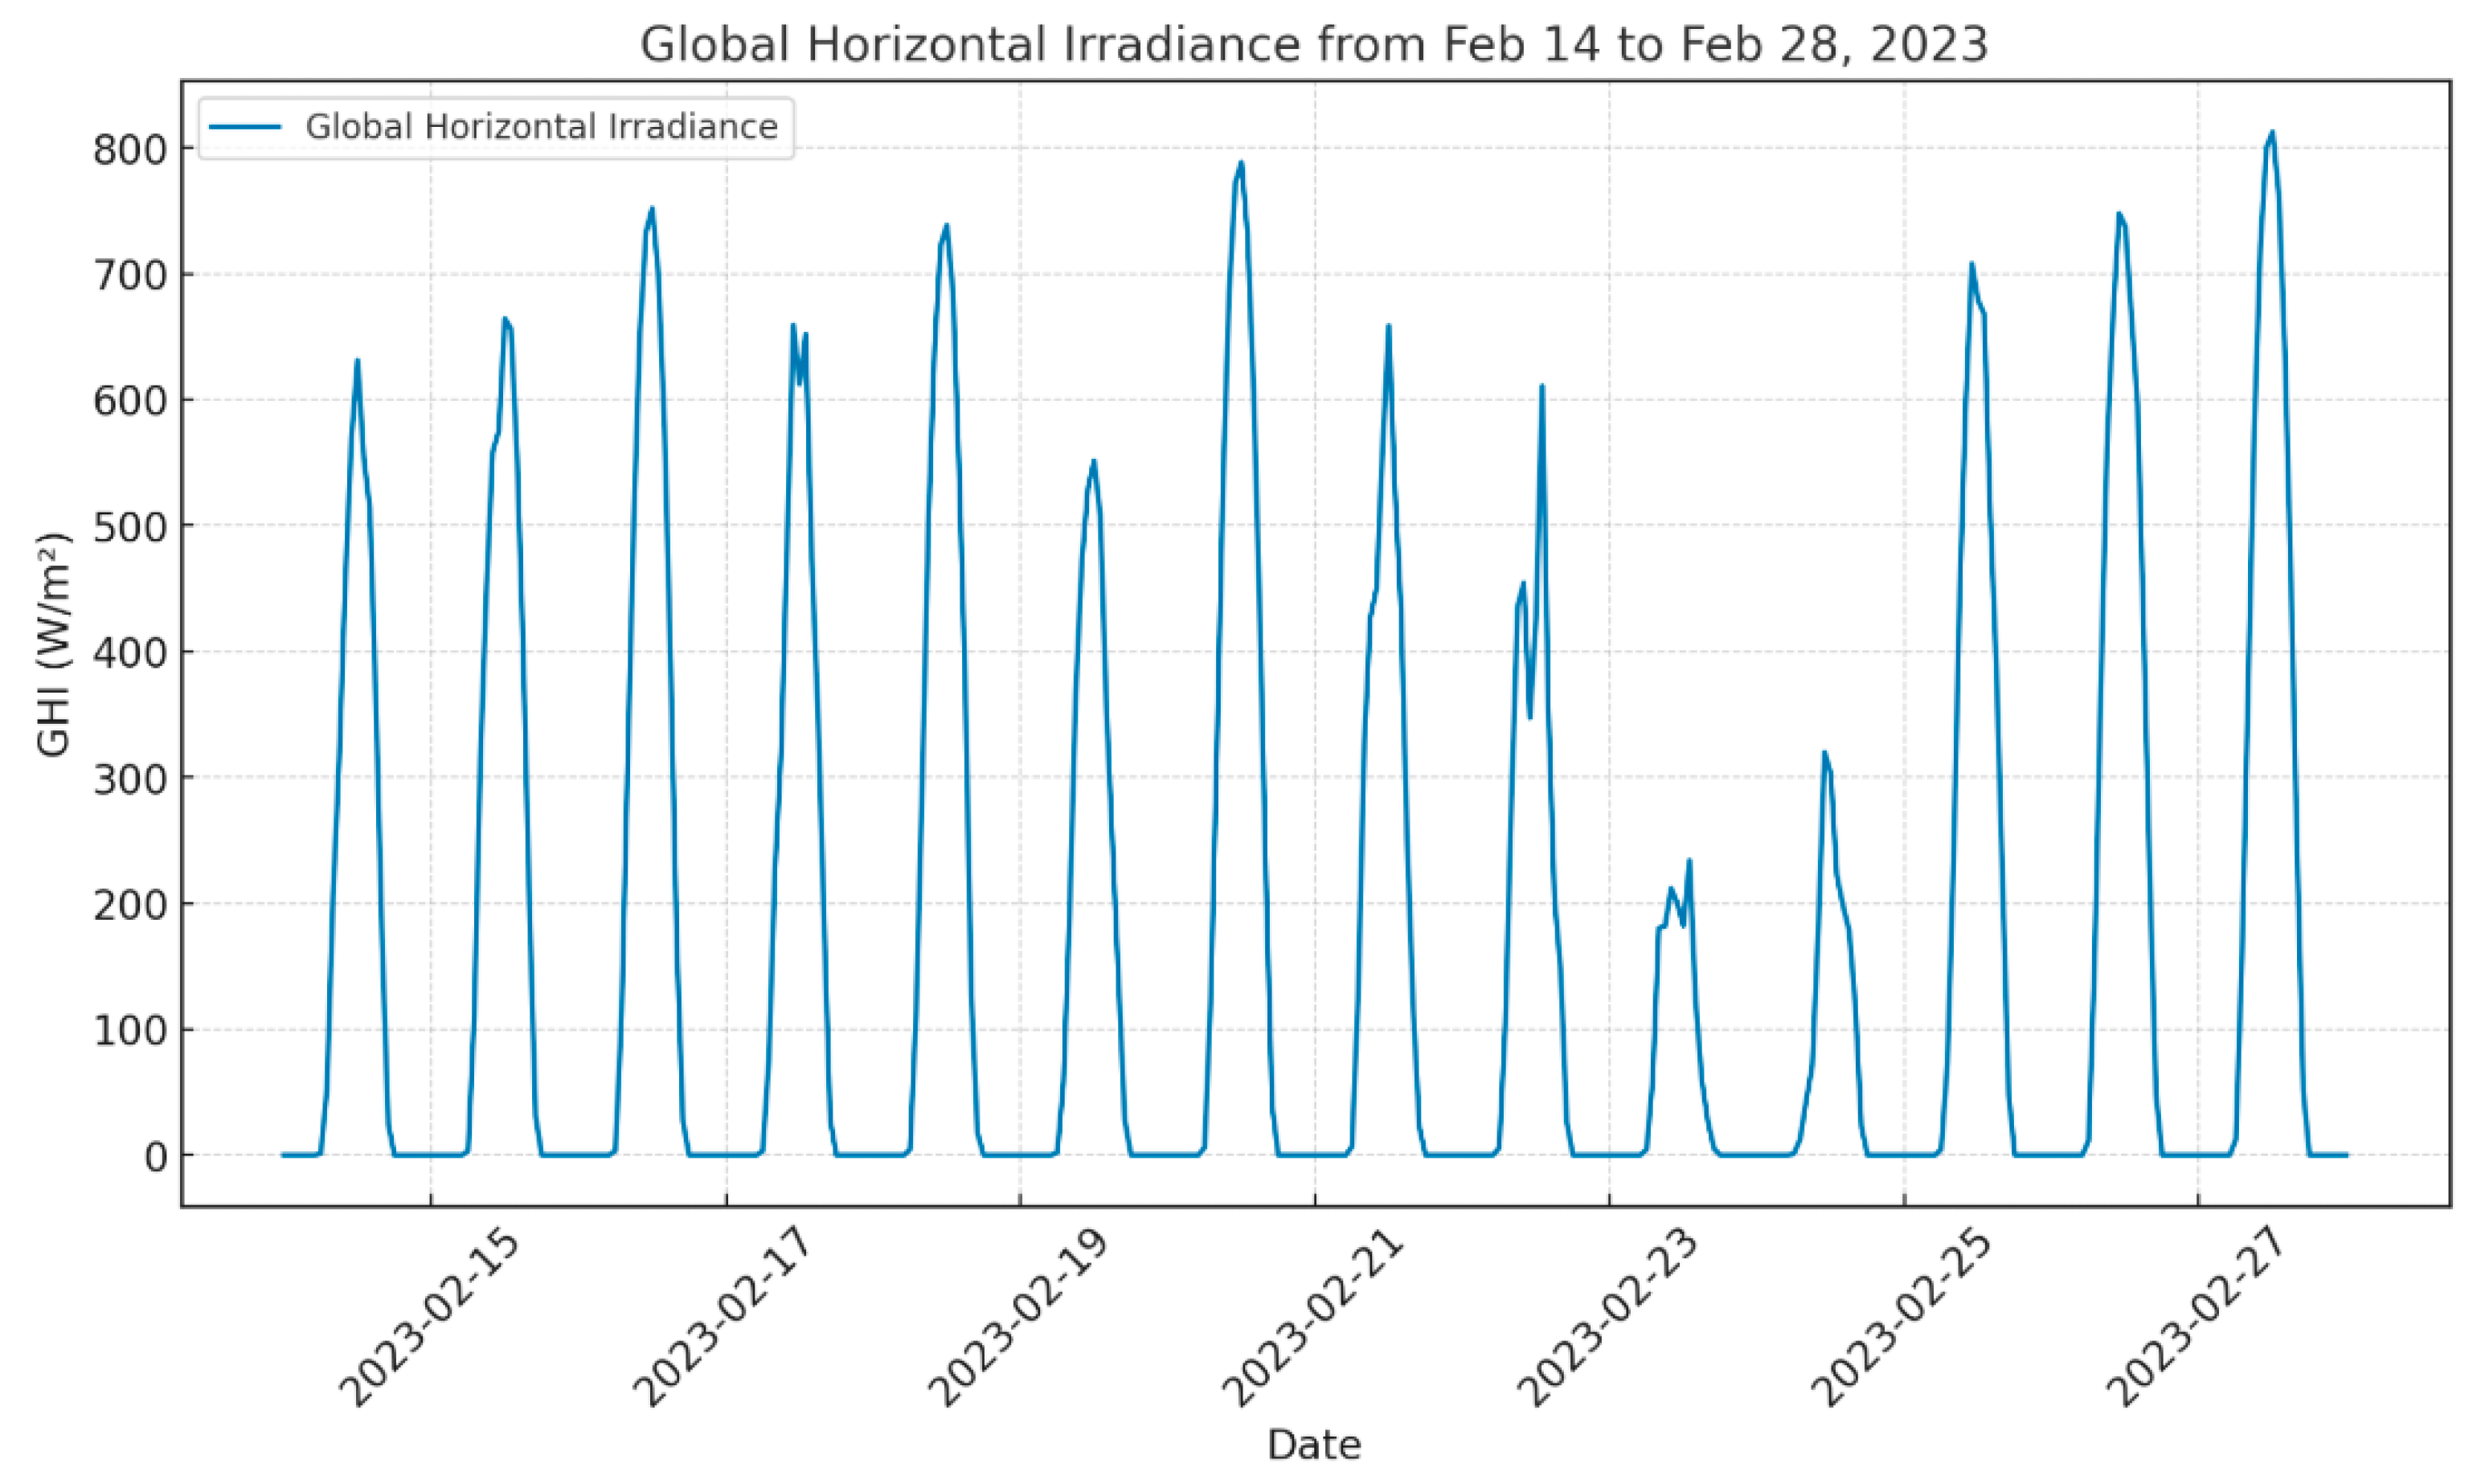
This study was approved by the Ethics Committee of Hangzhou Integrative Medicine Hospital. A survey was conducted in seven private hospitals in Zhejiang Province during winter (refer to Figure 2 for locations). A total of 615 research subjects participated, primarily comprising hospital staff. Data were collected using structured questionnaires. Table 1 presents the environmental conditions of the selected hospitals, including outdoor temperature, humidity, and PM2.5 levels during the questionnaire survey, while Table 2 provides their basic structural and operational details. The outdoor surface horizontal radiation of Hangzhou during the test were depicted in Figure 3.
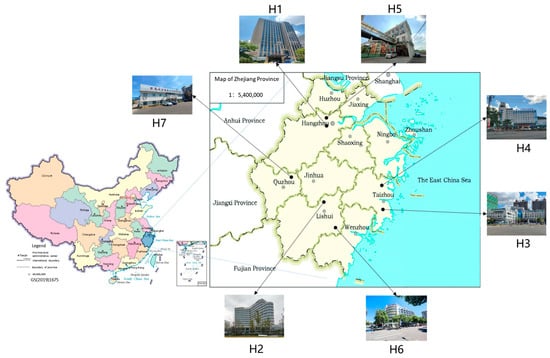
Figure 2.
The location of selected hospitals.

Table 1.
The outdoor environment during the test.
Table 2.
Basic information about the selected hospitals.
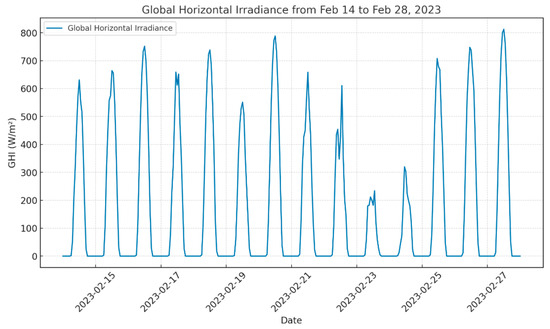
Figure 3.
The surface horizontal radiation of Hangzhou during the test.
The questionnaire was based on the internationally recognized SBS scale [7,34] and was adapted to the actual situation of domestic hospitals and the thinking habits of medical staff. The questionnaire was divided into six parts based on the existing studies [31,34]: personal characteristics of the respondents, such as age, gender, smoking status, job position, work environment, etc.; building environmental design, such as floor or wall color, presence of greenery in the workspace, outdoor noise, etc.; subjective indoor environmental quality, such as satisfaction with temperature, air quality, and indoor light environment; awareness of building energy efficiency and its impact on occupant health, such as satisfaction with the control of the indoor environment (convenience, intelligence, and effectiveness of temperature and lighting control); building service performance, such as satisfaction with the size and design of the space (relative positions of functional rooms, vertical and horizontal traffic), and satisfaction with the cleanliness of the indoor environment; SBS symptom status, such as eyes (dryness/itching/stinging/tearing), nose (dryness/itching/runny nose/nosebleed), throat (pain/dryness/mouth dryness), etc.
SBS was the primary outcome variable in this study, defined as the presence of at least one symptom related to hospital conditions on the day of the survey.
Respondents were asked whether they had experienced any of the following symptoms in the past winter season to assess SBS: general symptoms (dizziness/headache, inattention/errors, chest tightness/chest pain/shortness of breath, fatigue/sleepiness/lethargy, irritability/easy agitation/anxiety, nausea/appetite loss/digestive problems); mucosal irritation symptoms (eye dryness/itching/stinging/tearing, nose dryness/itching/runny nose/nosebleed, throat pain/dryness/mouth dryness, asthma/dry cough/bronchitis); skin symptoms (skin dampness/dryness/local itching). There are four options designed for each symptom (never, rarely, occasionally, often). For statistical convenience, symptoms marked as “never” and “rarely” were considered non-symptomatic, while “occasionally” and “often” were considered symptomatic. The satisfaction options are based on the Likert scale [35], divided into seven levels, representing: 1 = Very Dissatisfied, 2 = Dissatisfied, 3 = Somewhat Dissatisfied, 4 = Neutral, 5 = Somewhat Satisfied, 6 = Satisfied, 7 = Very Satisfied.
2.2. Statistical Analysis
The SPSS Statistics 29.0 software was utilized to perform contingency table chi-square tests and multivariate logistic regression analysis to investigate the relationships among questionnaire respondents’ characteristics, building environmental design, indoor environmental quality, building energy-saving health awareness, building service performance, and sick building syndrome (SBS). Multivariate logistic regression [36] is essentially an extension of binary logistic regression, designed to model the probability of the dependent variable occurring. The calculation formula is as follows:
where P represents the probability of SBS occurrence; β0 is the constant term; and the partial regression coefficients βj (where j = 1, 2, …, mj = 1, 2, …, mj) indicate the average change in the logit of (P) for a one-unit change in the (j)-th independent variable, holding all other independent variables constant.
The odds ratio (OR) [37] is defined as
where ORj represents the odds ratio for the j-th independent variable. It measures the change in the odds of SBS occurrence for a one-unit increase in Xj, with all other factors constant. When ORj = 1, it suggests that the factor Xj has no effect on the occurrence of the disease. When ORj > 1, it indicates that Xj is a risk factor. Conversely, when ORj < 1, it implies that Xj is a protective factor.
3. Results
3.1. Prevalence of Various SBS Symptoms
This study surveyed seven hospitals, collecting a total of 615 questionnaires. The prevalence of various SBS symptoms was summarized in Table 3. The prevalence rates for skin symptoms, mucosal symptoms, and general symptoms were 32.8%, 61%, and 71.1%. Regarding general symptoms, the most common included fatigue, sleepiness, and lethargy, with a total of 245 cases (39.8%); irritability, excitability, and anxiety affected 244 cases (39.7%), while dizziness and headaches were reported in 244 cases (39.7%). Additionally, 149 cases (24.2%) experienced nausea, lack of appetite, and indigestion. Inattention and proneness to errors were reported by 172 cases (28.0%), while chest tightness, chest pain, and shortness of breath were reported by 192 cases (31.2%). For mucosal symptoms, eye dryness, itching, stinging, and tearing occurred in 309 cases (50.2%). Nose dryness, itching, runny nose, and nosebleed affected 217 cases (35.3%); throat pain, dryness, and mouth dryness were reported by 267 cases (43.4%); Wheezing, dry cough, and bronchitis were observed in 167 cases (27.2%). Regarding skin symptoms, skin flushing, dryness, and localized itching were observed in 202 cases (32.8%). These findings indicate that general symptoms were the most prevalent, followed by mucosal symptoms, with skin symptoms being the least common among the surveyed population.
Table 3.
Prevalence of various SBS symptoms.
3.2. Relationship Between Medical Staff Background Information and SBS Symptoms
The background of the participants is detailed in Table 4. Among the respondents, 456 were female (74.3%) and 158 were male (25.7%). Regarding age distribution, 226 respondents (36.8%) were under 30 years old, while 353 respondents (57.3%) were aged between 30 and 50 years, with 203 in the 30–40 age group and 150 in the 41–50 age group. A total of 36 respondents (5.9%) were over 50 years old. Regarding their self-reported mood, more than half of the respondents (321, 52.2%) described their mood as “average”, while 237 (38.5%) reported a positive state ranging from “good” to “very good”. In terms of smoking habits, the vast majority of respondents (569, 92.5%) were non-smokers, with only a small minority (42, 6.8%) indicating that they had a smoking habit.
Table 4.
Correlation between basic information variables and SBS symptoms.
Nurses and doctors were the predominant medical professions, with 272 nurses (44.2%) and 182 doctors (29.6%). Nearly half of the respondents (307, 49.8%) had worked in the hospital building for over three years, and 419 (68.1%) spent more than 20 h per week in the hospital building; the most respondents were from the inpatient department, totaling 305 (49.6%); the nurse’s station was the most frequently visited space by respondents, with 153 (24.9%), followed by medical offices and others, accounting for 21.1% and 17.6%, respectively.
The results indicated that job satisfaction, work environment, and work duration are the most important psychological factors leading to the prevalence of SBS. There is a strong correlation between the time spent by respondents in the building and its impact on their health.
The analysis in Table 4 demonstrates that the psychological mood of individuals is closely related to the presence of SBS symptoms, with p-values for all three categories of symptoms being less than 0.05. The probability of experiencing skin symptoms is 3.092 times higher for those in a poor mood and 2.416 times higher for those in an average mood compared to those in a good mood. For mucosal irritation symptoms, the probabilities are 1.968 times and 2.817 times higher, respectively, while for general symptoms, they are 2.246 times and 1.935 times higher, respectively, relative to those in a good mood. These results suggest that poorer mood may increase the likelihood of SBS symptoms. Moreover, extended work duration, which may contribute to reduced social support and poorer mood, is significantly associated with SBS symptoms [9].
Gender also has a significant impact on the symptoms, with skin symptoms (p = 0.003) and general symptoms (p = 0.002) showing particularly strong associations. Compared to females, males have lower odds of experiencing these symptoms, with odds ratios (ORs) of 0.418 for skin symptoms and 0.406 for general symptoms, indicating that males are less likely to be affected.
Furthermore, the department in which one works has a significant impact on the incidence of mucosal irritation symptoms (p = 0.025). The OR values for outpatient, inpatient, and logistics management departments are all below 1 compared to other departments. Workplace spatial type also significantly impacts skin symptoms (p = 0.006), with ORs of 1.607 (wards), 4.626 (waiting rooms), 1.222 (registration areas), and 3.582 (operating rooms), suggesting that staff in these areas are more susceptible to skin symptoms, whereas those in other departments are more prone to mucosal irritation symptoms. Collectively, these findings highlight the critical role of psychological factors, gender, and workplace environment in the prevalence of SBS symptoms among medical staff.
3.3. Relationship Between Building Environmental Design and SBS Symptoms
The results presented in Table 5 highlight the significant impact of various environmental design factors on SBS symptoms. Specifically, the analysis focuses on the role of windows, outdoor views, noise levels, and indoor color schemes.
Table 5.
Correlation between building environmental conditions and SBS symptoms.
Of the 615 respondents, 521 (84.7%) reported that their workplaces had windows. Among those with windows, the majority had views of the ground, outdoor greenery or water systems, and the sky. However, 302 (49.1%) of the respondents considered the outdoor environment to be noisy. In the respondents’ workplaces, the absence of indoor greenery was notable, accounting for 44.7% of the responses. Wall colors were predominantly neutral colors (42.0%), followed by warm colors and cool tones.
The analysis reveals that windows with views of outdoor greenery or water systems significantly affect mucosal symptoms (p = 0.002) and general symptoms (p < 0.001), with respondents lacking such views being 1.862 times more likely to experience mucosal irritation symptoms.
Furthermore, outdoor noise significantly influences skin symptoms (p = 0.006) and mucosal symptoms (p = 0.007), with probabilities 1.685 times and 1.642 times higher, respectively, in noisy environments compared to quiet ones. Noise stands out as a key indoor environmental quality concern, consistent with data indicating increased SBS symptom prevalence in noisy settings.
Additionally, indoor floor color impacts mucosal irritation symptoms (p = 0.034), with cool-colored floors associated with an OR of 1.821 compared to neutral colors, while warm-colored floors have an OR near 1, indicating a higher likelihood of mucosal irritation with cool tones. These results underscore the importance of environmental design elements, such as window views, noise levels, and color schemes, in mitigating SBS symptoms.
3.4. Relationship Between Indoor Environmental Quality and SBS Symptoms
The results presented in Table 6 provide insights into the relationship between indoor environmental quality and SBS symptoms. The analysis examines various factors related to indoor air quality, lighting, and noise levels.
Table 6.
Correlation between indoor environmental quality variables and SBS symptoms.
In terms of indoor air quality, while 268 respondents (43.6%) reported no noticeable odor, over half of the participants perceived varying degrees of odor in their indoor environments. The most common response regarding indoor air quality satisfaction was a neutral attitude, with 245 respondents (39.8%) indicating neither satisfaction nor dissatisfaction. A total of 213 respondents (34.6%) reported being “somewhat satisfied” or “satisfied” with the indoor air quality.
Regarding the sensation of drafts in the room, most respondents reported no draft or only a slight draft, with 292 people (47.5%) indicating no draft and 264 people (42.9%) reporting a slight draft.
In terms of room brightness, whether during the day (lights off) or during the day (lights on), most respondents considered the brightness to be moderate. For room brightness during the day (lights off), 117 people (19.0%) reported it as very dark, and 264 respondents (42.9%) reported it as somewhat dark. For room brightness during the day (lights on), the majority, 448 respondents (72.9%), reported it as moderate; regarding indoor light environment and sound environment satisfaction, the neutral attitude was also the most common, with 270 respondents (43.9%) and 266 respondents (43.3%), respectively, and a relatively high proportion also reported being “somewhat satisfied” or “satisfied”.
In terms of noise sources, buildings may be exposed to various noise sources, both internal and external. Internal sources include office equipment, footsteps, conversations, and other human activities. External sources may include traffic, construction, and other environmental noises. In this study, surrounding patients (talking, making phone calls, etc.) and external traffic were the main sources of noise, with 195 respondents (31.7%) and 113 respondents (18.4%), respectively; in terms of overall indoor environment satisfaction, 274 respondents (44.6%) had a neutral attitude, and a combined total of 115 and 106 respondents (35.9%) reported being “somewhat satisfied” or “satisfied”.
The analysis indicates that the perception of the indoor air has a very significant impact on mucosal symptoms (p < 0.001) and skin symptoms (p < 0.001). The probability of suffering from mucosal symptoms in dry and moderate humidity conditions is 0.60 times and 0.43 times that in damp conditions, respectively, while the probability of skin symptoms is 0.49 times and 0.25 times that in damp conditions. The probability of suffering from skin symptoms and mucosal symptoms increases with higher humidity.
Furthermore, the indoor light environment is closely related to mucosal symptoms (p = 0.003) and skin symptoms (p = 0.003).
3.5. Relationship Between Building Energy-Saving Health Awareness and SBS Symptoms (Concern for Indoor Environment)
The results presented in Table 7 highlight the relationship between building energy-saving health awareness and sick building syndrome (SBS) symptoms, particularly focusing on the concern for the indoor environment.
Table 7.
Correlation between building energy-saving awareness and SBS symptoms.
Awareness of environmental parameters: Most respondents (359, 58.4%) expressed a willingness to understand the objective parameters of their surrounding environment. However, a significant portion were indifferent (194, 3.15%), while a smaller group (62, 10.1%) were unwilling to engage with this information.
Satisfaction with indoor environment control: Regarding satisfaction with the control of the indoor environment (convenience, intelligence, and effectiveness of temperature and lighting control), the majority of respondents (274, 45.7%) held a neutral attitude. However, more respondents were satisfied (256, 42.8%) than dissatisfied (69, 11.5%).
Convenience of controlling the indoor environment: The analysis revealed that poor control effectiveness and inconvenience in adjusting the indoor environment (e.g., air conditioning temperature, opening/closing windows, drawing curtains) were related to SBS symptoms.
The analysis demonstrates that awareness of environmental parameters, satisfaction with indoor environment control (convenience, intelligence, and effectiveness of temperature and lighting control), and the ease of adjusting the indoor environment (e.g., temperature and lighting) are significantly associated with specific SBS symptoms.
Willingness to understand environmental parameters significantly affects general symptoms (p = 0.032), with those unwilling to engage showing a 1.437 times higher probability of experiencing general symptoms compared to those who are willing. This suggests that lower awareness may elevate the risk of general symptoms.
Satisfaction with indoor environment control significantly influences mucosal irritation symptoms (p ≤ 0.001) and general symptoms (p = 0.012). Dissatisfied respondents have a 2.881 times higher probability of mucosal irritation symptoms and a 2.253 times higher probability of general symptoms compared to satisfied respondents, while those with a neutral attitude show probabilities 2.411 and 1.768 times higher, respectively.
3.6. Relationship Between Building Service Performance and SBS Symptoms
As shown in Table 8, the analysis explores the relationship between building service performance and SBS symptoms, focusing on various aspects of the Building Service Performance and their impact on occupants’ SBS Symptoms.
Table 8.
Correlation between building service performance and SBS symptoms.
Regarding work efficiency and productivity under the overall environment of the building, 277 respondents (45.0%) held a neutral attitude, while 267 respondents (43.4%) reported being satisfied.
The respondents’ satisfaction with the size and design of the building space and its operation and maintenance was low, with neutral feedback accounting for nearly half. In contrast, 54.1% of the respondents expressed satisfaction to a high degree with the cleanliness of the building. According to the feedback, the most common indoor issue was decoration damage, accounting for 377 (61.3%), followed by humidity issues, accounting for 167 (27.2%). These results indicate that improving the environment around personnel is very important for effectively enhancing the perceived work efficiency of staff.
The analysis indicates that satisfaction with work efficiency and productivity in the building environment significantly affects skin symptoms (p = 0.011), with dissatisfied and neutral respondents showing probabilities 4.68 and 2.84 times higher, respectively, than satisfied respondents. Higher satisfaction is thus associated with a reduced likelihood of skin symptoms.
Satisfaction with the size and design of the space significantly influences mucosal symptoms (p = 0.03), with probabilities for dissatisfied and neutral respondents 1.57 and 2.53 times higher, respectively, than for satisfied respondents, suggesting a link between greater satisfaction and lower symptom prevalence.
Satisfaction with indoor cleanliness is significantly associated with all SBS symptoms. For skin symptoms (p = 0.001), dissatisfied and neutral respondents have probabilities 3.06 and 1.31 times higher, respectively, than satisfied respondents; for mucosal symptoms (p = 0.001), 3.6 and 1.33 times higher; and for general symptoms (p = 0.04), 2.42 and 1.51 times higher. Greater satisfaction with cleanliness thus correlates with reduced symptom likelihood.
4. Discussions
4.1. Prevalence of Various SBS Symptoms in Different Areas
The present study revealed a high prevalence of sick building syndrome (SBS) symptoms among medical staff in seven private hospitals in eastern coastal China, with rates of 32.8% for skin symptoms, 61.0% for mucosal symptoms, and 71.1% for general symptoms. Table 9 summarizes the prevalence rates of SBS from domestic and international studies, providing a comparative backdrop for these findings. These figures are notably higher than those reported in some international studies but align with findings from other hospital-based research in regions with similar environmental or occupational challenges. For instance, Babaoglu et al. (2019) [19] reported prevalence rates of 23.0–63.7% among Turkish hospital staff, while Surawat-tanasa-kul et al. [38] found a 10.7–25.3% prevalence among office workers at Thailand hospitals. Comparatively, residential studies, such as Wong et al. (2009) [8] in Hong Kong (34–72%) and Sun et al. [24] in China (40–73.4%), also indicate elevated SBS prevalence.
The predominance of general symptoms (71.1%), such as fatigue (39.8%), irritability (39.7%), and dizziness (39.7%). Mucosal symptoms, particularly eye dryness (50.2%) and throat dryness (43.4%), were also highly prevalent, likely exacerbated by poor indoor air quality and low humidity—factors consistently identified as SBS contributors [12,14,19,39]. Skin symptoms (32.8%), though less frequent, align with findings from the study in South Korean shopping malls [20] and another study in Gondar town, northwest Ethiopia [10].
Regarding specific functional spaces, other studies on the variable of frequently occupied space types have also shown the prevalence of SBS in hospital wards. The total prevalence of SBS among hospital staff was 65%, with the highest rate in the emergency ward (17.9%), followed by the internal ward (15.9%), ICU (12.8%), and CCU (11.8%) [40]. This indicates a significant relationship between SBS and cooperation among colleagues in work and infection control, which is like our conclusion.
The variation in symptom prevalence across studies underscores the role of regional climate, building design, and occupational factors. Our study emphasizes the unique susceptibility of hospital medical staff to SBS during winter in Zhejiang, China.
4.2. Risk Factors and Their Implications
Table 10 provides an overview of the risk factors associated with sick building syndrome (SBS), categorizing their characteristics and mechanisms of influence as identified in this and prior studies.
4.2.1. Individual and Psychological Factors
Gender emerged as a significant predictor of SBS symptoms, with females exhibiting higher odds of experiencing skin symptoms (OR = 0.418 for males vs. females, p = 0.003) and general symptoms (OR = 0.406, p = 0.002). This aligns with prior research [16,18,19,20,41,42,43]. We speculate that females may be more sensitive to the factors associated with SBS symptoms or more likely to report these symptoms. Mood also played a critical role, with individuals reporting poor or average mood showing significantly higher odds of all SBS symptom categories compared to those in a good mood (e.g., OR = 3.092 for skin symptoms in poor mood, p < 0.001). This finding corroborates the influence of psychological factors, such as stress and low social support, on SBS prevalence [15].
4.2.2. Environmental Design and Indoor Quality
Building environmental design factors, such as the visibility of outdoor greenery or water systems, significantly reduced the likelihood of mucosal (OR = 1.862, p = 0.002) and general symptoms (OR = 2.053, p < 0.001) when absent. This supports Dolling et al.’s [44] observation that natural views exert a positive psychological and physiological effect, potentially mitigating SBS through improved air quality and stress reduction. Outdoor noise, reported as a concern by 49.1% of respondents, increased the odds of skin (OR = 1.685, p = 0.006) and mucosal symptoms (OR = 1.642, p = 0.007). These findings align with a cross-sectional study in Slovenian hospitals [45], which identified noise as one of the key IEQ disruptor. Indoor air quality perceptions, particularly dryness (OR = 0.49 for skin, p < 0.001; OR = 0.60 for mucosal, p < 0.001), and lighting conditions further underscored the critical role of ventilation [46,47] and illumination in SBS etiology, echoing findings by Hoang et al. [48]
4.2.3. Control over Environment and Building Services
User control over the indoor environment emerged as a protective factor. Dissatisfaction with indoor environment control of this building increased the odds of mucosal (OR = 2.881, p < 0.001) and general symptoms (OR = 2.253, p = 0.012), while bad control effectiveness reduced mucosal symptom likelihood. This aligns with Rostron’s study [49], which noted that adjustable environments reduce absenteeism and SBS risk. Similarly, satisfaction with building service performance, particularly cleanliness, was inversely associated with all SBS symptom types (e.g., OR = 3.06 for skin in dissatisfied vs. satisfied, p = 0.001), reinforcing the importance of maintenance in mitigating biological and chemical triggers like mold and dust [48,50].
4.2.4. Occupational and Spatial Influences
The study identified department-specific risks, with staff in wards, waiting rooms, and operating rooms showing elevated odds of skin (OR = 1.607–4.626, p = 0.006), possibly due to prolonged exposure to irritants or poor ventilation. Mucosal symptoms were less prevalent in outpatient and inpatient departments (OR < 1, p = 0.025), speculating that spatial design and airflow differences modulate SBS risk. Despite these findings, research exploring how spatial environments differentially affect SBS remains limited. Notably, a strong link emerged between nasal symptoms and hospital ward type, with healthcare workers in the pediatric ward [45] reporting the majority of such complaints.
Table 9.
Summary of domestic and international research on sick building syndrome.
Table 9.
Summary of domestic and international research on sick building syndrome.
| Researchers | Year | Region | Building Type | Samples | Prevalence Rate (%) |
|---|---|---|---|---|---|
| Wong et al. [8] | 2009 | Hong Kong, China | Residential | 881 | 34–72 (GS:34 MS:65 SS:52–59) |
| Kielb et al. [9] | 2014 | United States | School | 501 | 0.8–16.8 (GS:15 MS:16.8 SS:14.8) |
| Shan et al. [21] | 2016 | Singapore | School | 39 | Unknown |
| Belachew et al. [10] | 2018 | Ethiopia | Residential | 3405 | 21.7 (GS:54 MS:64 SS:10) |
| Lu et al. [15] | 2018 | Taiwan, China | Office | 389 | 2.1–26.2 (GS:26.2 MS:39.1 SS:2.1) |
| Nakayama et al. [11] | 2019 | Japan | Residential | 1500 | 20.7–31.8 (GS:8 MS:7.3–13.6 SS:Unknown) |
| Kim et al. [20] | 2019 | South Korea | Shopping mall | 314 | 43.6–65.6 (GS:64.7 MS:65.6 SS:43.6) |
| Sun et al. [24] | 2019 | China | Residential | 32 | 40–73.4 (GS:73.4 MS:66.7 SS:22.5) |
| Huo et al. [12] | 2020 | China | Residential | 7865 | 9–14 (GS:14 MS:11 SS:9) |
| Mentese et al. [13] | 2020 | Turkey | Residential | 121 | 32–72 |
| Dhungana and Chalise [22] | 2020 | Nepal | Bank | 234 | 8.1–47.6 (GS:47.6 MS:11.9 SS:8.1) |
| Babaoglu et al. [19] | 2020 | Turkey | Hospital | 204 | 23.0–63.7 (GS:47.6 MS:36.3 SS:63.7) |
| Baloch et al. [50] | 2020 | Europe | School | 5175 | 3.12–11.77 (GS:11.77 MS:18.71 SS:5.09) |
| Hou et al. [14] | 2021 | China | Residential | 165 | 21–95 (GS:78.5 MS:65.8 SS:63.2) |
| Zuo et al. [23] | 2021 | China | Experimental cabin | 24 | Unknown |
| Sarkhosh et al. [16] | 2021 | Iran | Office | 154 | 70.1 (GS:51.89 MS:20.33 SS:13.55) |
| Fu et al. [18] | 2021 | Malaysia | School | 308 | 51 (GS:42.6 MS:36.7 SS:12) |
| Sayan and Dülger [17] | 2021 | Turkey | Hospital | 890 | 23–40 (GS:40 MS:27.6 SS:26) |
| Akova et al. [51] | 2022 | Turkey | Hospital | 300 | 64.7–74.1 |
| Fan and Ding [52] | 2022 | China | Multi-type | 29,785 | 9–29 |
| Surawat-tanasa-kul [38] | 2022 | Thailand | Hospital | 290 | 10.7–25.3 (GS:25.3 MS:10.7 SS:19.1) |
| Shim et al. [43] | 2023 | South Korea | Shopping mall | 128 | 16.4–43.8 (GS:43.8 MS:28.9 SS:16.4) |
| Isman et al. [53] | 2024 | Malaysia | Food outlets | 107 | 60.5–66.7 |
Notes: general symptoms (GS), mucosal symptoms (MS), skin symptoms (SS).
4.3. Limitations and Future Directions
This study provides valuable insights into SBS among Chinese medical staff but is limited to winter conditions in a specific coastal region. Given the significant climatic variations across seasons in eastern China, future research should explore seasonal differences to assess how temperature, humidity, and ventilation needs fluctuate. Longitudinal studies could further clarify causality between environmental factors and SBS symptoms, addressing the cross-sectional nature of this analysis. Additionally, incorporating objective IEQ measurements (e.g., CO2 levels, PM2.5 concentrations) alongside self-reported data would strengthen the evidence base. Expanding the sample to include public hospitals and diverse geographic areas could enhance generalizability, while investigating the efficacy of specific interventions (e.g., greenery installation, noise barriers) offers a pathway to practical solutions. We also acknowledge other potential factors (e.g., biological and chemical agents) and justify their exclusion due to scope and measurement constraints, with a note for future research. For example, chronic diseases should also be considered as a potential confounder in SBS symptom evaluation.
Table 10.
Risk factors of sick building syndrome.
Table 10.
Risk factors of sick building syndrome.
| Risk Factors | Characterization Parameters | Mechanism of Influence | |
|---|---|---|---|
| Indoor environmental parameters (physical) | Thermal environment | Air temperature | High temperature and humidity can easily cause discomfort [22,23]. The occurrence of SBS is positively correlated with temperature [52]. Indoor air humidity is the main influencing factor for the occurrence of mucosal irritation symptoms (p < 0.001), so improving indoor air quality can effectively reduce the probability of mucosal irritation symptoms (this study). |
| Relative humidity | When relative humidity is high, the likelihood of mucosal and skin SBS symptoms in residents is lower [14]. | ||
| Air quality | CO2 concentration, ventilation rate | Higher CO2 concentration is significantly associated with a higher percentage of stuffy feelings [14]. Lower ventilation rates increase the probability of mucosal symptoms [24]. Poor air quality can cause SBS [54]. | |
| Particulate matter concentration, dust | SBS in hospitals is related to PM1 and smoking [19]. High concentrations of PM2.5 are associated with a higher incidence of asthma [25]. | ||
| Light environment | Illuminance, color temperature | Dynamic lighting consistent with the natural light cycle can alleviate anger [55]. The occurrence of eye discomfort is related to the interaction between air quality and color temperature [56]. | |
| Acoustic environment | Noise level | Noise is the most important factor affecting indoor environmental quality [8]. Indoor air humidity is the main influencing factor for the occurrence of mucosal irritation symptoms (p < 0.001), so improving indoor air quality can effectively reduce the probability of mucosal irritation symptoms. (this study) | |
| Indoor environmental parameters (non-physical) | Cleaning frequency, building materials, building orientation, building layout, etc. | Green plants have an indirect, unconscious psychological effect on work efficiency, health, and stress [26]. Having windows with a view of outdoor greenery is the main influencing factor for general symptoms (p < 0.001) and mucosal symptoms (p = 0.002). Enhanced control over the indoor environment—such as adjustable temperature and lighting, lowering the odds of mucosal (p < 0.001) and general symptoms (p = 0.012). Satisfaction with building service performance, particularly work efficiency (p = 0.001 for skin) and cleanliness (p = 0.001 for skin, p = 0.001 for mucosal, p = 0.04 for general), also correlated with reduced SBS prevalence(this study). | |
| Biological factors | Mold, dust mites, animal dander and excrement, pollen, viruses, fungi | Higher relative humidity is associated with a higher perception of moldy [14]. Condensation, dampness and moldy odors are significantly related to SBS [11]. Aspergillus versicolor and ergosterol may be risk factors for SBS [27]. | |
| Chemical factors | Formaldehyde, acetaldehyde, volatile organic compounds | High levels of acetaldehyde and volatile organic compounds are associated with a higher incidence of asthma [25]. | |
| Psychological factors | Satisfaction, stress | Psychological factors are the most important factors affecting SBS [16]. Work stress is related to general symptoms [22]. Among them, the current mood is the main influencing factor (p < 0.001), so improving one’s own mood is conducive to reducing the occurrence of SBS symptoms. Secondly, for work-related psychosocial factors, high work pressure, working more than 10 h a day, and staff with greater control are positively correlated with lower respiratory symptoms (this study). | |
| Individual factors | Gender, age, region, education level, pre-existing diseases | Age is significantly related to general symptoms [22]. Females exhibit SBS symptoms at a rate 1.12 to 1.31 times higher than males [57]. Females are more susceptible, with an approximate ratio of 1:0.4 (this study). |
5. Conclusions
This study explored the prevalence and risk factors of sick building syndrome (SBS) among 615 medical staff across seven private hospitals in Zhejiang Province, China, during the winter season. The aim was to develop comprehensive, multifactorial strategies that integrate both psychosocial and physical measures to effectively prevent the occurrence of SBS symptoms. The findings revealed that the prevalence rates for skin symptoms, mucosal symptoms, and general symptoms were 32.8%, 61%, and 71.1%, respectively. Among individual and occupational factors, gender, mood, department type, and duration of time spent in the building significantly impacted symptom occurrence. Notably, poor or average mood emerged as a primary driver, substantially elevating the odds of experiencing SBS symptoms, while females showed higher susceptibility to skin and general symptoms compared to males. Department-specific risks were evident, with staff in wards, waiting rooms, and operating theaters facing increased odds of skin, likely due to prolonged irritant exposure or inadequate ventilation.
Building environmental design also played a pivotal role. Access to windows with views of outdoor greenery significantly reduced the likelihood of general and mucosal symptoms (p = 0.002), while noisy outdoor environments heightened the risk of skin (p = 0.006) and mucosal symptoms (p = 0.007). Indoor environmental quality factors, including air humidity and lighting, further influenced outcomes, with poor air quality strongly linked to mucosal irritation. Enhanced satisfaction with control of the indoor environment—such as adjustable temperature and lighting—served as a protective factor, lowering the odds of mucosal (p < 0.001) and general symptoms (p = 0.012). Satisfaction with building service performance, particularly work efficiency (p = 0.001 for skin) and cleanliness (p = 0.001 for skin, p = 0.001 for mucosal, p = 0.04 for general), also correlated with reduced SBS prevalence.
These findings underscore the interplay of modifiable environmental and psychological factors in SBS occurrence, offering actionable strategies for hospital management. Enhancing visibility of greenery, implementing soundproofing measures, improving ventilation systems, and empowering staff with greater control over their workspaces could substantially alleviate SBS symptoms. Additionally, maintaining high cleanliness standards not only boosts user satisfaction but also reduces symptom likelihood, providing a dual benefit for staff health and operational efficiency in Chinese hospitals.
Author Contributions
Conceptualization, J.W. and X.Y.; methodology, F.H., J.L., Q.W., X.Y. and Y.S.; software, F.H. and J.L.; validation, Q.W.; formal analysis, Y.T.; investigation, J.W. and Q.W.; resources, Y.S. and Y.T.; data curation, F.H., J.L., Y.S. and Y.T.; writing—original draft, J.W., F.H. and Q.W.; writing—review and editing, J.W.; visualization, J.L.; supervision, X.Y.; project administration, X.Y.; funding acquisition, J.W. All authors have read and agreed to the published version of the manuscript.
Funding
This research was supported by Scientific Research Fund of Zhejiang Provincial Education Department (Y202351499), Hangzhou Joint Fund of the Zhejiang Provincial Natural Science Foundation of China under Grant No. LHZY24A010004 and the Opening Fund of State Key Laboratory of Green Building (LSKF202307) and 2023 Hangzhou major scientific and technological innovation projects in the fields of high-end equipment, new materials, and green energy (carbon peak and carbon neutrality): Research and integrated application of key technical equipment for urban and rural public buildings (No. 2023SZD0070), and Hangzhou City University innovation and entrepreneurship training program project (X202401116).
Institutional Review Board Statement
The study was conducted in accordance with the Declaration of Helsinki and was approved by the Institutional Review Board of Hangzhou Integrative Medicine Hospital (protocol code XZX2020081501, approval date is 15 August 2020).
Data Availability Statement
The data presented in this study are available upon reasonable request due to privacy and ethical restrictions. Requests for access to the data can be directed to the corresponding author.
Acknowledgments
We would like to express our sincere gratitude to all the hospital management personnel and participants who were surveyed for their strong support.
Conflicts of Interest
The authors declare no conflict of interest.
Nomenclature
SBS: sick building syndrome; OR: odds ratio; IEQ: indoor environmental quality; GS: general symptoms; MS: mucosal symptoms; SS: skin symptoms.
References
- International Health Conference. Constitution of the World Health Organization. 1946. Bull. World Health Organ. 2003, 80, 981–984. [Google Scholar]
- Hosseini, M.R.; Fouladi-Fard, R.; Aali, R. COVID-19 Pandemic and Sick Building Syndrome. Indoor Air 2020, 29, 1181–1183. [Google Scholar] [CrossRef]
- Michel, J.; Evans, D.; Tanner, M.; Sauter, T.C. Identifying Policy Gaps in a COVID-19 Online Tool Using the Five-factor Frame Work. Systems 2022, 10, 257. [Google Scholar] [CrossRef]
- Trivedi, A.; Sreenivas, N.K.; Rao, S. Modeling the Spread and Control of COVID-19. Systems 2021, 9, 53. [Google Scholar] [CrossRef]
- Samet, J.M.; Spengler, J.D. Indoor Environments and Health: Moving into the 21st Century. Am. J. Public Health 2003, 93, 1489–1493. [Google Scholar] [CrossRef]
- El Zeina, F.; Hijazia, R. Poor Indoor Environmental Quality Leading to Sick Building Syndrome. Educ. Res. (IJMCER) 2021, 3, 158–165. [Google Scholar]
- Redlich, C.A.; Sparer, J.; Cullen, M.R. Sick-building Syndrome. Lancet 1997, 349, 1013–1016. [Google Scholar] [CrossRef]
- Wong, S.-K.; Lai, L.W.-C.; Ho, D.C.-W.; Chau, K.-W.; Lam, C.L.-K.; Ng, C.H.-F. Sick Building Syndrome and Perceived Indoor Environmental Quality: A Survey of Apartment Buildings in Hong Kong. Habitat Int. 2009, 33, 463–471. [Google Scholar] [CrossRef]
- Kielb, C.; Lin, S.; Muscatiello, N.; Hord, W.; Rogers-Harrington, J.; Healy, J. Building-related Health Symptoms and Class Room Indoor Air Quality: A Survey of School Teachers in New York State. Indoor Air 2015, 25, 371–380. [Google Scholar] [CrossRef]
- Belachew, H.; Assefa, Y.; Guyasa, G.; Azanaw, J.; Adane, T.; Dagne, H.; Gizaw, Z. Sick Building Syndrome and Associated Risk Factors among the Population of Gondar Town, Northwest Ethiopia. Environ. Health Prev. Med. 2018, 23, 54. [Google Scholar] [CrossRef]
- Nakayama, Y.; Nakaoka, H.; Suzuki, N.; Tsumura, K.; Hanazato, M.; Todaka, E.; Mori, C. Prevalence and Risk Factors of pre-sick Building Syndrome: Characteristics of Indoor Environmental and Individual Factors. Environ. Health Prev. Med. 2019, 24, 77. [Google Scholar] [CrossRef] [PubMed]
- Huo, X.; Sun, Y.; Hou, J.; Wang, P.; Kong, X.; Zhang, Q.; Sundell, J. Sick Building Syndrome Symptoms among Young Parents in Chinese Homes. Build. Environ. 2020, 169, 106283. [Google Scholar] [CrossRef]
- Mentese, S.; Mirici, N.A.; Elbir, T.; Palaz, E.; Mumcuoğlu, D.T.; Cotuker, O.; Bakar, C.; Oymak, S.; Otkun, M.T. A Long-term Multi-parametric Monitoring Study: Indoor Air Quality (IAQ) and the Sources of the Pollutants, Prevalence of Sick Building Syndrome (SBS) Symptoms, and Respiratory Health Indicators. Atmos. Pollut. Res. 2020, 11, 2270–2281. [Google Scholar] [CrossRef]
- Hou, J.; Sun, Y.; Dai, X.; Liu, J.; Shen, X.; Tan, H.; Yin, H.; Huang, K.; Gao, Y.; Lai, D.; et al. Associations of Indoor Carbon Dioxide Concentrations, Air Temperature, and Humidity with Perceived Air Quality and Sick Building Syndrome Symptoms in Chinese Homes. Indoor Air 2021, 31, 1018–1028. [Google Scholar] [CrossRef] [PubMed]
- Lu, C.Y.; Tsai, M.C.; Muo, C.H.; Kuo, Y.H.; Sung, F.C.; Wu, C.C. Personal, Psychosocial and Environmental Factors Related to Sick Building Syndrome in Official Employees of Taiwan. Int. J. Environ. Res. Public Health 2018, 15, 7. [Google Scholar] [CrossRef]
- Sarkhosh, M.; Najafpoor, A.A.; Alidadi, H.; Shamsara, J.; Amiri, H.; Andrea, T.; Kariminejad, F. Indoor Air Quality Associa tions with Sick Building Syndrome: An Application of Decision Tree Technology. Build. Environ. 2021, 188, 107446. [Google Scholar] [CrossRef]
- Sayan, H.E.; Dülger, S. Evaluation of the Relationship between Sick Building Syndrome Complaints among Hospital Employ ees and Indoor Environmental Quality. Med. Lav. 2021, 112, 153–161. [Google Scholar] [CrossRef]
- Fu, X.; Norbäck, D.; Yuan, Q.; Li, Y.; Zhu, X.; Hashim, J.H.; Hashim, Z.; Ali, F.; Hu, Q.; Deng, Y. Association between Indoor Microbiome Exposure and Sick Building Syndrome (SBS) in Junior High Schools of Johor Bahru, Malaysia. Sci. Total Environ. 2021, 753, 141904. [Google Scholar] [CrossRef]
- Babaoglu, U.T.; Milletli Sezgin, F.; Yag, F. Sick Building Symptoms among Hospital Workers Associated with Indoor Air Quality and Personal Factors. Indoor Built Environ. 2020, 29, 645–655. [Google Scholar] [CrossRef]
- Kim, J.; Jang, M.; Choi, K.; Kim, K. Perception of Indoor Air Quality (IAQ) by Workers in Underground Shopping Centers in Relation to Sick-Building Syndrome (SBS) and Store Type: A Cross-sectional Study in Korea. BMC Public Health 2019, 19, 632. [Google Scholar] [CrossRef]
- Shan, X.; Zhou, J.; Chang, V.W.C.; Yang, E.-H. Comparing Mixing and Displacement Ventilation in Tutorial Rooms: Students’ Thermal Comfort, Sick Building Syndromes, and Short-term Performance. Build. Environ. 2016, 102, 128–137. [Google Scholar] [CrossRef]
- Dhungana, P.; Chalise, M. Prevalence of Sick Building Syndrome Symptoms and Its Associated Factors among Bank Employ ees in Pokhara Metropolitan, Nepal. Indoor Air 2020, 30, 244–250. [Google Scholar] [CrossRef] [PubMed]
- Zuo, C.; Luo, L.; Liu, W. Effects of Increased Humidity on Physiological Responses, Thermal Comfort, Perceived Air Quality, and Sick Building Syndrome Symptoms at Elevated Indoor Temperatures for Subjects in a Hot-humid Climate. Indoor Air. 2021, 31, 524–540. [Google Scholar] [CrossRef]
- Sun, Y.; Hou, J.; Cheng, R.; Sheng, Y.; Zhang, X.; Sundell, J. Indoor Air Quality, Ventilation and Their Associations with Sick Building Syndrome in Chinese Homes. Energy Build. 2019, 197, 112–119. [Google Scholar] [CrossRef]
- Madureira, J.; Paciência, I.; Rufo, J. Indoor Air Quality in Schools and Its Relationship with Children’s Respiratory Symptoms. Atmos. Environ. 2015, 118, 145–156. [Google Scholar] [CrossRef]
- Deng, L.; Deng, Q. The Basic Roles of Indoor Plants in Human Health and Comfort. Environ. Sci. Pollut. Res. 2018, 25, 36087–36101. [Google Scholar] [CrossRef] [PubMed]
- Norbäck, D.; Hashim, J.H.; Cai, G.; Cai, G.H.; Hashim, Z.; Ali, F.; Bloom, E.; Larsson, L. Throat and Dermal Symptoms, Headache and Tiredness among Students in Schools from Johor Bahru, Malaysia: Associations with Fungal DNA and Mycotoxins in Classroom Dust. PLoS ONE 2016, 11, e0147996. [Google Scholar] [CrossRef]
- Michael, A.; Heracleous, C. Assessment of Natural Lighting Performance and Visual Comfort of Educational Architecture in Southern Europe: The Case of Typical Educational School Premises in Cyprus. Energy Build. 2017, 140, 443–457. [Google Scholar] [CrossRef]
- Mujan, I.; Anđelković, A.S.; Munćan, V.; Kljajić, M.; Ružić, D. Influence of Indoor Environmental Quality on Human Health and Productivity—A Review. J. Clean. Prod. 2019, 217, 646–657. [Google Scholar] [CrossRef]
- Kabirikopaei, A.; Lau, J.; Nord, J. Identifying the K-12 Classrooms’ Indoor Air Quality Factors that Affect Student Academic Performance. Sci. Total Environ. 2021, 786, 147498. [Google Scholar] [CrossRef]
- Ghaffarianhoseini, A.; AlWaer, H.; Omrany, H. Sick Building Syndrome: Are We Doing Enough? Archit. Sci. Rev. 2018, 61, 99–121. [Google Scholar] [CrossRef]
- Jiang, W.; Lu, C.; Miao, Y. Outdoor Particulate Air Pollution and Indoor Renovation Associated with Childhood Pneumonia in China. Atmos. Environ. 2018, 174, 76–81. [Google Scholar] [CrossRef]
- Yu, L.; Wu, C.; Cao, M.; Lei, C.; Zhou, Z.; Ou, W. Systematic Review and Meta-analysis of Workload among Medical Records Coders in China. BMC Med. Inform. Decis. Mak. 2024, 24, 335. [Google Scholar]
- Niza, I.L.; de Souza, M.P.; da Luz, I.M.; Broday, E.E. Sick Building Syndrome and Its Impacts on Health, Well-being and Productivity: A Systematic Literature Review. Indoor Built Environ. 2023, 33, 218–236. [Google Scholar] [CrossRef]
- Joshi, A.; Kale, S.; Chandel, S.; Pal, D.K. Likert Scale: Explored and Explained. Br. J. Appl. Sci. Technol. 2015, 7, 396. [Google Scholar] [CrossRef]
- Glonek, G.F.; McCullagh, P. Multivariate Logistic Models. J. R. Stat. Soc. Ser. B (Methodol.) 1995, 57, 533–546. [Google Scholar] [CrossRef]
- Bland, J.M.; Altman, D.G. The Odds Ratio. Bmj 2000, 320, 1468. [Google Scholar] [CrossRef]
- Surawattanasakul, V.; Sirikul, W.; Sapbamrer, R.; Wangsan, K.; Panumasvivat, J.; Assavanopakun, P.; Muangkaew, S. Respiratory Symptoms and Skin Sick Building Syndrome among Office Workers at University Hospital, Chiang Mai, Thailand: Associations with Indoor Air Quality, AIRMED Project. Int. J. Environ. Res. Public Health 2022, 19, 850. [Google Scholar] [CrossRef]
- Thach, T.-Q.; Mahirah, D.; Dunleavy, G.; Nazeha, N.; Zhang, Y.; Tan, C.E.H.; Roberts, A.C.; Christopoulos, G.; Soh, C.K.; Car, J. Prevalence of Sick Building Syndrome and Its Association with Perceived Indoor Environmental Quality in an Asian Multi-ethnic Working Population. Build. Environ. 2019, 166, 106420. [Google Scholar] [CrossRef]
- Mahdizadeh, A.; Sadat Kia, N.; Pahlevan, D. Prevalence of Sick Building Syndrome and Its Related Factors in Medical Staff in Iran: A Cross-sectional Study. Middle East J. Rehabil. Health Stud. 2023, 11, e141003. [Google Scholar] [CrossRef]
- Norbäck, D. An Update on Sick Building Syndrome. Curr. Opin. Allergy Clin. Immunol. 2009, 9, 55–59. [Google Scholar] [CrossRef] [PubMed]
- Kinman, G.; Griffin, M. Psychosocial Factors and Gender as Predictors of Symptoms Associated with Sick Building Syndrome. Stress Health 2010, 24, 165–171. [Google Scholar] [CrossRef]
- Shim, I.K.; Kim, J.; Won, S.R.; Hwang, E.S.; Lee, Y.; Park, S.; Ryu, J.; Lee, J. Prevalence of Sick Building Syndrome Symptoms and Subjective–objective Indoor Air Quality of Stores in Underground Shopping Districts of Korea. Build. Environ. 2023, 228, 109882. [Google Scholar] [CrossRef]
- Dolling, A.; Nilsson, H.; Lundell, Y. Stress Recovery in Forest or Handicraft Environments—An Intervention Study. Urban For. Urban Green. 2017, 27, 162–172. [Google Scholar] [CrossRef]
- Kalender Smajlović, S.; Kukec, A.; Dovjak, M. Association between Sick Building Syndrome and Indoor Environmental Quality in Slovenian Hospitals: A Cross-Sectional Study. Int. J. Environ. Res. Public Health 2019, 16, 3224. [Google Scholar] [CrossRef]
- Fisk, W.J. How Home Ventilation Rates Affect Health: A Literature Review. Indoor Air 2018, 28, 473–487. [Google Scholar] [CrossRef] [PubMed]
- Wang, M.; Li, L.; Hou, C.; Guo, X.; Fu, H. Building and Health: Mapping the Knowledge Development of Sick Building Syndrome. Buildings 2022, 12, 287. [Google Scholar] [CrossRef]
- Hoang Quoc, C.; Vu Huong, G.; Nguyen Duc, H. Working Conditions and Sick Building Syndrome among Health Care Workers in Vietnam. Int. J. Environ. Res. Public Health 2020, 17, 3635. [Google Scholar] [CrossRef]
- Rostron, J. Sick Building Syndrome: A Review of Causes, Consequences and Remedies. J. Retail. Leis. Prop. 2008, 7, 291–303. [Google Scholar] [CrossRef]
- Baloch, R.M.; Maesano, C.N.; Christoffersen, J.; Banerjee, S.; Gabriel, M.; Csobod, É.; de Oliveira Fernandes, E.; Anne si-Maesano, I. Indoor Air Pollution, Physical and Comfort Parameters Related to School Children’s Health: Data from the European SINPHONIE Study. Sci. Total Environ. 2020, 739, 139870. [Google Scholar] [CrossRef]
- Akova, İ.; Kiliç, E.; Sümer, H.; Keklikçi, T. Prevalence of Sick Building Syndrome in Hospital Staff and its Relationship with Indoor Environmental Quality. Int. J. Environ. Health Res. 2022, 32, 1204–1219. [Google Scholar] [CrossRef] [PubMed]
- Fan, L.; Ding, Y. Research on Risk Scorecard of Sick Building Syndrome Based on Machine Learning. Build. Environ. 2022, 211, 108710. [Google Scholar] [CrossRef]
- Isman, N.I.I.; Jalaludin, J.; Suhaimi, N.F.; Hashim, F.; Tualeka, A.R. Association Between Indoor Air Quality and Sick Building Syndrome Among Workers in Food Outlets in Selangor, Malaysia. J. Environ. Health 2024, 16, 331–341. [Google Scholar] [CrossRef]
- Subri, M.S.M.; Arifin, K.; Sohaimin, M.F.A.M.; Abas, A. The Parameter of the Sick Building Syndrome: A Systematic Literature Review. Heliyon 2024, 10, e32431. [Google Scholar] [CrossRef] [PubMed]
- Jiao, D.; Zhao, M.; Tang, J.; Dazhuang, L. Impact of Office Light Environment on Mental Health Interventions for Employees: An Investigative Analysis. WORK 2025. [Google Scholar] [CrossRef] [PubMed]
- Sun, C.; Lian, Z. Sensitive Physiological Indicators for Human Visual Comfort Evaluation. Light. Res. Technol. 2016, 48, 726–741. [Google Scholar] [CrossRef]
- Sun, C.; Han, Y.; Luo, L.; Sun, H. Effects of air temperature on cognitive work performance of acclimatized people in severely cold region in China. Indoor Built Environ. 2020, 30, 816–837. [Google Scholar] [CrossRef]
Disclaimer/Publisher’s Note: The statements, opinions and data contained in all publications are solely those of the individual author(s) and contributor(s) and not of MDPI and/or the editor(s). MDPI and/or the editor(s) disclaim responsibility for any injury to people or property resulting from any ideas, methods, instructions or products referred to in the content. |
© 2025 by the authors. Licensee MDPI, Basel, Switzerland. This article is an open access article distributed under the terms and conditions of the Creative Commons Attribution (CC BY) license (https://creativecommons.org/licenses/by/4.0/).