Article

The Influence of Various Tensile and Shear Reinforcement Configurations on the Ultimate Capacity and Failure Mechanisms of Reinforced Concrete Beams

by
Ahmed S. Elamary
1,
Ibrahim A. Sharaky
1,
Fahad M. Alharthi
1,
Ayman El-Zohairy
2,* and
Mostafa M. A. Mostafa
3
1
Department of Civil Engineering, College of Engineering, Taif University, P.O. Box 11099, Taif 21944, Saudi Arabia
2
Department of Engineering and Technology, East Texas A&M University, Commerce, TX 75429, USA
3
Civil Engineering Department, Faculty of Engineering, Al-Azhar University, Qena P.O. Box 83513, Egypt
*
Author to whom correspondence should be addressed.
Buildings 2025, 15(9), 1396; https://doi.org/10.3390/buildings15091396
Submission received: 27 January 2025 / Revised: 3 March 2025 / Accepted: 6 March 2025 / Published: 22 April 2025

Abstract

:
This study comprehensively examines the impact of various tensile and shear reinforcement arrangements on the ultimate capacity and failure mode of reinforced concrete (RC) beams. This study encompasses theoretical, experimental, and numerical approaches. The experiment consisted of six beams (three 2.0 m long beams and three beams measuring 1 m in length) and had unique shear and tensile reinforcement setups. Truss bars and stirrups were used as shear reinforcement, while steel plates and bars were used as tensile reinforcement. The objective was to assess and compare the impact of the arrangement of tensile and shear reinforcement on the bending and shear strength of beams. The findings suggest that concrete beams reinforced with steel plates and stirrups had the highest load-carrying capacity when compared with conventional beams. Furthermore, a beam using truss bars with only 51.1% of the shear reinforcement area provided by stirrups achieved approximately 87% of the load capacity of its stirrup-reinforced counterpart. Additionally, increasing the yield strength of the steel plates from 420 MPa to 520 MPa enhanced beam stiffness and resulted in a 6% increase in ultimate load capacity.

1. Introduction

Recent technological advancements have led to the development of composite materials that combine concrete and steel plates, resulting in more durable structures. Concrete beams reinforced with steel plates are extensively utilized in the construction sector because of their exceptional strength and long-lasting nature. The incorporation of steel plates for reinforcement provides numerous advantages. Firstly, the plates can be easily replaced in the case of any damage or corrosion. Furthermore, they contribute to an enhanced internal moment arm and aid in preventing cracking and other types of damage. Moreover, the steel plate on the tension face of a concrete beam serves as an ideal surface for attaching strengthening materials like additional steel plates or carbon- or glass fiber-reinforced plates. This literature review aims to provide an overview of the research conducted on concrete beams reinforced with steel plates in tension zones and/or truss bars in shear zones. Most research has studied external steel plates for the shear reinforcement and flexural strengthening of concrete structures [1,2,3,4,5]. For instance, Subedi and Baglin [1] investigated vertical steel plates as substitutes for stirrups in RC beams, using plates 2–8 mm thick and up to 370 mm in height, with yield strengths between 240 and 420 MPa. Their investigation revealed that the use of some steel plates increased the apparent ultimate shear stresses of the concrete beams by approximately 20 MPa, whereas the use of the stirrups made according to BS 8110-2:1985 [6] only raised these stresses by 5 MPa. This difference in shear resistance was attributed to the steel plate’s continuity, which is lacking in stirrups. Previous studies have demonstrated that embedded steel plates in coupling beams offer substantial shear resistance [2,3,4,5]. Lam et al. [5] conducted a study on the flexural behavior of coupling concrete beams reinforced with steel bars and a vertical steel plate of various heights. Their research indicated that there exists a maximum height for steel plates, beyond which further increases do not enhance the beams’ performance (maximum shear stress ≤15 MPa).
Hamoda et al. [7] conducted experiments on reinforced concrete (RC) slabs strengthened with steel plates and bars. They found that these significantly increased the slabs’ cracking load, ultimate load, and energy absorption capacity. The results align with computer simulations, indicating that nonlinear inelastic analysis can be used for future studies. EB steel slabs showed an increase in ultimate loads from about 53% to 64%. B.B. Adhikary et al. [8] studied epoxy adhesive’s effectiveness in strengthening steel plates in RC beams and revealed that bond failure near flexural and shear cracks can lead to catastrophic failures. Factors like plate thickness, plate-to-support distance, and end anchors influenced beam failure. Finite elements (FEs) and material models were used to simulate this behavior [8]. Consequently, G. Arslan et al. [9] experimented on rectangular RC beams, determining the relationship between load and deformation. They provided equations for ultimate shear capacity, except for beams with expanded steel plates. Three-dimensional (3D) nonlinear FE analysis supported these findings. In [8,9], the authors found that using epoxy adhesive and steel plates improved flexural behavior by up to 182%.
S.M. Rakgate et al. [10] examined the impact of surface preparation on the flexural performance of steel–concrete beams strengthened with externally bonded steel plates. Their study showed that rougher surface preparations had higher bond strength and increased flexural capacity from 18% to 32% compared with the control beam and from 20% to 42% in group B. In another study by R.S. Atea [11], experimental and numerical investigations were conducted on four RC beams. Steel plates of varying thicknesses (2, 3, and 5 mm) were added to the tension zone of the beams to evaluate their effects on flexural behavior. The results showed that increasing the thickness of steel plates led to an increase in the ultimate strength of the beams compared to un-plated beams (73%, 86%, and 161% for plate thicknesses of 2, 3, and 5 mm, respectively). Additionally, increasing plate thickness decreased concrete strain, crack width, and the number of cracks. Many other investigations have been conducted to study the failure mechanism in composite concrete–steel beams [12,13,14]. In [15], a theory-informed deep neural network-based model was built to forecast the flexural capability of normal and prestressed concrete beams. Moreover, in [16], a machine learning-based deterministic model was used to forecast the chloride concentration in the interfacial zone, while in [17,18], the shear capacity of a steel beam was predicted. Conversely, in [19,20], the flexural capacity of RC-strengthened beams was analytically predicted and in good agreement with the experimental findings.
Based on previous research and the literature, the use of steel trusses to resist the shear failure of steel plate-reinforced concrete beams has not previously been studied. This study explores the advantages of utilizing concrete beams reinforced with steel plates and how steel plates impact the efficiency of RC beams in terms of flexural capacity and ductility. Moreover, the shear resistance of these beams was investigated after using steel plates and truss shear bars instead of traditional stirrups. Truss bars were strategically placed diagonally across the beams’ depth, creating a truss-like structure, evenly distributing shear forces along the entire beam length. The significance of this subject lies in its comprehensive approach to understanding the role of steel plates and truss shear rebars in enhancing the shear capacity of concrete beams. Tension configurations were changed between steel bars or combinations of steel bars and plates, while shear configurations were varied between stirrups and truss bars. The effects of the flexural and shear reinforcement configurations on the beams with short and long lengths (1.0 and 2.0 m free spans, respectively) were also examined. Moreover, an analytical approach was proposed to examine the flexural and shear behavior of the RC beams with the previous dissimilar tension and shear configuration and span lengths based on the equations suggested by ACI 318 [21]. Lastly, the study involved the verification of a finite element model created using the ABAQUS software package (Version 6.7) with the aid of the previously tested beam findings. This analysis will offer insights into the main factors influencing beam behavior, such as material properties and reinforcement configurations. By integrating theoretical, experimental, and numerical approaches, this research endeavors to comprehensively understand the flexural and shear behavior of RC beams under different reinforcement configurations.

2. Experimental Program

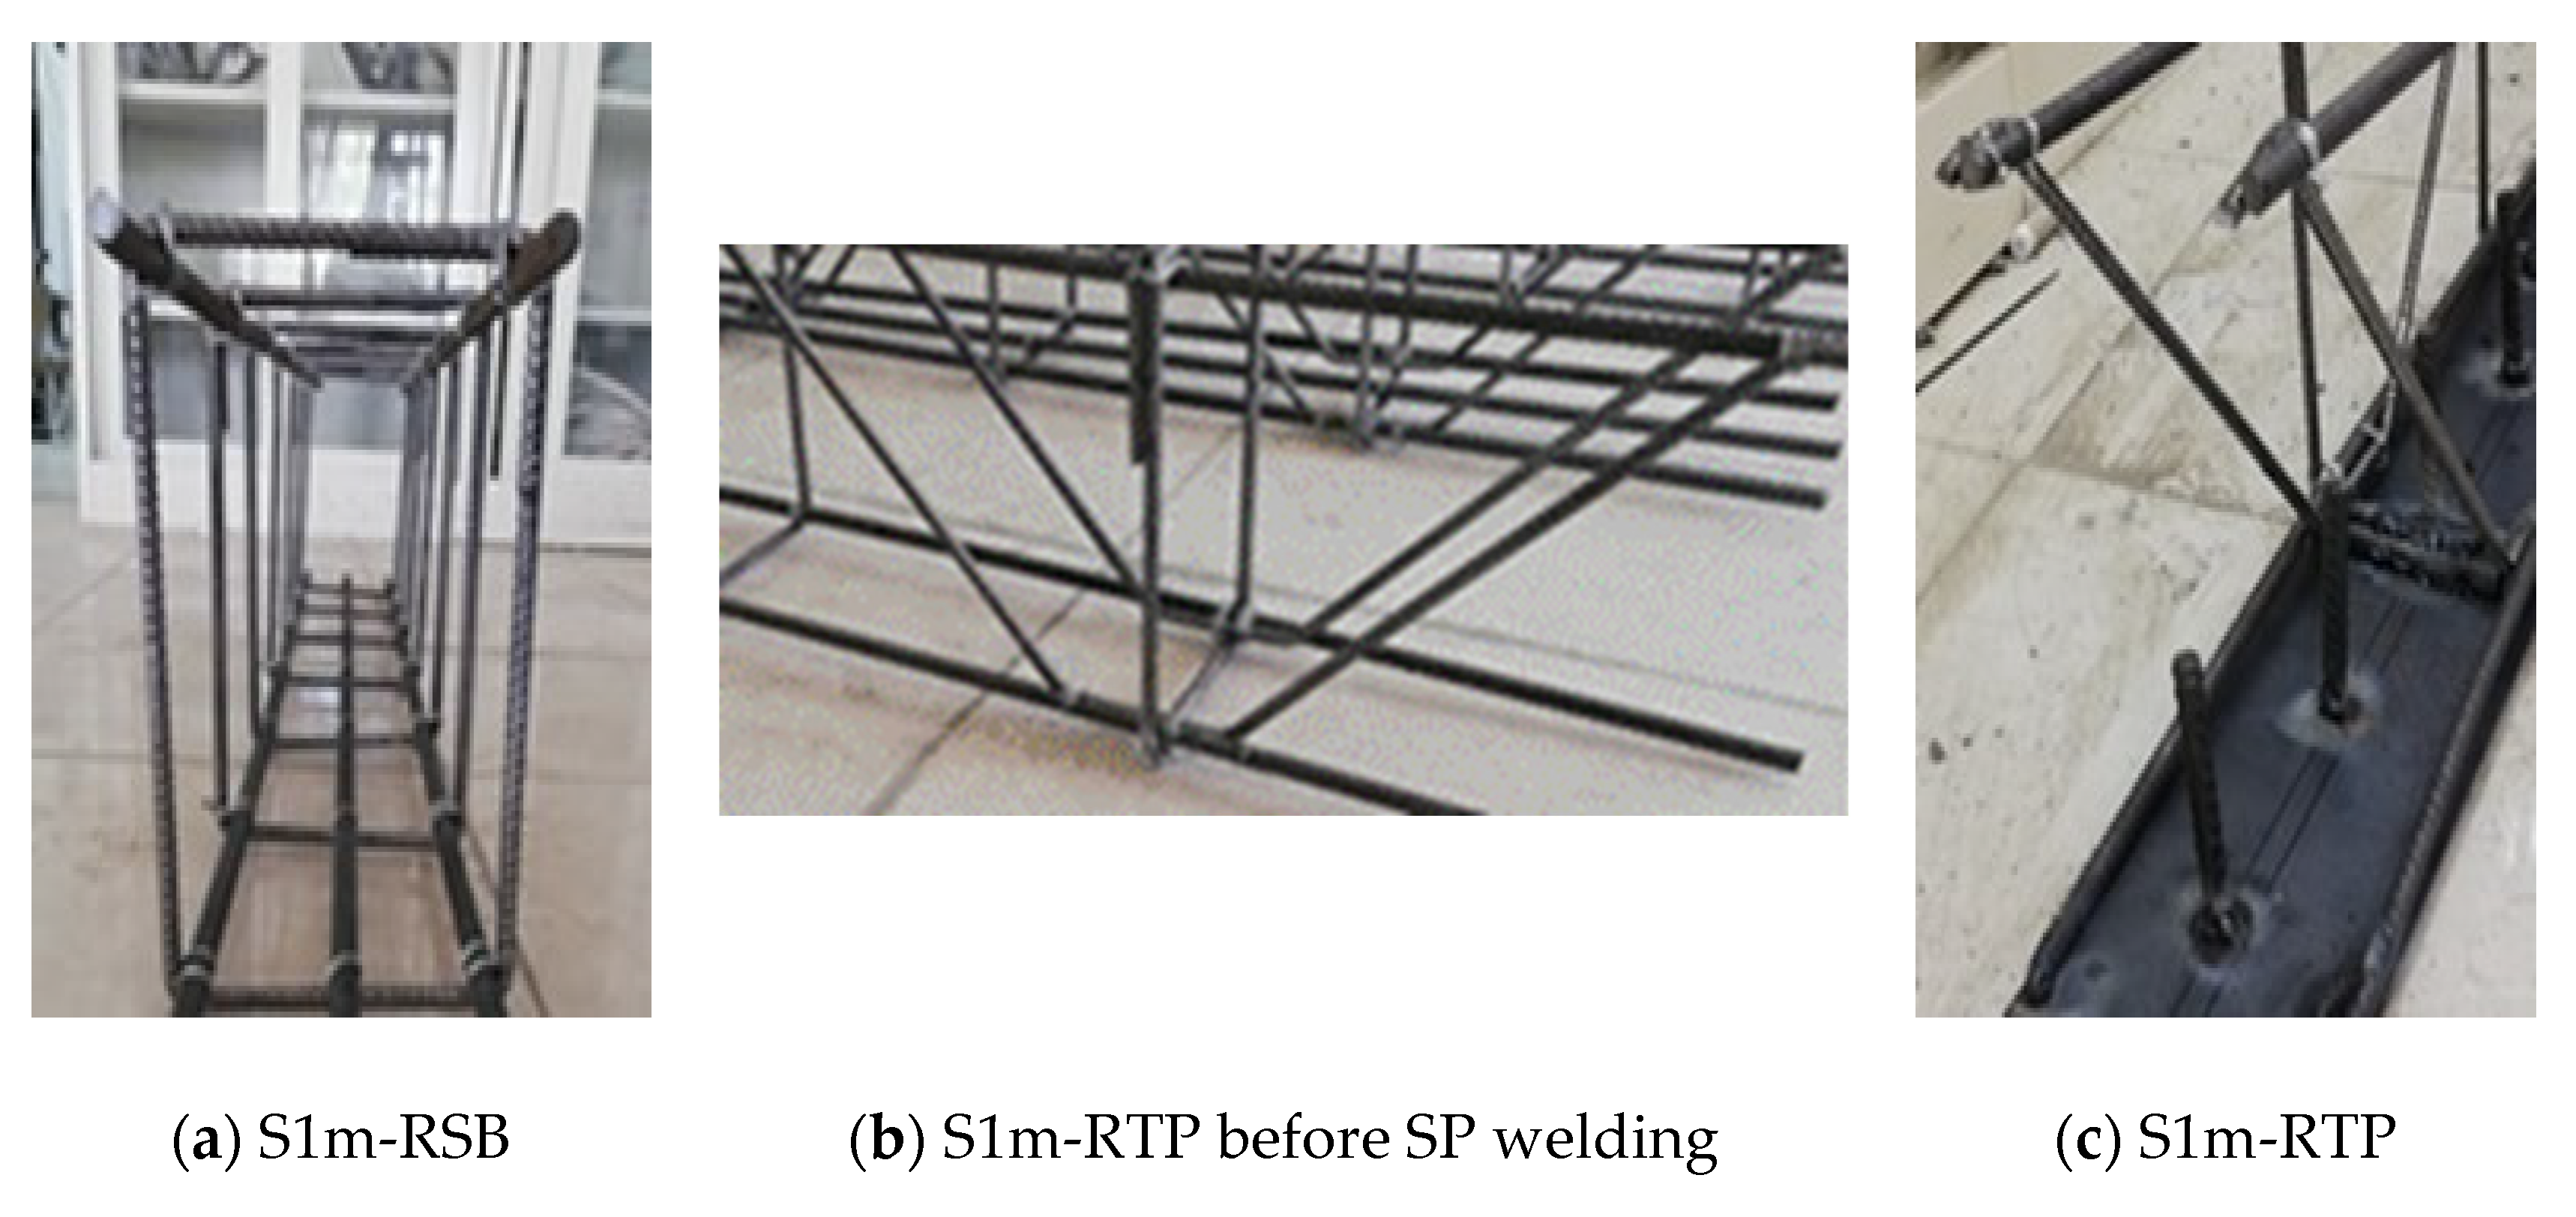
2.1. Beam Configuration and Test Variables

This experimental program was designed to evaluate the effectiveness of two innovative reinforcement techniques for concrete beams in comparison to conventional methods. Two groups of concrete beams were prepared, cast, and instrumented. The naming convention for each specimen is as follows: ‘S’ indicates a specimen; the following number denotes the span length in meters (1 or 2 for 1000 mm and 2000 mm, respectively); ‘R’ stands for reinforcement; and the subsequent two letters indicate the shear and tensile reinforcement types. Specifically, ‘T’ denotes truss bars, ‘S’ refers to stirrups, ‘B’ indicates steel bars, and ‘P’ denotes steel plates.
The concrete dimensions for the first group of beams (Group 1, three beams) were 1100 mm long (1000 mm free span length), 300 mm high, and 200 mm wide (see Figure 1). The control beam (S1m-RSB) was reinforced with three 12 mm diameter steel bars as main tensile reinforcement and stirrups as shear reinforcement. The beam S1m-RSB was reinforced by three 12 mm in diameter steel bars, as the main reinforcement (Figure 1c). In the second beam, the stirrups in the beam S1m-RSB were substituted with 8 mm truss bars (Figure 1d). In contrast, the third specimen was reinforced with a truss bar to withstand shear, like the second specimen, while the tensile reinforcement was two 10 mm in diameter steel bars and a 3 mm thick and 150 mm wide steel plate welded to the truss (Figure 1b,e). The top reinforcement of these three beams remained constant, consisting of two bars with a diameter of 10 mm (Figure 1b). The reinforcement details and dimensions of each specimen in this group can be found in Figure 1 and Figure 2 and Table 1.
Group 2 included three beams measuring 2200 mm in total length (2000 mm span), 500 mm in height, and 200 mm in width (Figure 3a). Each beam had consistent top reinforcement consisting of three 10 mm bars. The first beam (S2m-RSB) included five 14 mm in diameter steel bars as main reinforcement and seven stirrups per meter (diameter of 8 mm) as shear reinforcement. The second beam (S2m-RTB, Figure 3d) was reinforced with similar tensile reinforcement as beam S2m-RSB but with a truss of 8 mm diameter bars as shear reinforcement instead of stirrups. The third beam (S2m-RTP) was reinforced by two steel bars (14 mm diameter) and a steel plate with 3 mm thickness and 150 mm wide welded to the truss (Figure 3b,e).
The total tensile reinforcement in beam S2m-RTP was designed to match the number of main steel bars used in the control beam S2mRSB. Consequently, the ratio of the tensile reinforcement area to the concrete cross-sectional area was maintained at a constant value of 0.77% across all three specimens. To ensure proper bonding between the concrete and the steel plate, 14 mm diameter steel bar shear connectors were welded onto the plate. These connectors were spaced at 400 mm intervals and had a height of 100 mm, as detailed in Table 1 and illustrated in Figure 1, Figure 2, Figure 3 and Figure 4. The connectors were welded to the steel plates using 4 mm fillet welds applied via gas metal arc welding (GMAW) at a connection angle of 45°, in accordance with EN 1993-1-5 [22], while adhering to all safety precautions during the welding process. Compared to traditional stirrups, the fabrication and installation of the truss bars required less time and effort during beam assembly. However, greater attention is needed during the design phase of truss bars to ensure they are appropriately configured to cover the critical shear regions and effectively resist shear cracking. Additionally, to facilitate the attachment of truss bars to the beam reinforcement without welding, a limited number of stirrups are still required for proper positioning and support.

2.2. Materials Properties

All beams were cast using the same concrete mix and cured under standard conditions. The steel plates had a recorded yield strength of 250 MPa and an ultimate strength of 400 MPa. On the other hand, the main reinforcement steel bars in both groups had slightly different yields and ultimate strengths based on the bar diameter (Table 2). The truss’s steel members and stirrups were constructed from 8 mm in diameter steel bars, with properties shown in Table 2. The steel bars’ strength was experimentally obtained [23] and recorded, as in Table 2. Group 1 used 25 MPa concrete, while Group 2 used 35 MPa, verified via compression tests on three 150 × 300 mm cylinders per group [24].

2.3. Test Setup and Instrumentation

The experimental setup was constructed at Taif University (Taif, Saudi Arabia) using a 3D steel frame. Beams were simply supported via 80 mm steel rods resting in steel slots. A 2000 kN hydraulic jack applied load through an H.E.B.300 I-beam (see Figure 5). A central point load was applied at mid-span with load increments until failure. Deflection was measured with LVDTs and dial gauges, while strain was monitored using eight strain gauges placed on beam S2m-RTP. Strain gauges ST1–ST4 recorded compression, and ST5–ST8 recorded tension. Displacement-controlled loading was used at a rate of 0.01 mm/s to maintain consistency. External disturbances were minimized.

2.4. Experimental Results

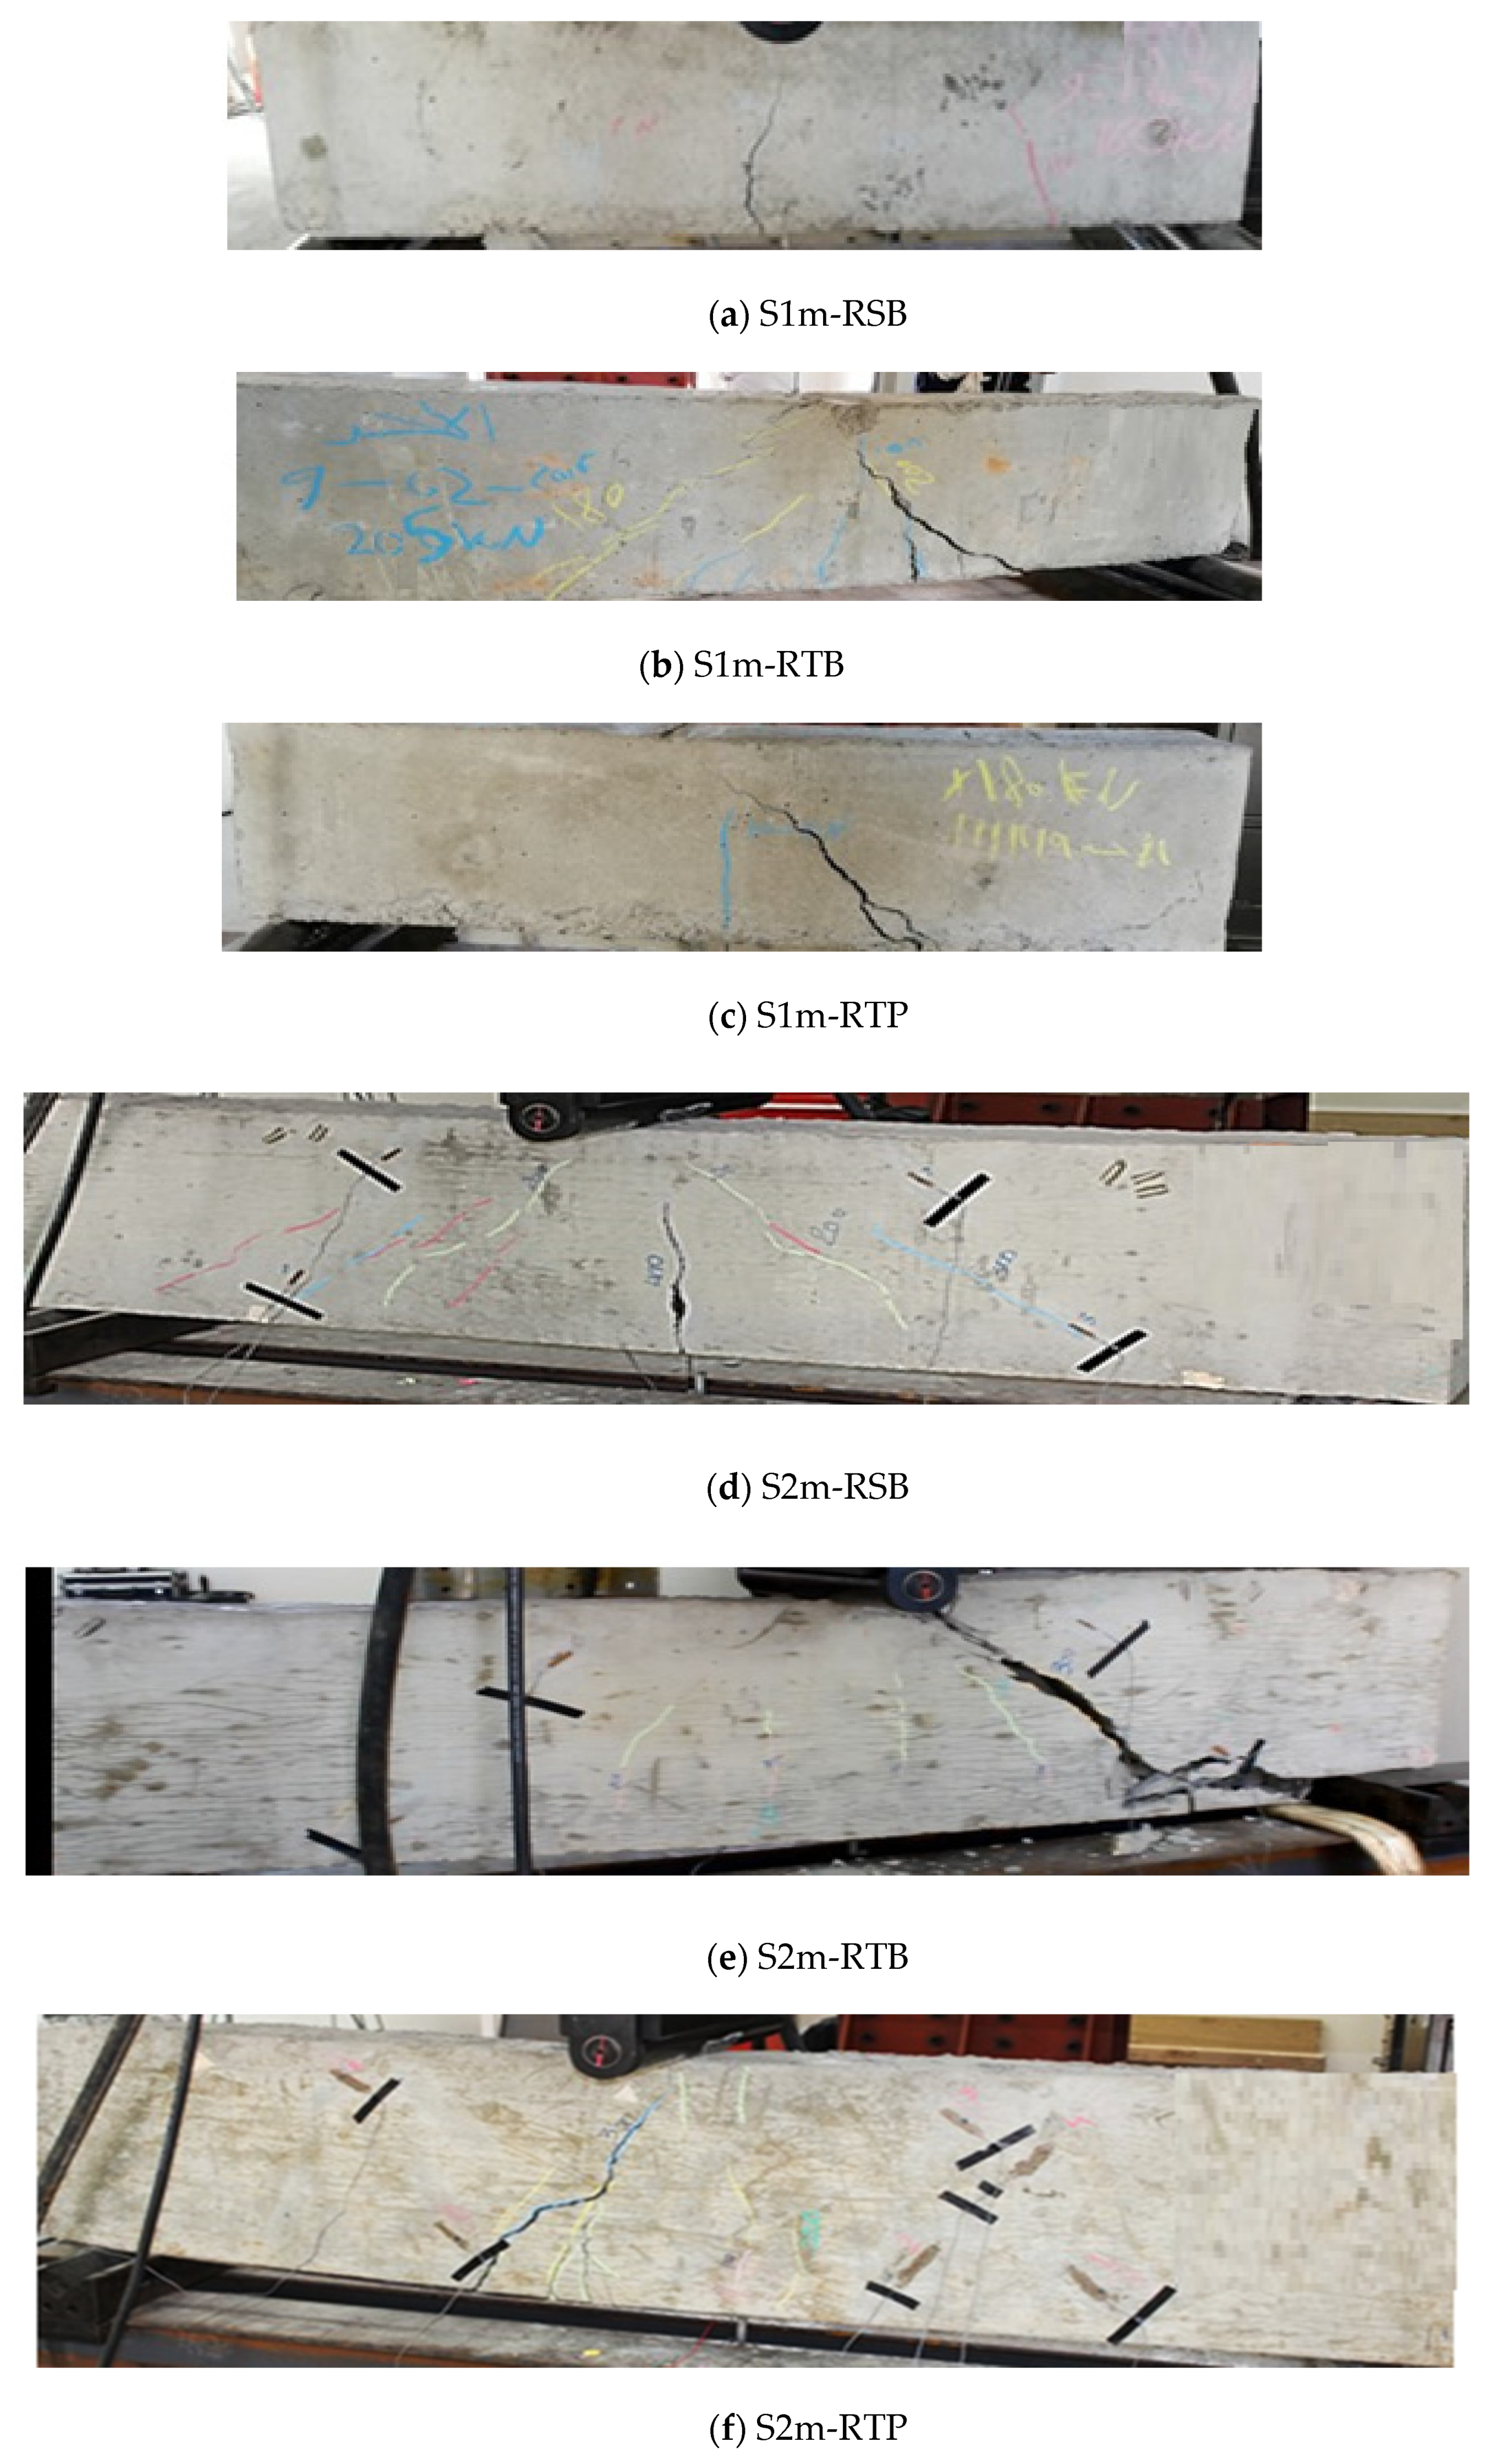
2.4.1. Failure Mode and Load Capacity

The failure mechanisms of the experimentally tested beams are illustrated in Figure 6. Understanding these mechanisms is critical for analyzing the effects of steel plates and truss bars. Beams S1m-RSB and S2m-RSB exhibited a wide, long flexural crack under the loading point, initiating in the concrete cover and propagating vertically with increasing load. The crack initiated in the concrete cover and propagated vertically as the load was incremented (Figure 6a), causing a flexural failure. Some narrow, short cracks were formed on the two sides of the mid-span crack.
In Group 1, the control beam S1m-RSB (reinforced with three steel bars) reached an ultimate load of 254 kN and 5 mm deflection. Beams S1m-RTB and S1m-RTP failed in shear due to cracks that initiated near the supports and extended toward the load point. S1m-RTB, using truss bars for shear reinforcement, failed at 205 kN (a 19% reduction). S1m-RTP, using both a steel plate and two steel bars in tension, reached 234 kN (an 8% reduction), with 2.5 mm deflection. Although S1m-RTP had the highest tensile reinforcement ratio, it still failed in shear. This highlights that enhancing tensile reinforcement alone does not prevent shear failure.
In Group 2, S2m-RSB achieved the highest capacity at 417 kN and 3.5 mm deflection (Table 3). The second beam (S2m-RTB) reached its peak load capacity at 361 kN, corresponding to a 13% reduction compared to the control beam, with an associated deflection of 2.3 mm (Table 3). The third beam (S2m-RTP) exhibited a slightly higher capacity of 370 kN (12% reduction) and a lower maximum deflection of 1.8 mm. Among the three specimens, the first beam (S2m-RSB), reinforced with conventional steel bars and stirrups, demonstrated the highest load-carrying capacity, sustaining a failure load of 417 kN before undergoing flexural collapse (Table 3). In contrast, both S2m-RTB and S2m-RTP—reinforced with truss bars instead of stirrups to resist shear—failed at lower shear-dominated loads of 361 kN and 370 kN, respectively.
In terms of reinforcement weight, the total shear reinforcement in S2m-RSB was approximately 7.7 kg, whereas S2m-RTB and S2m-RTP had 3.94 kg of truss shear reinforcement each. This implies that S2m-RTB, with only 51.1% of the shear reinforcement mass compared to S2m-RSB, could still attain 87% of the S2m-RSB’s load capacity. Given the ease of fabrication and installation of truss reinforcement relative to stirrups, it is recommended that future truss systems should match the total shear steel area of stirrups to optimize performance.
The span of the beam had no significant influence on the crack pattern or failure mode, as beams with varying spans exhibited similar cracking behavior and failure mechanisms. However, a reduction in the shear span-to-depth ratio resulted in an increase in load capacity, particularly in beams that failed in shear, provided the tensile reinforcement ratio remained constant. Conversely, variations in tensile reinforcement had minimal influence on shear capacity when the shear reinforcement configuration was kept constant. To isolate the influence of beam span on load capacity, it is essential to test specimens with identical characteristics except for span length, ensuring consistent flexural and shear reinforcement configurations.
Crack patterns observed in beams with truss shear reinforcement indicate that the failure mechanism involved a combination of the strut-and-tie action and diagonal shear cracking, as shown in Figure 6b,c,e,f. These cracks suggest that the interaction between compressive struts and tensile ties plays a critical role in the failure process. Such failure may lead to significant structural damage and potential collapse if not adequately addressed. The use of truss shear reinforcement must, therefore, be carefully designed to resist both compressive and tensile forces.
In contrast, flexural failure dominated the behavior of the conventionally reinforced beam (S2m-RSB), as depicted in Figure 6a,d. Flexural failure occurs due to excessive bending, which leads to progressive cracking and eventual failure when the flexural capacity is exceeded. This type of failure is typical in beams with insufficient flexural reinforcement or under excessive loading conditions.

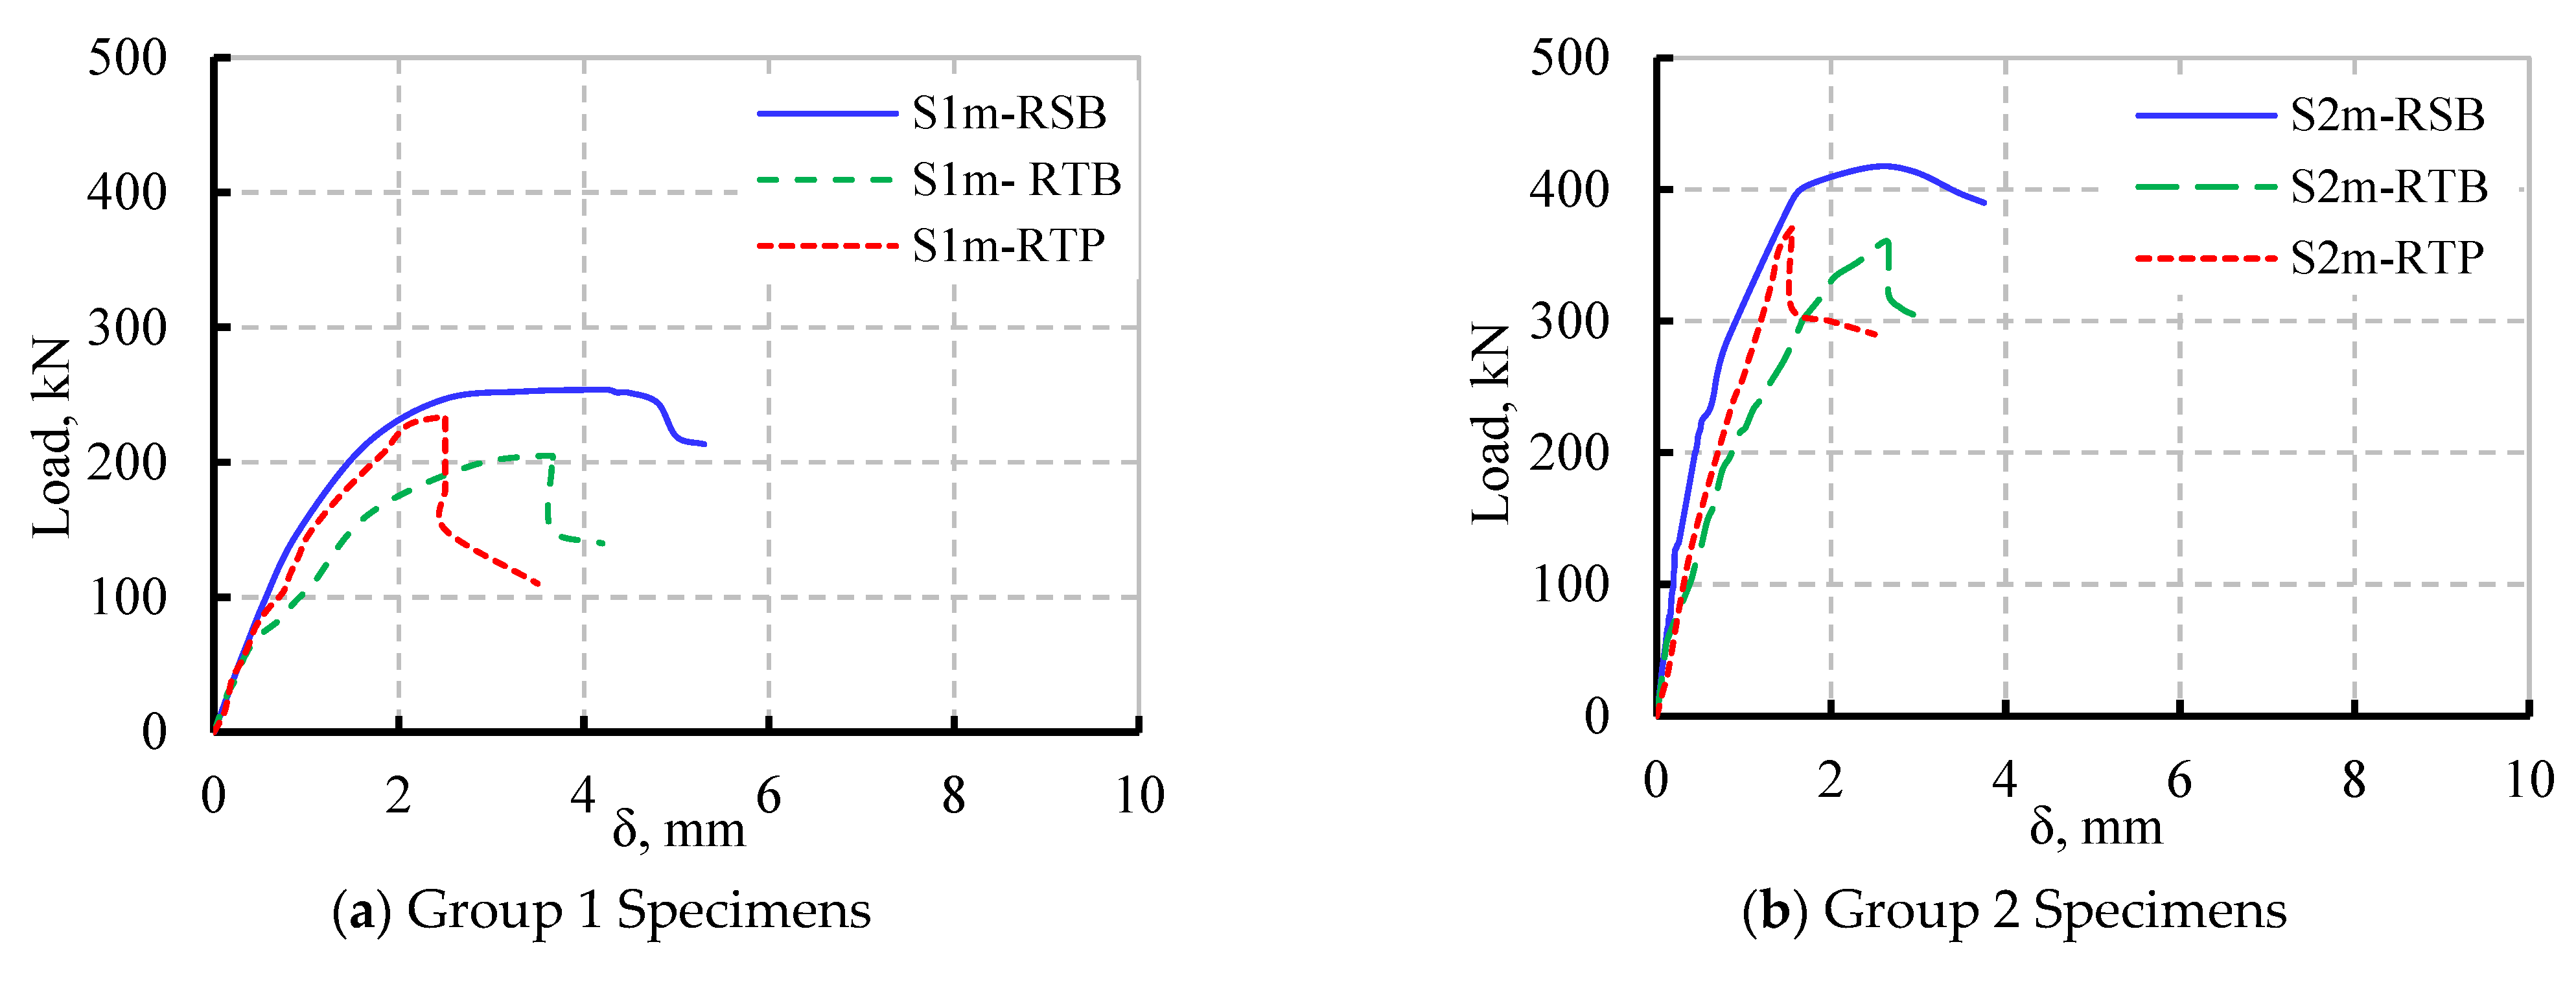
2.4.2. Load Deflection Curve

To evaluate the stiffness of each specimen during loading, load–deflection curves were analyzed to characterize the structural behavior of the beams. The experimentally obtained load–deflection responses for all tested specimens are presented in Figure 7. The load gradually increases until the beam reaches its maximum capacity or fails. Figure 7 shows that the initial slopes of all specimens are practically identical. The beams in Group 1 experienced lower stiffness than the corresponding one in Group 2, and the global flexural elasticity modulus of the Group 2 beams was higher (Figure 7). Consequently, the inclusion of steel plates and truss bars had a minimal influence on the stiffness of the concrete beam as the area of the steel plate is slightly less than the three replaced steel bars (14 mm in diameter) in Group 2 (Figure 7b). The effect of this slight difference was not responsible for the reduction in the beam S2m-RTP, as the failure was shear. This observation is further supported by the performance of beam S2m-RTB, which had a tensile reinforcement configuration identical to S2m-RSB, yet exhibited similar load capacity and shear failure to S2m-RTP (Figure 2). The lower stiffness of both beams S2m-RSB and S2m- RTB may be because of the low shear reinforcement area in those beams compared to S2m-RSB. The three beams had nearly initial stiffness; afterward, the beam stirrups could allow the beam to have higher stiffness than the beams with truss bars. The higher area of stirrups compared to truss bars reduced the beam deflection caused due to shear cracking, so it enhanced its global stiffness. A similar trend was observed in Group 1 beams, albeit with less pronounced differences (Figure 1a). The replacement of three steel bars (12 mm diameter, beam S1m-RTB) with two 10 mm in diameter steel bars and a 3 mm steel plate (beam S1m-RTP) increased the tensile reinforcement by 33%. This increment could enhance the stiffness of beam S1m-RTP and capacity as the tensile reinforcement could enhance the beam shear capacity.

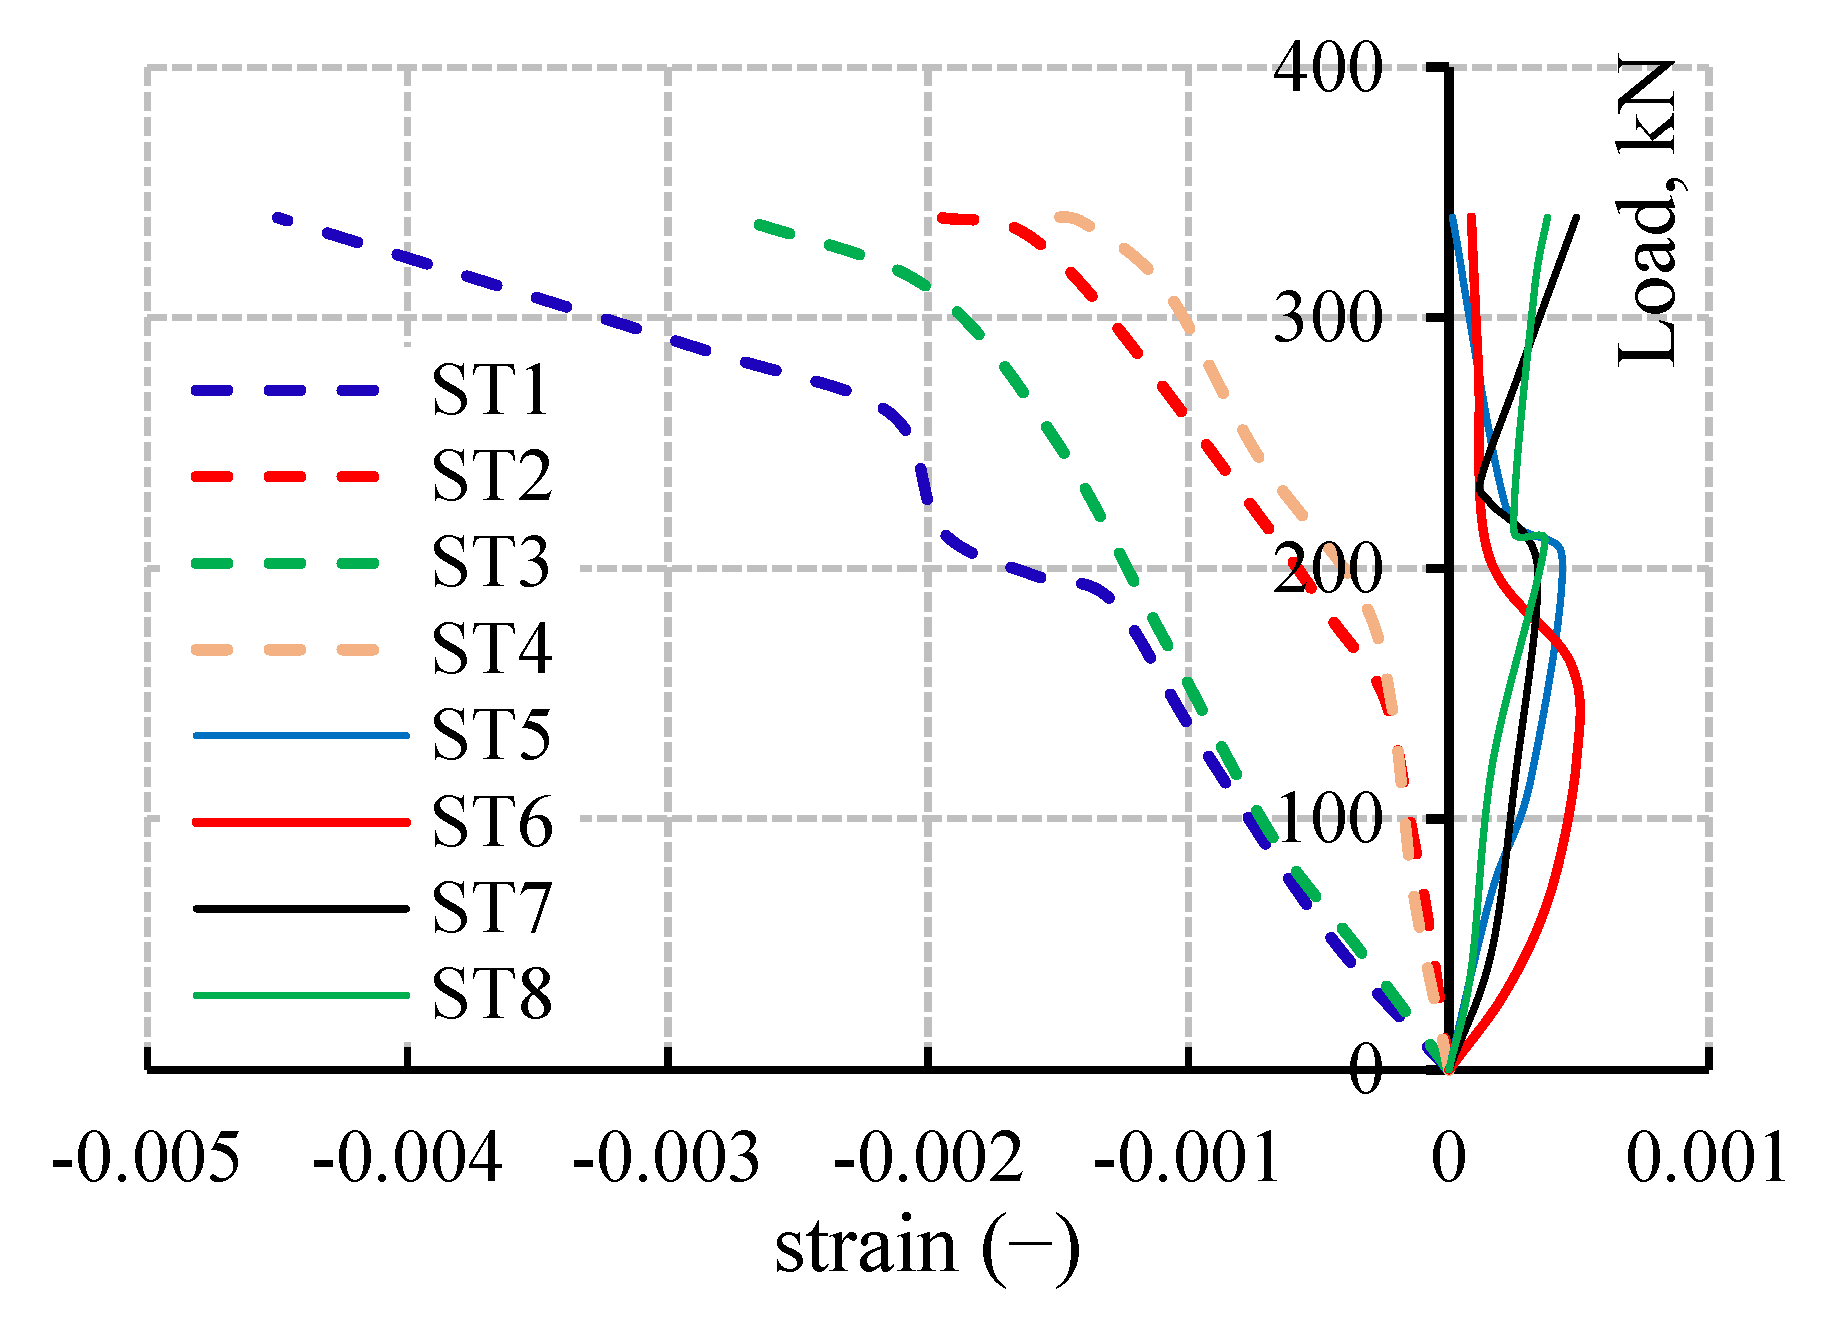
2.4.3. Strain Gauge Results

In the case of beam S2m-RTP, eight strain gauges were strategically attached to monitor deformation during testing, providing precise data on its structural response. As shown in Figure 8, strain readings plotted across the load range allow for the effective observation of crack progression. The crack initiation phase begins when the applied tensile stress exceeds the concrete’s tensile strength, leading to the formation of microcracks, typically on the tensile side of the beam (bottom surface). These early-stage cracks are generally invisible to the naked eye and may require specialized sensing technologies, such as acoustic emission systems, for detection. According to Carmona and Aguado [25], the maximum tensile strain that concrete can sustain without visible cracking ranges from 0.00015 to 0.00025. During this phase, cracking is primarily governed by diagonal tensile stresses induced by shear.
As the applied load increases, the beam enters the crack propagation stage. Within the 0–150 kN load range, significant increases in strain were recorded by gauges ST2 and ST4, indicating active crack extension. Furthermore, gauges ST6 and ST8 exhibited higher deformation levels and responded earlier, within the 0–100 kN range, suggesting that cracking in those regions initiated sooner and progressed more rapidly. These localized strain responses highlight the varying stress distribution along the beam and underscore the influence of reinforcement configuration on crack development and failure behavior.
As the load continues to be applied, these cracks progressively propagate through the beam until they reach a critical size. At this crucial point, microcracks start to develop within the concrete due to localized stress concentrations. The strain gauges attached to the beam indicate an increase in strain without a proportional increase in stress. The plotted curve for this stage deviates from linearity and demonstrates a gradual rise in strain. This stage commences when the load reaches approximately 150 kN and persists until around 230 kN. During this stage, the failure mode transitions from tensile stress caused by shear to a mechanism called strut and tie. The centrally applied load generates compression stress, which begins to influence the formation of the cracks. The strain readings obtained from ST1 to ST4 reflect the behavior observed during this stage. Among these strain gauges, ST1 experiences a particularly significant impact.
The final phase of crack development began when the applied load exceeded approximately 230 kN and continued up to the ultimate failure load of around 384 kN. This transition was marked by accelerated damage accumulation, culminating in a sudden loss of structural integrity.

3. Analytical Analysis

An analytical approach was developed to ensure the desired failure mode in the experimental study and to guide the fabrication of specimens, particularly those internally reinforced with truss steel bars. The moment and shear capacities of the control beams were calculated using ACI 318-19 [21], providing insight into the expected failure modes.

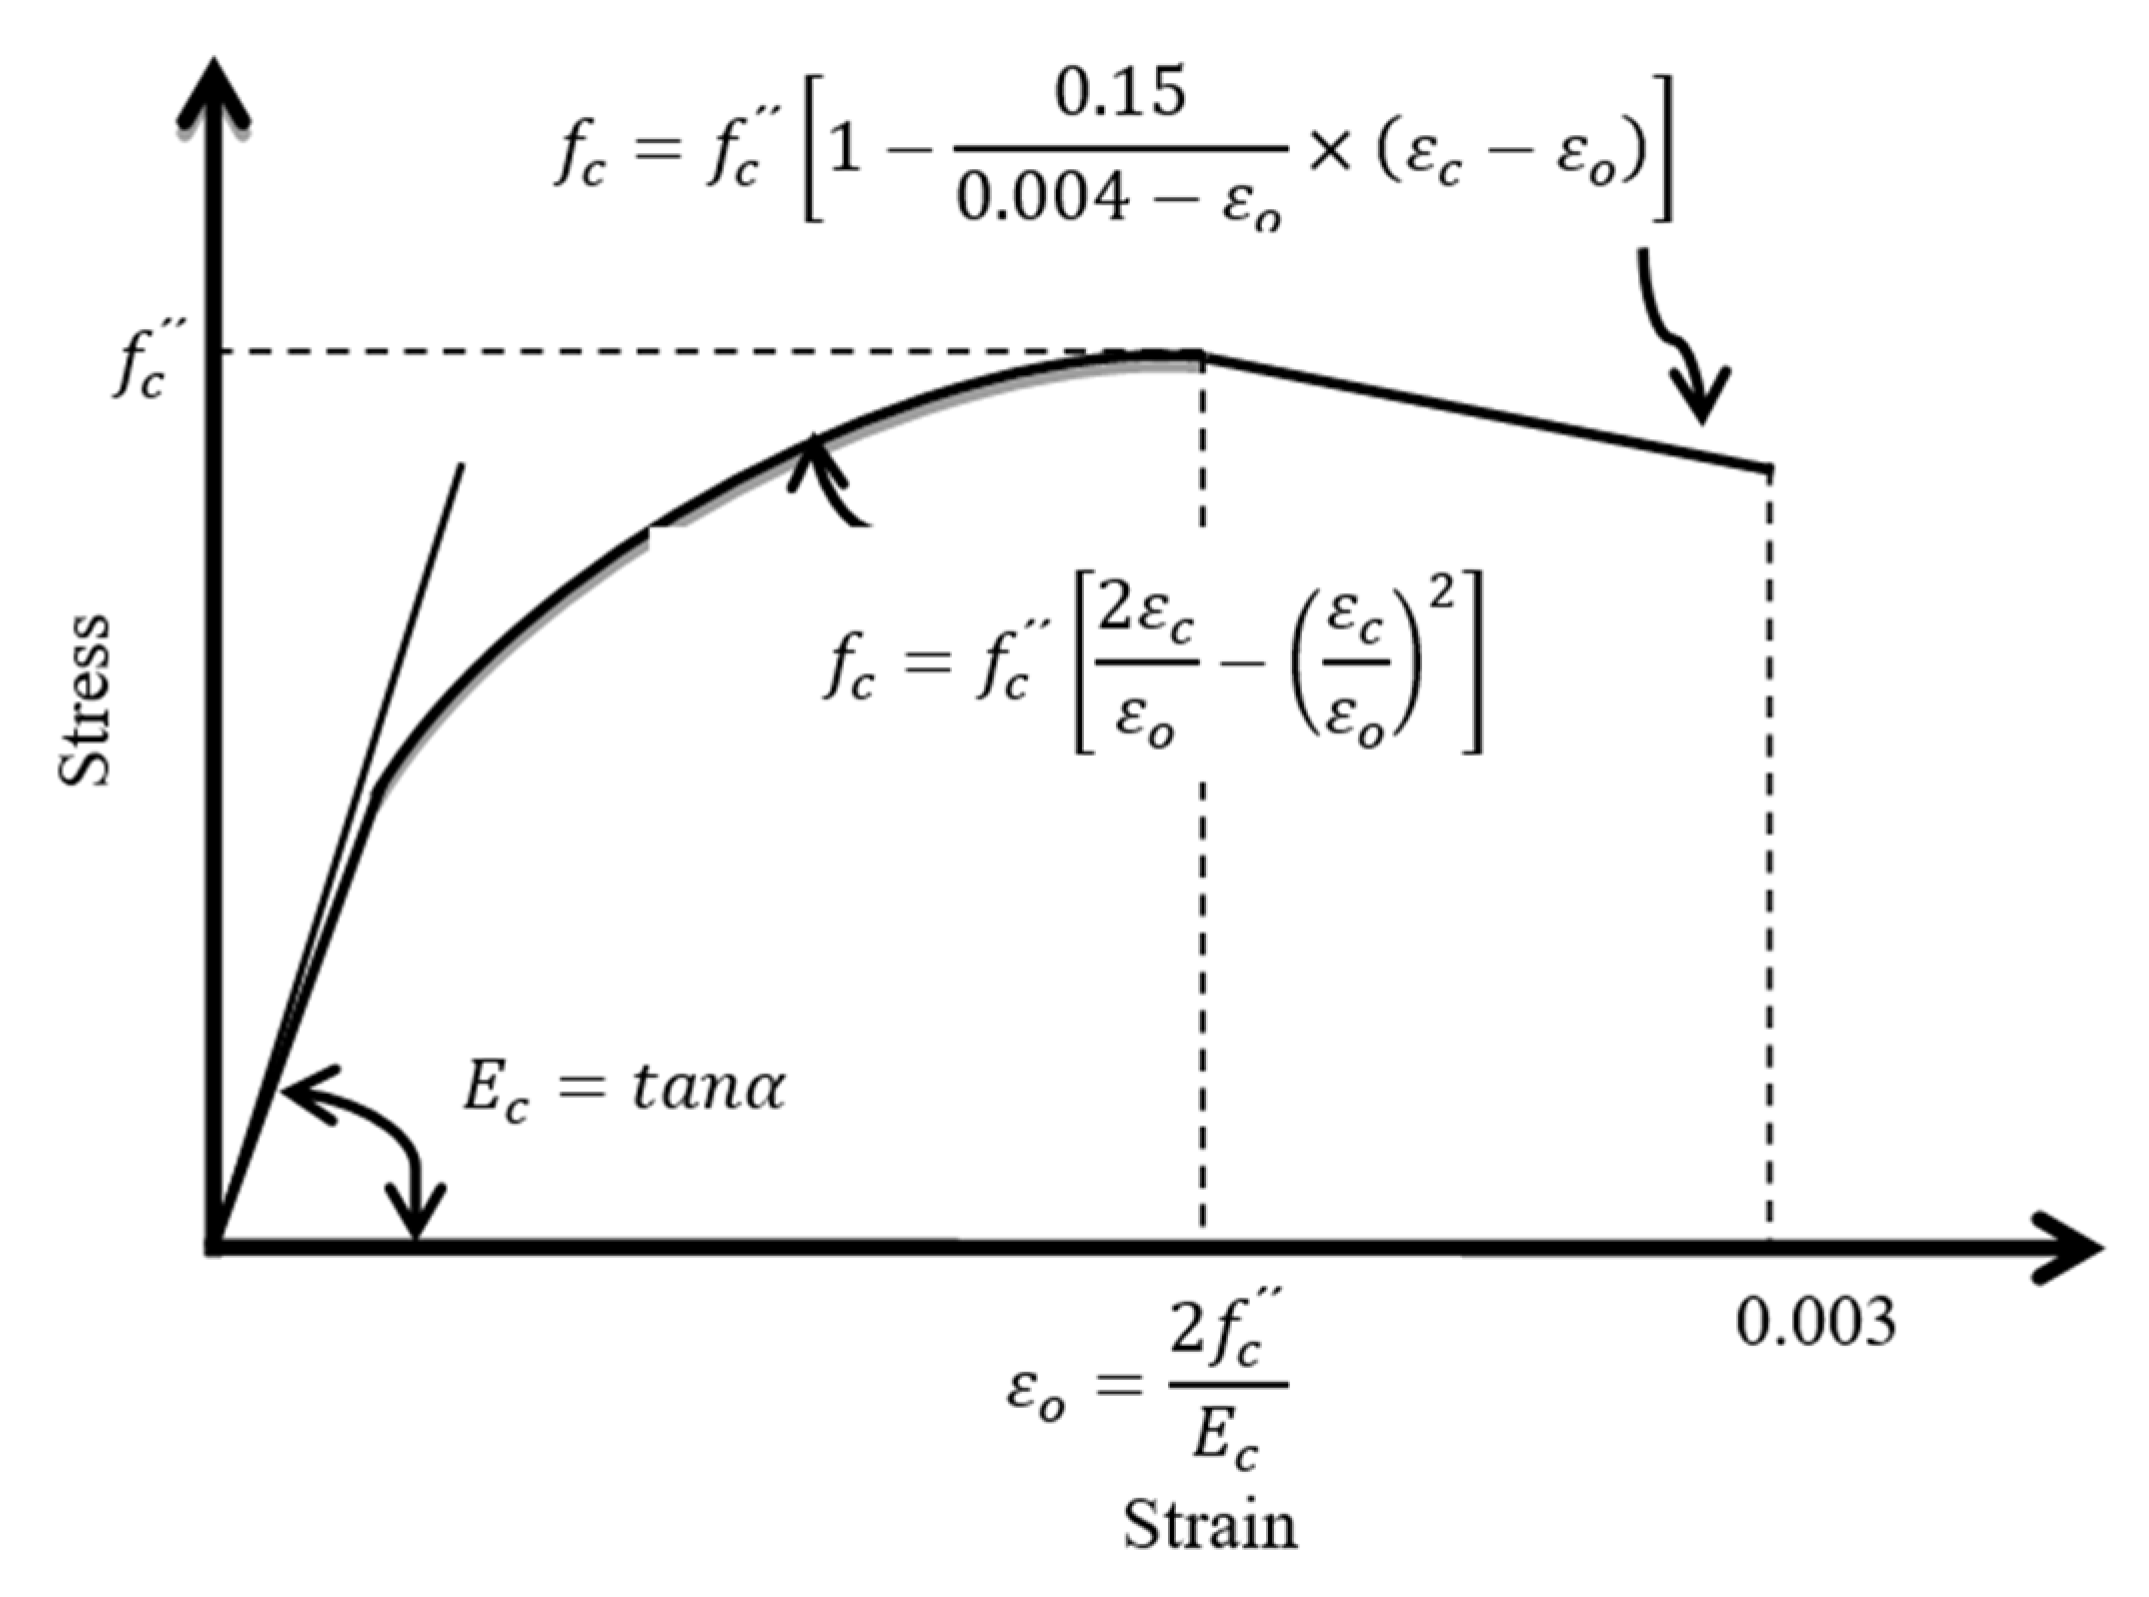
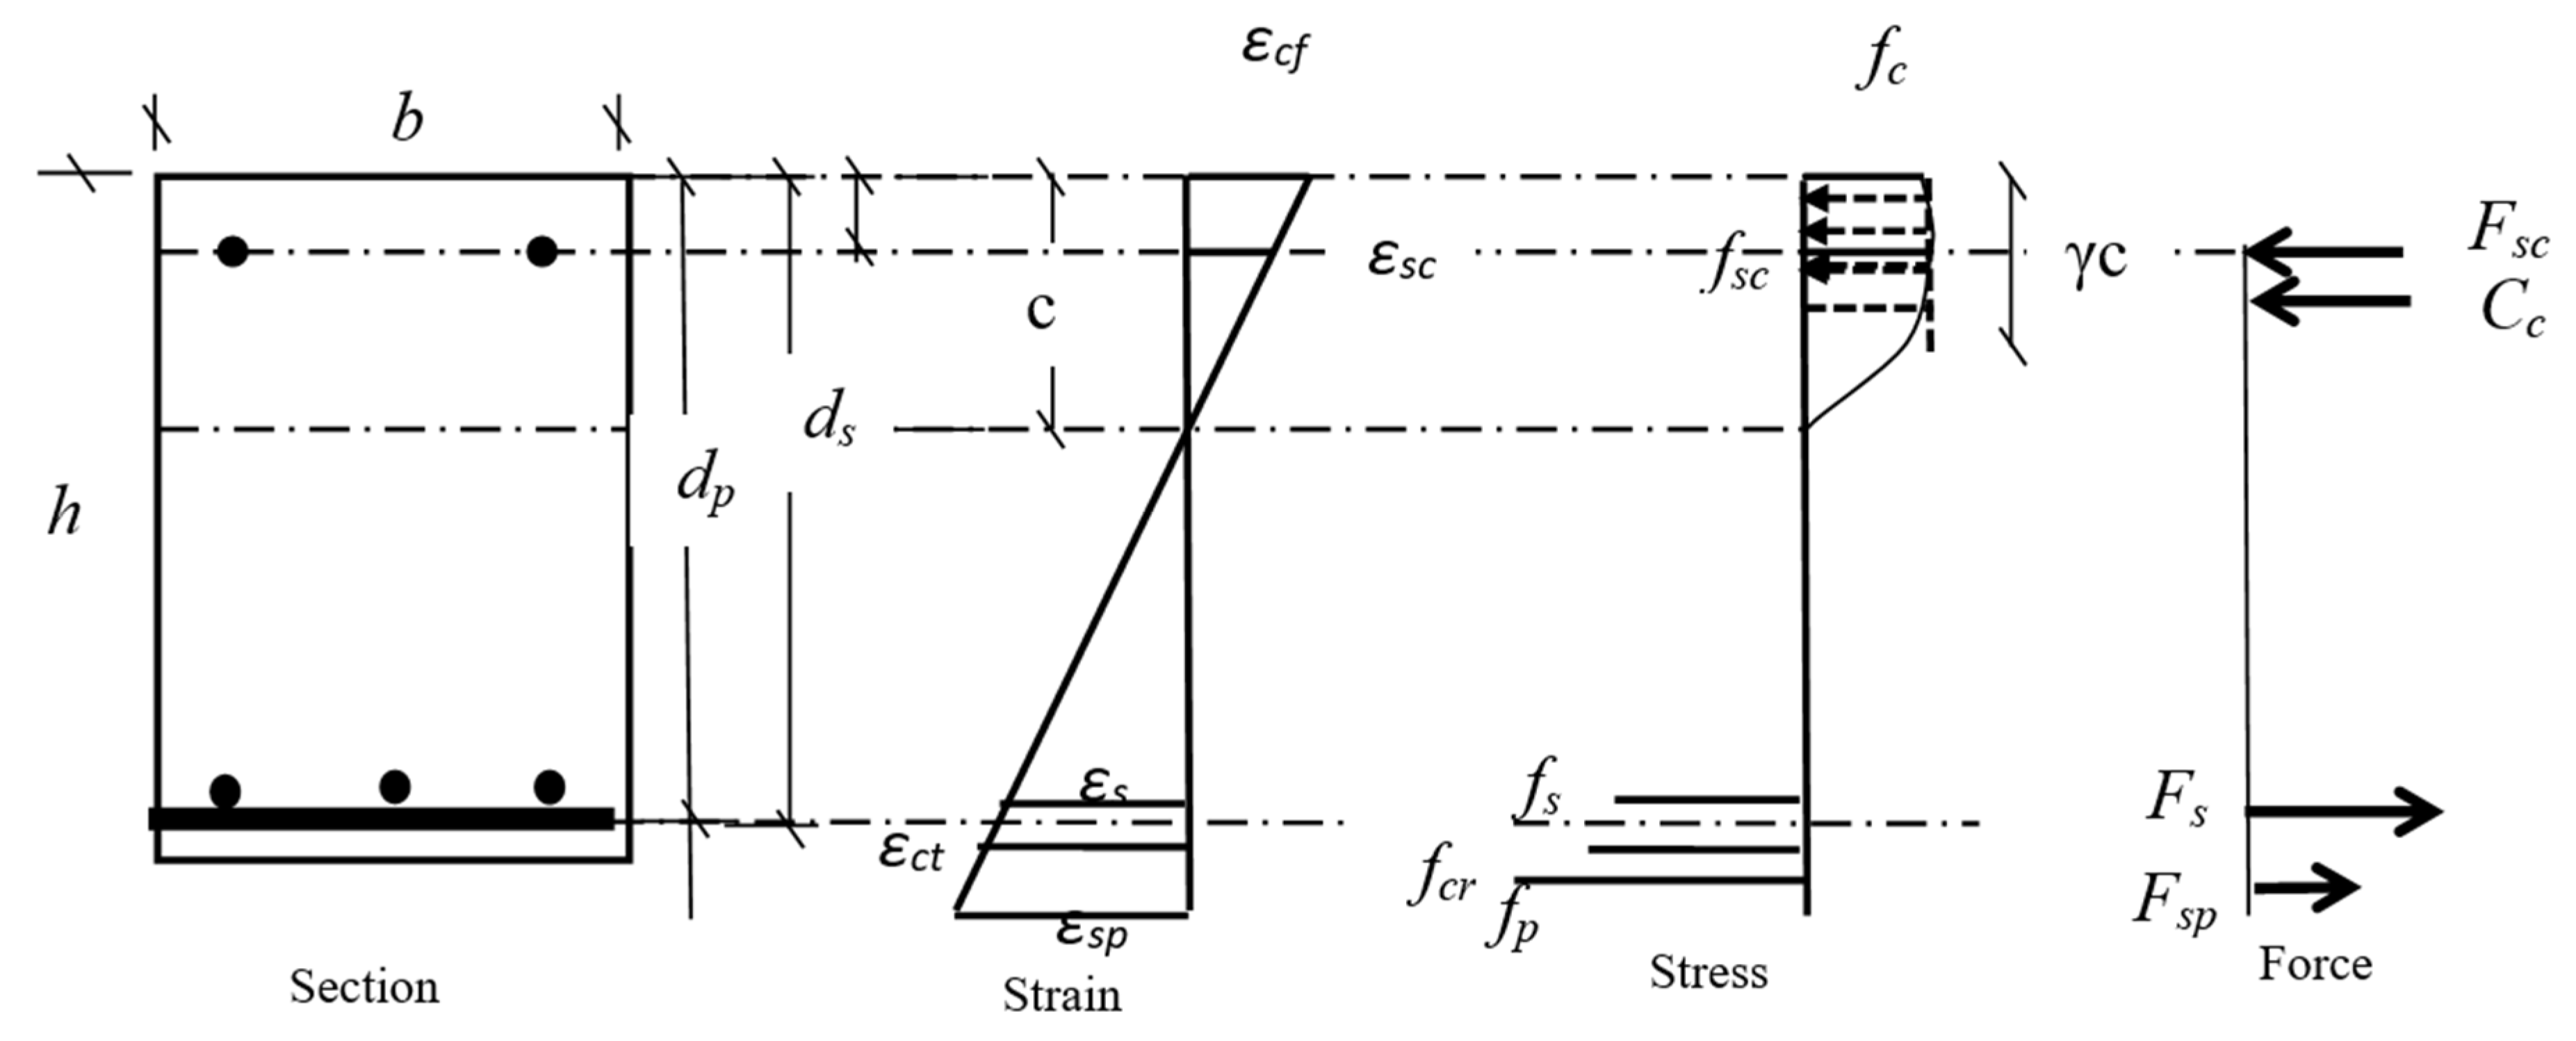
3.1. Flexural Capacity

The current model builds upon the analytical framework proposed in [1], incorporating several additional assumptions to enhance its applicability. It assumes a linear elastic behavior for the steel reinforcement up to yield, followed by strain hardening, while the uniaxial compressive behavior of concrete is defined as shown in Figure 9 [2]. The original model effectively predicts the ultimate load capacity of beams reinforced with double-layer steel bars for flexural strength and stirrups for shear resistance. To solve the governing equations, the incremental deformation technique was adopted, allowing for the stepwise determination of internal forces in the beam elements [3]. This approach relies on the stress–strain–force relationships of RC beams with rectangular cross-sections, illustrated in Figure 10. The tensile strength of concrete was neglected after cracking, while the modulus of elasticity of steel was assumed to be identical in both tension and compression.
The moment capacity was evaluated at key structural milestones: initial cracking of the concrete, yielding of steel reinforcement, and crushing of concrete. Beam failure was defined by the lowest load that triggered either steel yielding or concrete crushing. This critical load was subsequently compared with the corresponding shear strength predictions to identify the governing failure mode.
The moment capacities, strains, stresses, and curvatures at the mid-span of the RC beam were calculated using the equations provided in [4]. The parabolic stress–strain curve was transformed into a rectangular shape by applying the mean stress factor (α). Concrete stress (fc) and concrete strain (εcf) were computed in every step, as shown in Figure 9.
α = ε c f ε o ε c f 2 3 ε o 2 ,   0 ε c f < ε o 1 + ε c f ε o 1 ε c f 3 ε o ε o 2 ε c f 2 0.15 0.004 ε o ε c f 2 ε o 0.075 0.004 ε o ε o 2 ε c f ,   ε o ε c f < 0.003
The concrete stress (fc) and strain εcf were calculated at each increment (Figure 1).
f c = f c 2 ε c f ε o ε c f 2 ε o 2 ,   0 ε c f < ε o f c 1 0.15 0.004 ε o ε c f ε o ,   ε o ε c f < 0.003
ε o = 2 f c E c ,   f c = 0.92 f c u ,   E c s c = E c 1 ε c f ε o
At the mid-span of the RC beam, the calculation of moment capacities, strains, stresses, and curvatures was performed following the below equations [16]:
f s = ε s   E s   A s , 0 ε s < ε y ε t ε y × E t + ε y E s   A s , ε y ε s < ε s u
f s c = ε s c E s A s c
C c = α f c b c
C t = f c t   h c b , 0 f c t < f r 0 , o t h e r w i s e
where fs, fsc, Cc, and Ct are forces in bottom steel, top steel, concrete at the compression side, and concrete at the tension side, respectively. In the case of the bottom steel plate used as bottom reinforcement, Equation (8) is used.
f s p = ε s p   E s   A s p , 0 ε s p < ε y p ε t p ε y p × E t + ε y p E s   A s p , ε y p ε s p < ε s p u
The beam depth and width are denoted by h and b. At the same time, the neutral axis distance is represented by c, As, Asp, and Asc corresponds to the tensile steel area, tensile steel plate area, and compressive steel area, respectively. The concrete’s compressive and rupture strengths are denoted by fcu and fr, respectively. Ec represents the concrete Young’s modulus, while fct represents the concrete tensile stress. The tensile rebar steel yield, tensile steel plate yield, tensile steel Young’s modulus, steel plate Young’s modulus, and instant Young’s modulus of concrete are represented by fy, fpy, Es, Esp, and Ecsc, respectively. εs, εy, εsp, and εsu represent the strain in steel, yield strain, steel plate strain, and maximum steel strain, respectively, at the tension side. εsc and εcf are steel and concrete stains at compression sides, respectively, while εo is the concrete strain at fcu. The c value is calculated depending on the top concrete strain that was incrementally increased.
C t + F s + F s p + F s c + C c = 0
The following equations were utilized to calculate the beam’s internal moment (Mr) and corresponding curvature φ.
M r = M c t + M s p + M s + M s c + M c
φ = ε c f c
M c t =   2 3 C t h c ,     M s =   F s d s c ,   M s p = F s p d p c M s c = F s c c d s c   a n d   M c = C c c d c
where dc = 0.5β is the distance between the concrete compressive force and the top of the rectangular section (Figure 10). The position parameter (β) was obtained from Table 4 [1].
The following two equations calculated the load capacity (P) and the corresponding deflection at any given time.
P = 2 M r L s h
δ = φ 3   L 2 4   L s h 2 24
δ = P L s h 48 E I ( 3   L 2 4   L s h 2 )
where L and Lsh represent the total and shear spans of the beam, respectively [26].

3.2. Shear Capacity

To calculate the shear capacity, it was necessary to consider the contributions of the concrete and reinforcement in resisting shear forces. ACI 318 [21] provides equations that take into account material properties, cross-sectional dimensions, and loading conditions to calculate these contributions. The calculation involves determining the adequate depth of the section, which is influenced by factors like cover depth, bar diameter, and spacing between bars. In addition to shear reinforcement, the ACI 318 code also provides equations for calculating RC beams’ diagonal tension and web-crushing capacities. These equations consider concrete strength, reinforcement layout, and beam geometry. To calculate the concrete shear capacity of the RC beam, the lowest value of the following two equations governs the shear capacity.
V c = 0.16 λ f c + 17 ρ w b w d 0.29 λ f c   b w d
where:
Vc = Nominal shear strength due to concrete
f c = Compressive strength of concrete
b w = Width of web
d = Effective depth of section
ρ w = The ratio between areas of tensile reinforcement to beam cross section.
Equations (11)–(14) from ACI 318 can also be utilized to determine the shear capacity of stirrups in a concrete beam.
V s = A s f y t d s
where:
V s = Nominal shear strength due to stirrups
A s = Area of vertical branches of stirrups
f y t = Yield strength of stirrups
d = Effective depth of section
s = Spacing between stirrups
Once the shear capacities of both the concrete and the stirrups are determined, the governing shear mechanism can be identified, which ultimately defines the beam’s total shear capacity. This evaluation provides critical insight into whether the beam satisfies safety requirements and can sustain the expected loading conditions without failure.

3.3. Analytical Results

From the previous two subsections, the flexural and shear capacity of the beams with different forms of tension and shear reinforcement was calculated (as listed in Table 5). The final calculated theoretical capacity of the beams was chosen as the minimum of the predicted flexural and shear capacity (Table 5). The theoretically proposed analysis could predict the experimental capacity with good agreement (average 107.9% and standard deviation = ±9.8). The maximum difference was for beams S1mRTB (24.9%) and S1m-RTP (17.9%), while the rest of the beams showed 2.8% as the maximum difference in the load capacity (Table 5). The analytical model was more efficient in predicting the Group 2 beam capacity, which had a longer span and higher depth than those of Group 1 beams. The previous model could be recommended to analytically predict the flexural and shear capacity of long deep beams.

4. Numerical Analysis

4.1. Program and the Constitutive Parameters

A numerical investigation was conducted to gain a deeper understanding of the beam’s behavior using finite element (FE) analysis [12]. The FE model, developed in ABAQUS [27], was validated against experimental results and used for an in-depth parametric study. The Concrete Damage Plasticity (CDP) model [28,29,30,31,32,33,34] was employed to simulate the nonlinear behavior of concrete, with yield surface hardening parameters defined based on the plasticity model by Lubliner et al. [35]. Compression and tension test data were used to calibrate the concrete’s stress–strain response. Four steel bar diameters (8 mm to 14 mm) were selected for the simulation.

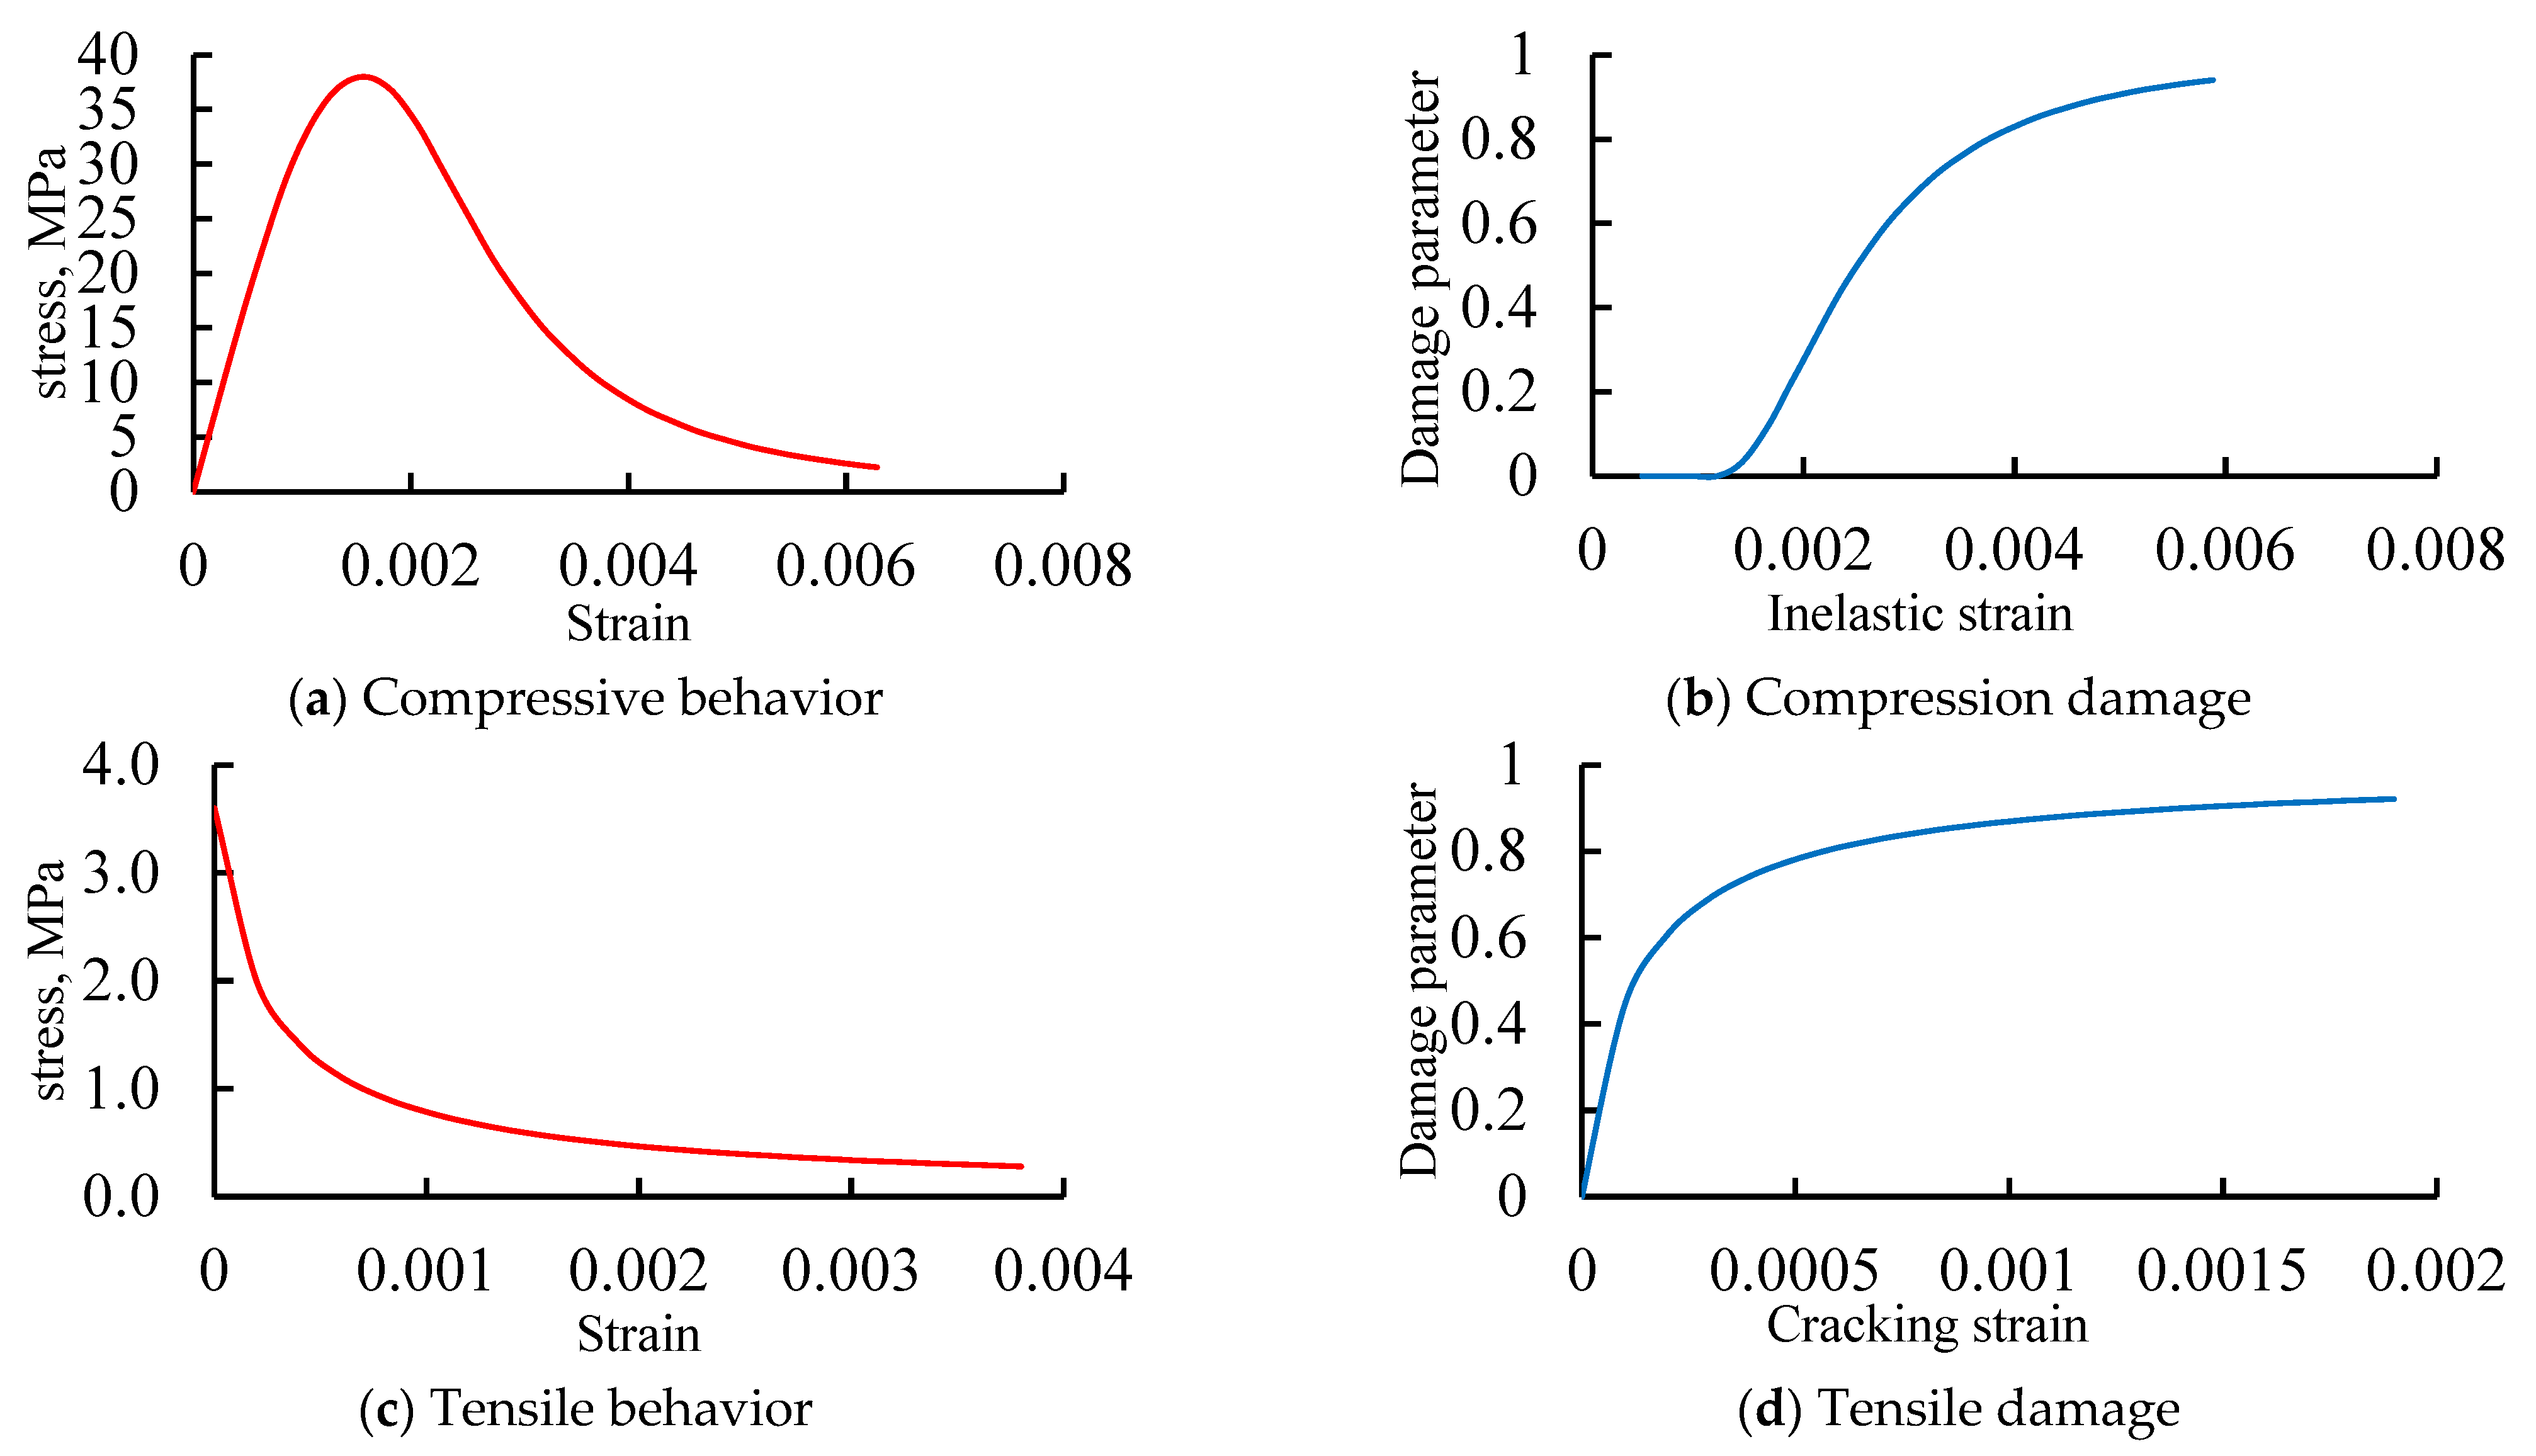
4.2. Materials and Sensitivity Analysis

The beams were modeled with a full bond assumption between the steel plate or concrete element and shear studs. The characteristics of steel bars, concrete, and steel plate elements influenced failure in these beams. Concrete was represented as a brittle material in the sensitivity analysis using the ABAQUS Concrete Damage Plasticity (CDP) model [27]. The CDP model provided better computation convergence and less numerical error than the smeared crack model. The CEB-FIB code was utilized to calculate stress–strain relations of brittle materials, as shown in Figure 11. Considering factors like tensile and compressive failure, the CDP model accurately captured the actual behavior. Concrete in compression was simulated based on the stress–strain relationship proposed by Carreira and Chu [28]. In contrast, concrete in tension, both pre- and post-cracking, was simulated as in [36,37,38]. Figure 11 illustrates the stress–strain relationship of typical concrete under tensile and compressive stress for numerical modeling. Extensive research was conducted to determine the most appropriate values of the constitutive parameters (μ, ψ, Kc, fbo/fco, e) in the CDP model for normal concrete. The analysis involved testing various viscosity (μ) values ranging from 0.00 to 1.00 × 10⁻⁴. Previous studies [28,39,40,41] indicated that achieving a zero-value outcome is acceptable instead of using higher μ values. Researchers have confirmed that the recommended dilation angle (ψ) is 35° [37,42], which was confirmed through the sensitivity analysis. As mentioned earlier [41,43,44,45,46,47], the Kc value typically falls between 0.64 and 0.80; sensitivity analysis backed the default value of 0.66 in ABAQUS [27]. In line with other studies [38,39], the fbo/fco ratio ranged from 1.10 to 1.16; nonetheless, this study reported a value of 1.16, which was recommended as the default value by ABAQUS [27]. The software’s default value of e = 0.1 was adopted in the current model. The compressive stress–strain (fc-ε) relationship in Figure 11 [28] was calculated using Equation (18).
f c = f c β ( ε ε 0 ) β 1 + ( ε ε 0 ) β
The variable β is dependent on the form of the fc-ε diagram, while fc′ and ε0 represent the cylindrical compressive strength and strain at ultimate concrete strength. Equations (19) and (20) can be utilized to calculate the compression damage and tension parameters (dc and dt, respectively) using the maximum compressive strain (εc), plastic strain (εtP), maximum tensile strain (εt), and cracking strain (εtc) [27].
d c = 1 σ c E 0   ε c ε c P
d t = 1 σ t E 0   ε t ε t P
Steel behavior was modeled using a bi-linear elastic–plastic approach for tension response, with properties, such as modulus of elasticity (E), Poisson’s ratio (υ), yield, and maximum strength (Figure 12). A sensitivity analysis was conducted with experimental data to finetune CDP parameters and mesh size for accurate results. The mesh size of 15 mm was used among the checked sizes (10, 15, 20, and 25 mm) for modeling beams based on the performed sensitivity analysis. The viscosity parameter (μ) was set to 0. The dilation angle ψ for concrete beams was 35°, while other parameters remained unchanged.

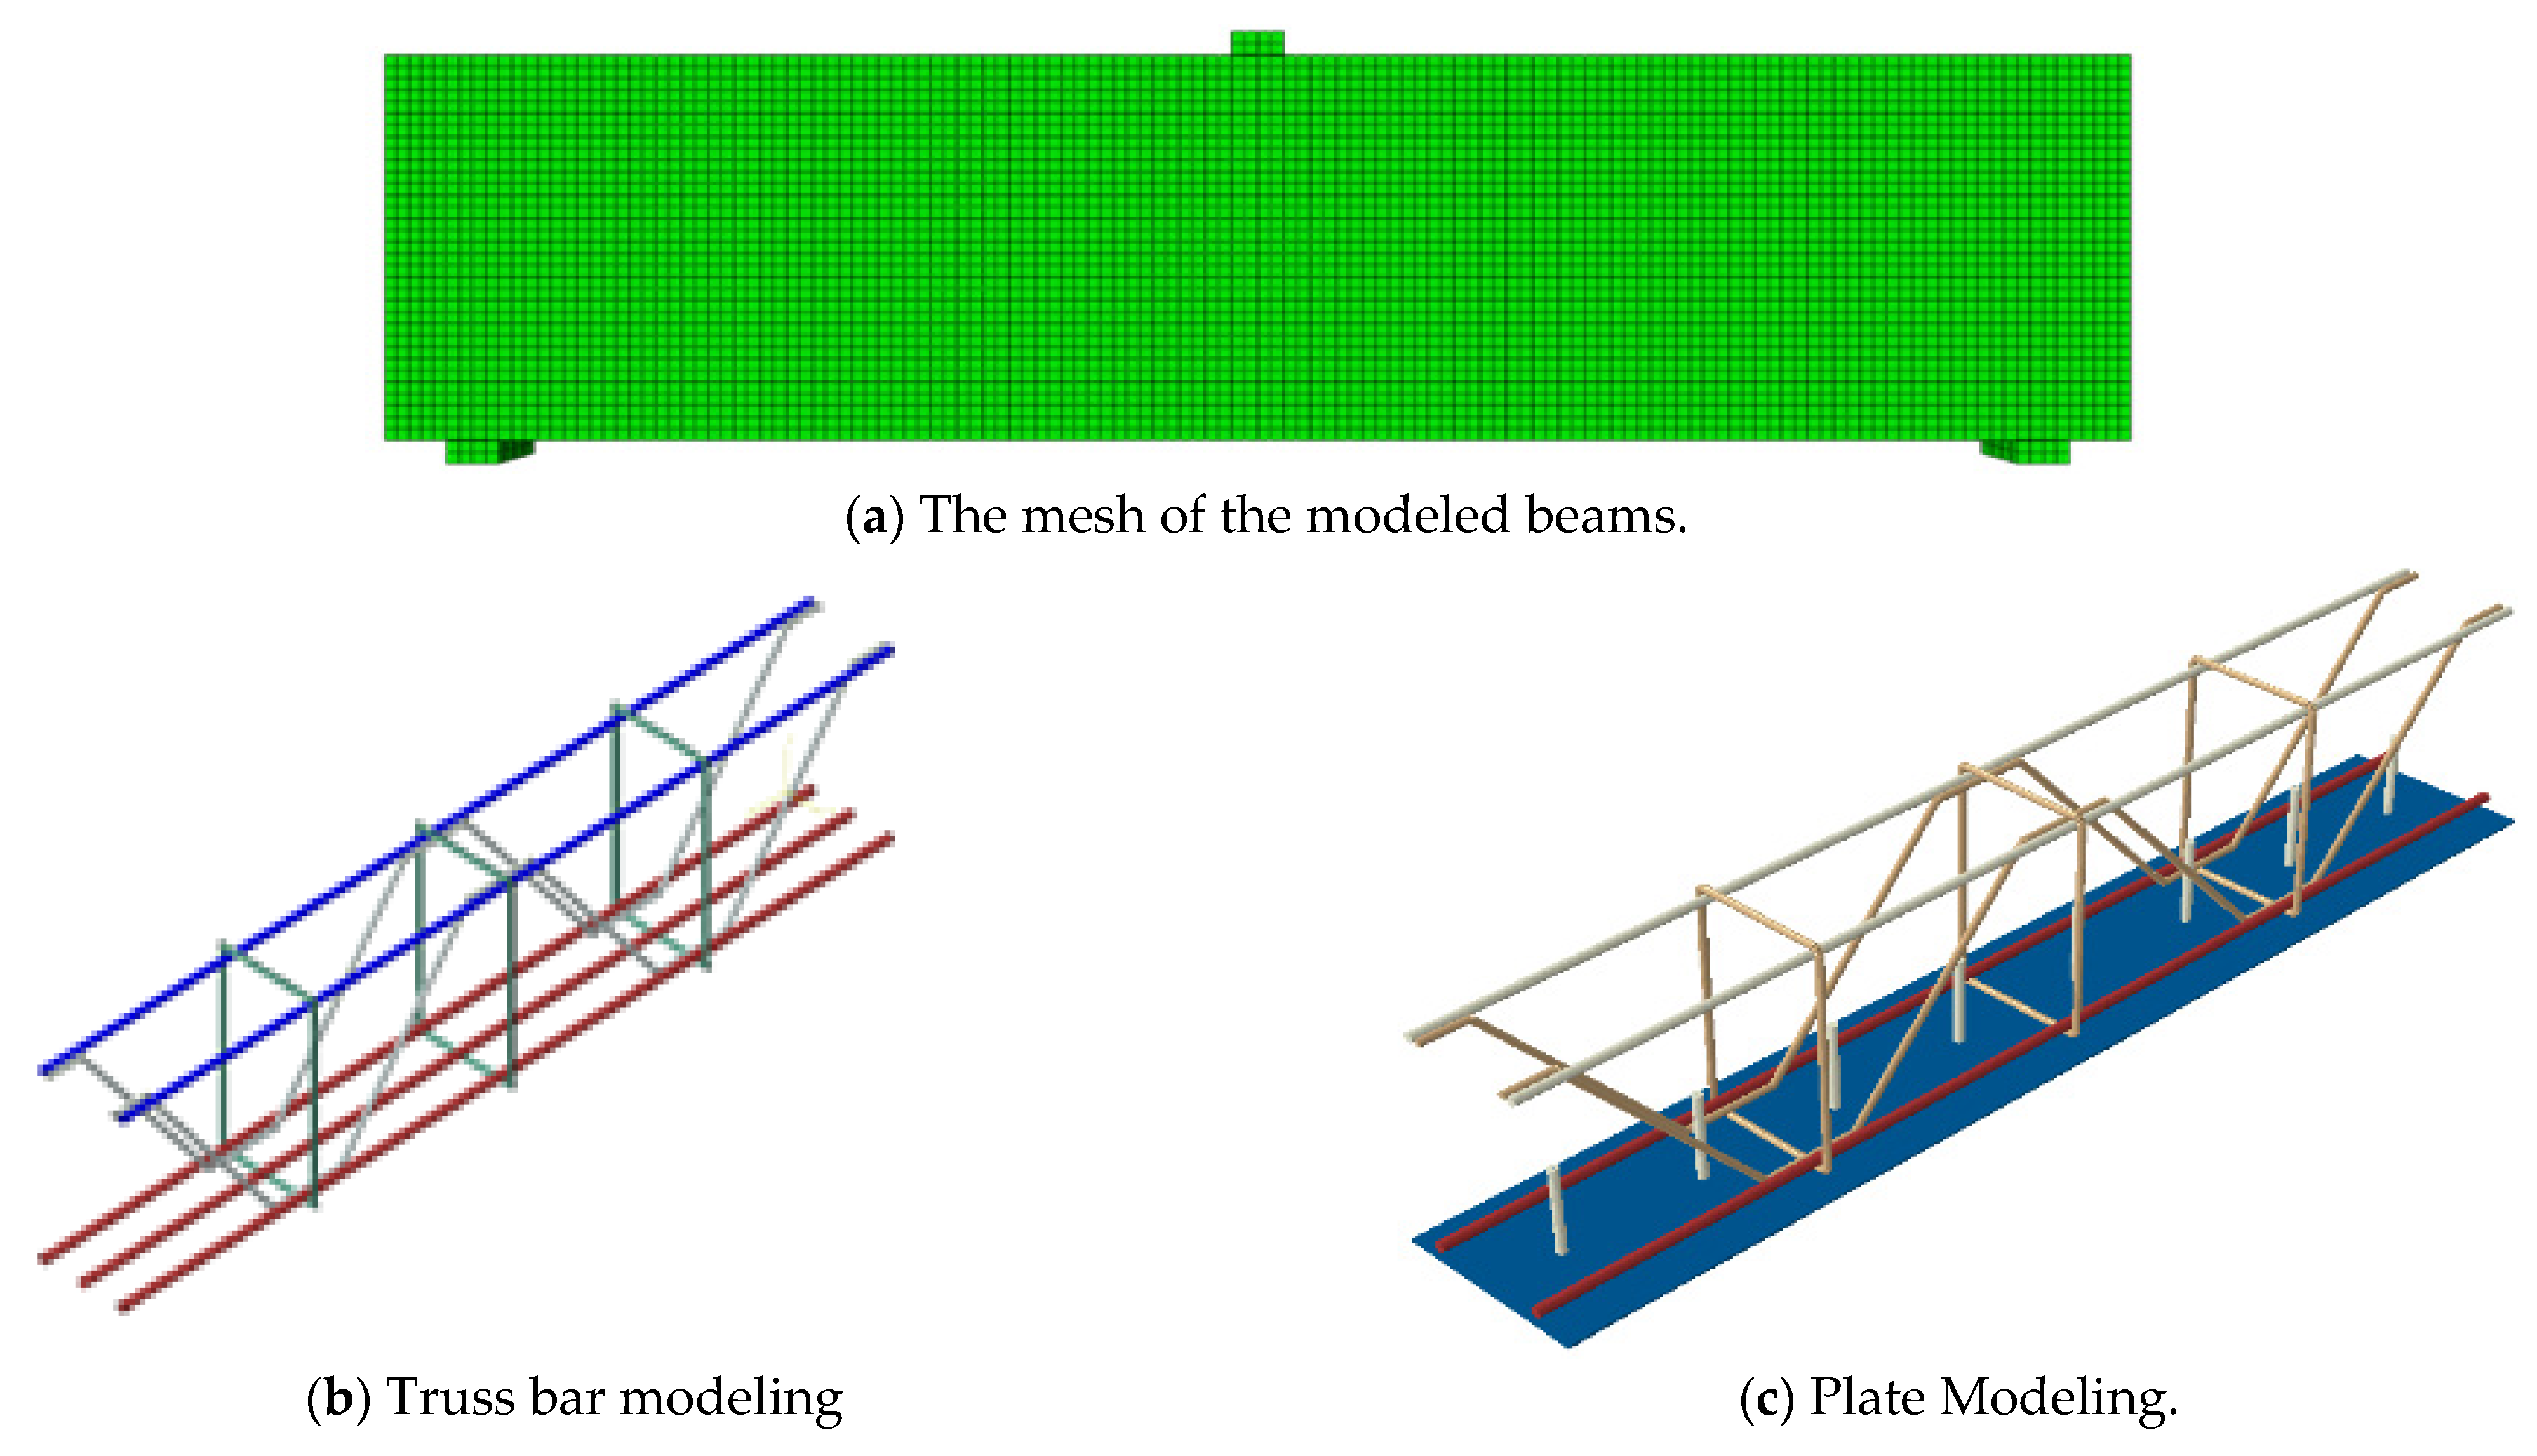
4.3. Model Built-Up and Boundary Conditions

A nonlinear three-dimensional finite element (FE) model was developed to analyze the behavior of RC beams in Groups 1 and 2 under static monotonic loading until failure. The RC beams and thick steel loading plates were meshed using C3D8R elements (eight-node linear hexahedral solid elements with reduced integration) in ABAQUS. Steel reinforcement bars were modeled using T3D2 elements (two-node linear truss elements), while thin steel plates were represented by S4R elements (four-node shell elements with reduced integration). Thick loading plates were also modeled using C3D8R elements.
Boundary conditions were applied via reference points using the rigid body constraint: a displacement-controlled loading system was applied at the loading plate reference point, while roller and hinge supports were assigned to the support plates. The interaction between internal steel reinforcement and concrete was simulated using the embedded region constraint, where steel elements were treated as embedded within the concrete host elements, assuming a perfect bond.
A mesh size of approximately 15 mm was used, providing a balance between computational efficiency and accuracy. The meshing configuration for concrete, reinforcement, and steel plates is illustrated in Figure 13, which shows the detailed FE model geometry and discretization.
The steel truss bars were modeled as embedded elements within the concrete beam, which served as the host region. To simulate the interaction between the steel plate and the underside of the concrete beam, a surface-to-surface tie constraint was applied. In this setup, the steel plate surface was designated as the slave surface, while the concrete surface was defined as the master surface. Following the approach in [38], the top surface of the steel plate was assigned as the subordinate surface, with the corresponding concrete interface as the dominant surface. Stud connectors were modeled similarly to steel bars using embedded element constraints, ensuring full bond behavior. A sensitivity analysis was conducted, and model parameters were calibrated using the experimental and numerical results from beam S2m-RTP, which was reinforced with both a steel plate and truss bars. The experimental data from beam S2m-RTB were used to validate the Concrete Damage Plasticity (CDP) parameters and mesh size, confirming the reliability of the chosen modeling approach for simulating the behavior of the tested RC beams.

4.4. FE Model Validation

Figure 14 illustrates a comparison between FE and experimental P-δ curves, while Table 6 shows the loads and failure mode comparison of the simulated beams. The P-δ curves, load capacities, and failure characteristics (cracks and failure modes) of the FE findings were compared to their corresponding experimental ones. The developed FE models could capture, with good precision, the experimental load capacities, load–deflection curves, and modes of failure (Table 6 and Figure 14 and Figure 15). The average ratio between the FE and the experimental load capacity was 105.7% with a standard deviation of ±2.0. Moreover, Figure 16 illustrates the stress imposed on the truss bar at the termination of the crack development phases, indicating that the truss can withstand a certain proportion of the applied shear stress. Additionally, Figure 16b showcases a comparison between FE cracks and experimental crack mapping of the tested beam S1m-RTP. The results indicated that the FE model could capture nearly identical behaviors and crack patterns of the tested beams, with only a tiny difference observed in load and stiffness, which was due to the presence of internal defects and voids in the experimental specimens. Therefore, based on these results, the FE model successfully simulated RC beams.

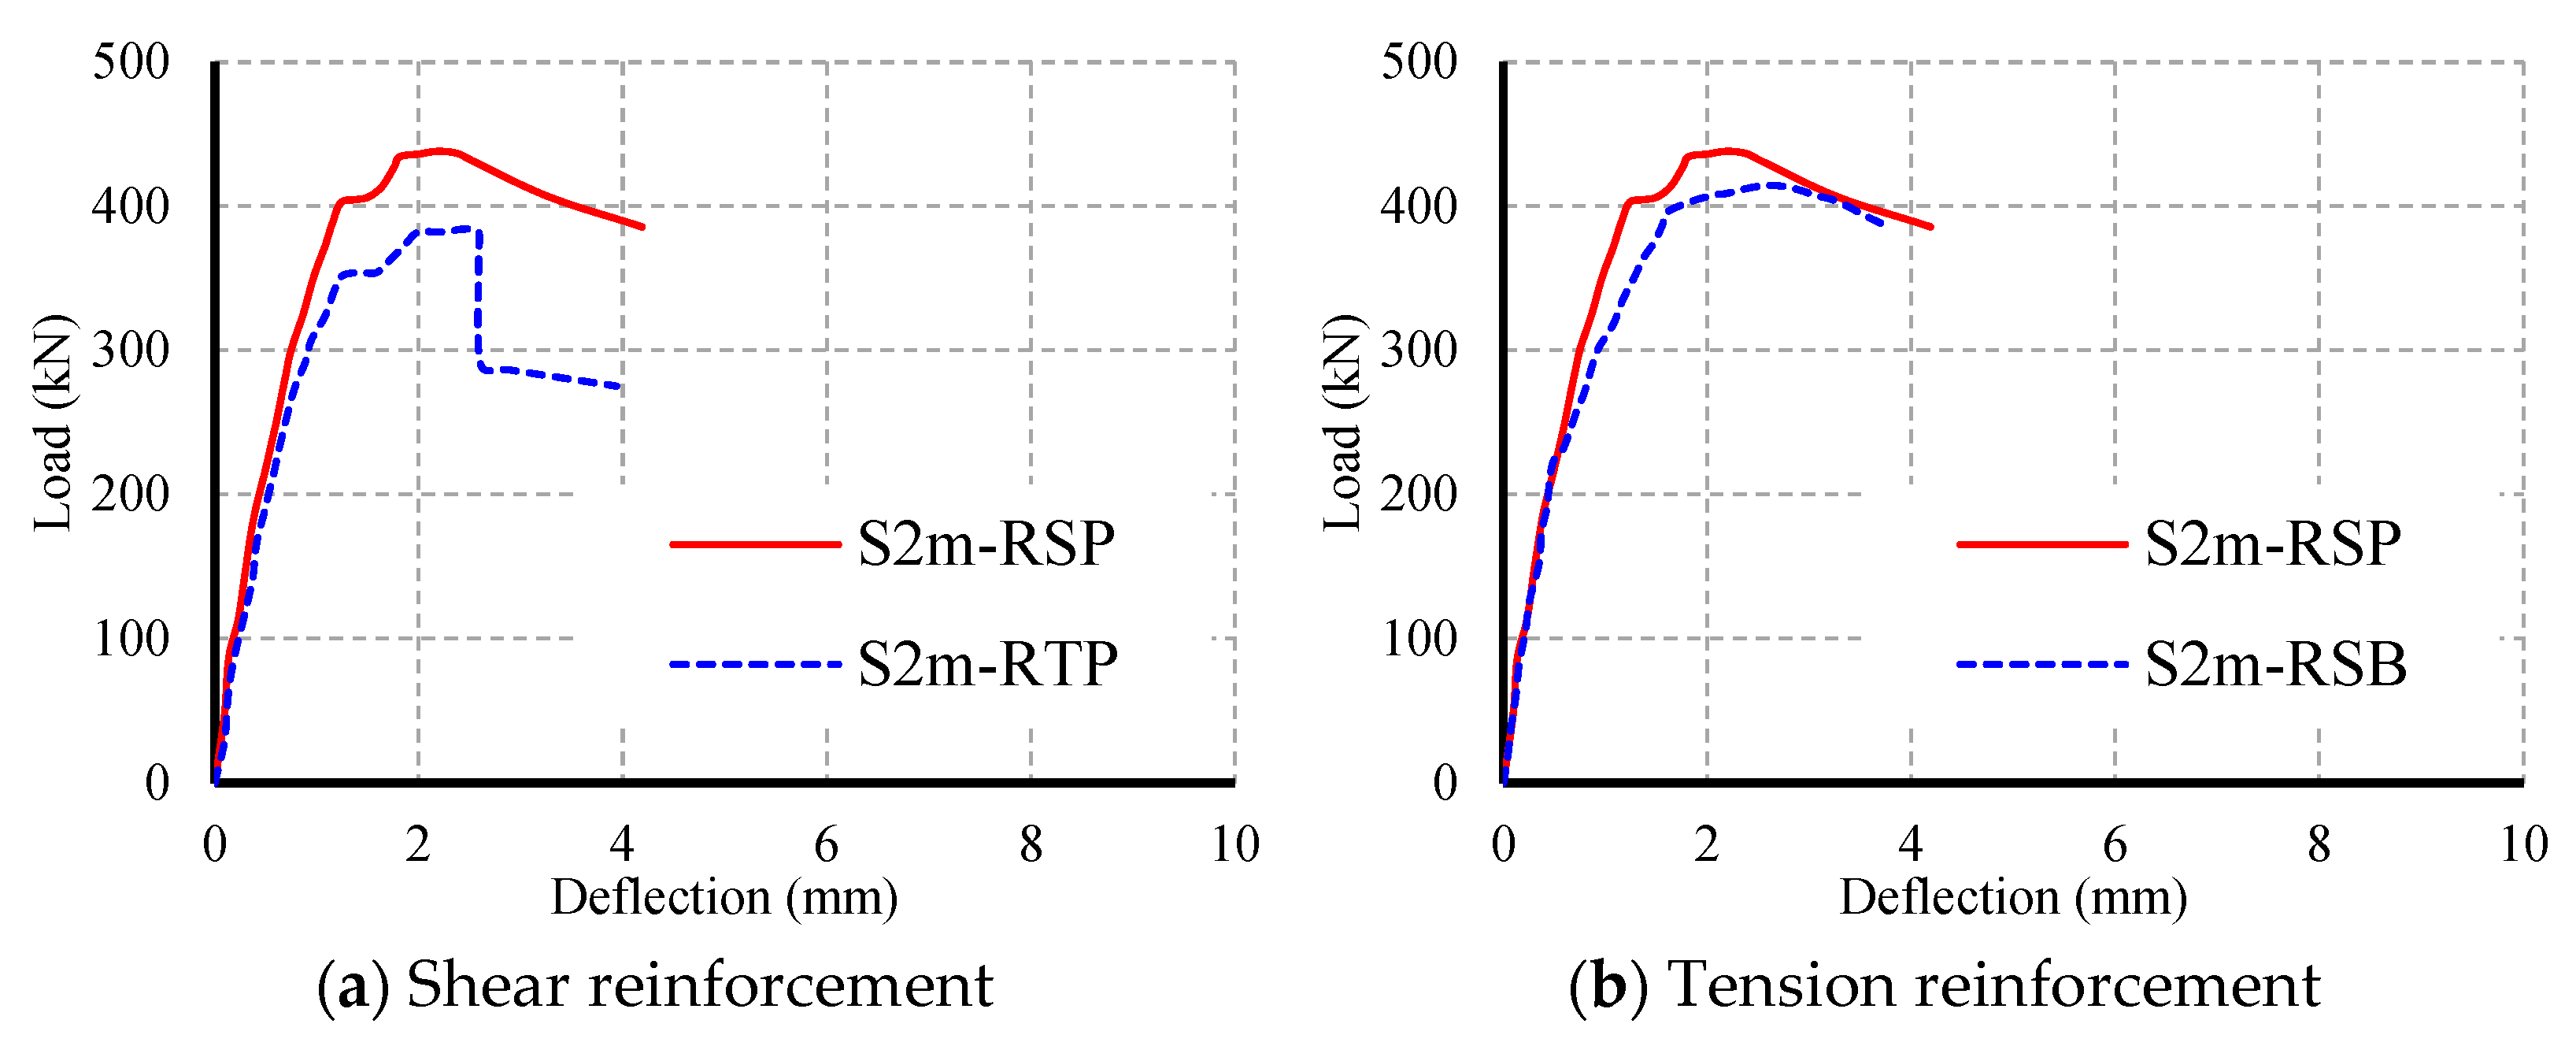
4.5. Parametric Study

The investigation aimed to test how additional parameters affected the behavior of the concrete beam reinforced with a steel plate and truss bar shear. The verified model was used to provide valuable insights into its behavior under different parameters. Factors such as the shear resistance steel bar configuration and plate-yielding stress were investigated. Therefore, this research specifically investigates the influence of these factors on the structural behavior of the S2m-RTP specimen, as summarized in Table 7.

4.6. Results of the Parametric Study

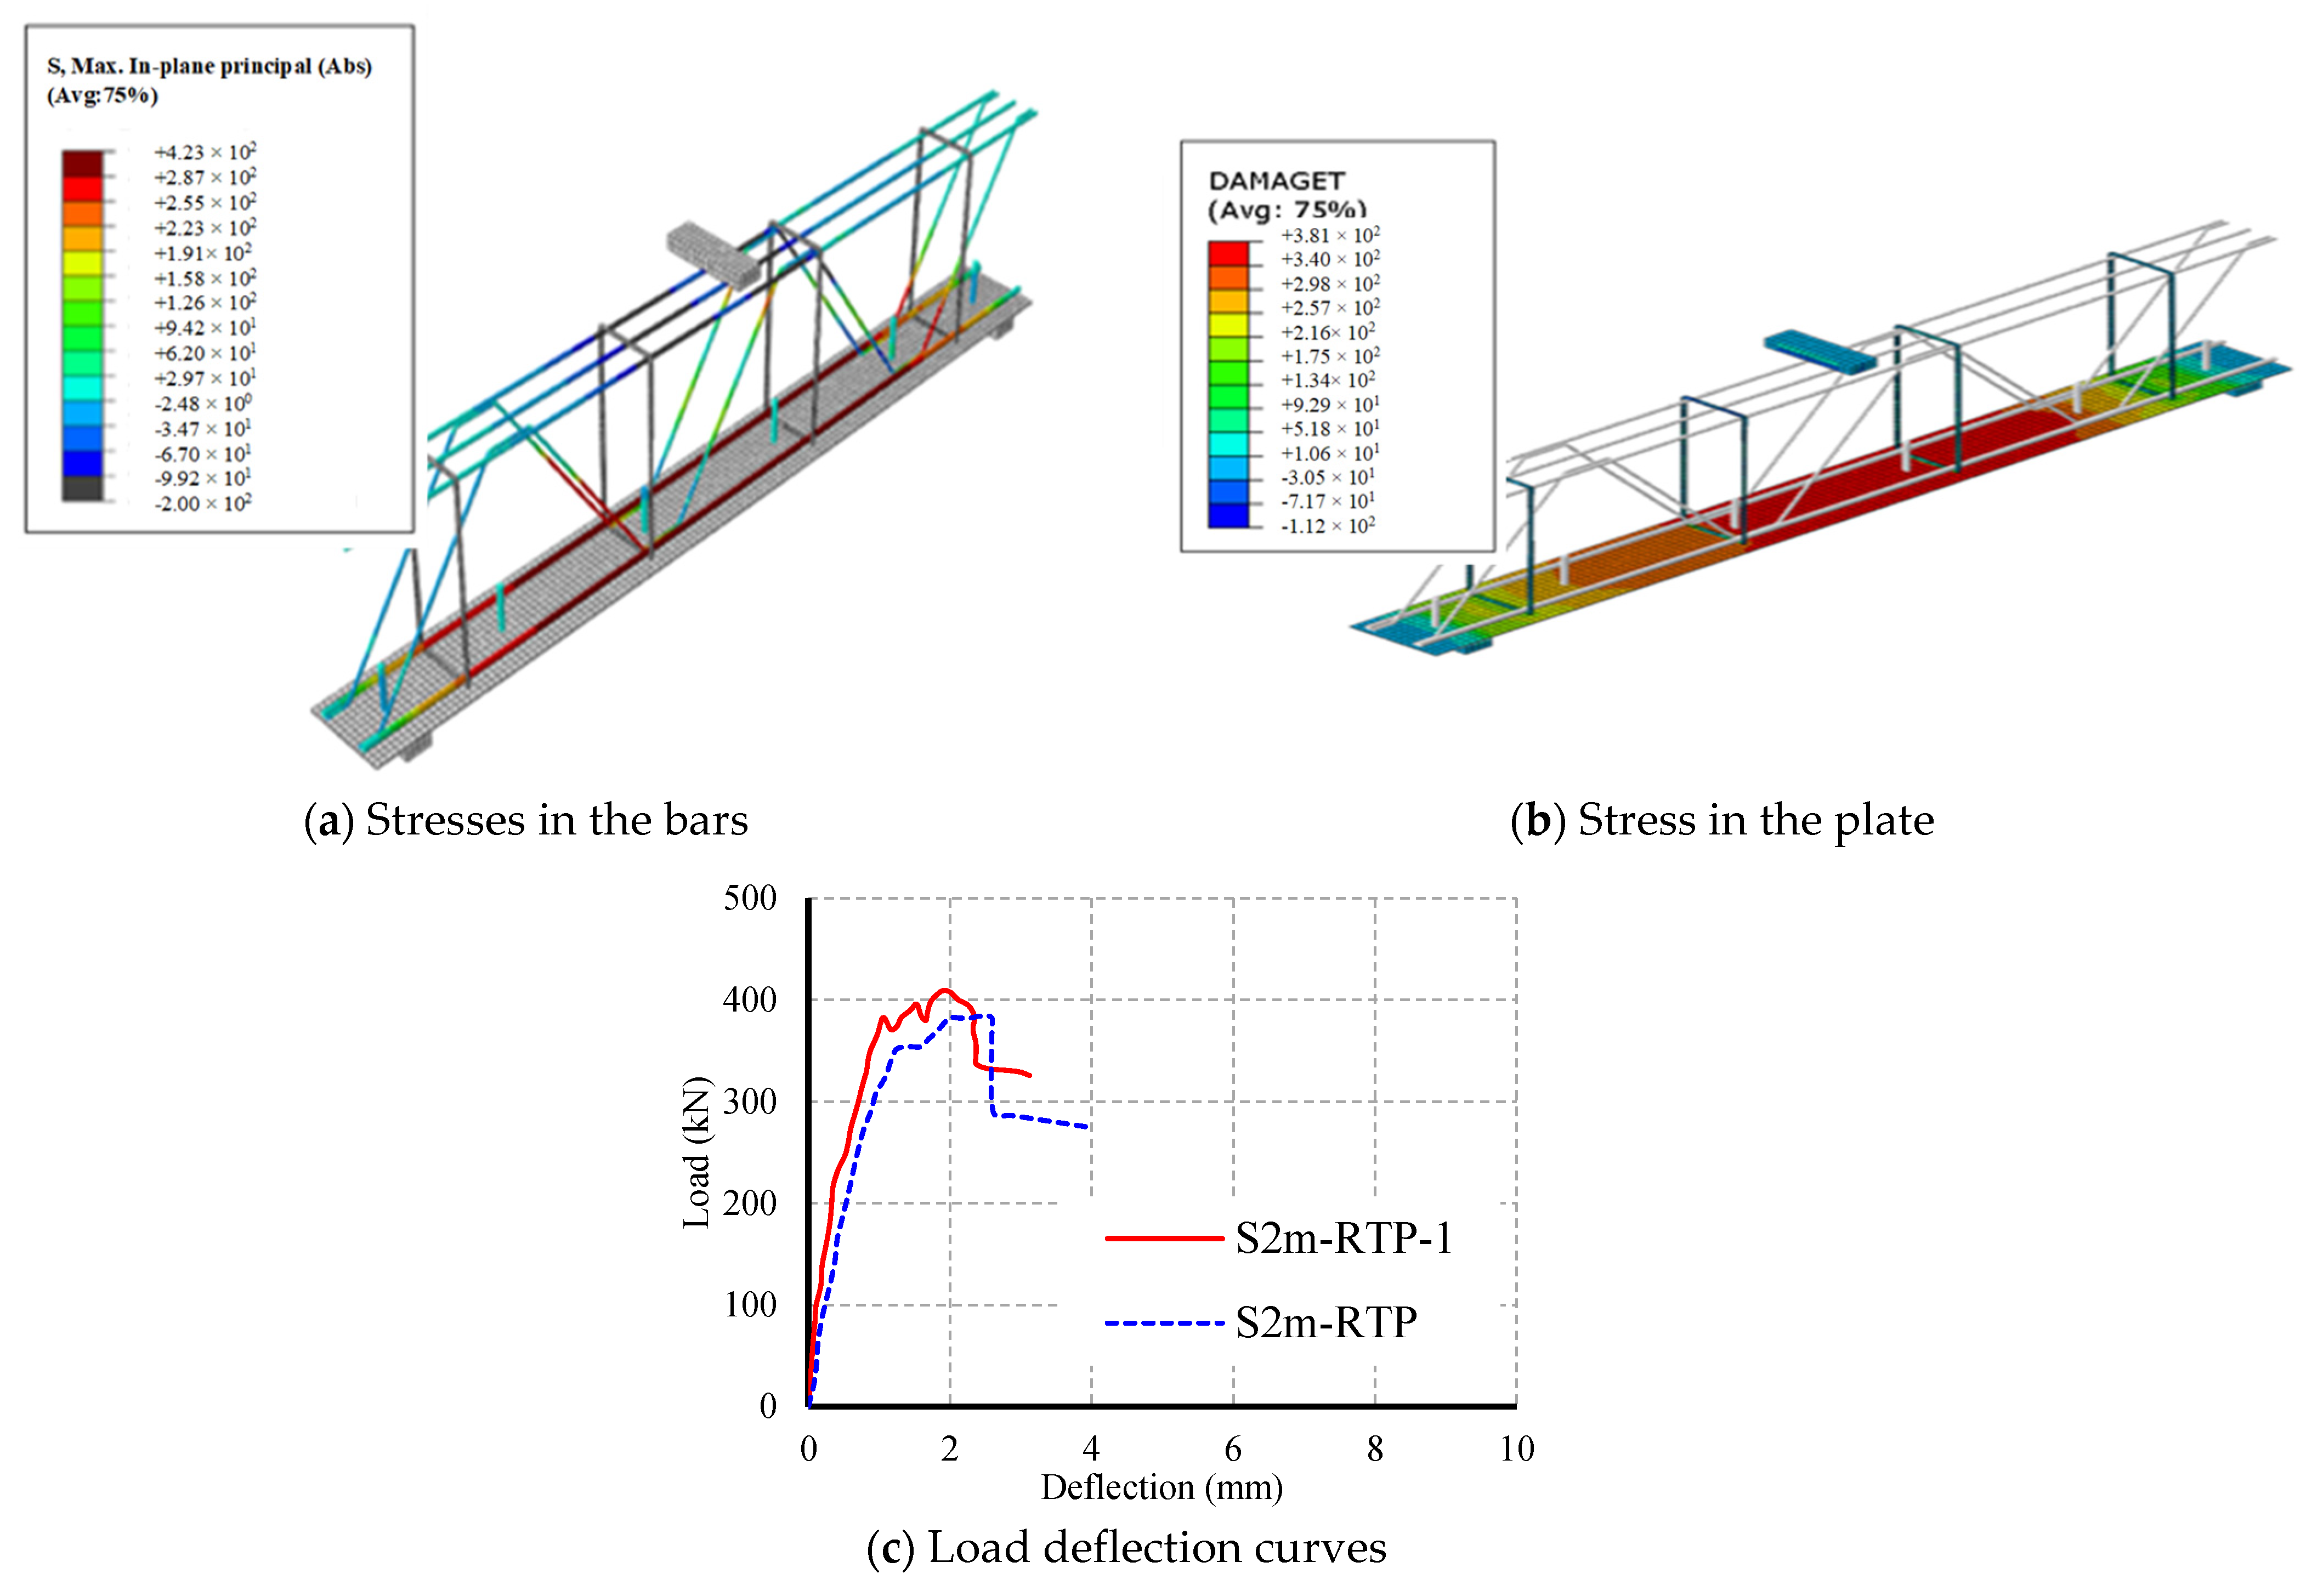
4.6.1. Evaluating the Impact of Truss Bars and Stirrups

Modifying the tension reinforcement, either by increasing the bar diameter or steel plate thickness, did not yield the expected improvement in load capacity due to the dominant failure mode being a combination of strut-and-tie and shear failure. Although failure began through the strut-and-tie mechanism, it ultimately transitioned to shear failure, indicating that enhancing tensile capacity alone was insufficient to prevent premature shear failure. This behavior highlights the critical role of the truss shear bars, which appeared less effective in distributing shear forces across the span.
To investigate this further, a comparative finite element (FE) analysis was conducted by replacing the truss bars with conventional stirrups. As shown in Figure 16, this modification led to a 14% increase in ultimate load capacity and a transition from shear to flexural failure (Figure 16a), along with a noticeable improvement in stiffness. When combining stirrups with a steel plate, the beam showed a 5% increase in load capacity compared to the stirrup-only configuration (Figure 16b).
Moreover, as illustrated in Figure 14b, the beam reinforced with a steel plate and stirrups performed slightly better than one reinforced with steel bars and stirrups, despite the plate’s 20% lower yield strength. This emphasizes the need to further investigate the yielding behavior of steel plates and its influence on overall capacity. The results suggest that the truss bar configuration was less effective in resisting shear over the full span. Future research is recommended to explore alternative truss geometries, such as N-shaped trusses, to enhance shear performance.

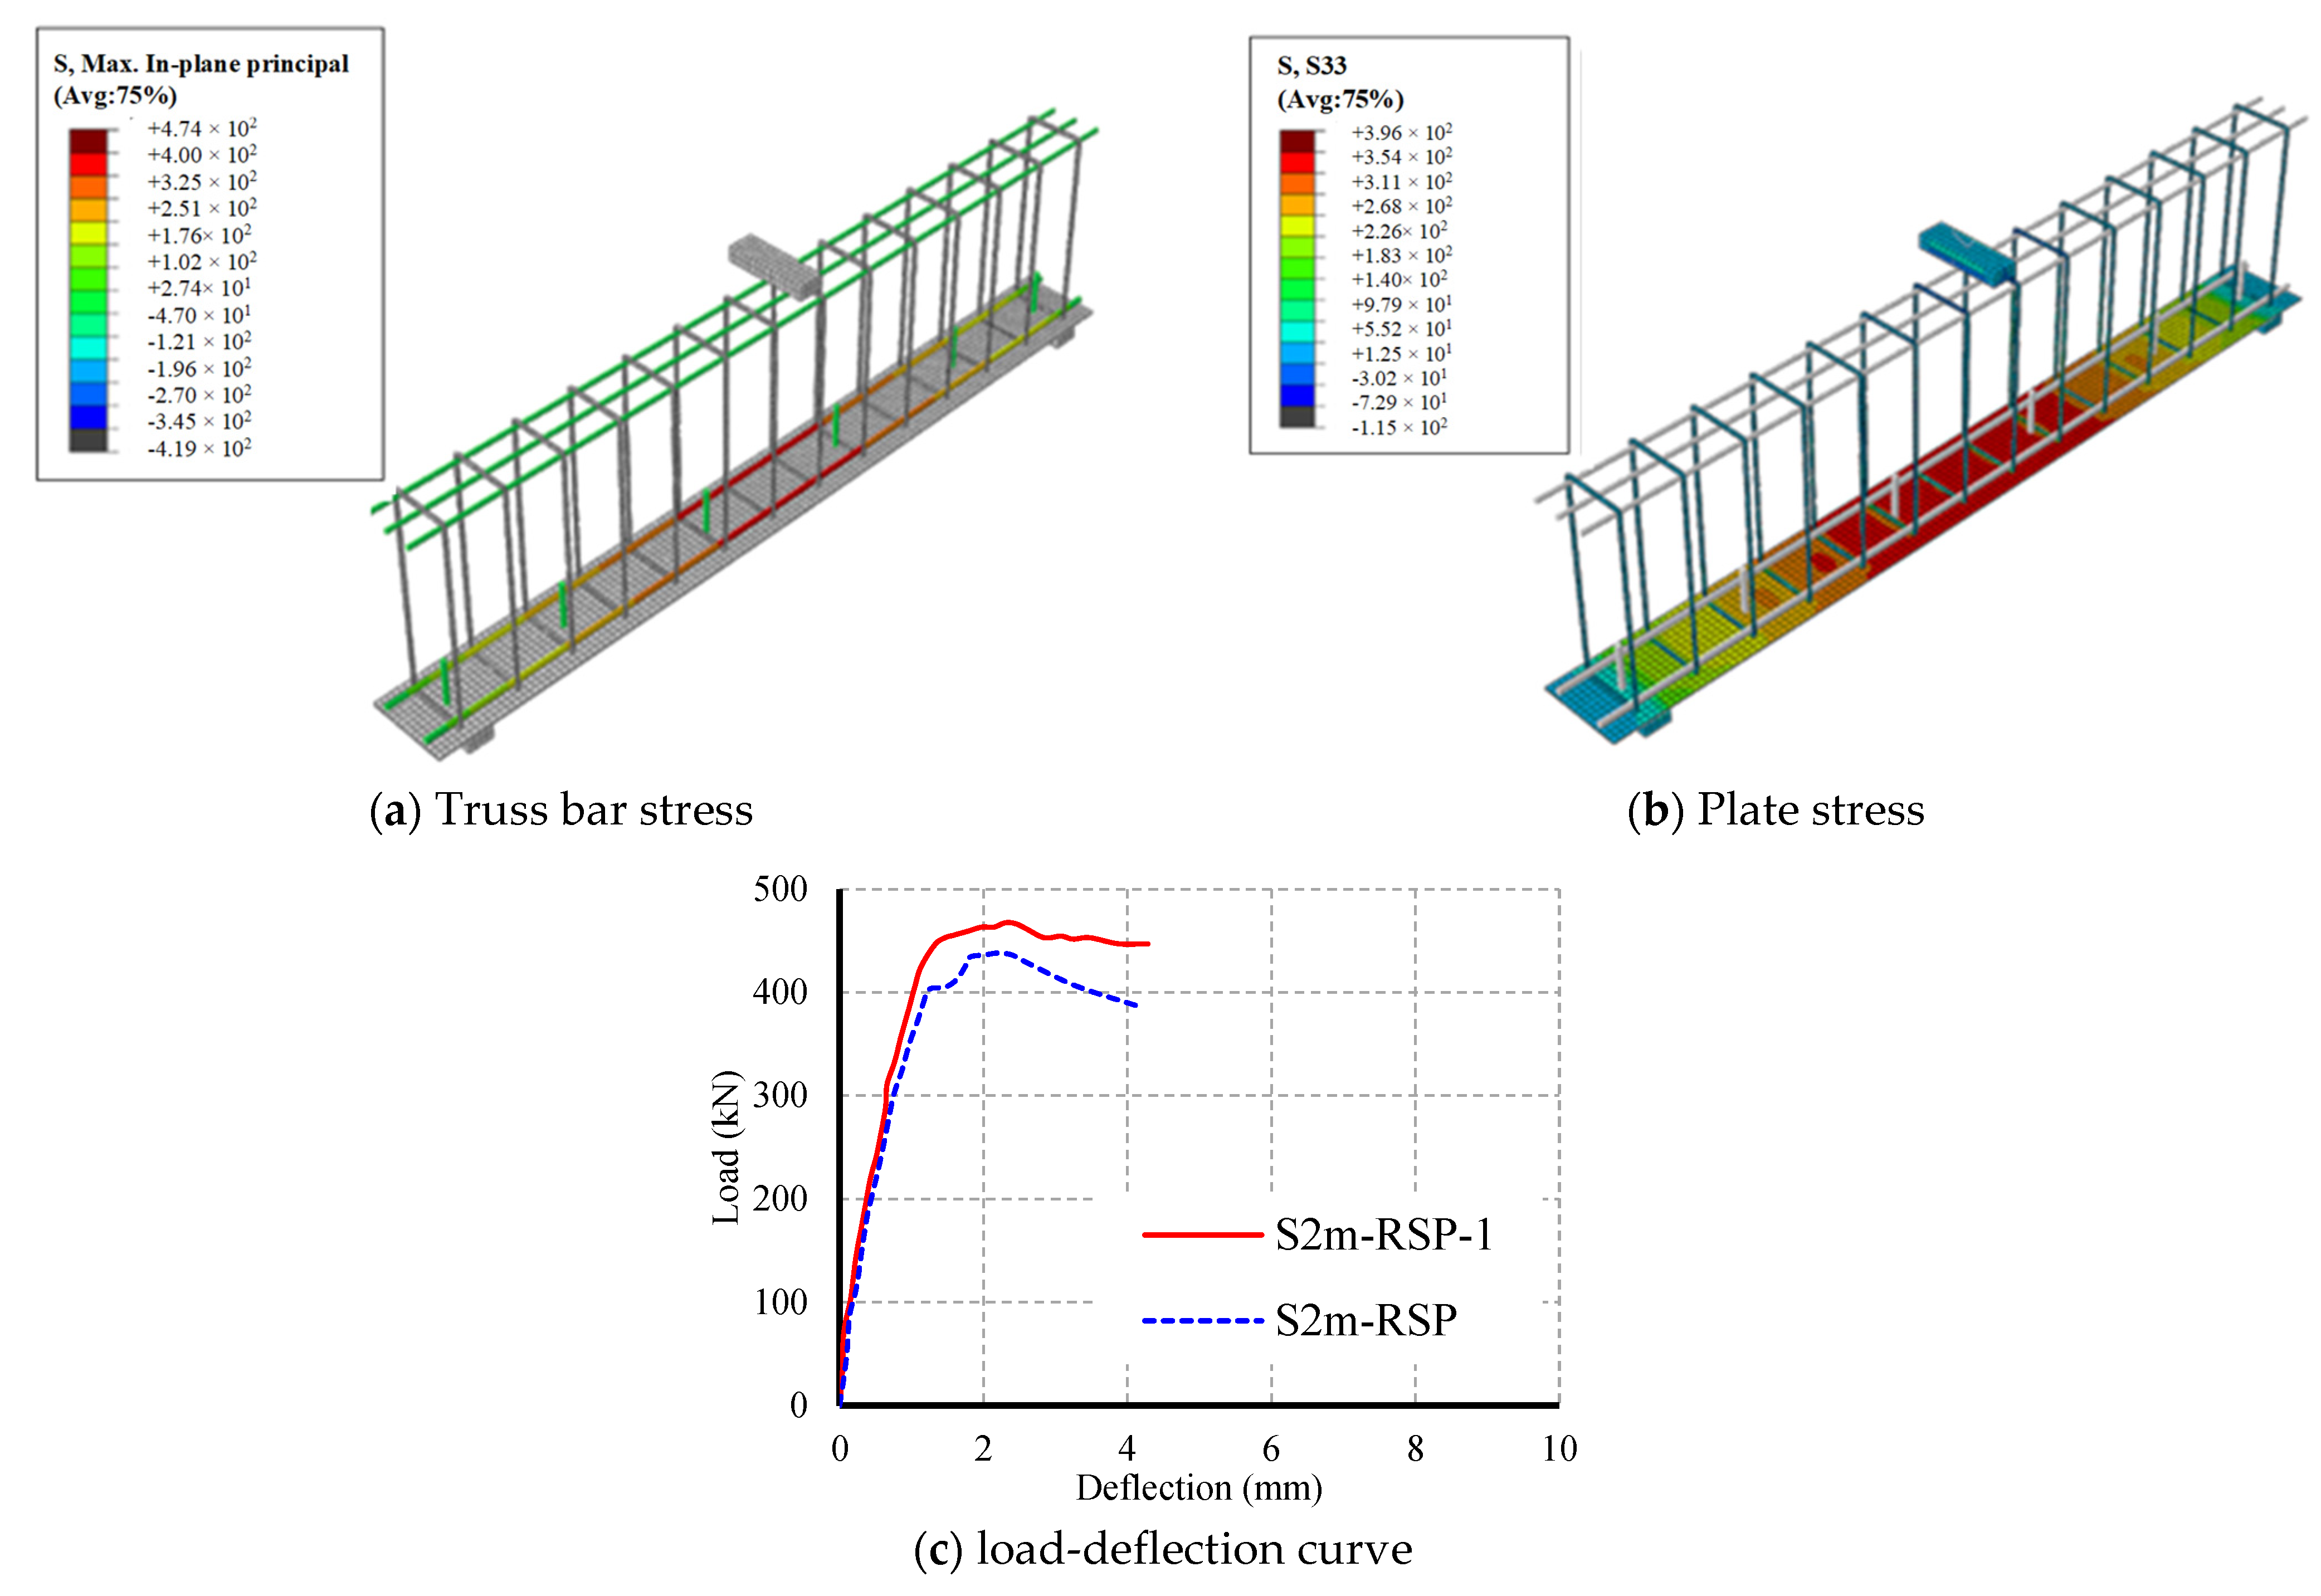
4.6.2. Assessing the Influence of Yielding in Steel Plate

This study was carried out in three distinct phases to examine the influence of steel plate yield strength on the behavior of reinforced concrete (RC) beams. Stage 1 focused on specimens reinforced with both steel plates and truss shear bars. The aim was to evaluate how varying the yield strength of the steel plate affects the overall structural response. In this phase, the beams were subjected to loading until failure, and the performance of both the tensile bars and the steel plate was closely monitored. Stage 2 examined beams reinforced with steel plates and conventional stirrups instead of truss bars. This configuration allowed for a direct comparison of the influence of shear reinforcement type on beam performance under identical tensile reinforcement conditions. Stage 3 involved a comparative analysis between two configurations: beams reinforced with a steel plate and truss shear bars, and beams reinforced with a steel plate and stirrups. In both cases, the steel plate had the same yield strength, isolating the impact of shear reinforcement configuration on structural capacity. Throughout the testing, stress data from the tensile bars and steel plate were recorded (Figure 17a,b). The results showed that both components reached nearly 470 MPa—close to their plastic deformation threshold—indicating the effective utilization of material strength. As shown in Figure 17c, increasing the yield strength of the steel plate from 420 MPa to 520 MPa led to a notable improvement in beam stiffness and a 6% increase in ultimate load capacity.
The next phase of the plate-yielding study involves utilizing the beam reinforcement configuration model consisting of steel plates and stirrups. The objective was to validate the findings from the initial stage and observe the performance of the steel plates and bars under loading conditions. Figure 18a,b demonstrate that the stresses on the plate and the tensile bars in the model were closely aligned, reaching the yielding stress after the elastic loading stage.
Similarly, comparing two beam models with varying yielding properties of steel plates reveals a notable improvement in beam stiffness and an increase in the ultimate load (Figure 18c). This finding reinforces the main conclusion drawn in the previous stage. Ultimately, it can be inferred that the performance of the beam can be significantly enhanced by employing a reinforcement configuration, where the steel plate exhibits the same yielding characteristics as the bars. This enhancement is demonstrated by the simultaneous augmentation of both the ultimate load capacity and stiffness, as depicted in Figure 19. According to the data presented in this section, it is evident that the yielding of the steel plate has a significant impact on both the maximum capacity and deflection of RC beams. When a steel plate with a yielding strength of 520 MPa is utilized, there is a noteworthy 12% increase in the maximum load and a 20% decrease in the maximum deflection in comparison to a beam with the same reinforcement ratio but reinforced solely by steel bars and stirrups. In conclusion, it can be inferred that higher yielding strengths of steel plates lead to enhanced ultimate loads and improved resistance to deformation in RC beams.

5. Conclusions

This research investigated the impact of different tensional and shear configurations on the structural performance of concrete beams. This study encompassed three distinct phases: analytical analysis, experimental testing, and numerical simulations. Based on the findings of this study, the following conclusions can be derived:
  • The shear span-to-depth ratio decreased the capacity of the beam but increased related to its control ones when the failure was shear, and the tensile reinforcement kept the ratio constant. Conversely, the tensile reinforcement showed an insignificant effect on enhanced beam shear capacity when the beams had the same shear configuration.
  • The concrete beam reinforced with a steel plate and stirrups had the highest load-carrying capacity when compared to the conventional concrete beams. Moreover, both beams with the steel plate and truss shear bar, as well as beams reinforced with tension steel bars and truss shear bars, exhibited the same failure mode, i.e., shear failure mode.
  • The beam had truss shear reinforcement of about 51.1% compared to stirrups, which could attain 87% of its capacity. As the truss shear reinforcement had the advantages of easier formation and support compared to stirrups, it is recommended to use the same shear steel area of the stirrups to form the truss.
  • The beam reinforced with a steel plate and stirrups exhibited slightly greater capacity than those reinforced with bars and stirrups (5% increase), although the yield stress of the steel plate was 20% lower than that of the bars. Increasing the plate yield from 420 to 520 MPa improved the beam’s stiffness, while the ultimate capacity experienced a 6% increase.
  • The truss configuration was not better at resisting the shear flow through the total shear span with the same efficiency, so it is recommended to extend this study in the future to study the effect of the truss shear reinforcement configuration, such as the N shape truss, on the beam shear capacity.

Author Contributions

Conceptualization, A.S.E. and M.M.A.M.; data curation, A.S.E., I.A.S., F.M.A. and A.E.-Z.; formal analysis, A.S.E., F.M.A. and A.E.-Z.; investigation, A.S.E., I.A.S. and F.M.A.; methodology, A.S.E., I.A.S. and M.M.A.M.; resources, A.E.-Z.; software, A.S.E., I.A.S. and F.M.A.; supervision, A.S.E. and I.A.S.; validation, A.S.E. and F.M.A.; visualization, M.M.A.M.; writing—original draft, A.S.E., I.A.S., F.M.A. and M.M.A.M.; writing—review and editing, I.A.S. and A.E.-Z. All authors have read and agreed to the published version of the manuscript.

Funding

This research was funded by Taif University, Saudi Arabia, project No. TU-DSPP-2024-196.

Data Availability Statement

The data presented in this study are available on request from the corresponding author.

Acknowledgments

The authors extend their appreciation to Taif University, Saudi Arabia, for supporting this work through project number TU-DSPP-2024-196.

Conflicts of Interest

The authors declare no conflicts of interest.

References

  1. Subedi, N.; Baglin, P. Plate Reinforced Concrete Beams: Experimental Work. Eng. Struct. 1999, 21, 232–254. [Google Scholar] [CrossRef]
  2. Subedi, N. Reinforced Concrete Beams with Plate Reinforcement for Shear. Proc. Inst. Civ. Eng. 1989, 87, 377–399. [Google Scholar] [CrossRef]
  3. Lam, W.; Su, R.; Pam, H. Experimental Study on Embedded Steel Plate Composite Coupling Beams. J. Struct. Eng. 2005, 131, 1294–1302. [Google Scholar] [CrossRef]
  4. Su, R.; Lam, W.; Pam, H. Experimental Study of Plate-reinforced Composite Deep Coupling Beams. Struct. Des. Tall Spec. Build. 2009, 18, 235–257. [Google Scholar] [CrossRef]
  5. Lam, W.; Li, L.; Su, R.; Pam, H. Behaviour of Plate Anchorage in Plate-Reinforced Composite Coupling Beams. Sci. World J. 2013, 2013, 190430. [Google Scholar] [CrossRef] [PubMed]
  6. BS8110-2:1985; Structural Use of Concrete: Code of Practice for Special Circumstances. Part 2: Code of Practice for Special Circumstances 3. BSI: London, UK, 1985.
  7. Hamoda, A.; Eltaly, B.; Sera, R.; Liang, Q. Behavior of Reinforced Concrete Stair Slabs Strengthened with Steel Plates and near Surface Mounted Steel Bars. Eng. Struct. 2023, 292, 116514. [Google Scholar] [CrossRef]
  8. Adhikary, B.; Mutsuyoshi, H. Numerical Simulation of Steel-Plate Strengthened Concrete Beam by a Non-Linear Finite Element Method Model. Constr. Build. Mater. 2002, 16, 291–301. [Google Scholar] [CrossRef]
  9. Arslan, G.; Sevuk, F.; Ekiz, I. Steel Plate Contribution to Load-Carrying Capacity of Retrofitted RC Beams. Constr. Build. Mater. 2008, 22, 143–153. [Google Scholar] [CrossRef]
  10. Rakgate, S.; Dundu, M. Effectiveness of Surface Preparation on the Capacity of Plated Reinforced Concrete Beams. Structures 2018, 14, 348–357. [Google Scholar] [CrossRef]
  11. Atea, R. A Case Study of Flexural Performance of Reinforced Concrete Beams Bonded with Steel Plates with Different Thickness. J. Mater. Res. Technol. 2019, 8, 22–32. [Google Scholar] [CrossRef]
  12. Braconi, A.; Elamary, A.; Salvatore, W. Seismic Behaviour of Beam-to-Column Partial-Strength Joints for Steel–Concrete Composite Frames. J. Constr. Steel Res. 2010, 66, 1431–1444. [Google Scholar] [CrossRef]
  13. Elamary, A.; Ahmed, M.; Mohmoud, A. Flexural Behaviour and Capacity of Reinforced Concrete–Steel Composite Beams with Corrugated Web and Top Steel Flange. Eng. Struct. 2017, 135, 136–148. [Google Scholar] [CrossRef]
  14. Alharthi, Y.; Sharaky, I.; Elamary, A.; Al-Sharef, A.; Al-Salmi, A.; Al-Sufyani, A.; Al-Osaimi, O.; Al-Mufti, A. Flexural Behavior and Capacity of Composite Concrete-Steel Beams Using Various Shear Connectors. Arab. J. Sci. Eng. 2023, 48, 5587–5601. [Google Scholar] [CrossRef]
  15. Yang, Y.; Zhou, C.; Peng, J.; Li, H.; Dong, Y.; Cai, C. Theory-Informed Deep Neural Network-Based Time-Dependent Flexural Reliability Assessment of Corroded PC Structures. Eng. Struct. 2025, 329, 119819. [Google Scholar] [CrossRef]
  16. Yang, Y.; Chen, H.; Peng, J.; Dong, Y. Machine Learning-Based Probabilistic Prediction Model for Chloride Concentration in the Interfacial Zone of Precast and Cast-in-Place Concrete Structures. Structures 2025, 72, 108224. [Google Scholar] [CrossRef]
  17. Elamary, A.; Sharaky, I.; Alharthi, Y.; Rashed, A. Optimizing Shear Capacity Prediction of Steel Beams with Machine Learning Techniques. Arab. J. Sci. Eng. 2024, 49, 4685–4709. [Google Scholar] [CrossRef]
  18. Elamary, A.; Mohamed, M.; Sharaky, I.; Mohamed, A.; Alharthi, Y.; Ali, M. Utilizing Artificial Intelligence Approaches to Determine the Shear Strength of Steel Beams with Flat Webs. Metals 2023, 13, 232. [Google Scholar] [CrossRef]
  19. Sharaky, I.; Torres, L.; Sallam, H. Experimental and Analytical Investigation into the Flexural Performance of RC Beams with Partially and Fully Bonded NSM FRP Bars/Strips. Compos. Struct. 2015, 122, 113–126. [Google Scholar] [CrossRef]
  20. Alharthi, Y.; Emara, M.; Elamary, A.; Sharaky, I. Flexural Response and Load Capacity of Reinforced Concrete Beams Strengthened with Reinforced Mortar Layer. Eng. Struct. 2021, 245, 112884. [Google Scholar] [CrossRef]
  21. 318-19; Building Code Requirements for Structural Concrete and Commentary. American Concrete Institute: Farmington Hills, MI, USA, 2019; ISBN 9781641950565.
  22. EN 1993-1-5; Eurocode 3—Design of Steel Structures—Part. 1–5: Plated Structural Elements. JRC Scientific and Technical Reports; European Committee for Standardization: Brussels, Belgium, 2006; pp. 1–53.
  23. Aci 440R-07; Report on Fiber-Reinforced Polymer (FRP) Reinforcement for Concrete Structures. American Concrete Institute (ACI): Farmington Hills, MI, USA, 2007.
  24. ASTM C39/C39M-18; Standard Test Method for Compressive Strength of Cylindrical Concrete Specimens. ASTM: West Conshohocken, PA, USA, 2018.
  25. Carmona, S.; Aguado, A. New Model for the Indirect Determination of the Tensile Stress–Strain Curve of Concrete by Means of the Brazilian Test. Mater. Struct. 2012, 45, 1473–1485. [Google Scholar] [CrossRef]
  26. Gunes, O.; Buyukozturk, O.; Karaca, E. A Fracture-Based Model for FRP Debonding in Strengthened Beams. Eng. Fract. Mech. 2009, 76, 1897–1909. [Google Scholar] [CrossRef]
  27. DS Simulia. ABAQUS Theory Manual, User Manual and Example Manual; Version 6.7; Hibbitt Karlsson and Sorenson Inc.: Providence, RI, USA, 2010. [Google Scholar]
  28. Carreira, D.; Chu, K. Stress-Strain Relationship for Plain Concrete in Compression. ACI J. Proc. 1985, 82, 797–804. [Google Scholar] [CrossRef]
  29. Barros, J.; Lourenço, L.; Soltanzadeh, F.; Taheri, M. Steel Fibre Reinforced Concrete for Elements Failing in Bending and in Shear. Adv. Concr. Constr. 2013, 1, 1–27. [Google Scholar] [CrossRef]
  30. Ahmed, S.; Sharaky, I.; Ibrahim, Y.; Abdo, A. Flexural Response of GFRP RC Beams Strengthened with Side and Bottom NSM GFRP Bars. Case Stud. Constr. Mater. 2023, 18, e01858. [Google Scholar] [CrossRef]
  31. Seleem, M.; Megahed, F.; Badawy, A.; Sharaky, I. Performance of NSM and EB Methods on the Flexural Capacity of the RC Beams Strengthened with Reinforced HSC Layers. Structures 2023, 56, 104950. [Google Scholar] [CrossRef]
  32. Sharaky, I.; Elamary, A.; Alharthi, Y. Experimental and Numerical Investigation on the Flexural Performance of RC Slabs Strengthened with EB/NSM CFRP Reinforcement and Bonded Reinforced HSC Layers. Eng. Struct. 2023, 289, 116338. [Google Scholar] [CrossRef]
  33. Abdo, A.; Sharaky, I.; Ahmed, S. Shear Performance of Reinforced Concrete Beams Strengthened in Shear Using NSM Bars and Reinforced HSC Layers. Struct. Concr. 2023, 24, 7295–7313. [Google Scholar] [CrossRef]
  34. El-Mandouh, M.; Elsamak, G.; Rageh, B.; Hamoda, A.; Abdelazeem, F. Experimental and Numerical Investigation of One-Way Reinforced Concrete Slabs Using Various Strengthening Systems. Case Stud. Constr. Mater. 2023, 18, e01691. [Google Scholar] [CrossRef]
  35. Lubliner, J.; Oliver, J.; Oller, S.; Oñate, E. A Plastic-Damage Model for Concrete. Int. J. Solids Struct. 1989, 25, 299–326. [Google Scholar] [CrossRef]
  36. Hamoda, A.; Emara, M.; Abdelazeem, F.; Ahmed, M. Experimental and Numerical Analysis of RC Beams Strengthened with ECC and Stainless Steel Strips. Mag. Concr. Res. 2023, 75, 251–270. [Google Scholar] [CrossRef]
  37. Jahani, Y.; Baena, M.; Barris, C.; Torres, L.; Sena-Cruz, J. Effect of Fatigue Loading on Flexural Performance of NSM CFRP-Strengthened RC Beams under Different Service Temperatures. Eng. Struct. 2022, 273, 115119. [Google Scholar] [CrossRef]
  38. Ahmed, M.; Sheikh, M.; Hadi, M.; Liang, Q. Numerical Modeling of Self-Compacting Concrete Columns Longitudinally Reinforced with Steel Tubes under Axial Loading. Eng. Struct. 2022, 270, 114913. [Google Scholar] [CrossRef]
  39. Hamoda, A.; Ahmed, M.; Sennah, K. Experimental and Numerical Investigations of the Effectiveness of Engineered Cementitious Composites and Stainless Steel Plates in Shear Strengthening of Reinforced Concrete Beams. Struct. Concr. 2023, 24, 2778–2799. [Google Scholar] [CrossRef]
  40. Elsamak, G.; Salama, M.; Hamoda, A. Behavior of Precast Segmental Beams Made of High-Strength Concrete and Ultra-High Performance Fiber Concrete Connected by Shear Keys Technique. Arab. J. Sci. Eng. 2023, 48, 4907–4923. [Google Scholar] [CrossRef]
  41. Yuan, F.; Wei, W.; Hu, R. Shear Strengthening of Reinforced Concrete Beams with High-Strength Steel Wire and Engineered Cementitious Composites. Adv. Struct. Eng. 2022, 25, 158–170. [Google Scholar] [CrossRef]
  42. Sharaky, I.; Baena, M.; Barris, C.; Sallam, H.; Torres, L. Effect of Axial Stiffness of NSM FRP Reinforcement and Concrete Cover Confinement on Flexural Behaviour of Strengthened RC Beams: Experimental and Numerical Study. Eng. Struct. 2018, 173, 987–1001. [Google Scholar] [CrossRef]
  43. Lee, J.; Fenves, G. Plastic-Damage Model for Cyclic Loading of Concrete Structures. J. Eng. Mech. 1998, 124, 892–900. [Google Scholar] [CrossRef]
  44. Ci, J.; Kong, L.; Ahmed, M.; Liang, Q.; Hamoda, A.; Chen, S.; Wu, C. Experimental and Numerical Studies of Axially Loaded Square Concrete-encased Concrete-filled Large-diameter Steel Tubular Short Columns. Struct. Concr. 2022, 23, 2748–2769. [Google Scholar] [CrossRef]
  45. Ci, J.; Ahmed, M.; Liang, Q.; Chen, S.; Chen, W.; Sennah, K.; Hamoda, A. Experimental and Numerical Investigations into the Behavior of Circular Concrete-Filled Double Steel Tubular Slender Columns. Eng. Struct. 2022, 267, 114644. [Google Scholar] [CrossRef]
  46. Ayough, P.; Ibrahim, Z.; Sulong, N.; Hsiao, P.; Elchalakani, M. Numerical Analysis of Square Concrete-Filled Double Skin Steel Tubular Columns with Rubberized Concrete. Structures 2021, 32, 1026–1047. [Google Scholar] [CrossRef]
  47. Yu, K.; Wang, Y.; Yu, J.; Xu, S. A Strain-Hardening Cementitious Composites with the Tensile Capacity up to 8%. Constr. Build. Mater. 2017, 137, 410–419. [Google Scholar] [CrossRef]
Figure 1. Full details of the Group 1 beams with 1000 mm span length (all dimensions in mm).
Buildings 15 01396 g001
Figure 2. Reinforcement details of Group 1 specimens.
Buildings 15 01396 g002
Figure 3. Full details of the Group 2 beams with 2000 mm span length (all dimensions in mm).
Buildings 15 01396 g003
Figure 4. The reinforcement details of Group 2 specimens.
Buildings 15 01396 g004
Figure 5. Test setup and instrumentation of the tested beams.
Buildings 15 01396 g005
Figure 6. Failure modes of the tested beams.
Buildings 15 01396 g006
Figure 7. Load–deflection curves of the experimented beams.
Buildings 15 01396 g007
Figure 8. Strain gauge results for S2RTP beam.
Buildings 15 01396 g008
Figure 9. Uniaxial compression stress–strain curve for concrete [25].
Buildings 15 01396 g009
Figure 10. The stress and strain diagram for the balanced rectangular section.
Buildings 15 01396 g010
Figure 11. The required data for the CDP model.
Buildings 15 01396 g011
Figure 12. The material model of steel.
Buildings 15 01396 g012
Figure 13. The details of the FE model.
Buildings 15 01396 g013
Figure 14. The experiment and FE load–deflection curves for tested beams.
Buildings 15 01396 g014
Figure 15. Failure shape of simulated beam S2m-RTP vs. experimental one.
Buildings 15 01396 g015
Figure 16. Effect of changing shear reinforcement configuration from truss bar to stirrups.
Buildings 15 01396 g016
Figure 17. Effect of plate yield strength on the capacity and failure mode of the RC beam.
Buildings 15 01396 g017
Figure 18. Effect of plate stresses on the response of beam S2m-RSP.
Buildings 15 01396 g018
Figure 19. Effect of tension reinforcement shape (bars and plate) for beams with stirrups only.
Buildings 15 01396 g019
Table 1. Details of the tested beams and reinforcement configurations.
SpecimenB × t
(mm)
Shear ReinforcementBottom SteelTop SteelShear Studsρ %
S1m-RSB200 × 3007ϕ8/m’3ϕ122ϕ10-0.57
S1m-RTB200 × 3002ϕ8/m’ + T 3ϕ12 2ϕ10-0.57
S1m-RTP200 × 3002ϕ8/m’ + T2ϕ10 + SP2ϕ10Φ14@4000.58
S2m-RSB200 × 5007ϕ8/m’5ϕ143ϕ10 -0.77
S2m-RTB200 × 5002ϕ8/m’ + T5ϕ143ϕ10-0.77
S2m-RTP200 × 5002ϕ8/m’ + T2ϕ14 + SP3ϕ10Φ14@4000.76
B = beam width, t = beam height, SP = steel plate, T = truss, and ρ = the ratio of tensile reinforcement equals the area of tensile reinforcement divided by the beam cross-section concrete area.
Table 2. Material properties of the beam reinforcement.
Steel Reinforcementfy,
MPa
fu,
MPa
E
GPa
Elongation
%
8 mm bars43054020512
10 mm bars53062021010
12 mm bars5606402108
14 mm bars52062021010
3 mm plate25040020016
fy = yield strength, fu = ultimate strength, and E = modulus of elasticity.
Table 3. The experimental results of the two groups of tested beams.
Specimen IDPu
(kN)
Pu/PCB × 100
(%)
δu
(mm)
Failure Mode
S1m-RSB254-5.0Flexural
S1m-RTB205813.5Shear
S1m-RTP234922.5Shear
S2m-RSB417-3.5Flexural
S2m-RTB361872.3Shear
S2m-RTP370881.8Shear
Pu = maximum capacity, PCB = load capacity of S1m-RSB and S2m-RSB as control beams for Group 1 and 2, respectively, δu = deflection of the beam at Pu.
Table 4. Recommended position parameter (β) values based on concrete compressive strength.
f c (MPa) 17 f c 28 28 < f c < 55 f c 55
β0.85 0.85 0.05 ( f c 28 ) 7 0.65
Table 5. Comparison between experimental and analytical results.
Specimen IDExperimental ResultsAnalytical ResultsPu,th/Pu,Exp. × 100
(%)
Pu,Exp., kNFMPsh, kNPflex., kNPu,thFM
S1m-RSB254Flexural284256256Flexural100.8
S1m-RTB205Shear219256256Shear124.9
S1m-RTP234Shear227276276Shear117.9
S2m-RSB417Flexural486419419Flexural100.5
S2m-RTB361Shear371419371Shear102.8
S2m-RTP370Shear373382373Shear100.8
Average107.9
Standard deviation9.8
Pu,Exp. = experimental capacity, Psh = theoretical shear capacity, Pflex. = theoretical flexural capacity, Pu,th = theoretical capacity (minimum of the shear and flexural capacity), and FM = failure modes.
Table 6. Comparison between experimental and FE results.
SpecimenExperimental ResultsFE ResultsPu,FE/Pu,Exp. × 100
IDPu,Exp., kNFMPu,FE, kNFM(%)
S1m-RSB254Flexural275.2Flexural108.3
S1m-RTB205Shear216.9Shear105.8
S1m-RTP234Shear252.3Shear107.8
S2m-RSB417Flexural439.4Flexural105.4
S2m-RTB361Shear372Shear103.0
S2m-RTP370Shear383Shear103.5
Average105.7
Standard deviation2.0
Pu,Exp. = the experimental load capacity, and Pu,FE = the FE load capacity.
Table 7. The configuration of the simulated beams in the parametric study.
Beam
ID
Internal
Reinforcement
Shear
Reinforcement
fy,P
MPa
fy,B
MPa
Variable
S2m-RTPPlate + 2ϕ14Truss420520Reference
S2m-RSPPlate + 2ϕ14Stirrups 7ϕ8//m420520Shear reinforcement
S2m-RSB5ϕ14Stirrups 7ϕ8//m-520Tension reinforcement
S2m-RTP-1Plate + 2ϕ14Truss520520Plate yield strength
S2m-RSP-1Plate + 2ϕ14Stirrups 7ϕ8//m520520fy,P and Shear reinforcement
fy,P = yield strength of the plate, fy,B = yield strength of the tension bars.
Disclaimer/Publisher’s Note: The statements, opinions and data contained in all publications are solely those of the individual author(s) and contributor(s) and not of MDPI and/or the editor(s). MDPI and/or the editor(s) disclaim responsibility for any injury to people or property resulting from any ideas, methods, instructions or products referred to in the content.

