Article

Research on Building’s Carbon Emission Calculation and Reduction Strategy Based on Life Cycle Assessment (LCA) and Building in Formation Modeling (BIM): A Case Study in Beijing, China

1
Hebei Key Laboratory of Man-Machine Environmental Thermal Control Technology and Equipment, Hebei Vocational University of Technology and Engineering, Xingtai 054000, China
2
Department of Power Engineering, North China Electric Power University, Baoding 071003, China
3
Walton Design & Consulting Engineering Co., Ltd., Beijing 100032, China
*
Author to whom correspondence should be addressed.
Buildings 2025, 15(9), 1403; https://doi.org/10.3390/buildings15091403
Submission received: 26 March 2025 / Revised: 17 April 2025 / Accepted: 19 April 2025 / Published: 22 April 2025
(This article belongs to the Section Building Energy, Physics, Environment, and Systems)

Abstract

:
This study focuses on a residential project in the Haidian District of Beijing, China, employing life cycle assessment (LCA) integrated with building information modeling (BIM) to quantitatively analyze carbon emissions throughout the building life-cycle, including material production, transportation, construction, operation, demolition, and recycling. The results show that the operation and production stages are the primary sources of carbon emissions, accounting for 72.51% and 47.17%, respectively. In contrast, transportation, construction, and demolition contribute relatively minor emissions, at 3.94%, 2.08%, and 0.69%, respectively. Furthermore, renewable energy systems, building recycling, and urban green spaces as carbon sinks contribute negative emissions of −10.96%, −10.48%, and −4.95%, respectively. It should be noted that these percentages reflect the net contributions to total carbon emissions throughout the building’s life-cycle, taking into account both emission sources and sinks. As such, the inclusion of negative emissions from renewable energy systems, recycling, and urban green spaces leads to some stages having a cumulative percentage exceeding 100%. Based on these findings, this paper recommends adopting low-carbon building materials over traditional ones and widely promoting photovoltaic (PV) systems with energy storage technologies to effectively reduce carbon emissions. This study serves as a valuable reference for Beijing and other regions with similar climatic conditions, highlighting the importance of integrated emission reduction strategies to promote a green transition in the construction sector.

1. Introduction

As the global climate change crisis intensifies, the construction industry, a major contributor to energy consumption and greenhouse gas emissions, has drawn significant attention. According to the International Energy Agency (IEA), this sector accounts for roughly 40% of global energy use and 38% of worldwide CO2 emissions [1]. Notably, in China, the construction industry is pivotal to both energy consumption and carbon emissions; statistics show that it contributes over 50% of the country’s total carbon emissions [2,3].
In response to this challenge, the Chinese government has set a ‘dual carbon’ target, aiming to peak carbon emissions by 2030 and achieve carbon neutrality by 2060 [4]. As China’s capital, Beijing plays a pivotal role in economic development and bears unique responsibilities for environmental stewardship. The issue of carbon emissions is particularly pronounced in Beijing. Factors such as high population density, concentrated building stock, and significant winter heating demands place substantial pressure on emission reduction efforts in the region [5].
Life cycle assessment (LCA) is a comprehensive evaluation of the environmental impacts associated with a product throughout its life cycle. It is defined as a systematic, holistic, and objective methodology for assessing the environmental burdens linked to a product or process. This approach identifies and quantifies energy and material consumption, as well as emissions, and evaluates their corresponding environmental effects [6,7].
In recent years, LCA has been extensively applied to various tiers of building systems. Both domestic and international scholars have conducted extensive research on the carbon emissions associated with the life cycles of buildings. For instance, Cai et al. compared prefabricated light steel structures with traditional cast-in-place concrete structures, revealing that the former exhibit lower carbon emissions throughout their life cycle, demonstrating significant potential for emission reduction [8]. Meanwhile, Li et al. investigated peak CO2 emissions and pathways to carbon neutrality in Beijing’s buildings using dynamic scenario simulations. Their work addressed technological solutions and policy challenges aimed at achieving carbon neutrality [5]. Peng utilized Ecotect software (Autodesk, San Francisco, CA, USA, 2015) alongside building information modeling (BIM) to streamline and estimate the life-cycle carbon emissions of buildings [9]. Ding et al. employed BIM and LCA methodologies to conduct a comprehensive analysis of carbon emissions in prefabricated building construction, proposing relevant emission reduction strategies [10]. Yang et al. introduced a process-based LCA approach to simulate energy consumption and carbon emissions within China’s construction sector, examining the influencing factors involved [11]. Falana et al. investigated the roles of critical stakeholders at different phases of net-zero carbon buildings’ life cycles, along with implementation cases across specific countries [12,13,14,15].
Furthermore, Joseph et al. conducted a systematic literature review to analyze research trends, methodologies, and strategies for carbon emission management in building construction processes, highlighting the critical importance of mitigating emissions [16]. Feng et al. performed a systematic review addressing uncertainty factors in LCA of buildings, discussing methods for quantifying these uncertainties and proposing viable solutions [17]. Zhang et al. conducted a comprehensive analysis of carbon emissions from China’s construction sector under various scenarios, examining the implications of relevant policies for achieving peak carbon emissions by 2030 and carbon neutrality by 2060 [18]. Collectively, these studies provide essential theoretical foundations and technical support for this research.
While numerous studies have examined carbon emissions from buildings, most existing research tends to focus on specific building types or particular life cycle stages, lacking a comprehensive assessment of the entire life cycle. This gap is particularly evident in Beijing, where research on the life cycle carbon emissions of buildings remains inadequate, characterized by incomplete data and inconsistent methodologies. Consequently, current policies and technical support are insufficient to facilitate large-scale low-carbon building practices. Addressing how to provide enhanced incentives and support at the policy level, as well as promoting and implementing new technologies, constitutes an urgent challenge. These issues hinder a holistic understanding and effective management of building carbon emissions in Beijing.
Therefore, this study aims to comprehensively investigate the carbon emission characteristics of buildings in Beijing, China, using the life cycle assessment (LCA) method. A specific project in Beijing was selected as the research object to calculate carbon emissions across five key stages: material production, transportation, construction, operation, and demolition/recycling. The study provides a thorough evaluation of carbon emissions throughout the building’s entire life cycle, clarifies the carbon emission characteristics at each stage, identifies the main sources of emissions, and determines the critical stages and factors contributing to these emissions. Additionally, the paper proposes targeted carbon reduction strategies and analyzes the role of renewable energy during the building’s operation stage, as well as the potential of carbon sinks to enhance carbon sequestration capacity and offset emissions. These efforts aim to provide a scientific basis for achieving the ‘dual-carbon’ goals and offer policy recommendations to governments and relevant departments for promoting the development and implementation of low-carbon buildings.

2. Methodology

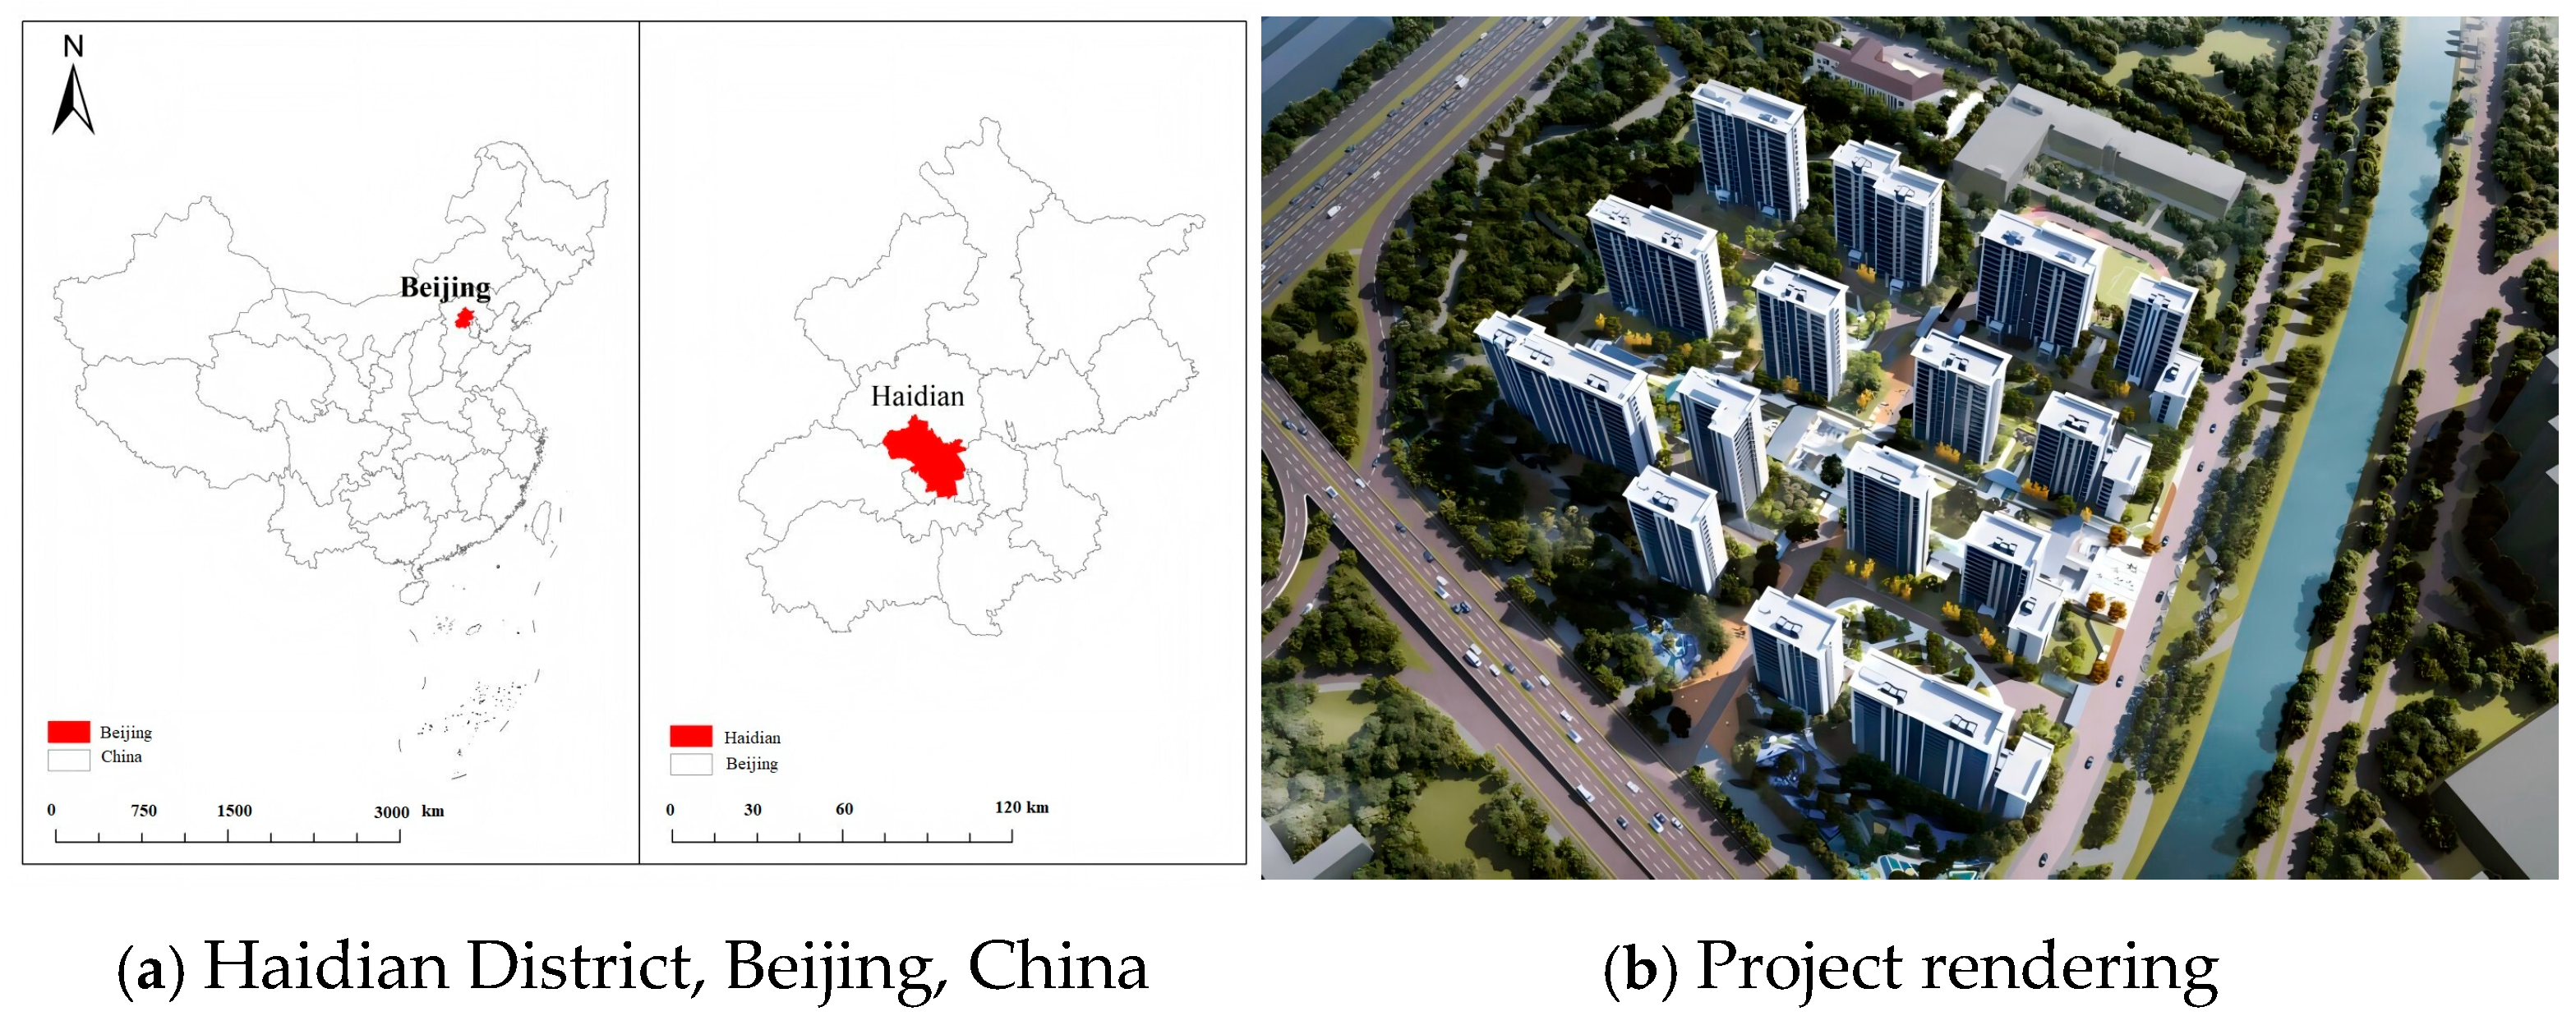
2.1. Research Objects

As shown in Figure 1, the project selected for this study is located within a residential park in Haidian District, Beijing. The total construction area of the project is 97,463.14 m2, comprising an above-ground area of 61,500.00 m2 and an underground area of 35,963.14 m2. The development plans for 460 residential units are designed to accommodate an estimated population of approximately 1127 individuals. The site boasts a high green coverage rate of 30%, a plot ratio of 2.432, and provides ample parking facilities for both motor vehicles and non-motorized transport.
The project primarily comprises high-rise residential buildings, including several structures with over 10 floors. This type of building is more prevalent in Chinese cities and typically features a high residential density. High-rise residences often involve more complex structural designs, material utilization, and energy system configurations, all of which influence their carbon emission characteristics. Therefore, selecting such buildings as case study objects is conducive to exploring the carbon emission situation and reduction strategies for high-density residential areas throughout their entire life cycle.

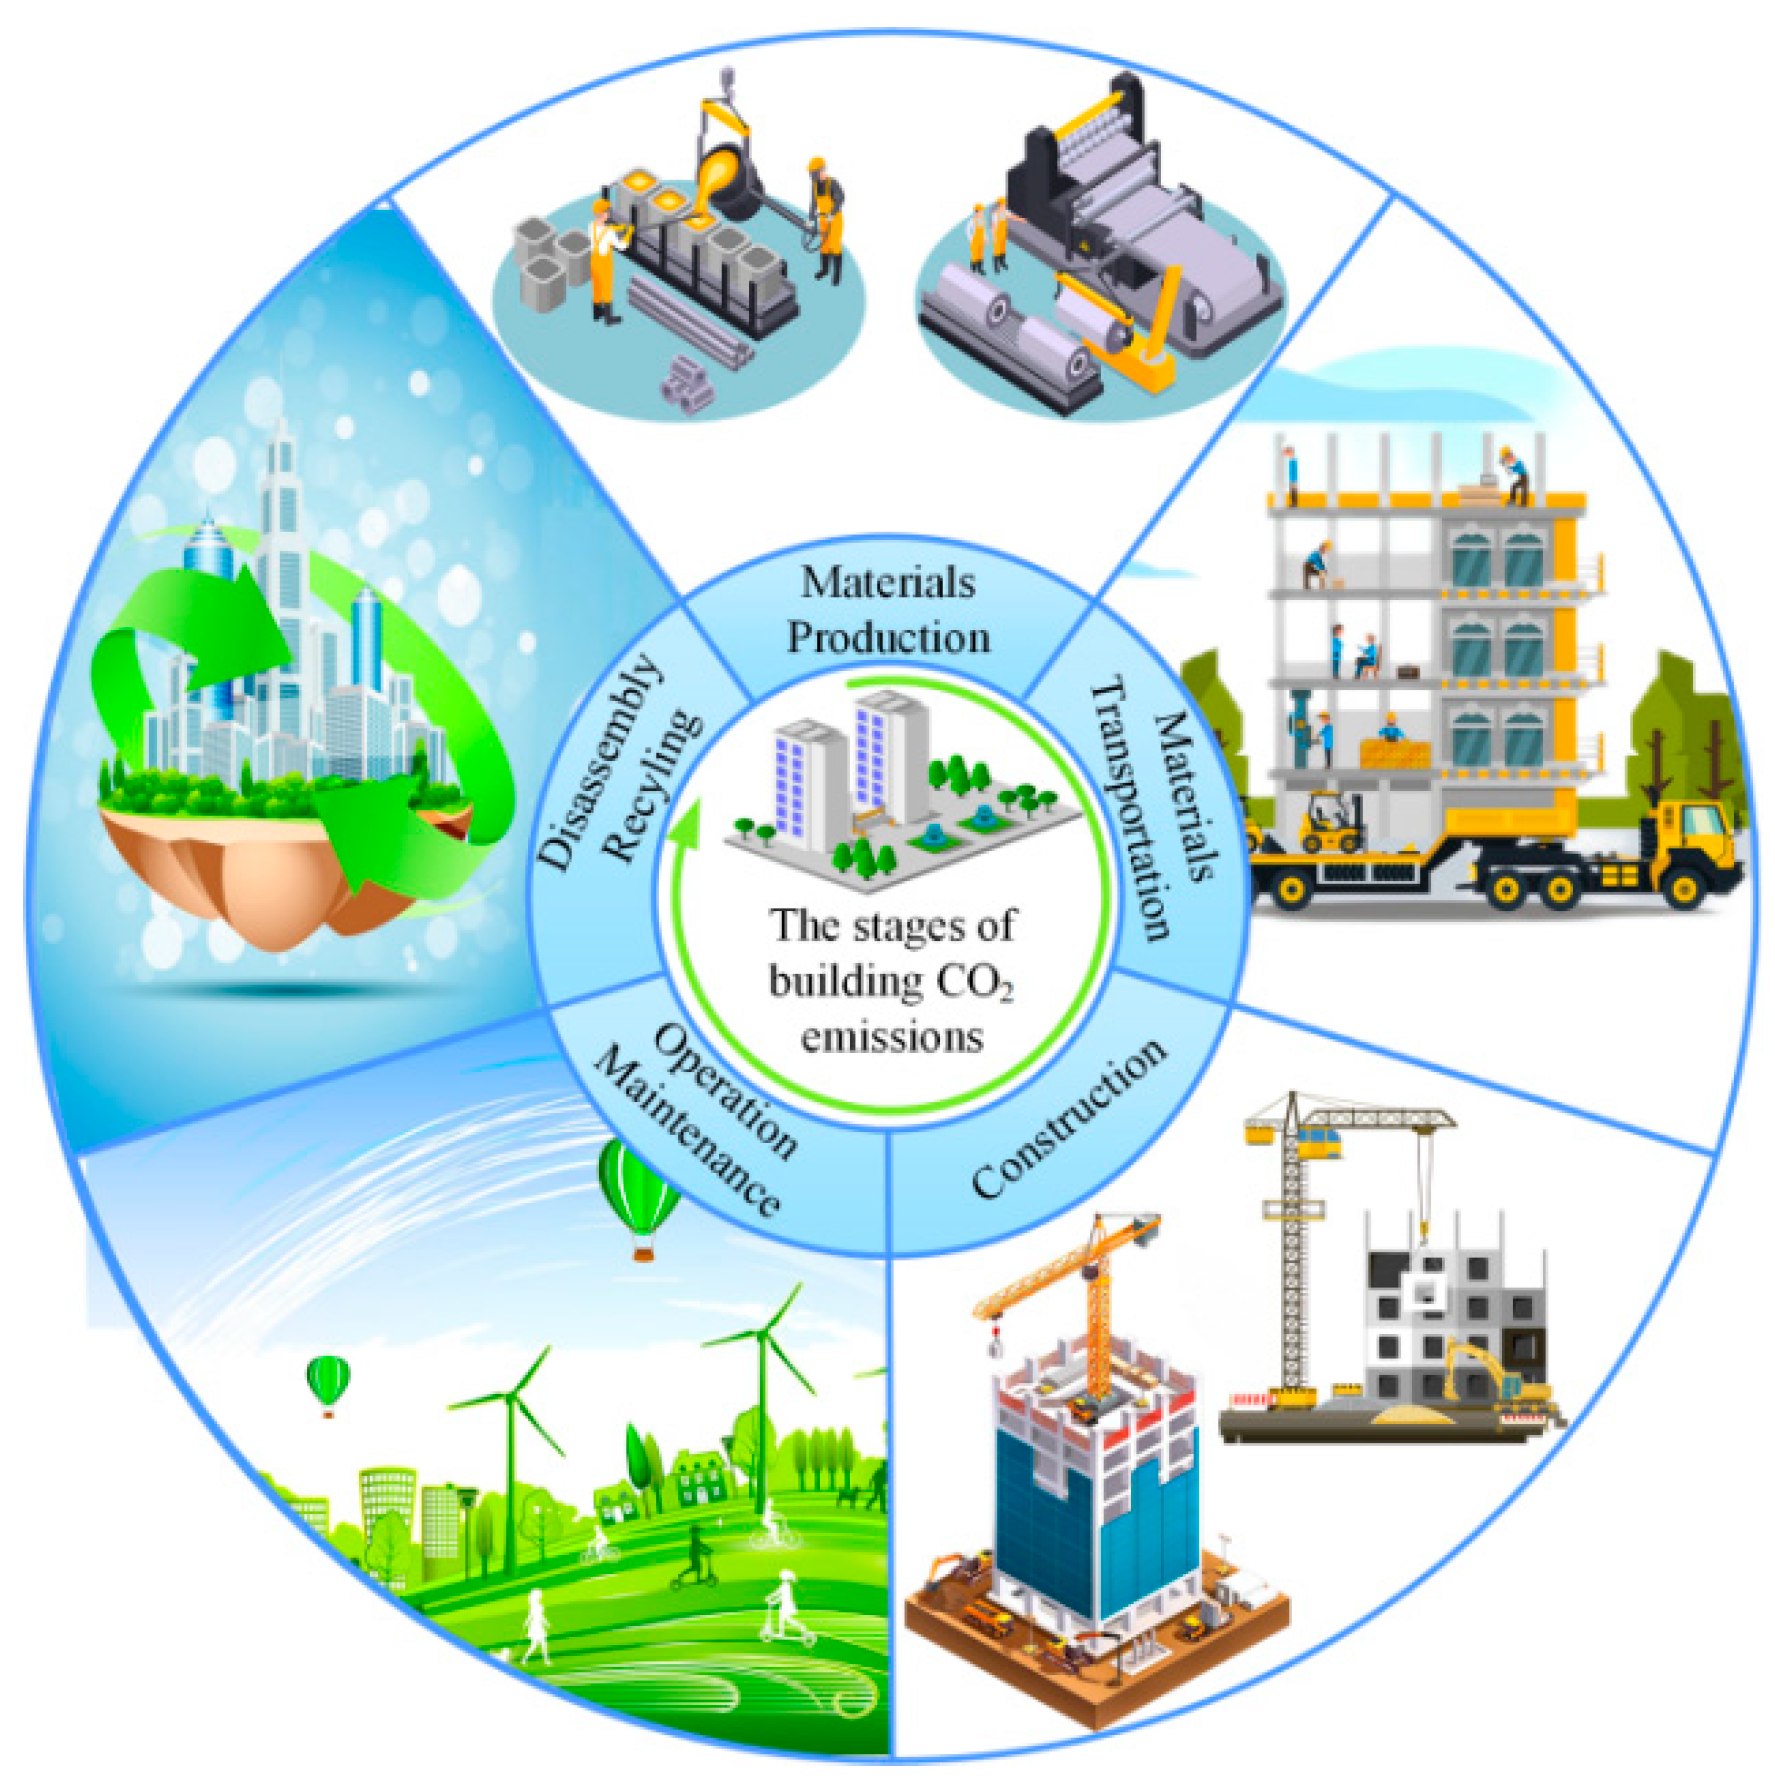
2.2. Boundary Conditions

Establishing boundary conditions for carbon emissions calculation, identifying carbon emission sources, and implementing emission reduction strategies are crucial for developing a comprehensive carbon emissions assessment model [19,20]. From a temporal perspective, carbon emissions accounting should encompass the entire life cycle of the system, from ‘cradle to grave’. Based on LCA theory, this study evaluated the process from material production through demolition/recycling over 50 years. The choice of a 50-year evaluation period is based on the expected service life of buildings and relevant policy objectives in China. Figure 2 illustrates the five stages of a building’s life cycle: material production, material transportation, construction, operation/maintenance, and demolition/recycling.
To eliminate the influences of building use and scale, this study adopts CO2 emissions per square meter as the functional unit. Furthermore, we detailed the specific activities and processes at each stage to ensure that all relevant carbon emission sources are accounted for:
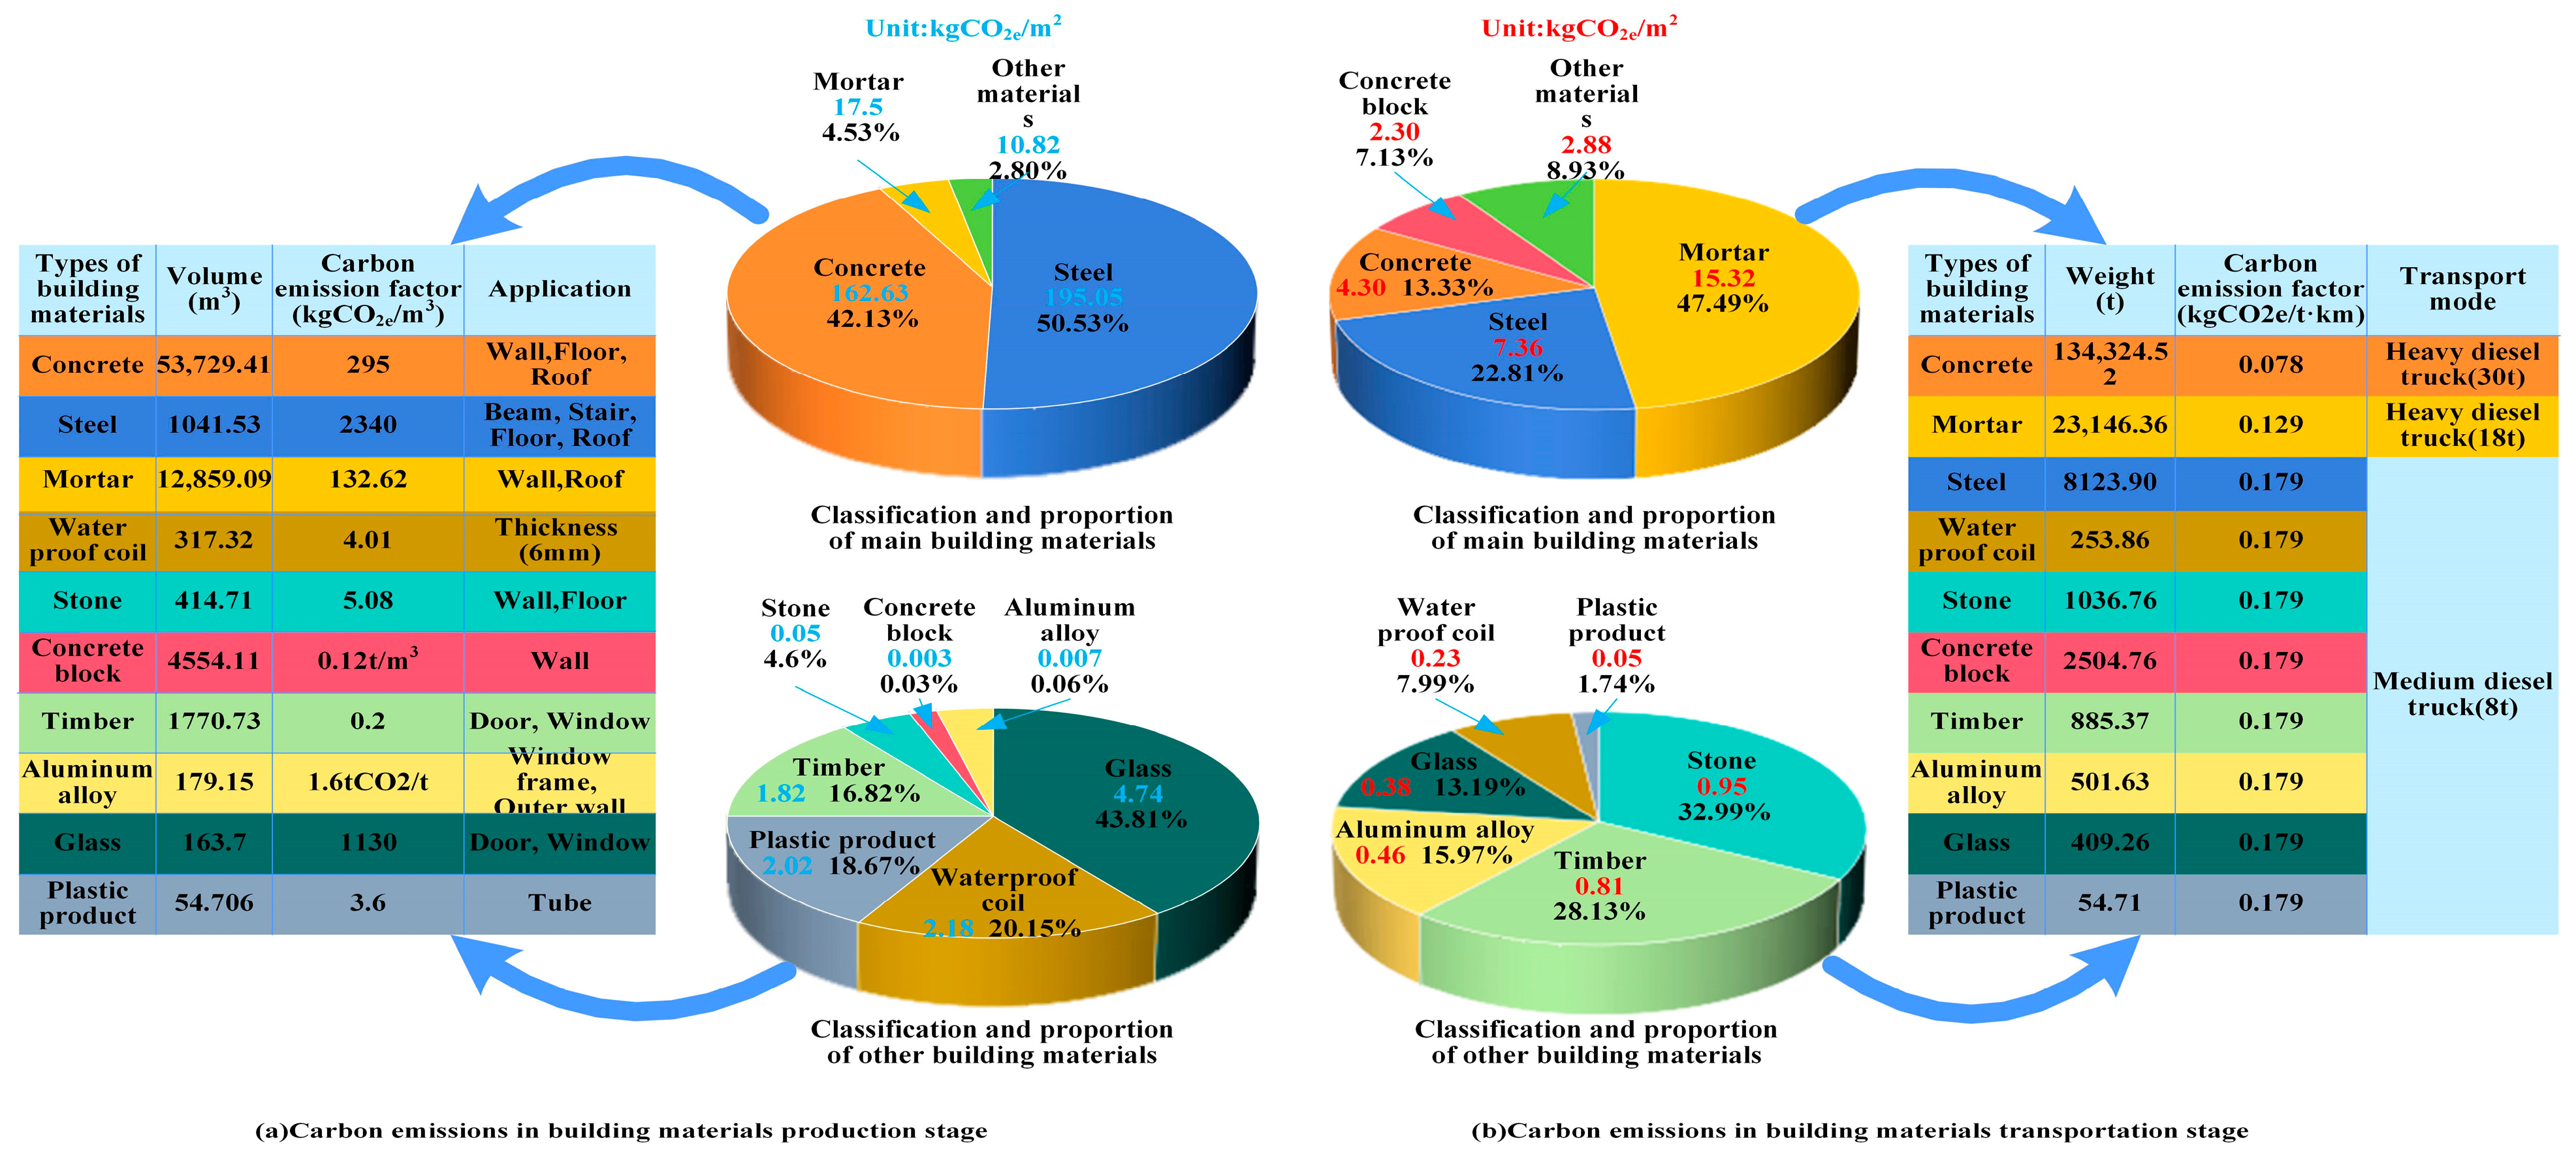
  • Materials Production Stage: This stage includes the production processes of major structural materials (such as concrete and steel), envelope materials (such as mortar and waterproof membranes), and building components (such as stone and concrete blocks). Auxiliary materials are also considered. The estimation of material consumption was based on both on-site data collection and the utilization of BIM tools.
  • Materials Transportation Stage: This stage covers the transportation of materials from their production sites to the construction site, including various transportation modes (such as heavy-duty diesel trucks and medium-duty diesel trucks) and their corresponding carbon emission factors. Transportation distances were estimated based on supplier quotations and typical delivery routes within the Beijing metropolitan area.
  • Construction Stage: This stage not only includes the construction of the main structure but also the setup and dismantling of temporary facilities. It also encompasses the energy consumption of construction machinery (such as excavators, cranes, and mixers).
  • Operation and Maintenance Stage: This stage encompasses the energy consumption of heating, air conditioning, lighting, and elevator systems, with particular emphasis on the actual energy consumption patterns of these systems during operation.
  • Demolition and Recycling Stage: These stages encompass the operation of machinery during the demolition process and the transportation of waste along with the associated carbon emissions, and consider the recycling rates of recyclable materials (such as steel and glass) and the corresponding reduction in carbon emissions. The data in the above two stages were estimates based on BIM tools.

2.3. Calculation Standards

Given that this reference project is situated in Beijing, China, the calculations are conducted by the following Chinese building standards:
(1) Standard for Building Carbon Emission Calculation (GB/T 51366–2019) (The Ministry of Housing and Urban–Rural Development of China) [21];
(2) Civil Building Green Performance Calculation Standard (JGJ/T 449-2018) [22];
(3) General Code for Building Energy Efficiency and Renewable Energy Utilization (GB55015-2021) [23].

2.4. Calculation Methods

In this study, the carbon emission factor method was utilized for comprehensive analysis, which is a method of converting energy and material consumption into CO2 emissions based on carbon emission coefficients for different activities or materials. This methodology entails the systematic collection, comparison, and validation of extensive data across various phases, including production, transportation, construction, operation, demolition, and recycling. It thoroughly examines carbon emission factors to establish a robust calculation model and ultimately synthesizes and quantifies carbon emissions throughout the entire life cycle. The carbon emission factors in this paper are derived from Ref. [21].
To facilitate the implementation of LCA, this research leverages building information modeling (BIM) technology. By integrating BIM models with LCA tools, it becomes possible to precisely quantify the carbon footprint of building materials across their entire life cycle. Specifically, the BIM model provides detailed geometric information and a comprehensive bill of materials, which can be seamlessly imported into the LCA tool for calculating the carbon footprint at each stage. For instance, during the production phase, the material specifications and quantities outlined in the BIM model can be directly utilized to estimate carbon emissions associated with raw material extraction, processing, and transportation. During the operational phase, combining BIM models with energy simulation software enables the prediction of a building’s actual energy consumption, thereby enhancing the accuracy of carbon emission estimates for this phase.

2.4.1. Building Materials Production Stage

Carbon emissions during the production and transportation stages of building materials should include those from main structural materials, envelope materials, building components, and parts. Carbon emissions in the production stage of building materials are calculated according to Equation (1):
C S C = i = 1 n M i F i
where Csc is the carbon emissions during the production stage of building materials (kgCO2e); Mi is the consumption of type i building materials (t); Fi is the carbon emission factor for type i building materials (kgCO2e/per unit of material).

2.4.2. Building Materials Transportation Stage

Carbon emissions during the transportation stage of building materials are calculated according to Equation (2).
C y s = i = 1 n M i D i T i
where Cys is the carbon emissions during the transportation stage of building materials (kgCO2e); Mi is the consumption of type I building materials (t); Di is the average transport distance of type i building materials (km); Ti is the carbon emission factor per unit weight transportation distance for type i building materials [kgCO2e/(t·km)].

2.4.3. Building Construction Stage

When calculating the carbon emissions during the building construction stage, it is typically essential to take into account the carbon emissions generated by the fuel (diesel or gasoline) necessary for the operation of the mechanical equipment utilized in the construction process (such as excavators, cranes, concrete mixers, etc.). According to the collection and sorting of the construction site, the table of construction machinery is presented in Table 1:

2.4.4. Building Operation and Maintenance Stage

The calculation of carbon emissions should encompass the carbon emissions of HVAC, lighting, elevators, renewable energy, and the building’s carbon sink system during the building’s operation stage. In this paper, a building information model (BIM) is used to simulate the electricity consumption of various equipment.
Located at 39°56′ north latitude and 116°20′ east longitude, Beijing has a climate characterized by hot summers and cold winters. Typical annual meteorological data of Beijing are shown in Figure 3 [24].
Carbon emissions during the building operation stage are ascertained in accordance with different types of energy consumption and carbon emission factors of various types of energy in each system. The total carbon emissions (CM) per unit building area during the building operation stage is computed according to Equation (3):
C M = i = 1 n ( E i E F i ) C p y A
E i = j = 1 n ( E i , j E R i , j )
where CM is the carbon emission per unit building area during the building operation stage (kgCO2/m2); Ei is the annual consumption of category i energy for buildings (unit/a) (see Equation (4)). EFi is the carbon emission factor of class i energy, in accordance with Appendix A of Ref. [21]. Ei,j is the amount of class i energy consumption by class j systems (unit/a); ERi,j is the amount of class i energy consumed by class j system via a renewable energy system (unit/a); i is the building consumption terminal energy type, including electricity, gas, oil, municipal heat, etc.; j is the types of building energy systems, including heating and air conditioning, lighting, domestic hot water systems, etc.; Cp is the annual carbon reduction of building green space carbon sink system (kgCO2/a); y is the design life of the buildings, assume 50 years (a); A is the building area (m2).

HVAC System

The energy consumption of the HVAC system is required to encompass the energy consumption of the cold source, the heat source, the transmission and distribution system, and the energy consumption of the terminal air treatment equipment. The calculation of the energy consumption of the building’s cold and heat sources should take into consideration the impact of the load, the conveying process, and the end cold and heat losses. The energy consumption calculation of the conveying system should take into account factors such as the efficiency of the pump and the fan, the operating time, the load rate of the actual working state point, and the influence of frequency conversion.

Lighting and Elevator System

(1) When the lighting system lacks a photoelectric automatic control system, its energy consumption calculation can be conducted in accordance with the following equation:
E l = j = 1 365 i P i , j A i t i , j + 24 P P A 1000
where E1 is the annual energy consumption of the lighting system (kWh/a); Pi,j is the illumination power density of room i on the jth day (W/m2); Ai is the lighting area of room I (m2); ti,j is the lighting time of room i on the jth day (h); Pp is the emergency lighting power density (W/m2); A is the building area (m2).
(2) The energy consumption of the elevator system shall be calculated according to the following equation:
E e = 3.6 P t a V W + E s tan d b y t s 1000
where Ee is the annual elevator energy consumption (kWh/a); P is the specific energy consumption (mWh/kgm); ta is the average annual operating hours of the elevator (h); V is the elevator speed (m/s); W is the elevator rated capacity (kg); Estandby is the energy consumption of an elevator when it is in standby mode (W); ts is the average annual standby hours of elevators (h).

Renewable Energy System

Renewable energy systems should include solar domestic hot water systems, photovoltaic systems, ground source heat pump systems, and wind power systems. The research project only uses a photovoltaic system; photovoltaic power generation can be calculated according to the following equation:
E p v = I K E ( 1 K S ) A p
where Epv is the annual power generation of photovoltaic system (kWh); I is the annual solar irradiance on the surface of the photovoltaic cell (kWh/m2); KE is the conversion efficiency of photovoltaic cells (%); KS is the loss efficiency of photovoltaic system (%); Ap is the photovoltaic system net area of photovoltaic panels (m2).

Urban Green Space Carbon Sink System

The calculation methods of urban green space carbon sink can be determined by the biomass expansion factor method, the biomass allometric growth equation method, the planting type (area method), the leaf area (photosynthetic rate method), the wetland area (carbon sink rate method), etc. In this paper, only the planting type (area method) was employed for accounting. Its calculation equation is presented as follows:
C S = i = 1 n A i × C p i
where CS is the total carbon sequestration in 40 years of green planting in the planning area (kg); Ai is the planting area of different green types (m2); Pi is the greening planting mode; Cpi is the total carbon sequestration in 40 years through Pi greening planting mode (kg/m2).
The above equation is derived from observational studies conducted in Taiwan and China and can be modified in accordance with temperature zones. The modified factors are 0.3 for the cold temperate zone, 0.6 for the middle temperate zone, 0.7 for the warm temperate zone, 1 for the subtropical zone, 1.2 for the tropical zone, and 0.4 for the Tibetan Plateau climate zone [25,26].
The amount of carbon sequestered per unit area of different planting modes over 40 years is presented in Table 2 [7]:
The carbon emissions during the maintenance stage primarily result from the energy consumption caused by the replacement of building materials and reconstruction activities. Due to the complexity and difficulty in obtaining accurate data on changing factors during the maintenance stage, carbon emissions are not considered in this paper.

2.4.5. Building Demolition Stage

The measurement of carbon emissions in the building demolition stage encompasses machine operation and waste transportation. The calculation model of building carbon emissions in this stage is presented as follows:
E C J = i = 1 i = n A D C J D i × E F D + i = 1 i = n A D C J Y i × E F Y + i = 1 i = n A D C J M i × E F M + i = 1 i = n A D C J Q i × E F Q + i = 1 i = n A D C J Q T i × E F Q T + i = 1 i = n A D C J S H i × E F S H
where ECJ is the carbon emission in the building demolition stage (tCO2); ADCJD is the power consumption of a unit in the demolition stage (kWh); EFD is the carbon emission factor of electricity; ADCJY is the fuel consumption of a unit in the demolition stage (t); EFY is the carbon emission factor of fuel; ADCJM is the coal consumption of a unit in the demolition stage (t); EFM is the carbon emission factor of coal; ADCJQ is the gas consumption of a unit in the demolition stage (t); EFQ is the carbon emission factor of gas; ADCJQT is the other energy consumption of a unit in the demolition stage (t); EFQT is the carbon emission factor of other energy; ADCJSH is the water consumption of a unit in the demolition stage (t); EFSH is the carbon emission factor of water; i is the class of unit process.
The construction machinery in the demolition stage is shown in Table 3.

2.4.6. Building Recycling Stage

The carbon emission in the recycling stage primarily encompasses the recycling of recyclable materials and components of buildings, and the calculation model is presented as follows:
E H S = i = 1 i = n A D H S i × η H S i × E F H S i
where EHS is the carbon emission in the building recycling stage (tCO2); ADHS is the quantity of recycled materials; η is the recycling rate; EFHS is the carbon emission factor of recycled materials; i is the type of recycled materials.
In the carbon emission accounting of the recycling stage, the recycling of wood, glass, and steel is mainly carried out; the recycling rate of wood is 60%, the recycling rate of steel is 40%, the glass is more easily damaged, and the recycling rate is 30%.
Equations (1)–(10) are employed to compute carbon emissions at each stage, encompassing but not limited to energy consumption during the production and transportation of building materials and their corresponding carbon emission factors. The data are derived from project design documents, field investigations, BIM information, and the related literature. For data that are difficult to obtain, reasonable estimation methods were used, and assumptions made in the calculations were clearly stated. Specifically, it covers the type and quantity of building materials, transportation distance, and mode, as well as energy consumption indicators during building operation.

3. Results

3.1. Building Materials Production Stage

Carbon emissions in the production of building materials primarily stem from three categories: structural materials like concrete and steel for constructing the building framework, envelope materials including mortar, waterproofing materials, wood, aluminum alloys, and glass to ensure the functionality of the external barriers and prefabricated components such as stone and concrete blocks, Auxiliary materials are also considered. Due to the energy-intensive nature and chemical processes involved in their production, these materials constitute a significant source of carbon emissions within the building materials sector. In order to quantify carbon emissions in this stage, we calculated the results according to formula 1, and the specific results are shown in Figure 4a.
As illustrated in Figure 4a, steel and concrete are the primary materials contributing significantly to carbon emissions, accounting for 50.53% and 42.13% of total emissions during the material production phase, respectively. The volume of concrete used is 53,729.41 m3, leading to approximately 162.63 kg/m2 of carbon emissions. Despite the relatively small volume of steel (1041.53 m3), its high carbon emission coefficient results in emissions of 195.05 kg/m2. Mortar and other materials, such as concrete blocks, stone, wood, glass, waterproof membranes, aluminum alloys, and plastic products, also contribute to carbon emissions but account for a smaller proportion, at 4.53% and 2.80%, respectively. The total carbon emission of this stage is 37,620.5 t, and the carbon emission per unit area is 386.00 kg/m2.

3.2. Building Materials Transportation Stage

In the transportation phase of building materials, carbon emissions primarily originate from the process of conveying various materials from production sites to construction sites. In addition to the 40-km transportation distance for concrete, the transportation distances for other building materials are set at 500 km. Carbon emissions during this stage are influenced by transportation distance, mode of transportation, and the type of fuel used [21]. Using Equation (3), we calculated the carbon emissions for the transportation stage of building materials, and the results are presented in Figure 4b.
As illustrated in Figure 4b, mortar, steel, and concrete are the primary materials during the transportation stage, contributing 47.49%, 22.81%, and 13.33% of total carbon emissions, respectively. Other materials, including stone, wood, glass, waterproof coils, aluminum alloys, and plastic products, exhibit similar characteristics to those in the production stage and result in relatively minor carbon emissions. Given that most materials require long-distance transportation, the carbon emissions from this stage are significant, amounting to 3144.47 tons, with a carbon emission intensity of 32.26 kg/m2. Therefore, optimizing transportation methods and reducing transportation distances are crucial for minimizing the carbon footprint of construction projects.

3.3. Building Construction Stage

The carbon emissions in the building construction stage are calculated according to the list of construction machinery in Table 1, and the results are shown in Table 4:
As can be seen from Table 4, carbon emissions in the construction stage mainly come from large amounts of diesel and electricity consumption. Although the carbon emission is relatively low, 1662 t, with a carbon emission intensity of 17.05 kg/m2, it is still not negligible.

3.4. Building Operation Stage

3.4.1. Building Energy Consumption

According to the actual setting of the project, the total energy consumption of the building is simulated. The energy consumption and carbon emissions of the project in the building operation stage are shown in Figure 5:
As illustrated in Figure 5, this study calculates the carbon emissions during the operation stage across seven categories: heating, socket power, lighting, independent fans, split air conditioning, heat pump units, and elevators. Among these energy consumption sources, heating contributes the highest carbon emissions, with an annual emission of 325.72 tCO2e. This is attributed to Beijing’s temperate climate, characterized by long and cold winters, which necessitates substantial heating to maintain comfortable indoor temperatures, thereby leading to high energy consumption. The second highest contributor is the power consumption from sockets and lighting. In contrast, split air conditioners, heat pumps, elevators, and independent fans exhibit relatively low carbon emissions due to their typically high energy efficiency ratios (EER) and demand-based operation, which minimizes unnecessary energy use.

3.4.2. Renewable Energy Generation

This project employs a solar photovoltaic (PV) power generation system. Based on Equation (7), it was determined that a total of 1605 PV panels would installed, resulting in a cumulative installed power generation capacity of 746.345 kWp, which will be distributed across the rooftops of various residential buildings within the community. The utilization of renewable energy through this project has led to a reduction in carbon emissions, as detailed in Table 5.
As illustrated in Table 5, renewable energy generation stands at 4.89 kWh/m2·a, with a corresponding annual CO2 emission reduction of 174.802 tons. This indicates that the utilization of renewable energy in building projects can not only markedly decrease their carbon footprint but also lead to negative emissions, effectively offsetting a portion of the carbon emissions from other sources. This underscores the critical role of integrating renewable energy into building design and operational practices.

3.4.3. Green Space Carbon Sink

The total carbon sequestration of 40 years of green planting in the planning area is selected and calculated according to Equation (8); the project is located in Beijing, China, and the corrected factor is 0.7, which can be obtained as follows:
C S = i = 1 n A i × C p i = 0.7 × ( 3.14 × 1.5 × 1.5 × 524 × 900 + 3528.10 × 300 + 5987.08 × 20 ) = 3156.44 ( t )
Therefore, the annual carbon sequestration amount of urban green space in this project is 78.91 t/a.

3.5. Building Demolition Stage

According to the list of machinery used in the demolition stage listed in Table 3, the carbon emissions in the demolition stage are obtained by substituting Equation (13), as shown in Table 6 for details:
The utilization of machinery during demolition constitutes a significant source of carbon emissions. The machinery consumed 270,445.27 kWh of electricity and 148,096.54 kg of diesel. Based on this energy consumption, the total CO2 emissions amounted to 550.67 tons. In comparison with the data from the construction phase (1662.4 tons of CO2 emissions, as shown in Table 4), the carbon emissions during the demolition phase were notably lower. This reduction may be attributed to the relatively brief duration of the demolition process.

3.6. Building Recycling Stage

Carbon emissions in the recovery stage were calculated according to Equation (10), as shown in Table 7:
The two primary recycled building materials listed in Table 7 are steel and glass. Recycling these materials resulted in a reduction in total carbon emissions by 8360.12 tonnes. Notably, steel exhibits a particularly high recycling efficiency, leading to a reduction in 8221.382 tonnes of CO2 emissions.

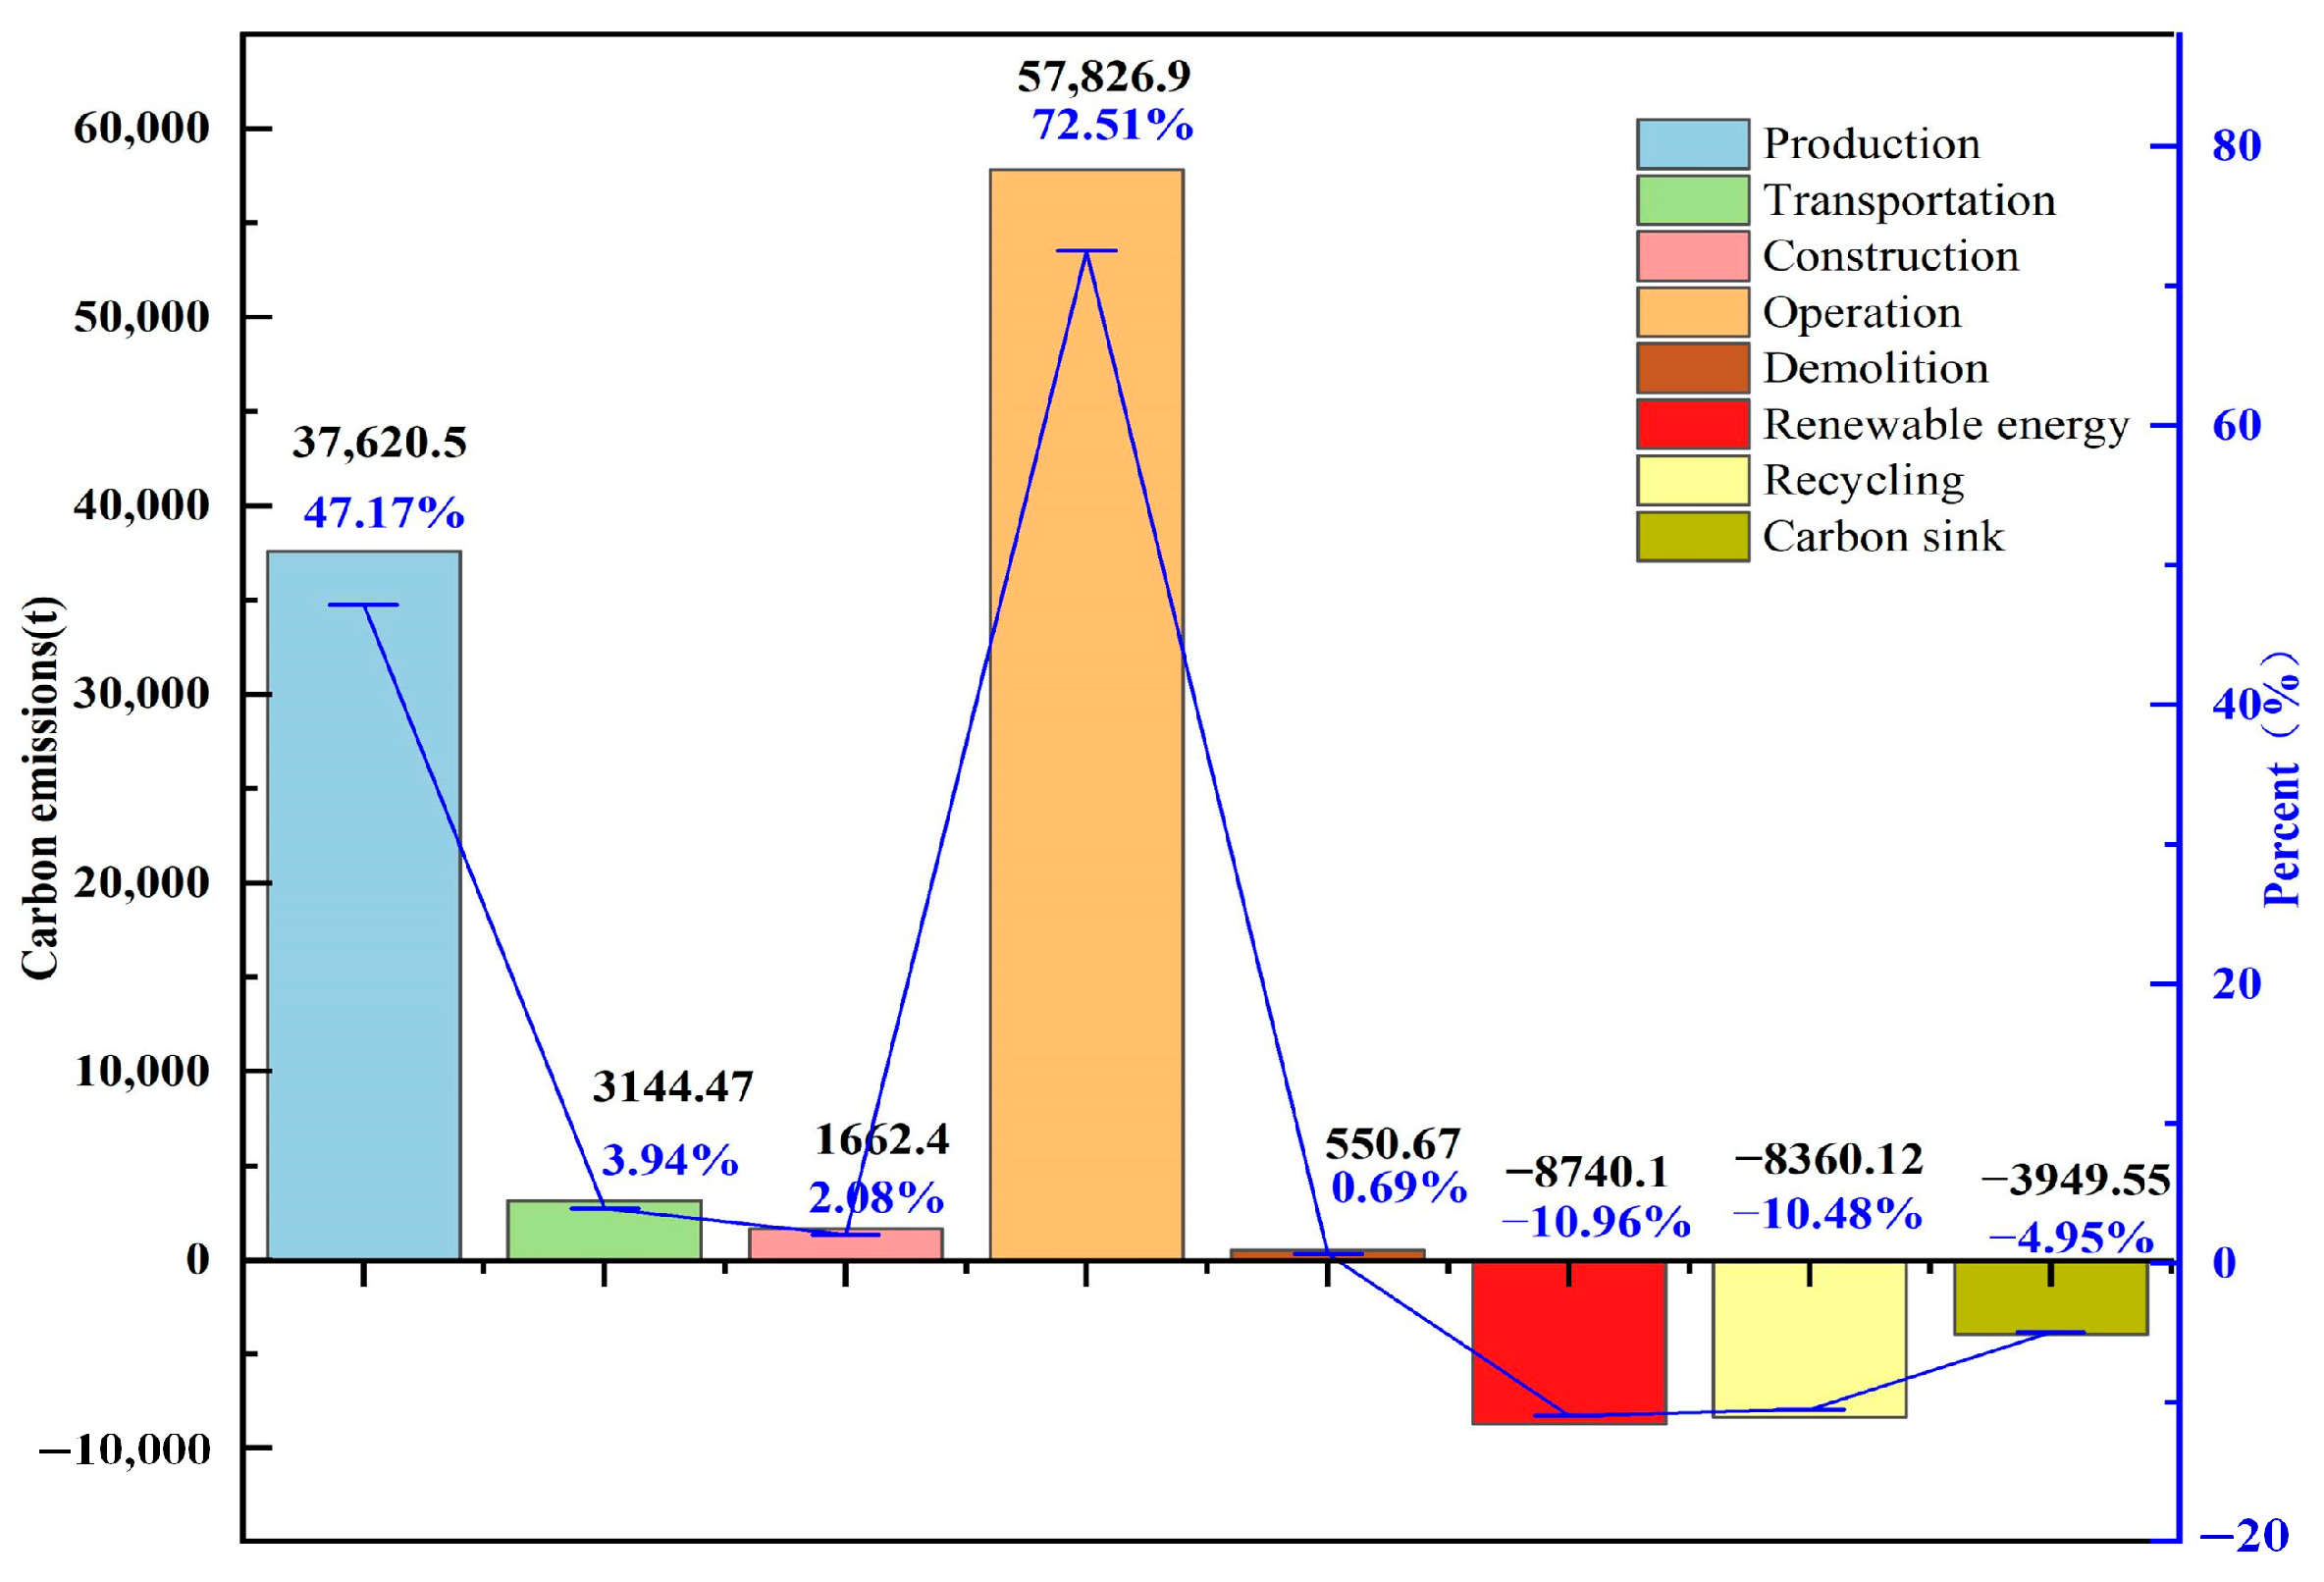
3.7. The Carbon Emissions of the LCA

The building carbon emissions of the LCA are summarized in the aforementioned results, as shown in Figure 6.
Figure 6 presents a detailed breakdown of carbon emissions across various stages of the building’s life cycle, amounting to 79,755.173 tonnes in total. The building operation stage (57,826.9 tonnes, 72.51%) and the building materials production stage (37,620.5 tonnes, 47.17%) are identified as the primary contributors to emissions, underscoring the critical role of energy efficiency in material selection and application. In contrast, the transportation (3144.468 tonnes, 3.94%), construction (1662.4 tonnes, 2.08%), and dismantling (550.67 tonnes, 0.69%) phases contribute relatively minor emissions. It is noteworthy that the utilization of renewable energy, building recycling, and carbon sequestration have led to reductions in carbon emissions by 8740.1 tonnes (−10.96%), 8360.12 tonnes (−10.48%), and 3949.545 tonnes (−4.95%), respectively, significantly contributing to the mitigation of the building’s overall carbon footprint.
The annual carbon emissions per unit area of the building during the whole life cycle are
C = 79,755.173 ÷ 97,463.14 ÷ 50 = 16.366 kg/(m2·a)
This summary of data delineates specific carbon emissions at each stage of a building’s life cycle, with particular emphasis on the material production and operation phases. The subsequent section delves deeper into the similarities and differences between these findings and those from other domestic and international studies.

3.8. Sensitivity Analysis

To assess the impact of changes in key parameters on building life cycle carbon emissions and to identify the factors that have the greatest impact on total carbon emissions, we performed a sensitivity analysis.
From the above analysis, it can be seen that the operation stage (72.51%) and production stage (47.17%) dominate the whole life cycle of CO2 emissions. Therefore, the study focused on two key parameters: the consumption of building materials and the energy in the operation stage. Table 8 presents a sensitivity analysis of the factors influencing annual CO2 emissions per unit area, achieved by modifying parameter settings.
Table 8 demonstrates that electricity consumption has the most substantial impact on carbon emissions, with its increase significantly surpassing that of other factors. This is followed by steel and heating energy consumption, which, despite relatively modest increases, remain critical due to their direct influence on the building’s overall environmental footprint. In contrast, concrete exhibits a relatively minor impact but remains an essential component in optimizing carbon emissions. These findings indicate that when formulating emission reduction strategies, priority should be given to enhancing electricity efficiency, such as through the adoption of energy-efficient equipment and renewable energy systems. Simultaneously, attention must also be directed toward selecting low-carbon or recycled materials for construction. Only by considering the synergistic effects of these factors can the comprehensive low-carbon objective of the building’s entire life cycle be achieved, thereby fostering the sustainable development of the construction industry.

4. Discussion

4.1. Comparison of CO2 Emissions over the Life Cycle

According to the above calculation results, this study indicates that the operation stage is the primary source of carbon emissions (accounting for 61.54% of total emissions, including renewable energy), followed by the material production stage (47.17%). This aligns with findings from other studies, which show that in the entire life cycle of buildings, the material production and operation stages typically have the highest carbon emissions. A comparison of life-cycle CO2 emissions between different studies is shown in Table 9.
Table 9 demonstrates that despite variations in countries, economic levels, thermal preferences, and specific values across different studies, the overall trend of CO2 emissions throughout the life cycle of buildings exhibits consistent characteristics. The largest proportion of CO2 emissions is generated during the operational phase to meet various needs such as heating, ventilation, air conditioning (HVAC), hot water, elevators, and lighting. For instance, studies by Wang et al. in China and Junnila et al. in the United States indicate that the operational phase accounts for approximately 90% of total emissions, while an Australian study reported a slightly lower figure of 87% [27,28,29]. In contrast, this study reveals that the share of the operational phase, including renewable energy contributions, is 61.54%, which is notably lower than other studies. This discrepancy may be attributed to the inclusion of renewable energy systems in this analysis, which would otherwise result in a significantly higher percentage, potentially exceeding 70%. Therefore, minimizing carbon emissions during the operational phase remains the most critical task for reducing the carbon footprint of buildings.
Material production is a significant contributor to carbon emissions, particularly in the context of research in China. Cai et al. [8] discovered that prefabricated light steel structures exhibit lower carbon emissions throughout their entire life cycle compared to traditional cast-in-place concrete structures. Grinning et al. (2020) [31] reported that material production and transportation account for approximately 40% of a building’s total life cycle carbon emissions, with nearly two-thirds of these emissions attributed to the main structure and envelope. This finding aligns with our study, underscoring the critical role of material selection in reducing carbon emissions. Consequently, optimizing building materials is an indispensable strategy for mitigating building-related carbon emissions.
Carbon emissions from transport, construction, and demolition are generally low; however, they can be significant in certain cases. This study found that transportation accounted for 3.94% of total carbon emissions, while construction and demolition contributed 2.08% and 0.69%, respectively.
In particular, this paper examines the pivotal role of recycling and carbon sinks in urban green spaces, which have been demonstrated to significantly mitigate carbon emissions throughout the life cycle of buildings. Specifically, the reuse of steel with a high recovery rate has led to a 10% reduction in carbon emissions. Wang et al. emphasized that to maximize the recycling rate of construction waste and effectively reduce the carbon footprint associated with new material production, an efficient construction waste classification management system must be established [3]. This system ensures proper waste disposal and the selection of appropriate resource recovery technologies. Effective recycling extends beyond materials to encompass the reuse of equipment, components, and entire buildings, thereby extending product and service lifespans and further reducing the consumption of new resources and associated carbon emissions. Optimizing carbon emission management throughout the building life cycle contributes to achieving sustainable development goals.
Urban green spaces serve as important carbon sinks that can absorb and store substantial amounts of carbon dioxide, thereby alleviating the carbon emission pressure in cities. According to Ref. [32], the carbon sequestration capacity of green spaces can be significantly enhanced through optimized design and maintenance practices, such as adopting forest-style management and reducing tree mortality. The net carbon sequestration capacity of trees is estimated to range between 137 and 162 Mg CO2 ha−1. Moreover, effective management practices can also reduce carbon emissions during construction and maintenance, improving the long-term environmental performance of urban green spaces. This study demonstrates that urban green space carbon sink strategies can reduce total carbon emissions by approximately 5%. Therefore, properly planned and managed urban green spaces are an integral component of climate change mitigation efforts.
In contrast, limited research has thoroughly examined the impact of these two aspects, particularly within the construction industry and urban planning. Fewer studies have investigated the combined effects of recycling and green space carbon sinks on carbon emission reduction. This study underscores the significance of both strategies for mitigating carbon emissions.
To gain a more comprehensive understanding of the project’s performance in low-carbon building design and construction, researchers conducted a comparative analysis against the internationally recognized Leadership in Energy and Environmental Design (LEED) standard. The research indicates that, in terms of carbon emissions, this case demonstrates lower emissions compared to buildings that comply with these international benchmarks. A primary contributing factor is the integration of renewable energy, which plays a crucial role in reducing carbon emissions. Notably, despite the differences, this study underscores the significance of adopting holistic emission reduction strategies, such as promoting the use of low-energy building materials, photovoltaic systems, and energy storage technologies, in alignment with international best practices. Furthermore, the measures tailored to Beijing’s local climatic conditions and socio-economic characteristics offer valuable reference for other cities with analogous backgrounds.

4.2. Emission Reduction Strategies

Based on the detailed analysis of the carbon emission characteristics at each stage of the building life cycle presented in the previous section (see Table 9), it has been identified that the operation and material production stages are the primary sources of carbon emissions. Additionally, the negative emission effects of the recycling stage and carbon sink mechanisms are significant, indicating that the overall carbon footprint of buildings can be effectively reduced through well-designed strategies. However, to genuinely achieve the goal of low-carbon buildings, it is essential not only to understand these emission characteristics but also to implement concrete and feasible emission reduction strategies to guide practice. Therefore, this section focuses on how these carbon reduction measures can be applied in real-world projects.

4.2.1. Low-Carbon Materials

According to the data presented in Figure 4 of Section 3.1, concrete and steel are responsible for over 90% of carbon emissions during the material production phase. Consequently, mitigating the carbon footprint associated with these materials is a critical factor in achieving overall emission reduction targets. The introduction of more environmentally friendly, low-carbon building materials can significantly reduce carbon emissions at this stage, thereby facilitating the green transformation of the construction industry.
In conventional cement production, the calcination of limestone releases a substantial amount of CO2, approximately 800–900 kg per ton of ordinary Portland cement (OPC) produced [33]. Carbon emissions can be markedly reduced through the utilization of alternative raw materials (e.g., granulated slag and coal fly ash) or novel binding materials (e.g., geopolymer cement) [34]. Research has demonstrated that steel slag-based aerated concrete not only enhances compressive strength by up to 25% but also decreases carbon emissions by over 40% [35].
Furthermore, numerous scholarly articles have highlighted that prefabricated light steel buildings exhibit substantially lower embodied energy and carbon emissions during both material production and construction phases compared to traditional cast-in-place concrete structures. The research indicates that the total embodied energy of prefabricated light steel buildings is approximately 20–30% lower, with a corresponding reduction in carbon emissions by around 30%. The energy consumption for producing recycled steel is roughly one-third that of raw steel. Therefore, prioritizing the use of recycled steel in architectural design, particularly in critical components such as structural frames, beams, and columns, can significantly mitigate the project’s carbon footprint [8,36,37].
In summary, the introduction of low-carbon cement and the utilization of prefabricated light steel buildings or recycled steel not only significantly reduces carbon emissions during the production stage of building materials but also enhances material properties and extends the service life of buildings. The effectiveness of this comprehensive approach is notable and merits widespread adoption in future construction projects. To support this transition, the government has implemented a series of policies. For instance, in 2015, the State Council released the “Made in China (2025)” initiative, while in 2016, the Ministry of Industry and Information Technology issued the “Industrial Green Development Plan,” both emphasizing the need to accelerate the transformation from traditional manufacturing to green manufacturing and improve energy efficiency in key energy-consuming industries. Consequently, it is anticipated that carbon emissions from building material production will exhibit a downward trend.

4.2.2. Renewable Energy System

Increased utilization of renewable energy systems can substantially decrease reliance on fossil fuels. Specifically, photovoltaic (PV) systems can generate electricity on-site, thereby reducing the demand for grid-supplied electricity and significantly lowering carbon emissions over their operational life cycle. This study consistently concluded that adopting renewable energy systems could reduce carbon emissions by approximately 175 tons annually. Renewable energy systems represent a mature and extensively deployed technology.
Photovoltaic systems (PV) should be integrated with energy storage technologies to demonstrate greater potential in building decarbonization. This combination not only significantly enhances the energy self-sufficiency and efficiency of buildings but also yields substantial carbon emission reductions and economic benefits. The significant impact of electricity consumption on carbon emissions can be clearly seen in the sensitivity analysis. Hashem et al. demonstrated that the combined application of Building-Integrated Photovoltaic (BIPV) systems and Thermal Energy Storage (TES) systems can reduce carbon emissions by approximately 30–50% [36]. Research by Jian et al. indicates that integrating photovoltaic building cooling systems (PV-BCS) with electrical energy storage and ice storage can achieve a carbon emission reduction of around 30% [37].
Therefore, this paper recommends that future efforts should focus on optimizing the integration and operational strategies of photovoltaic systems with energy storage technologies, including thermal, battery, and ice storage, enhancing energy utilization efficiency through intelligent control systems, minimizing operational carbon emissions, and promoting the development of low-carbon buildings.

4.2.3. Policy Support

Governments should provide financial incentives, such as tax credits, grants, and subsidies, to encourage the use of low-carbon technologies and materials. Moreover, establishing stringent building codes and standards that mandate higher energy efficiency and lower carbon emissions can accelerate the adoption of these technologies.
In addition to recommending that governments provide financial incentives, more specific policy measures can further promote the application and development of low-carbon building materials. For example, governments could implement carbon taxes on high-emission building materials, thereby providing financial incentives for developers to choose low-carbon alternatives. In addition, the government can also set up a special fund to support the research, development, and promotion of new low-carbon building materials and technologies and encourage the construction industry to develop in a more sustainable direction.
Raising public awareness about the benefits of green buildings and the importance of reducing carbon emissions is essential. Educational campaigns and training programs aimed at builders, architects, and homeowners can promote the uptake of low-carbon practices and technologies.
Fostering collaboration between academia, industry, and government for further research and development in low-carbon building technologies can lead to innovative solutions and best practices. This includes developing new materials, improving construction techniques, and refining life cycle assessment methodologies.

4.3. Limitation of the Method

This study is dependent on the existing literature, project design documents, field investigations, and multiple data sources such as building information modeling. Nevertheless, in certain circumstances, it is challenging to obtain precise data for factors like the transport distance of building materials and specific variations in energy consumption during the building maintenance phase, which might exert a certain influence on the accuracy of carbon emissions calculations.
Some of the calculations in the study were predicated on specific assumptions, such as setting the expected service life of the building at 50 years and employing fixed ratios to estimate the recovery rates of different materials. The 50-year building life is based on the requirements of the current building regulations in China. However, it should be taken into account that actual building life may vary depending on a number of factors (such as quality of building materials, level of maintenance, and environmental conditions). A shorter service life, such as 30 years, could lead to a significant rise in carbon emissions due to the increased frequency of material replacement. These assumptions, although in line with current standards and practices, might vary in practical application, influencing the general applicability of the results.
It is important to note that this study primarily focuses on carbon emissions associated with the production and operation of building materials, excluding carbon emissions during the maintenance phase. This decision was made to emphasize the most substantial sources of carbon emissions across the life cycle, thereby providing a clear framework for evaluating a building’s carbon footprint. Nevertheless, maintenance activities, such as facade refurbishment and equipment upgrades, contribute additional carbon emissions that accumulate over time and may significantly influence the overall carbon performance of the building. In future extended studies, the researchers intend to incorporate carbon emissions from the maintenance phase to offer decision-makers a more comprehensive basis for carbon emissions assessment.
This study takes Beijing as an example, taking into account the local climate conditions, policy background, and technology level. However, in other regions, the results obtained and the strategies proposed may not be fully applicable due to their unique geographical environment and socio-economic situation. Therefore, the promotion of research results needs to be adjusted according to the actual local conditions.

5. Conclusions

Based on an in-depth analysis of a high-density residential project in Haidian District, Beijing, China, this paper develops a systematic and refined carbon emission calculation framework by integrating life cycle assessment (LCA) theory with building information modeling (BIM) technology. Using the carbon emission factor method, the study quantifies and analyzes carbon emissions across the entire building life cycle, including material production, transportation, construction, operation, and maintenance, as well as demolition and recycling. By deeply embedding BIM within LCA, this approach not only enhances the accuracy of carbon emission assessments but also improves the flexibility and practicality of the model, enabling real-time updates for material selection and design changes and facilitating rapid evaluations of the carbon emission impacts of different design schemes. This provides decision-makers with more intuitive and actionable recommendations. Specific conclusions are as follows:
From the comparison of CO2 emissions throughout the entire life cycle, it can be concluded that the operation stage is the largest contributor to CO2 emissions, accounting for approximately 72.51%. The production stage of building materials follows as the second largest contributor, contributing around 47.17%. In contrast, the transportation, construction, and demolition stages contribute relatively small amounts, at 3.94%, 2.08%, and 0.69%, respectively. Additionally, renewable energy systems, building recycling, and green space carbon sinks play a role in reducing overall carbon emissions, with respective contributions of −10.96%, −10.48%, and −4.95%.
The largest energy consumption during the operation phase is attributed to the heating system, primarily due to Beijing’s climatic conditions. This is followed by electricity consumption from sockets and lighting. At the material production stage, steel and concrete account for over 90% of carbon emissions.
Given the significant emissions during the operation and material production stages, this paper proposes substituting traditional building materials with low-carbon alternatives, extensively implementing photovoltaic systems, and integrating energy storage technology to mitigate carbon emissions. Additionally, the government should offer financial incentives, establish stringent regulations, and implement other supportive measures to foster the development of low-carbon buildings.
This study holds significant value, and this life-cycle case study can serve as a reference for Beijing and other regions with similar meteorological and economic conditions.

Author Contributions

L.L.: Writing—review and editing, Writing—original draft, Visualization, Methodology, Investigation, Formal analysis, and Conceptualization. L.G.: Visualization, Investigation, Formal analysis, and Conceptualization. X.Z.: Visualization, Investigation, and Formal analysis. H.X.: Visualization, Validation, Methodology, Investigation, Formal analysis, and Conceptualization. L.J.: Formal analysis, Methodology, and Investigation. All authors have read and agreed to the published version of the manuscript.

Funding

This study was supported by the applied innovation project of Hebei Vocational University of Technology and Engineering (No. 202307 and 20240203).

Data Availability Statement

The data presented in this study are available upon request from the corresponding author.

Conflicts of Interest

Author Lu Jiang was employed by the company Walton Design & Consulting Engineering Co., Ltd. The remaining authors declare that the research was conducted in the absence of any commercial or financial relationships that could be construed as a potential conflict of interest.

References

  1. International Energy Agency (IEA). Global Status Report for Buildings and Construction. 2020. Available online: https://www.iea.org/search?q=Global%20Status%20Report%20for%20Buildings%20and%20Construction (accessed on 20 December 2024).
  2. Pérez-Lombard, L.; Ortiz, J.; Pout, C. A review on buildings energy consumption information. Energy Build. 2008, 40, 394–398. [Google Scholar] [CrossRef]
  3. Wang, G.; Luo, T.; Luo, H.; Liu, R.; Liu, Y.; Liu, Z. A comprehensive review of building lifecycle carbon emissions and reduction approaches. City Built Environ. 2024, 2, 12. [Google Scholar] [CrossRef]
  4. The State Council of the People’s Republic of China. Opinions of the Central Committee of the Communist Party of China and the State Council on Fully, Accurately, and Comprehensively Implementing the New Development Philosophy to Do a Good Job in Peaking Carbon Emissions and Achieving Carbon Neutrality. 2020. Available online: https://www.gov.cn/zhengce/2021-10/24/content_5644613.htm (accessed on 4 January 2025).
  5. Xin, L.; Li, S.N.; Rene, E.R.; Lun, X.X.; Zhang, P.Y.; Ma, W.F. Prediction of carbon emissions peak and carbon neutrality based on life cycle CO2 emissions in megacity building sector: Dynamic scenario simulations of Beijing. Environ. Res. 2024, 238, 117160. [Google Scholar] [CrossRef] [PubMed]
  6. ISO 14040; Environmental Management-Life Cycle Assessment Principles and Framework. International Organization for Standardization: Geneva, Switzerland, 2005. [CrossRef]
  7. Junnila, S.; Horvath, A. Life cycle environmental effects of an office building. J. Infrastruct. Syst. 2003, 9, 157–166. [Google Scholar] [CrossRef]
  8. Cai, K.; Wang, H.; Wang, J.; Bai, J.; Zuo, J.; Chan, K.; Lai, K.; Song, Q. Mitigating lifecycle GHG emissions of building sector through prefabricated light-steel buildings in comparison with traditional cast-in-place buildings. Resour. Conserv. Recycl. 2023, 194, 107007. [Google Scholar] [CrossRef]
  9. Peng, C. Calculation of a building’s life cycle carbon emissions based on Ecotect and building information modeling. J. Clean. Prod. 2016, 112, 453–465. [Google Scholar] [CrossRef]
  10. Ding, Y.; Guo, Z.-Z.; Zhou, S.-X.; Wei, Y.-Q.; She, A.-M.; Dong, J.-L. Research on carbon emissions during the construction process of prefabricated buildings based on BIM and LCA. J. Asian Archit. Build. Eng. 2024, 2345312. [Google Scholar] [CrossRef]
  11. Zhang, Y.; Yan, D.; Hu, S.; Guo, S. Modelling of energy consumption and carbon emission from the building construction sector in China, a process-based LCA approach. Energy Policy 2019, 134, 110949. [Google Scholar] [CrossRef]
  12. Falana, J.; Osei-Kyei, R.; Tam, V.W. Towards achieving a net zero carbon building: A review of key stakeholders and their roles in net zero carbon building whole life cycle. J. Build. Eng. 2024, 82, 108223. [Google Scholar] [CrossRef]
  13. Liu, Z.; Zhou, Q.; Tian, Z.; He, B.J.; Jin, G. A comprehensive analysis on definitions, development, and policies of nearly zero energy buildings in China. Renew. Sustain. Energy Rev. 2019, 114, 109314. [Google Scholar] [CrossRef]
  14. Dicko, A.H.; Roux, C.; Peuportier, B. Achieving Net Zero Carbon Performance in a French Apartment Building? Energies 2023, 16, 7608. [Google Scholar] [CrossRef]
  15. Kayaçetin, N.C.; Hozatlı, B. Whole life carbon assessment of representative building typologies for nearly zero energy building definitions. J. Build. Eng. 2024, 95, 110214. [Google Scholar] [CrossRef]
  16. Joseph, V.R.; Mustaffa, N.K. Carbon emissions management in construction operations: A systematic review. Eng. Constr. Archit. Manag. Emerald Publ. Ltd. 2021, 30, 1271–1299. [Google Scholar] [CrossRef]
  17. Feng, H.; Zhao, J.; Zhang, H.; Zhu, S.; Li, D.; Thurairajah, N. Uncertainties in whole-building life cycle assessment: A systematic review. J. Build. Eng. 2022, 50, 104191. [Google Scholar] [CrossRef]
  18. Zhang, Z.; Gao, Q.; Shao, S.; Zhang, Y.; Bao, Y.; Zhao, L. Carbon emission scenarios of China’s construction industry using a system dynamics methodology-Based on life cycle thinking. J. Clean. Prod. 2024, 435, 140457. [Google Scholar] [CrossRef]
  19. Zhao, Z.; Liu, C.; Xie, H.; Li, Y.; Zhu, C.; Liu, M. Carbon Accounting and Carbon Emission Reduction Potential Analysis of Sponge Cities Based on Life Cycle Assessment. Water 2023, 15, 3565. [Google Scholar] [CrossRef]
  20. Ma, Y.; Liu, X.; Liu, J.; Du, C.; Liang, M.; Li, W.; Cao, L.; Wang, D.; Wang, H.; Zhang, T.; et al. Carbon Emission Accounting and Reduction Evaluation in Sponge City Residential Areas. Water 2024, 16, 2535. [Google Scholar] [CrossRef]
  21. GB/T 51366-2019; Standard for Building Carbon Emission Calculation. The Ministry of Housing and Urban-Rural Development of China: Beijing, China, 2019. Available online: https://www.mohurd.gov.cn/gongkai/zc/wjk/art/2024/art_17339_779260.html (accessed on 10 January 2025).
  22. JGJ/T 449-2018; Civil Building Green Performance Calculation Standard. The Ministry of Housing and Urban-Rural Development of China: Beijing, China, 2018. Available online: https://www.mohurd.gov.cn/gongkai/zc/wjk/art/2020/art_17339_246340.html (accessed on 25 February 2025).
  23. GB55015-2021; General Code for Building Energy Efficiency and Renewable Energy Utilization. The Ministry of Housing and Urban-Rural Development of China: Beijing, China, 2021. Available online: https://www.mohurd.gov.cn/gongkai/zc/wjk/art/2021/art_17339_762460.html (accessed on 25 February 2025).
  24. Xiong, A.; Zhu, Y.; Wang, B.; Li, Q.; Song, F.; Zhu, Q.; Wu, R.; Jiang, Y. Special Meteorological Data Set for Building Thermal Environment Analysis in China; China Architecture & Building Press: Beijing, China, 2005; pp. 68–79. [Google Scholar]
  25. Zhu, K.; Zhang, Q.; Wu, P.; Feng, L. Progression in the Methods of Accounting Carbon Sequestration of Urban Green Space. Shaanxi For. Sci. Technol. 2015, 4, 42–47. [Google Scholar]
  26. He, M.J. Green Building Interpretive Evaluation Manual-Basic Version. 2012. Available online: https://jz.docin.com/p-1955959011.html (accessed on 25 February 2025).
  27. Wang, E.; Shen, Z.; Barryman, C. A Building LCA Case Study Using Autodesk Ecotect and BIM Model. 47th ASC Annual International Conference Proceedings. 2011. Available online: https://digitalcommons.unl.edu/constructionmgmt/6 (accessed on 1 March 2025).
  28. Biswas, W.K. Carbon footprint and embodied energy consumption assessment of building construction works in Western Australia. Int. J. Sustain. Built Environ. 2014, 3, 179–186. [Google Scholar] [CrossRef]
  29. Junnila, S.; Horvath, A.; Guggemos, A.A. Life-Cycle Assessment of Office Buildings in Europe and the United States. J. Infrastruct. Syst. 2006, 12, 10–17. [Google Scholar] [CrossRef]
  30. Lassio, J.G.; Branco, D.C.; Magrini, A. Assessing the Greenhouse Gas Emissions of Buildings in Brazil: A Case Study of a Housing Complex. Environ. Eng. Manag. J. 2021, 20, 1225–1236. [Google Scholar] [CrossRef]
  31. Grynning, S.; Gradeci, K.; Gaarder, J.E.; Time, B.; Lohne, J.; Kvande, T. Climate Adaptation in Maintenance Operation and Management of Buildings. Buildings 2020, 10, 107. [Google Scholar] [CrossRef]
  32. Strohbach, M.W.; Arnold, E.; Haase, D. The carbon footprint of urban green space—A life cycle approach. Landsc. Urban Plan. 2012, 104, 220–229. [Google Scholar] [CrossRef]
  33. Ige, O.E.; Olanrewaju, O.A.; Duffy, K.J.; Obiora, C. A review of the effectiveness of Life Cycle Assessment for gauging environmental impacts from cement production. J. Clean. Prod. 2021, 324, 129213. [Google Scholar] [CrossRef]
  34. Orsini, F.; Marrone, P. Approaches for a low-carbon production of building materials: A review. J. Clean. Prod. 2025, 241, 118380. [Google Scholar] [CrossRef]
  35. Deng, J.; Gu, L.; Wang, P.; Zhang, X.; Ma, X. Developing sustainable steel slag-based aerated concrete: Effects of accelerated carbonation on performance and carbon emissions. J. Build. Eng. 2024, 98, 111051. [Google Scholar] [CrossRef]
  36. Toosi, H.A.; Lavagna, M.; Leonforte, F.; Del Pero, C.; Aste, N. Building decarbonization: Assessing the potential of building-integrated photovoltaics and thermal energy storage systems. Energy Rep. 2022, 8, 574–581. [Google Scholar] [CrossRef]
  37. Kang, J.; Wang, J.; Liu, C.; Ye, S.; Yang, M. Coordinated optimization of configuration and operation of a photovoltaic integrated building cooling system with electricity and ice storages under source-load uncertainties. Energy Build. 2024, 320, 114600. [Google Scholar] [CrossRef]
Figure 1. An overview map of the study area.
Buildings 15 01403 g001
Figure 2. The life cycle stages and boundaries.
Buildings 15 01403 g002
Figure 3. Typical annual meteorological data of Beijing.
Buildings 15 01403 g003aBuildings 15 01403 g003b
Figure 4. The carbon emission characteristics in the building materials production stage.
Buildings 15 01403 g004
Figure 5. The annual carbon emission characteristics in the building operation stage.
Buildings 15 01403 g005
Figure 6. Carbon emissions of the LCA.
Buildings 15 01403 g006
Table 1. List of construction machinery in the construction stage.
Name of
Construction Machinery
Energy Consumption
per Unit Machine-Team
Unit of Energy
Consumption
Total Machine-Team Consumption
of Construction Machinery
(Machine-Team)
Spot welder (75 kVA)156.63kWh/machine-team636.11
Electric hammer (520 w)4.06kWh/machine-team10,394.12
Electric single-barrel
slow winch (30 kN)
28.76kWh/machine-team3622.70
Electric drill6.33kWh/machine-team1223.49
Steel bar cutter (40 mm)32.10kWh/machine-team238.78
Pipe cutter (150 mm)12.90kWh/machine-team93.24
Steel wheel internal
combustion roller (8 t)
19.79kg diesel oil/machine-team93.24
Electric tamper (250 Nm)16.6kWh/machine-team13,242.64
Mortar mixer (200 L)8.61kWh/machine-team4212.68
Concrete vibrator
(plug-in type)
11.70kWh/machine-team4295.53
Concrete vibrator
(plate type)
5.86kWh/machine-team626.04
Motorized dump
truck (1 t)
6.03kg diesel oil/machine-team3365.08
Ac arc welding
machine (32 kVA)
96.53kWh/machine-team12,592.56
Multifaceted woodworking
cutting machine (400 mm)
30.70kWh/machine-team25.67
Wood drilling
machine
4.7kWh/machine-team21.12
Woodworking mortise
machine (160 mm)
27kWh/machine-team9.75
Woodworking
flat planer (500 mm)
12.9kWh/machine-team24.69
Woodworking three side
press planer (400 mm)
52.4kWh/machine-team43.21
Woodworking circular saw machine (500 mm)24kWh/machine-team75.70
Polishing machine82.00kWh/machine-team20.14
Dynamic tamping machine (1200 kNm)32.75kg diesel oil/machine-team924.28
Watering cart (4000 L)30.21kg diesel oil/machine-team804.40
Rock cutter (3 kW)11.28kWh/machine-team99.74
Concrete mixer (500 L)55.04kWh/machine-team2629.23
Crawler bulldozer (105 kw)60.80kg diesel oil/machine-team76.02
truck (6 t)33.24kg diesel oil/machine-team52.95
truck (8 t)35.49kg diesel oil/machine-team29.89
Truck crane (8 t)28.43kg diesel oil/machine-team19.82
Crawler crane (15 t)29.52kg diesel oil/machine-team13.97
Truck crane (20 t)38.41kg diesel oil/machine-team16.57
Wheeled tractor (21 kW)18.10kg diesel oil/machine-team10.40
Caterpillar diesel
pile driver (2.5 t)
44.37kg diesel oil/machine-team5814.65
Crawler single bucket
hydraulic excavator
63.00kg diesel oil/machine-team232.94
Table 2. The amount of carbon sequestered per unit area of different planting modes over 40 years.
Planting
Code
Planting ModesThe Amount of
Carbon Sequestration
(kg/m2)
P1large and small arbors, shrubs, flowers, and plants were mixed (with an average planting spacing of trees < 3.0 m)1200
P2broadleaf large arbors900
P3broadleaf small arbors,
coniferous arbors, deciduous arbors
600
P4palm400
P5dense shrubs300
P6perennial vines100
P7grass flower bed, weed, lawn, aquatic plant20
Table 3. List of construction machinery in the demolition stage.
Name of
Construction Machinery
Energy Consumption
per unit Machine-Team
Unit of Energy
Consumption
Total Machine-Team Consumption
of Construction Machinery
(Machine-Team)
Spot welder (75 kVA)156.63kWh/machine-team565.61
Electric hammer (520 w)4.06kWh/machine-team9243.08
Electric single-barrel
slow winch (30 kN)
28.76kWh/machine-team3221.48
Electric drill6.33kWh/machine-team1088.01
Steel bar cutter (40 mm)32.10kWh/machine-team212.14
Pipe cutter (150 mm)12.90kWh/machine-team82.84
Steel wheel internal
combustion roller (8 t)
19.79kg diesel oil/machine-team82.84
Electric tamper (250 Nm)16.6kWh/machine-team11,776.15
Mortar mixer (200 L)8.61kWh/machine-team3746.16
Concrete vibrator
(plug-in type)
11.70kWh/machine-team3819.91
Concrete vibrator
(plate type)
5.86kWh/machine-team556.84
Motorized dump
truck (1 t)
6.03kg diesel oil/machine-team2992.44
Ac arc welding
machine (32 kVA)
96.53kWh/machine-team11,197.87
Multifaceted woodworking
cutting machine (400 mm)
30.70kWh/machine-team22.43
Wood drilling
machine
4.7kWh/machine-team18.84
Woodworking mortise
machine (160 mm)
27kWh/machine-team8.77
Woodworking
flat planer (500 mm)
12.9kWh/machine-team22.09
Woodworking three side
press planer (400 mm)
52.4kWh/machine-team38.34
Woodworking circular saw machine (500 mm)24kWh/machine-team67.25
Polishing machine82.00kWh/machine-team17.87
Dynamic tamping machine (1200 kNm)32.75kg diesel oil/machine-team821.94
Watering cart (4000 L)30.21kg diesel oil/machine-team715.38
Rock cutter (3 kW)11.28kWh/machine-team88.69
Concrete mixer (500 L)55.04kWh/machine-team2337.82
Crawler bulldozer (105 kw)60.80kg diesel oil/machine-team67.57
truck (6 t)33.24kg diesel oil/machine-team47.11
truck (8 t)35.49kg diesel oil/machine-team26.64
Truck crane (8 t)28.43kg diesel oil/machine-team17.54
Crawler crane (15 t)29.52kg diesel oil/machine-team12.67
Truck crane (20 t)38.41kg diesel oil/machine-team14.62
Wheeled tractor (21 kW)18.10kg diesel oil/machine-team9.10
Caterpillar diesel
pile driver (2.5 t)
44.37kg diesel oil/machine-team5170.74
Crawler single bucket
hydraulic excavator
63.00kg diesel oil/machine-team206.95
Table 4. Carbon emissions in the building construction stage.
Building Area
(m2)
Diesel Consumption
(kg)
Diesel
Factor
(t/kg)
Power Consumption
(kWh)
Power Factor
(t/kWh)
CO2 Emissions
(t)
97,463.14358,596.460.0030951,619,961.490.0003411662.40
Table 5. Decreased carbon emissions from renewable energy generation.
Types of Energy ConsumptionAnnual Consumption
(kWh/m2·a)
Annual Energy Consumption of Coal (kg/m2·a)Annual CO2 Emissions
(t/a)
Renewable energy generation4.89−0.6−174.802
Table 6. Carbon emissions in the building demolition stage.
Building Area
(m2)
Diesel Consumption
(kg)
Diesel
Factor
(t/kg)
Power Consumption
(kWh)
Power Factor
(t/kWh)
CO2 Emissions
(t)
97,463.14148,096.540.003095270,445.270.000341550.67
Table 7. Carbon emissions in the building recycling stage.
Types of Recycled Building MaterialsWeight
(t)
Recycling RateCarbon Emission CoefficientCO2 Emissions
(t)
Steel8123.8950.4−2.53−8221.382
Glass409.2560.3−1.13−138.738
Total−8360.120
Table 8. The data from a sensitivity analysis for annual CO2 emissions per unit area.
ParametersVariation RangeAnnual CO2 Emissions per Unit Area (kg/m2·a)Compared with Existing Design
Existing design-16.366-
Concrete+10%16.700+2.04%
Steel+10%16.787+2.57%
Heating+10%16.704+2.07%
Electricity+10%17.219+5.21%
Table 9. A comparison of CO2 emissions over the life-cycle from various studies.
ReferenceCountryCO2 Emissions
Production StageTransportation StageConstruction StageOperational StageDemolition StageRecycling StageTotal
(t)
This paperChina47.17%3.94%2.08%61.54%
(including renewable energy)
0.69%−10.48%79,755
[9]China12.6%85.4%2%-85,667
[27]China7.8%<1%>90%---
[28]Australia11%2%87%--14,229
[29]USA and Europe10%/12%90%/88%---
[30]Brazil30%56%14%-282.62
Disclaimer/Publisher’s Note: The statements, opinions and data contained in all publications are solely those of the individual author(s) and contributor(s) and not of MDPI and/or the editor(s). MDPI and/or the editor(s) disclaim responsibility for any injury to people or property resulting from any ideas, methods, instructions or products referred to in the content.

