
Multi-Viewpoint Assessment of Urban Waterfront Skylines: Fractal and Spatial Hierarchy Analysis in Shanghai


Abstract
:1. Introduction
1.1. Uniqueness of Nonlinear Expansion in Urban Waterfront Areas
1.2. Necessity of the Research on Nonlinear Urban Expansion in Waterfront Areas
1.3. Relationship Between Fractal Theory and Spatial Hierarchy
1.4. Relationship Between Nonlinearly Expanded Cities and Multi-Viewpoint Observation
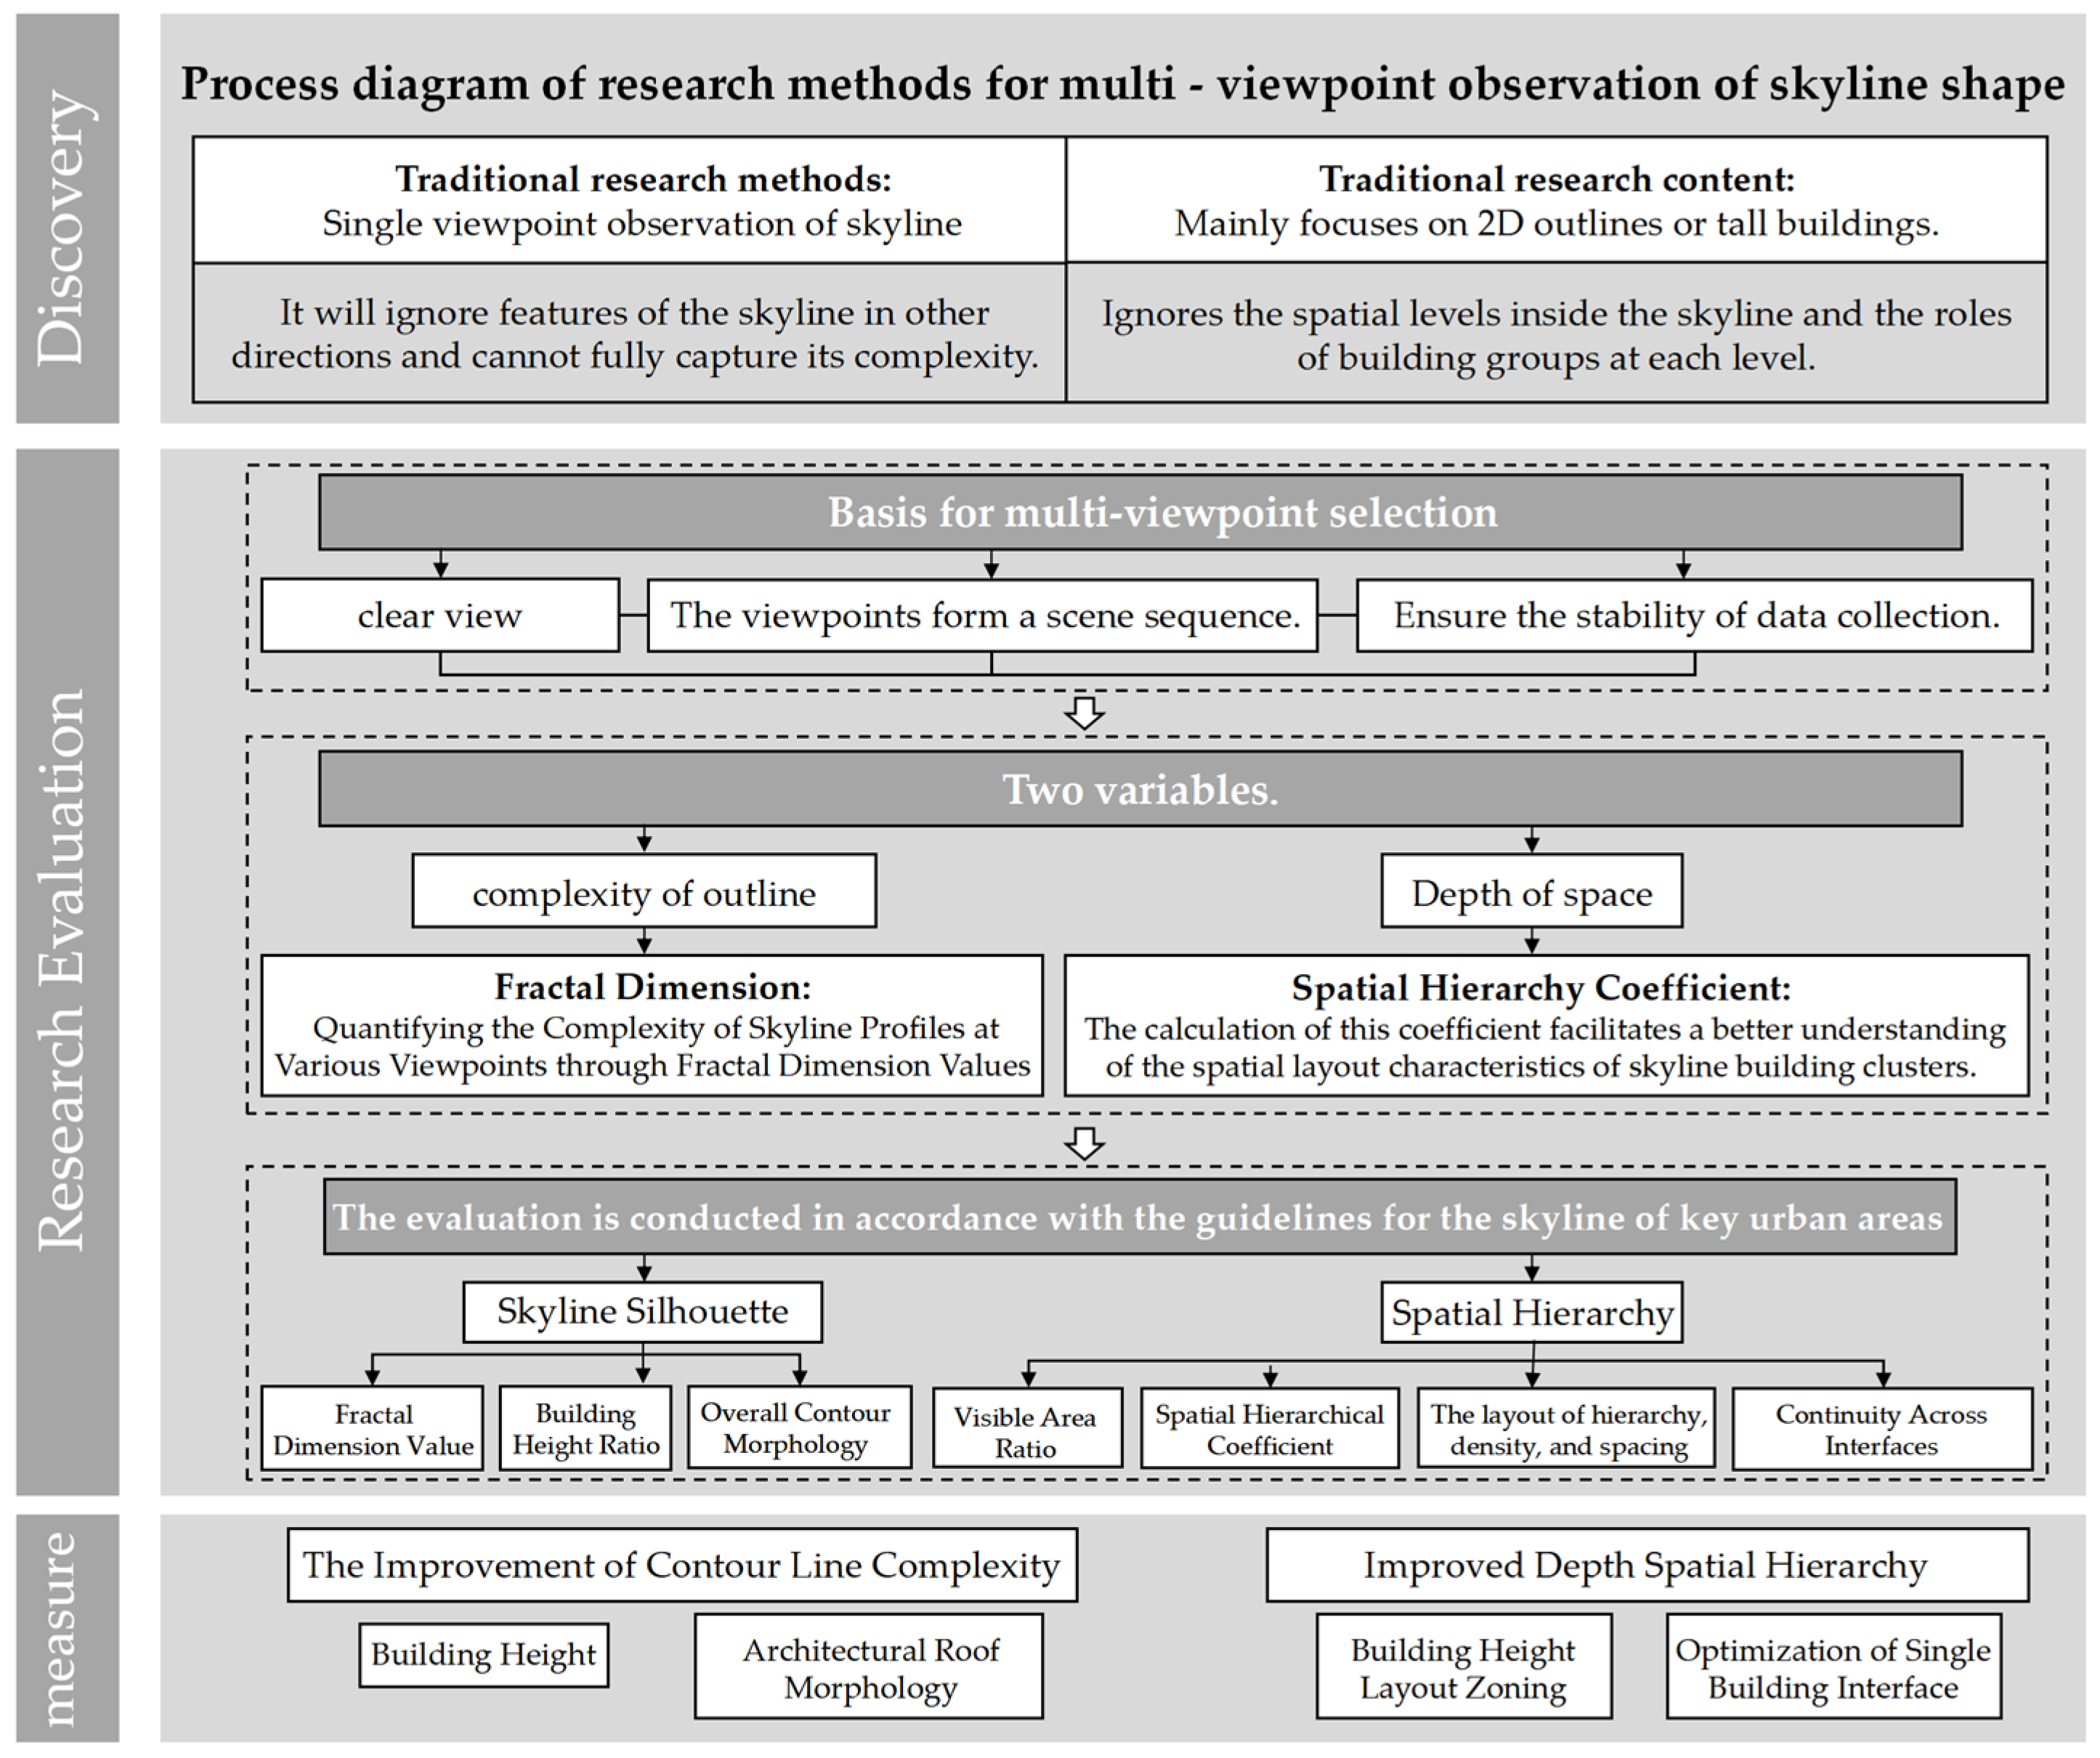
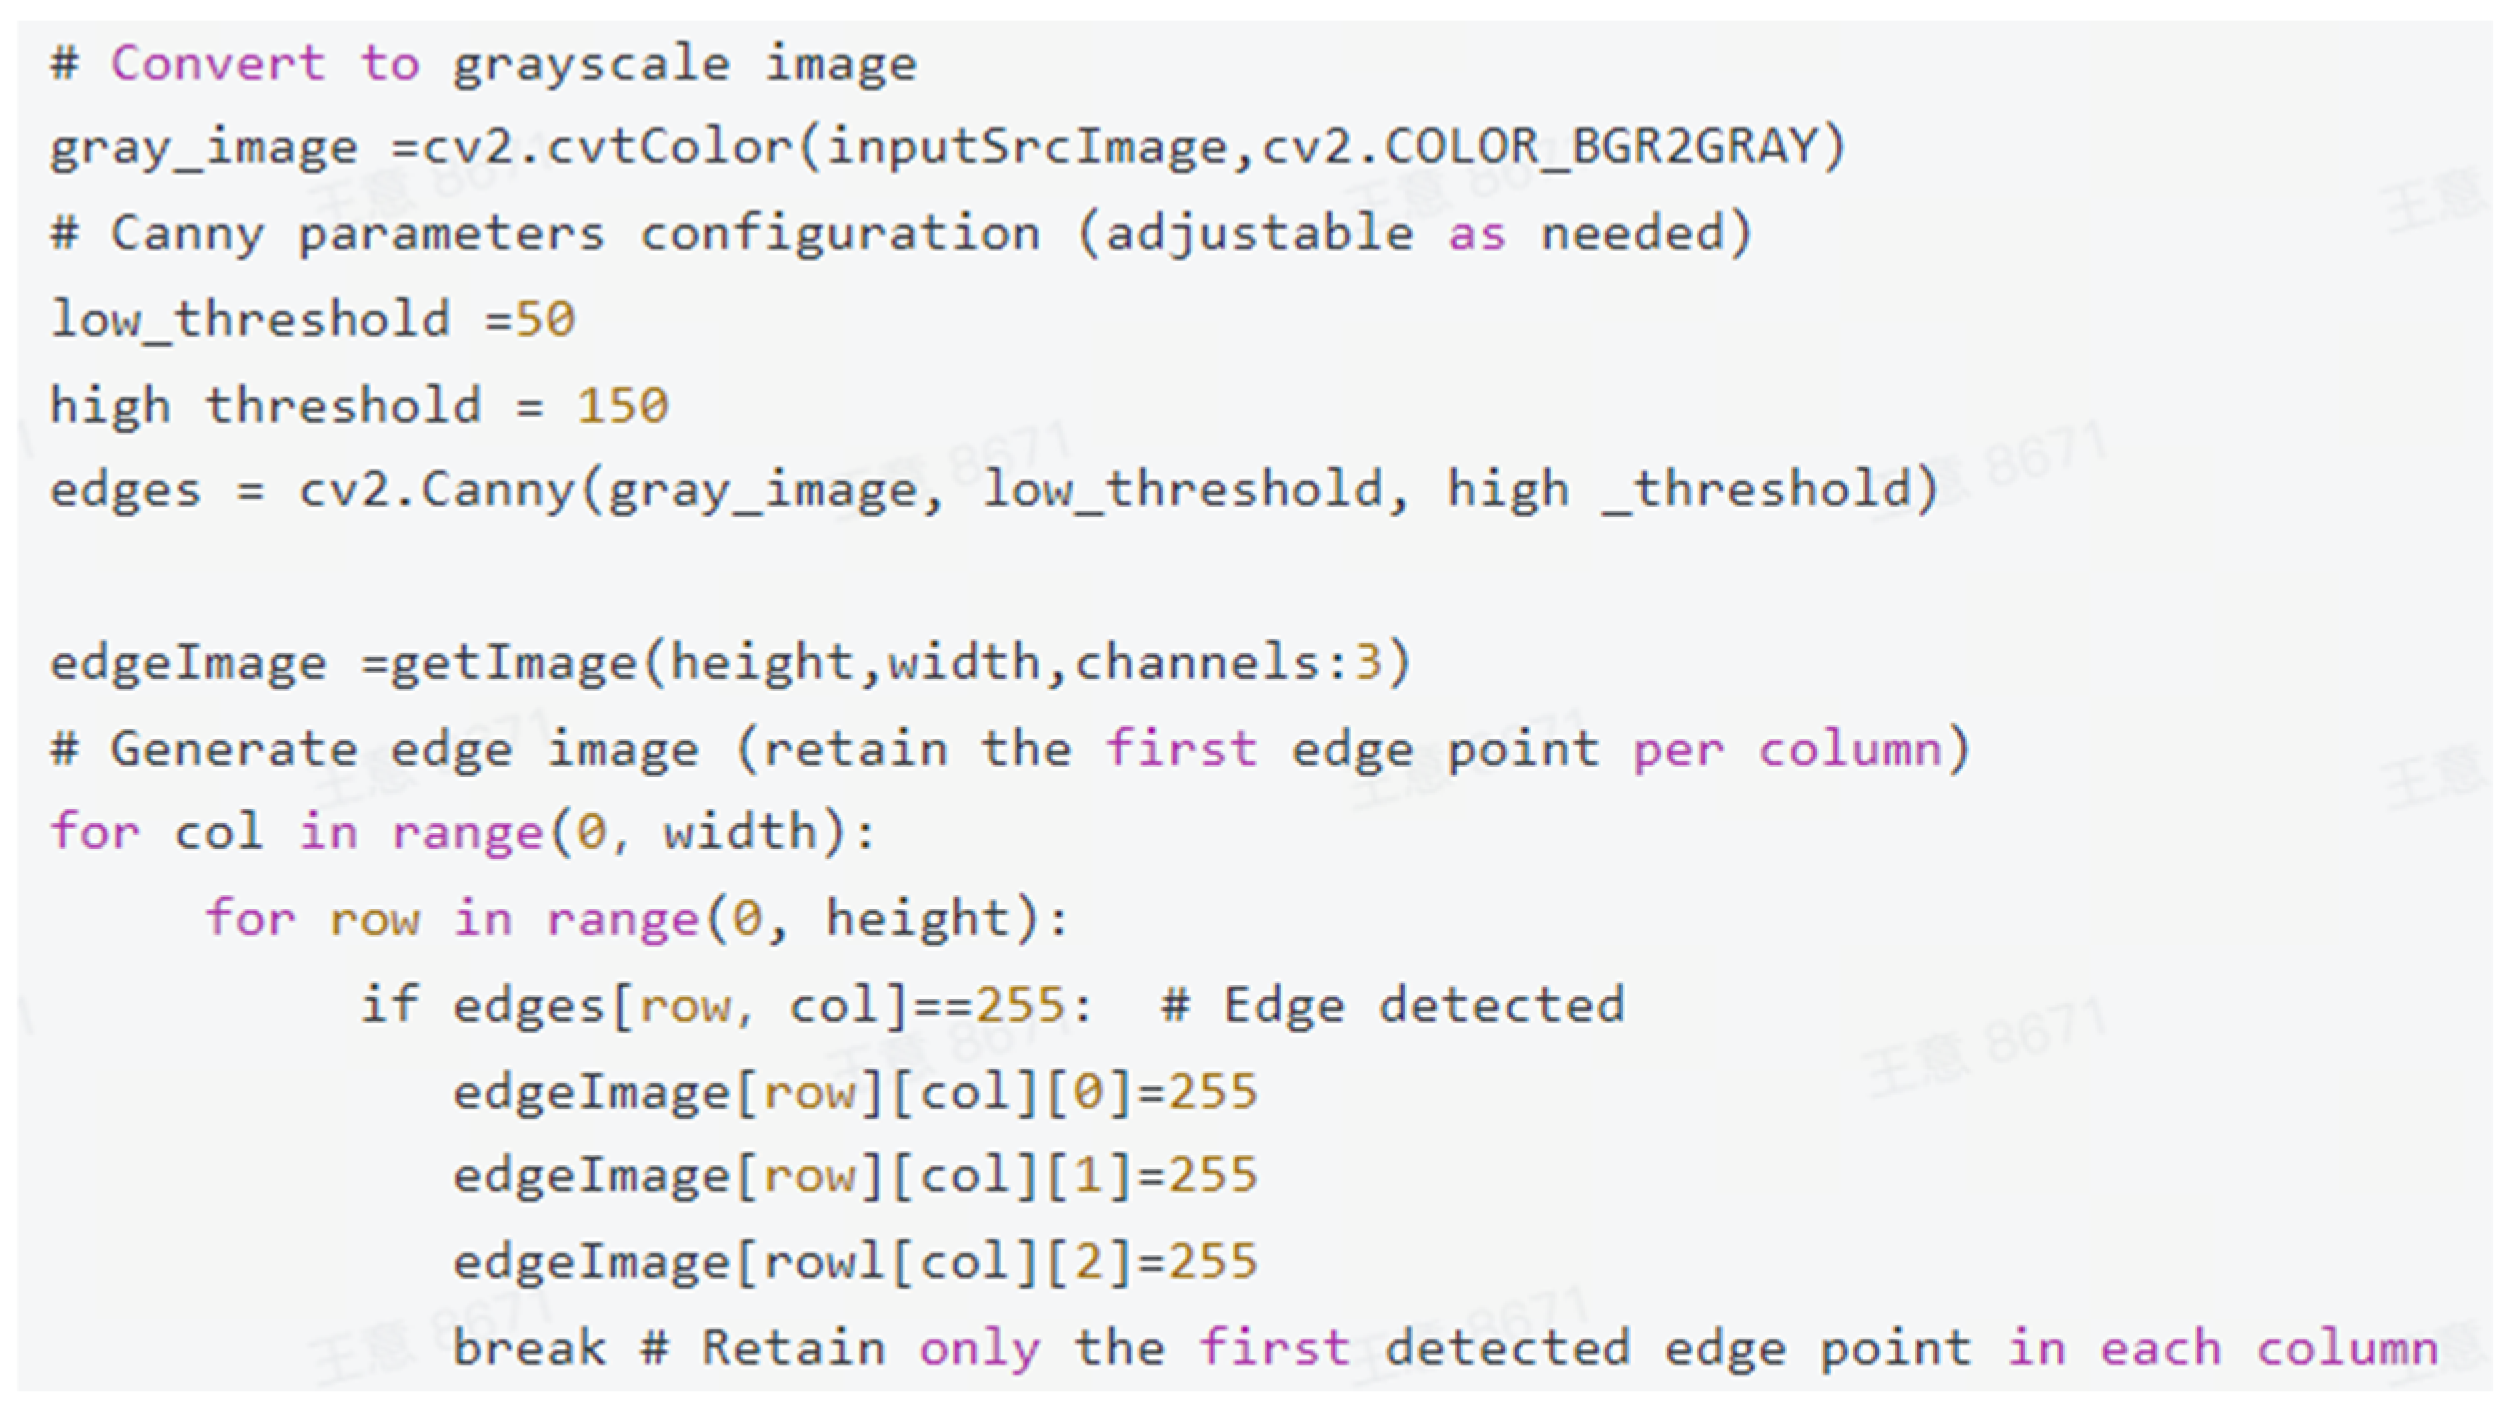
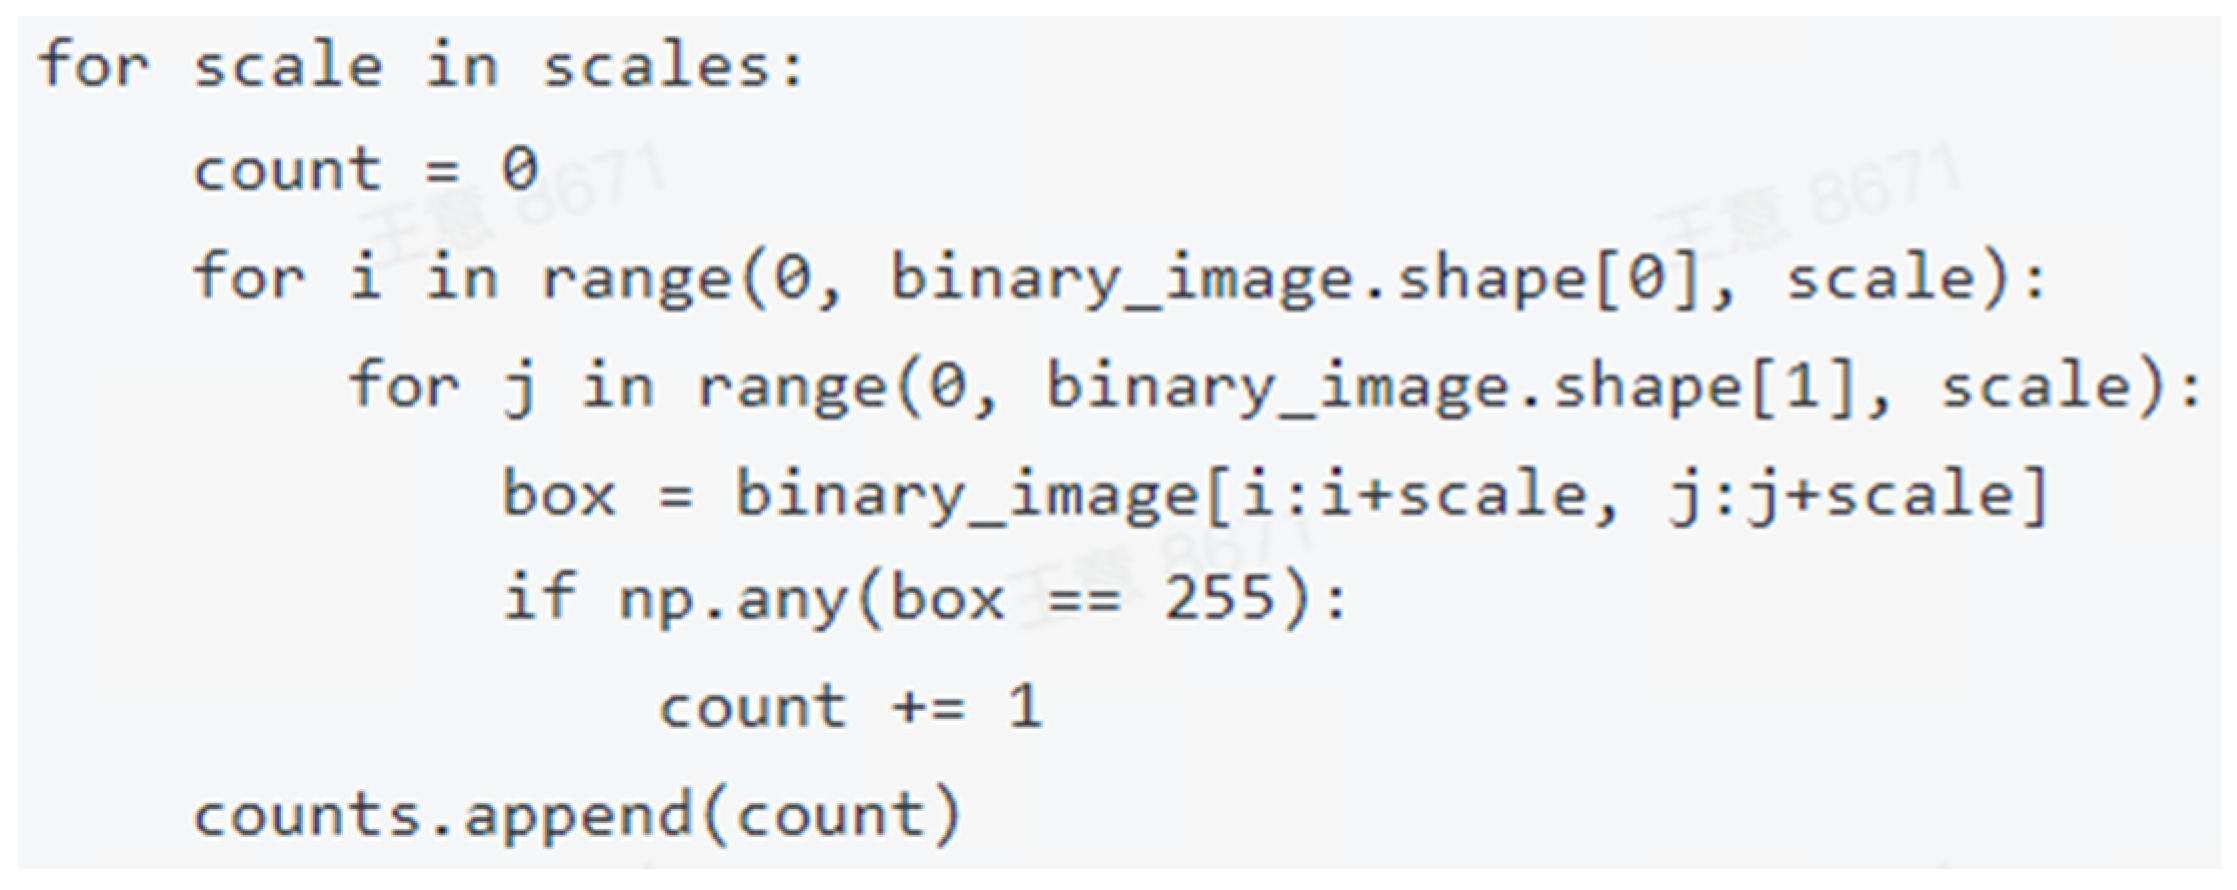
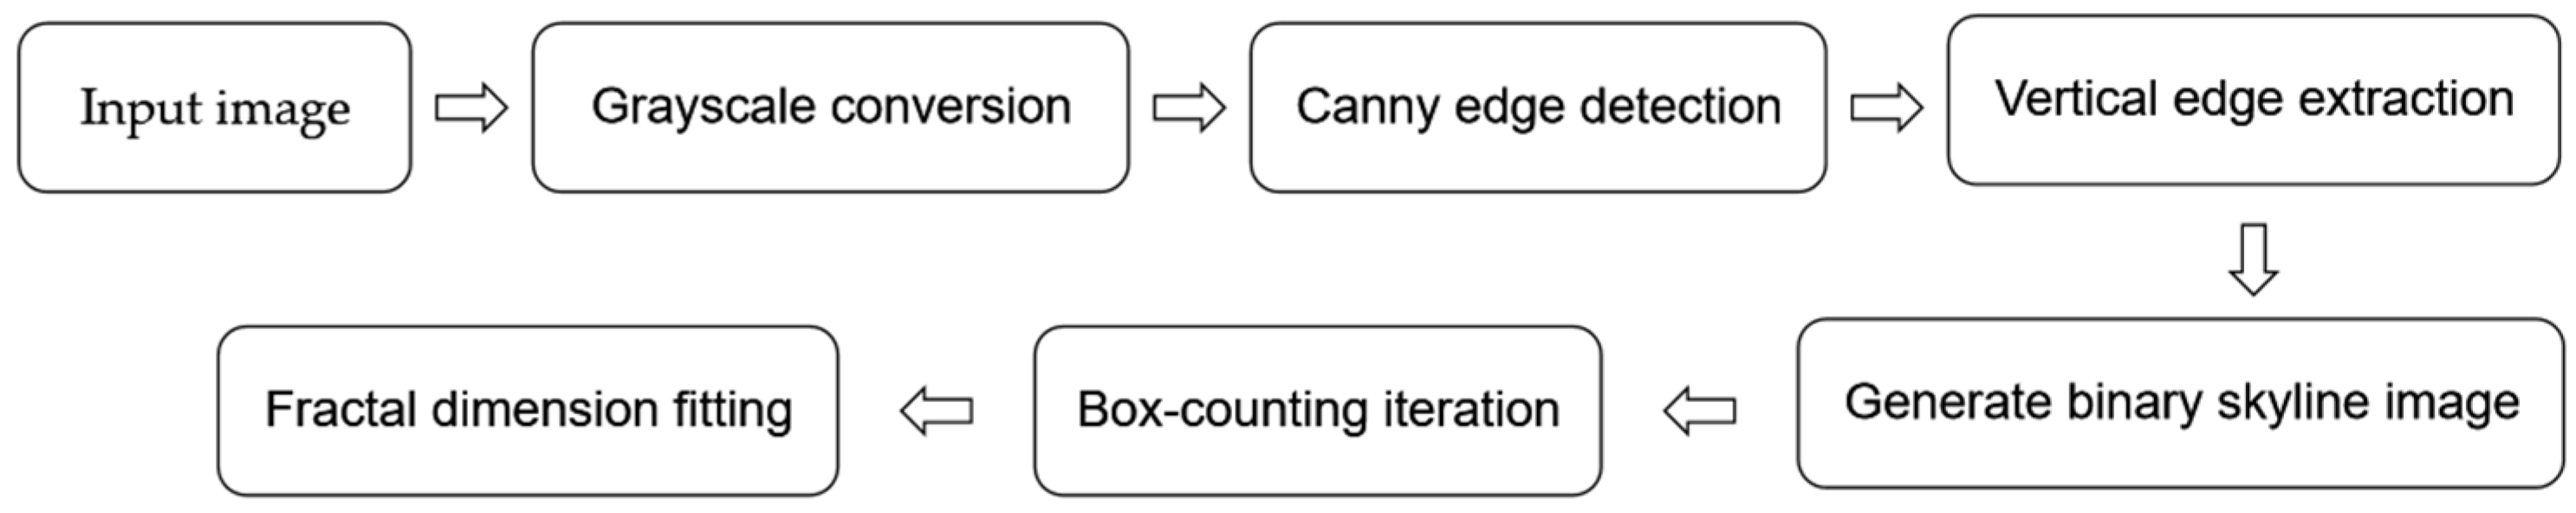
2. Research Methods
2.1. Methodology
2.2. Comparison with Other Methods
3. Method Verification
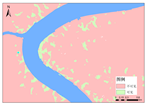
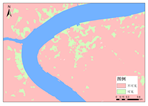
3.1. Sample Selection
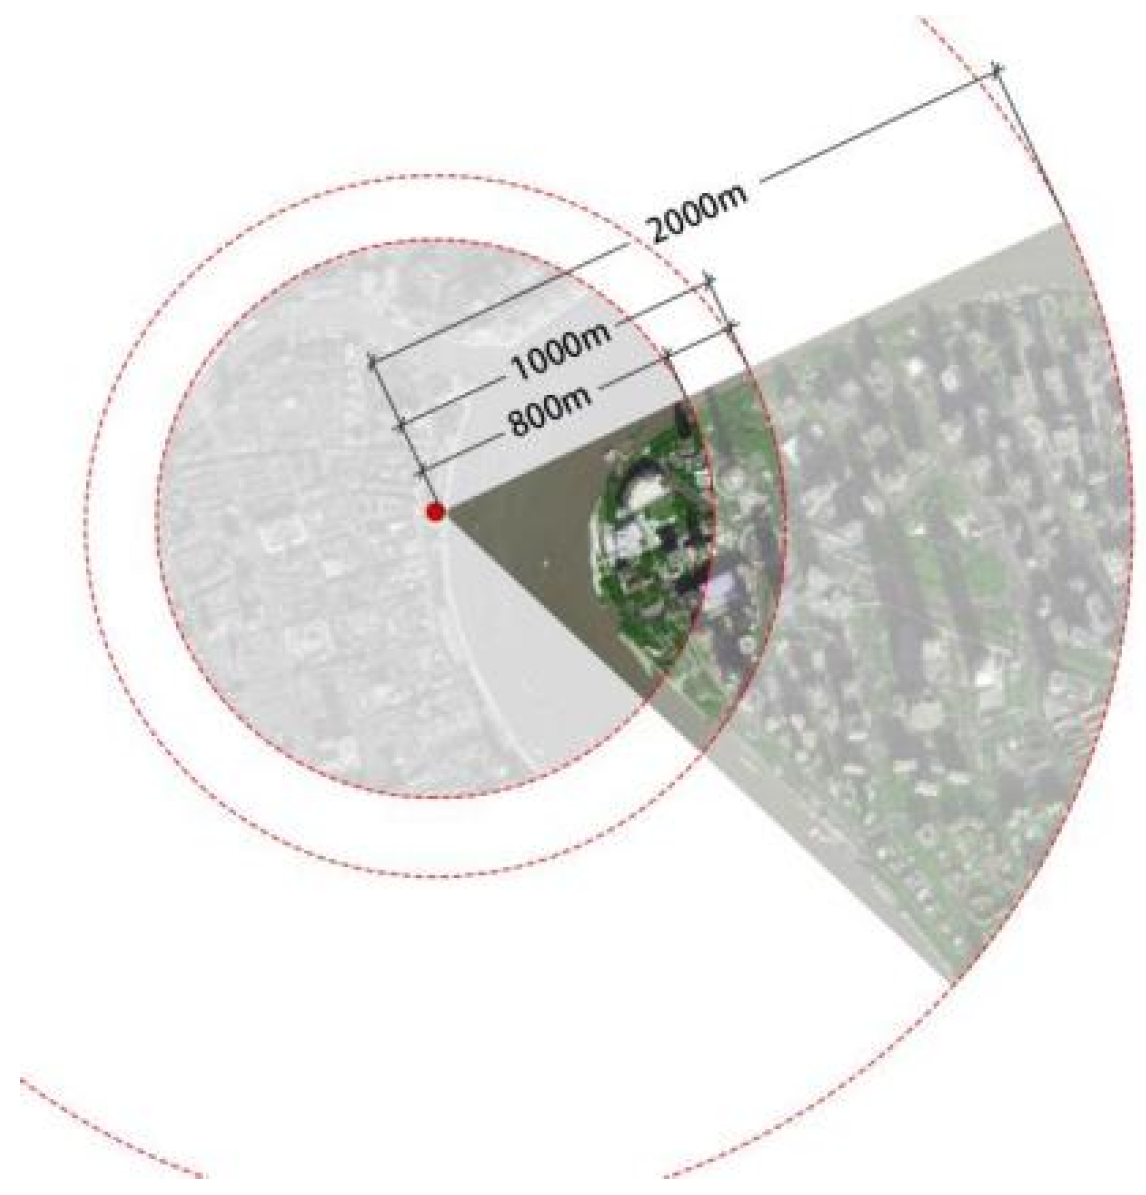
3.2. Selection of Observation Viewpoints
3.3. Complexity Evaluation
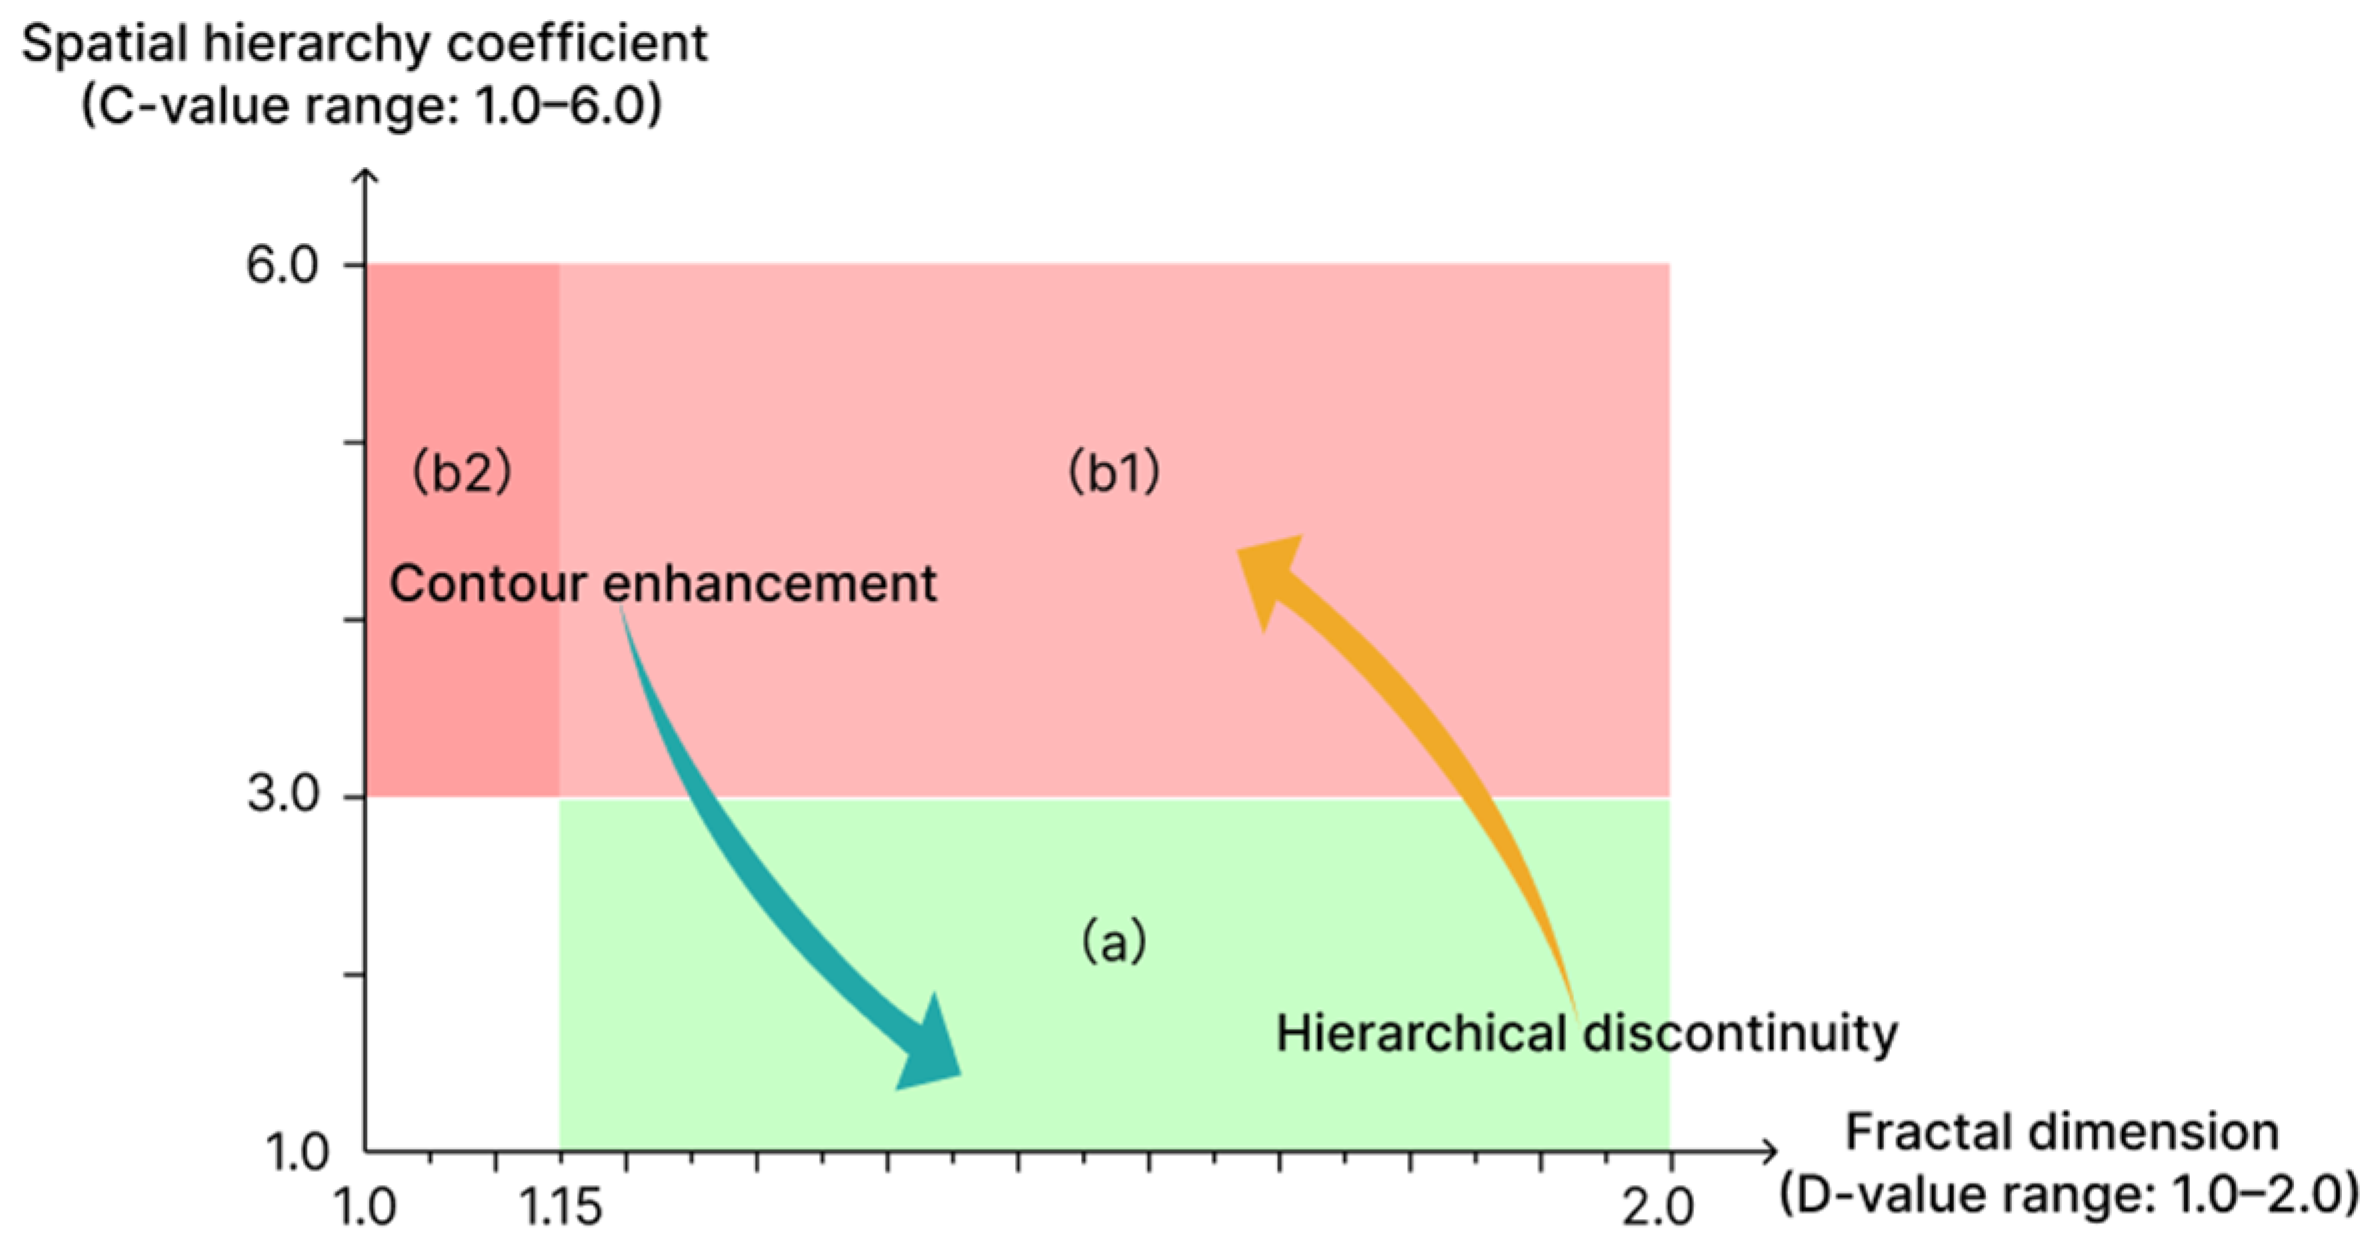
3.4. Spatial Hierarchy Evaluation
- (a)
- Spatial Hierarchy Division
- First hierarchy: within 800 m, where architectural details (e.g., windows, doors) are still perceptible.
- Second hierarchy: between 800 and 1000 m, where only building outlines remain visible.
- Third hierarchy: beyond 1000 m, where perception is limited to overall skyline form.
- (b)
- Spatial Hierarchy Coefficient
4. Research Results
4.1. Research Findings on Skyline Contour
4.2. Research Findings on Spatial Hierarchy
5. Discussion
5.1. Skyline Contour
5.2. Spatial Hierarchy
6. Conclusions
Author Contributions
Funding
Data Availability Statement
Conflicts of Interest
References
- Wang, J.G.; Lü, Z.P. Historical process and experience of waterfront area development and construction in world cities. Urban Plan. 2001, 7, 41–46. [Google Scholar]
- Zheng, H.; Zhang, J. Visual analysis of the external spatial form of super high-rise buildings in Pudong Xiaolujiazui area. Archit. J. 2011, S1, 144–147. [Google Scholar]
- Niu, X.Y.; Li, K.K. Quantitative analysis method of urban skyline based on visual impact. Urban Plan. J. 2013, 3, 99–105. [Google Scholar]
- Guney, C.; Girginkaya, S.A.; Cagdas, G.; Yavuz, S. Tailoring a geomodel for analyzing an urban skyline. Landsc. Urban Plan. 2012, 105, 160–173. [Google Scholar] [CrossRef]
- Wang, Y.X.; Zhang, J. Research on the external spatial form of urban complex groups based on viewshed. In Proceedings of the 2020 Industrial Architecture Academic Exchange Conference; China Metallurgical Building Research Institute Co., Ltd., Ed.; Shanghai Jiao Tong University: Shanghai, China, 2020; Volume 1, p. 5. [Google Scholar] [CrossRef]
- Zhou, J.Y.; Zhuo, Y.Q.; Zeng, X.Y. Research on the planning and implementation control of urban skyline: A case study of Shantou urban skyline. South Archit. 2023, 8, 89–98. [Google Scholar]
- Wu, X.Q.; Mou, S.C.; Kong, L. Dynamic and static sightline analysis of mountain parks based on GIS technology: A case study of the selection of the summit viewpoint of Hushan Mountain in Qixia Mountain. In Proceedings of the 2020 China Urban Planning Annual Conference, Ningbo, China, 13–15 December 2020; China Urban Planning Society, Chengdu Municipal People’s Government, Eds.; Southeast University: Nanjing, China, 2021; pp. 374–387. [Google Scholar]
- Zhang, Y.Y.; Wang, B.X.; Zhou, J.L. Macau Portas do Cerco commercial street tourism vitality research. Furnit. Inter. Decor. 2023, 30, 136–140. [Google Scholar]
- Jiang, K.S.; Fu, W.X.; Xu, L.J. Empirical research on the power-law distribution of domestic tourism scale in Chinese cities. Math. Pract. Theory 2023, 53, 36–45. [Google Scholar]
- Huang, X.H.; Yang, J.X.; Liu, X.T.; Zhang, Z.; Cui, L. Research and Application of Rapid 3D Modeling Technology based on UAV. In Proceedings of the 12th IEEE International Conference on Software Engineering and Service Science (IEEE ICSESS), China Hall Sci & Technol, Beijing, China, 20–22 August 2021; IEEE: New York, NY, USA, 2021. [Google Scholar]
- Shi, L.; Zhao, H.; Zheng, S.; Yu, T.; Dong, R. Basic concepts and implementation of landscape perception-based ecological planning in urban-rural fringe areas. Acta Ecol. Sin. 2017, 37, 383–390. [Google Scholar]
- Liu, X.F.; Lin, T.; Zhao, Y.; Lin, M.; Cao, X.; Li, Y.; Wu, X.; Zhang, G.; Liu, W. Landscape elements of urban parks and their impact on park activities of different groups. Acta Ecol. Sin. 2020, 40, 168–182. [Google Scholar]
- Zhang, L.; Li, J.W.; Liu, J.Y.; Zuo, Y. Urban green space landscape evaluation and unit governance strategies: Yangpu District, Shanghai as an example. Landsc. Gard. 2025, 42, 4–12+49. [Google Scholar]
- Yang, L.; Yang, X.; Li, Y.; Li, S. A new quantitative evaluation method of urban skyline based on object-based analysis and constitution theory. Environ. Plan. B Urban Anal. City Sci. 2024, 51, 259–274. [Google Scholar] [CrossRef]
- Zhao, M.M.; Zhang, J.; Cai, J. Visual preference evaluation of urban spatial form dominated by landmark buildings: Oriental Pearl TV Tower in Shanghai as a case. Mod. Urban Res. 2021, 2, 92–97. [Google Scholar]
- Zhang, J.; Luan, W.; Zhang, J. Optimization of Quantitative Evaluation Method for Urban Waterfront Building Cluster Skyline. Buildings 2024, 15, 9. [Google Scholar] [CrossRef]
- Puspitasari, A.W.; Kwon, J. Comparison of Spatial Layout of Tall Buildings Clustered in Circular, Rectangular, and Linear Geographical Areas and Impact on Skyline. Buildings 2020, 10, 64. [Google Scholar] [CrossRef]
- Zhang, J.H.; Pan, L. Organization and shaping of coastal mountainous city skyline landscape: A case study of Yantai coastal skyline landscape. J. Urban Dev. Stud. 2010, 17, 77–84. [Google Scholar]
- Zhang, F.; Jia, B.; Liu, W.L. Research on fractal dimension measurement of typical urban area skyline in Shenyang based on fractal theory. In Architectural Digital Technology Teaching and Research Academic Seminar of Chinese University Architecture Institutes; Shenyang Jianzhu University School of Architecture and Planning: Shenyang, China, 2019; p. 6. [Google Scholar]
- Yan, F.; Zhang, J.L.; Yan, J. Quantitative evaluation and suggestions on riverside city skyline based on fractal theory: Jiangbei New District of Nanjing as an example. Resid. Ind. 2022, 7, 32–36. [Google Scholar]
- Ma, L. Research on Architectural Design Based on Fractal Geometry Theory. Ph.D. Thesis, Tianjin University, Tianjin, China, 2020. [Google Scholar] [CrossRef]
- Du, X.; Chen, D.; Ma, Z.; Liu, F. An improved image edge detection algorithm based on Canny operator. Comput. Digit. Eng. 2022, 50, 410–413+457. [Google Scholar]
- Cao, Y.C.; Zhang, Y.K. Quantitative analysis of urban skyline based on fractal theory. Urban Issues 2013, 221, 32–36. [Google Scholar]
- Xie, D.W.; He, Y.J. Quantification of subjective evaluation on skyline shape. In Proceedings of the 2021 China Urban Planning Annual Conference; China Urban Planning Society, Chengdu Municipal People’s Government, Eds.; Guangzhou Urban Planning Survey and Design Institute, School of Architecture, Tianjin University: Tianjin, China, 2021; p. 11. [Google Scholar] [CrossRef]
- Huang, L.; Luo, W.J. Preliminary exploration of quantitative evaluation method of urban skyline aesthetics: A case study of Wuhan Yangjiang Avenue skyline. Archit. J. 2011, 4 (Suppl. S2), 172–175. [Google Scholar]
- Ying, X.Y.; Wang, H.Y.; Gao, J.; Shen, L.; Han, X.; Huang, F.; Zhang, Z. Research on the correlation between skyline spatial hierarchy and outdoor wind environment of building groups: Lujiazui Financial Center Area of Shanghai as an example. Urban Archit. 2023, 20, 133–138. [Google Scholar] [CrossRef]
- Xiong, M. Urban design theory framework and application outline. Archit. J. 2000, 1, 4–9+69. [Google Scholar]
- Zhu, S. Research on urban mountain viewing point identification method based on GIS visibility analysis. Intell. Build. Smart City 2018, 10, 155–156+172. [Google Scholar] [CrossRef]
- Karimimoshaver, M.; Winkemann, P. A framework for assessing tall buildings’ impact on the city skyline: Aesthetic, visibility, and meaning dimensions. Environ. Impact Assess. Rev. 2018, 73, 164–176. [Google Scholar] [CrossRef]
- Farhan, S.L.; Akef, V.S.; Nasar, Z. Revitalizing the historical center of Al-Najaf city in Iraq: Learning from the British conservation experiences. J. Cult. Herit. Manag. Sustain. Dev. 2022, 12, 513–532. [Google Scholar] [CrossRef]


| Methods | Content | Characteristics |
|---|---|---|
| Viewshed Analysis | This method analyzes viewpoints and visual corridors within cities. Its objectives are to protect and enhance urban visual corridors, ensuring public appreciation of significant natural and built landscapes. | This method integrates GIS technology with quantitative analysis to optimize view corridor planning. It further regulates building heights within sightlines to achieve controlled height parameters [7]. |
| Fractal Dimension | Fractals are geometric forms with self-similar properties. The researchers calculate skyline fractal dimensions using methods, like the box-counting dimension, to quantitatively analyze morphological features. | This metric measures the complexity of two-dimensional shapes. When combined with human visual perception, it models the visual information perceived by observers in spatial contexts. |
| Eye-Tracking | This method, combined with virtual reality (VR) and other virtual technologies, analyzes the visual impact of spatial elements on participants. | Based on the new perspective of landscape perception quantification and its connection with public visual preference perception [8], the analysis results represent the unification of subjectivity and objectivity. |
| Power–Law Distribution | Power–law distribution is a type of probability distribution that describes phenomena where a few events have very large scales while most events are relatively small [9]. | By analyzing the power–law characteristics of urban skylines, it is possible to identify which buildings contribute significantly to the skyline. |
| Subjective Perspectives | This approach examines the visual perception of urban form from different subjective perspectives, such as those from transportation vehicles and pedestrians, focusing on differences in viewpoint height and visual domain size. | It provides diverse observational angles and, when combined with modern technologies for visual simulation, offers a more comprehensive assessment of urban skylines. |
| Spatial Hierarchy | Based on the visual analysis theory, this method categorizes building clusters into multiple layers according to their visual clarity, calculating the visible area ratios of each layer for morphological analysis. | Starting from a three-dimensional perspective and combining it with the vertical outline, this approach provides a more comprehensive analysis of the morphological characteristics of building clusters. |
| Oblique Photography | Oblique photography captures images from different distances and angles, both vertical and tilted, within a coordinate system to create an oblique photographic system [10]. | This technique provides richer side-texture information compared to traditional orthophotography, resulting in more accurate three-dimensional building models that better reflect the three-dimensional form and skyline characteristics of a city. |
| Subjective Evaluation | This study investigates respondents’ immediate experiences of building forms through on-site interviews, questionnaire surveys, and other methods, combined with a preference assessment method. The existing research has incorporated social needs, fairness, respect, cultural experience, etc., into the subjective evaluation system [11,12,13]. | This approach is limited by the number of respondents and is highly subjective, making it difficult to generate precise quantitative data. |
| A1 | A2 | A3 | A4 |
|---|---|---|---|
 | 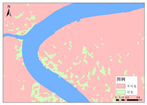 | 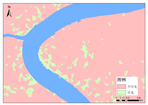 |  |
| A5 | A6 | A7 | A8 |
 |  |  |  |
| Viewpoint | A1 | A2 | A3 | A4 | A5 | A6 | A7 | A8 |
|---|---|---|---|---|---|---|---|---|
| Picture |  |  |  |  |  |  |  |  |
| Fractal Dimension | 1.128 | 1.126 | 1.114 | 1.182 | 1.191 | 1.136 | 1.140 | 1.121 |
| Bund Tourism Pier (A1) | Bund Pier District 1 (A2) | Meteorological Square (A3) | Financial Plaza (A4) |
|---|---|---|---|
 |  |  |  |
| Chen Yi Square (A5) | Monument to the People’s Heroes (A6) | International Passenger Center (A7) | Marine Plaza (A8) |
 |  |  |  |
 | |||
| A1 | A2 | A3 | A4 | A5 | A6 | A7 | A8 | |
|---|---|---|---|---|---|---|---|---|
| S1/m2 | 131,697 | 166,275 | 179,771 | 126,531 | 46,409 | 57,169 | 47,167 | 144,091 |
| S2/m2 | 86,241 | 55,935 | 88,453 | 130,120 | 53,562 | 12,738 | 31,756 | 35,579 |
| S3/m2 | 35,387 | 39,826 | 65,605 | 132,929 | 82,050 | 65,793 | 34,572 | 34,043 |
| C | 6.158 | 5.579 | 4.088 | 1.994 | 1.218 | 1.062 | 2.282 | 5.277 |
| Viewpoint | Fractal Dimension Value (1.180–1.200) | Height Ratio (3:1.5:1) | Overall Contour Trend (Convex, Concave, Flat) |
|---|---|---|---|
| A1 | × | 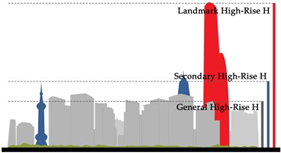 × | × |
| A2 | × |  × | × |
| A3 | × | 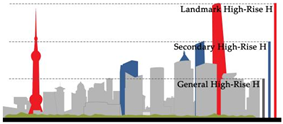 √ | √ |
| A4 | √ | 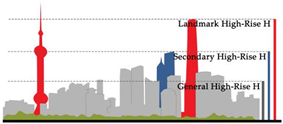 √ | √ |
| A5 | √ |  √ | √ |
| A6 | × | 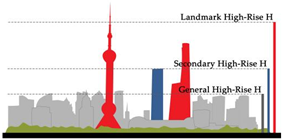 √ | × |
| A7 | × | 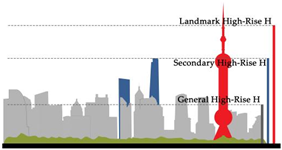 × | × |
| A8 | × |  × | × |
| Viewpoint | Visible Area Ratio (S1 < S2 < S3) | Spatial Hierarchy Coefficient (C < 2) | Gradual Height Increase | Density Variation (Sparse Near, Dense Far) | Maximum Continuous Buildings < 5 |
|---|---|---|---|---|---|
| A1 | √ | ||||
| A2 | |||||
| A3 | √ | ||||
| A4 | √ | √ | √ | √ | √ |
| A5 | √ | √ | √ | √ | √ |
| A6 | √ | √ | √ | ||
| A7 | √ | √ | |||
| A8 |
Disclaimer/Publisher’s Note: The statements, opinions and data contained in all publications are solely those of the individual author(s) and contributor(s) and not of MDPI and/or the editor(s). MDPI and/or the editor(s) disclaim responsibility for any injury to people or property resulting from any ideas, methods, instructions or products referred to in the content. |
© 2025 by the authors. Licensee MDPI, Basel, Switzerland. This article is an open access article distributed under the terms and conditions of the Creative Commons Attribution (CC BY) license (https://creativecommons.org/licenses/by/4.0/).
Share and Cite
Zhang, J.; Wang, Y.; Luo, X.; Luan, W.-L. Multi-Viewpoint Assessment of Urban Waterfront Skylines: Fractal and Spatial Hierarchy Analysis in Shanghai. Buildings 2025, 15, 1407. https://doi.org/10.3390/buildings15091407
Zhang J, Wang Y, Luo X, Luan W-L. Multi-Viewpoint Assessment of Urban Waterfront Skylines: Fractal and Spatial Hierarchy Analysis in Shanghai. Buildings. 2025; 15(9):1407. https://doi.org/10.3390/buildings15091407
Chicago/Turabian StyleZhang, Jian, Yi Wang, Xi Luo, and Wen-Lei Luan. 2025. "Multi-Viewpoint Assessment of Urban Waterfront Skylines: Fractal and Spatial Hierarchy Analysis in Shanghai" Buildings 15, no. 9: 1407. https://doi.org/10.3390/buildings15091407
APA StyleZhang, J., Wang, Y., Luo, X., & Luan, W.-L. (2025). Multi-Viewpoint Assessment of Urban Waterfront Skylines: Fractal and Spatial Hierarchy Analysis in Shanghai. Buildings, 15(9), 1407. https://doi.org/10.3390/buildings15091407