Article

Experimental Study on the Uplift Correction of Raft Foundations in Saturated Silty Clay

1
Beijing Hengxiang Hongye Foundation Reinforcement Technology Co., Ltd., Beijing 100000, China
2
School of Engineering and Technology, China University of Geosciences, Beijing 100083, China
*
Author to whom correspondence should be addressed.
Buildings 2025, 15(9), 1415; https://doi.org/10.3390/buildings15091415
Submission received: 19 February 2025 / Revised: 15 March 2025 / Accepted: 26 March 2025 / Published: 23 April 2025
(This article belongs to the Section Building Structures)

Abstract

:
Although grouting technology has been widely applied for lifting and rectifying tilted structures, theoretical research remains underdeveloped and lags behind the practical demands of engineering applications. In this study, a self-developed experimental setup was utilized to conduct model tests on the lifting and rectification of a raft foundation in saturated silty clay. The evolution patterns of ground surface displacement, excess pore water pressure, and foundation-additional pressure induced by grouting were systematically analyzed. Furthermore, the influence of grouting depth and injection rate on surface displacement, excess pore water pressure, foundation-additional pressure, and grouting parameters (grout volume and pressure) was investigated. The key findings are summarized as follows: The grouting efficiency (η) ranged between 0.72 and 0.81. A power-exponential dual-function model was proposed to quantify the spatiotemporal evolution of excess pore water pressure, achieving a distance–decay power function with R2 > 0.89 and a time-dependent dissipation exponential function with R 2 > 0.94. The maximum surface uplift displacement decreased by 20.6% and 8.9% with increasing grouting rates, respectively. The dissipation time of excess pore water pressure exhibited a negative correlation with the grouting rate, and grouting efficiency declined as excess pore water pressure dissipated. The maximum foundation-additional pressure occurred directly above the grouting center and gradually diminished as the horizontal distance from the grouting location increased. Variations in surface displacement, excess pore water pressure, and additional base pressure induced by grouting were systematically analyzed.

1. Introduction

With the continuous expansion of urban spaces, various buildings often experience different degrees of tilt, which not only compromises their functionality but also poses significant risks to human safety and structural integrity. The primary causes of building tilting include uneven foundation settlement, inadequate foundation design or construction, adjacent construction activities, seismic effects, and fluctuations in the groundwater table. Among these, uneven foundation settlement is the most prevalent cause, arising from factors such as soil quality, building loads, and construction quality. Traditional methods for rectifying uneven settlements, such as forced settlement, jacking, anchor static pressure, and foundation stress relief, are often associated with significant drawbacks, including substantial disturbance to surrounding soil, potential for additional settlement, high equipment and construction technology requirements, and considerable costs and complexity [1]. In contrast, grouting lifting and rectification technology has gained prominence due to its unique advantages. This method reinforces the foundation and rectifies building tilt by leveraging the filling, compacting, and cementing effects of injected grouting materials. This approach offers distinct benefits, including convenient construction, minimal environmental impact, cost-effectiveness, and operational discretion.
Numerous studies have been conducted by domestic and international scholars in the field of grouting lifting. Vesic et al. [2] established early theoretical foundations by proposing solutions for spherical and cylindrical cavity expansion in infinite elastoplastic soil media based on the Mohr–Coulomb failure criterion. Sagaseta [3] derived displacement solutions for ground deformation induced by grouting or soil loss in elastic semi-infinite spaces using the mirror image method, laying the groundwork for calculating grouting-induced stratum displacement. However, their model did not account for the spatiotemporal reconfiguration effects of dynamic grout pressure diffusion on displacement fields. Kelesh et al. [4] developed a theoretical model for compaction grouting processes, incorporating the influence of soil layers and grouting parameters via cavity expansion theory, validated by field data. Building on this, Kummerer et al., 2002 [5] investigated displacement fields induced by compaction grouting. Ni and Cheng [6,7] demonstrated the strong correlation between grouting lifting efficiency and grout vein morphology in cohesive soils through field monitoring, marking a shift toward multiphysics-coupled analysis. Based on the above conclusions, Tang et al. [8,9] further employed FLAC3D numerical simulations to assess the impact of grouting-induced uplift on underground pipelines. Basu et al. [10] applied the elastic continuous beam method to calculate the surface uplift of above-inclined grout columns, analyzing the effects of grout length and depth. Guo et al. [11] proposed a novel method for predicting surface displacement using stochastic medium theory, which accounts for contributions from grout bulb expansion, leakage, and shrinkage. Expanding this framework, Zhang et al. [12] derived theoretical formulas for surface uplift under uniform and non-uniform multi-bulb expansion modes using the stochastic medium theory and linear superposition principles. Fu et al. [13] conducted theoretical analyses of additional uplift forces in compaction grouting based on the cylindrical cavity expansion theory and the mirror image method to derive analytical solutions. Zhang et al. [14] systematically investigated grouting-induced surface uplift mechanisms in sandy soils through numerical simulations, laboratory tests, and field trials, revealing Gaussian-shaped surface deformation patterns. However, their model’s neglect of time-dependent excess pore water pressure dissipation led to prediction errors of 20–30% in uplift magnitude. Recently, Cui [15] developed a numerical model to elucidate the influence of upper loads and load-grouting zone distances on grouting efficacy. Concurrently, Dai et al. [16] proposed a theoretical model combining the mirror image method and Boussinesq displacement solutions to predict tilt rectification displacements in raft foundations via compaction grouting in clay layers, offering optimized design strategies for building rectification.
Numerous successful cases of grouting-based lifting rectification have been documented. For instance, Wang et al. [17] developed a grout–soil–structure interaction model using a case study of a rectified building, revealing the inhibitory effect of upper loads on lifting efficiency. Cheng et al. [18] achieved the rectification of an 8-story reinforced concrete building in thick, soft clay through a two-stage grouting process. However, repeated grouting was observed to induce cumulative damage to the soil structure. More recently, Cui [19] proposed a non-destructive controllable grouting technology that achieved millimeter-level precision in building rectification via real-time pressure feedback, yet unresolved challenges remain, such as secondary settlement caused by long-term soil creep. These cases demonstrate the growing maturity of grouting lifting technologies in field applications. Additionally, extensive laboratory and field experiments have been conducted to advance grouting-based lifting methodologies.
In saturated clay or silty clay strata, the dissipation of excess pore water pressure generated during grouting over time can diminish its effectiveness. Consequently, researchers have focused on evaluating the long-term performance of grouting-induced uplift. Early work by Jafari [20] and Soga et al. [21] established foundational insights into the long-term effects of grouting in clay through laboratory studies. Building on this, Au et al. [22] investigated factors influencing the long-term efficiency of compaction grouting in clay, contributing to improved design criteria. Meanwhile, K. Soga et al. [23] developed a modeling and control system for compaction grouting in tunnel construction, offering practical tools for design optimization. Cheong and Soga [24] experimentally demonstrated that negative excess pore water pressure induced by excavation could counteract grouting-generated positive pore pressure, enhancing uplift sustainability. Zheng et al. [25,26] conducted systematic laboratory tests to analyze the impact of soil structure and consolidation degree on compaction grouting efficacy. Li et al. [27] employed PFC simulations and scale model tests to compare surface uplift patterns between spherical compaction grouting and horizontal fissure grouting. Most recently, Cheng et al. [28] integrated field tests with numerical modeling to elucidate spatiotemporal variations in soil deformation and grouting efficiency, providing actionable guidelines for deformation control.
Current research on grouting-induced soil deformation and building rectification has been systematically explored. However, most studies focus on grout–soil interactions or empirical case validations, with limited attention paid to systematically analyzing the spatiotemporal evolution of excess pore water pressure during grouting rectification in saturated silty clay strata or the impact of construction parameters on grouting efficacy. To address these gaps, this study employs a custom-designed laboratory apparatus to synchronously quantify excess pore water pressure, grouting efficiency, surface displacement, foundation-additional stresses, and building tilt during the grouting process. A dual-function model (power-law spatial decay, R 2 > 0.89; exponential temporal dissipation, R 2 > 0.94) was established to characterize excess pore water pressure dissipation, enabling predictions of grouting influence zones (2Rc as the effective control radius) and pore pressure dissipation timelines. Furthermore, parametric analyses were conducted to evaluate the effects of grouting depth and injection rate on surface displacement, excess pore water pressure, foundation stresses, and grouting parameters (e.g., grout volume and pressure).

2. Materials and Methods

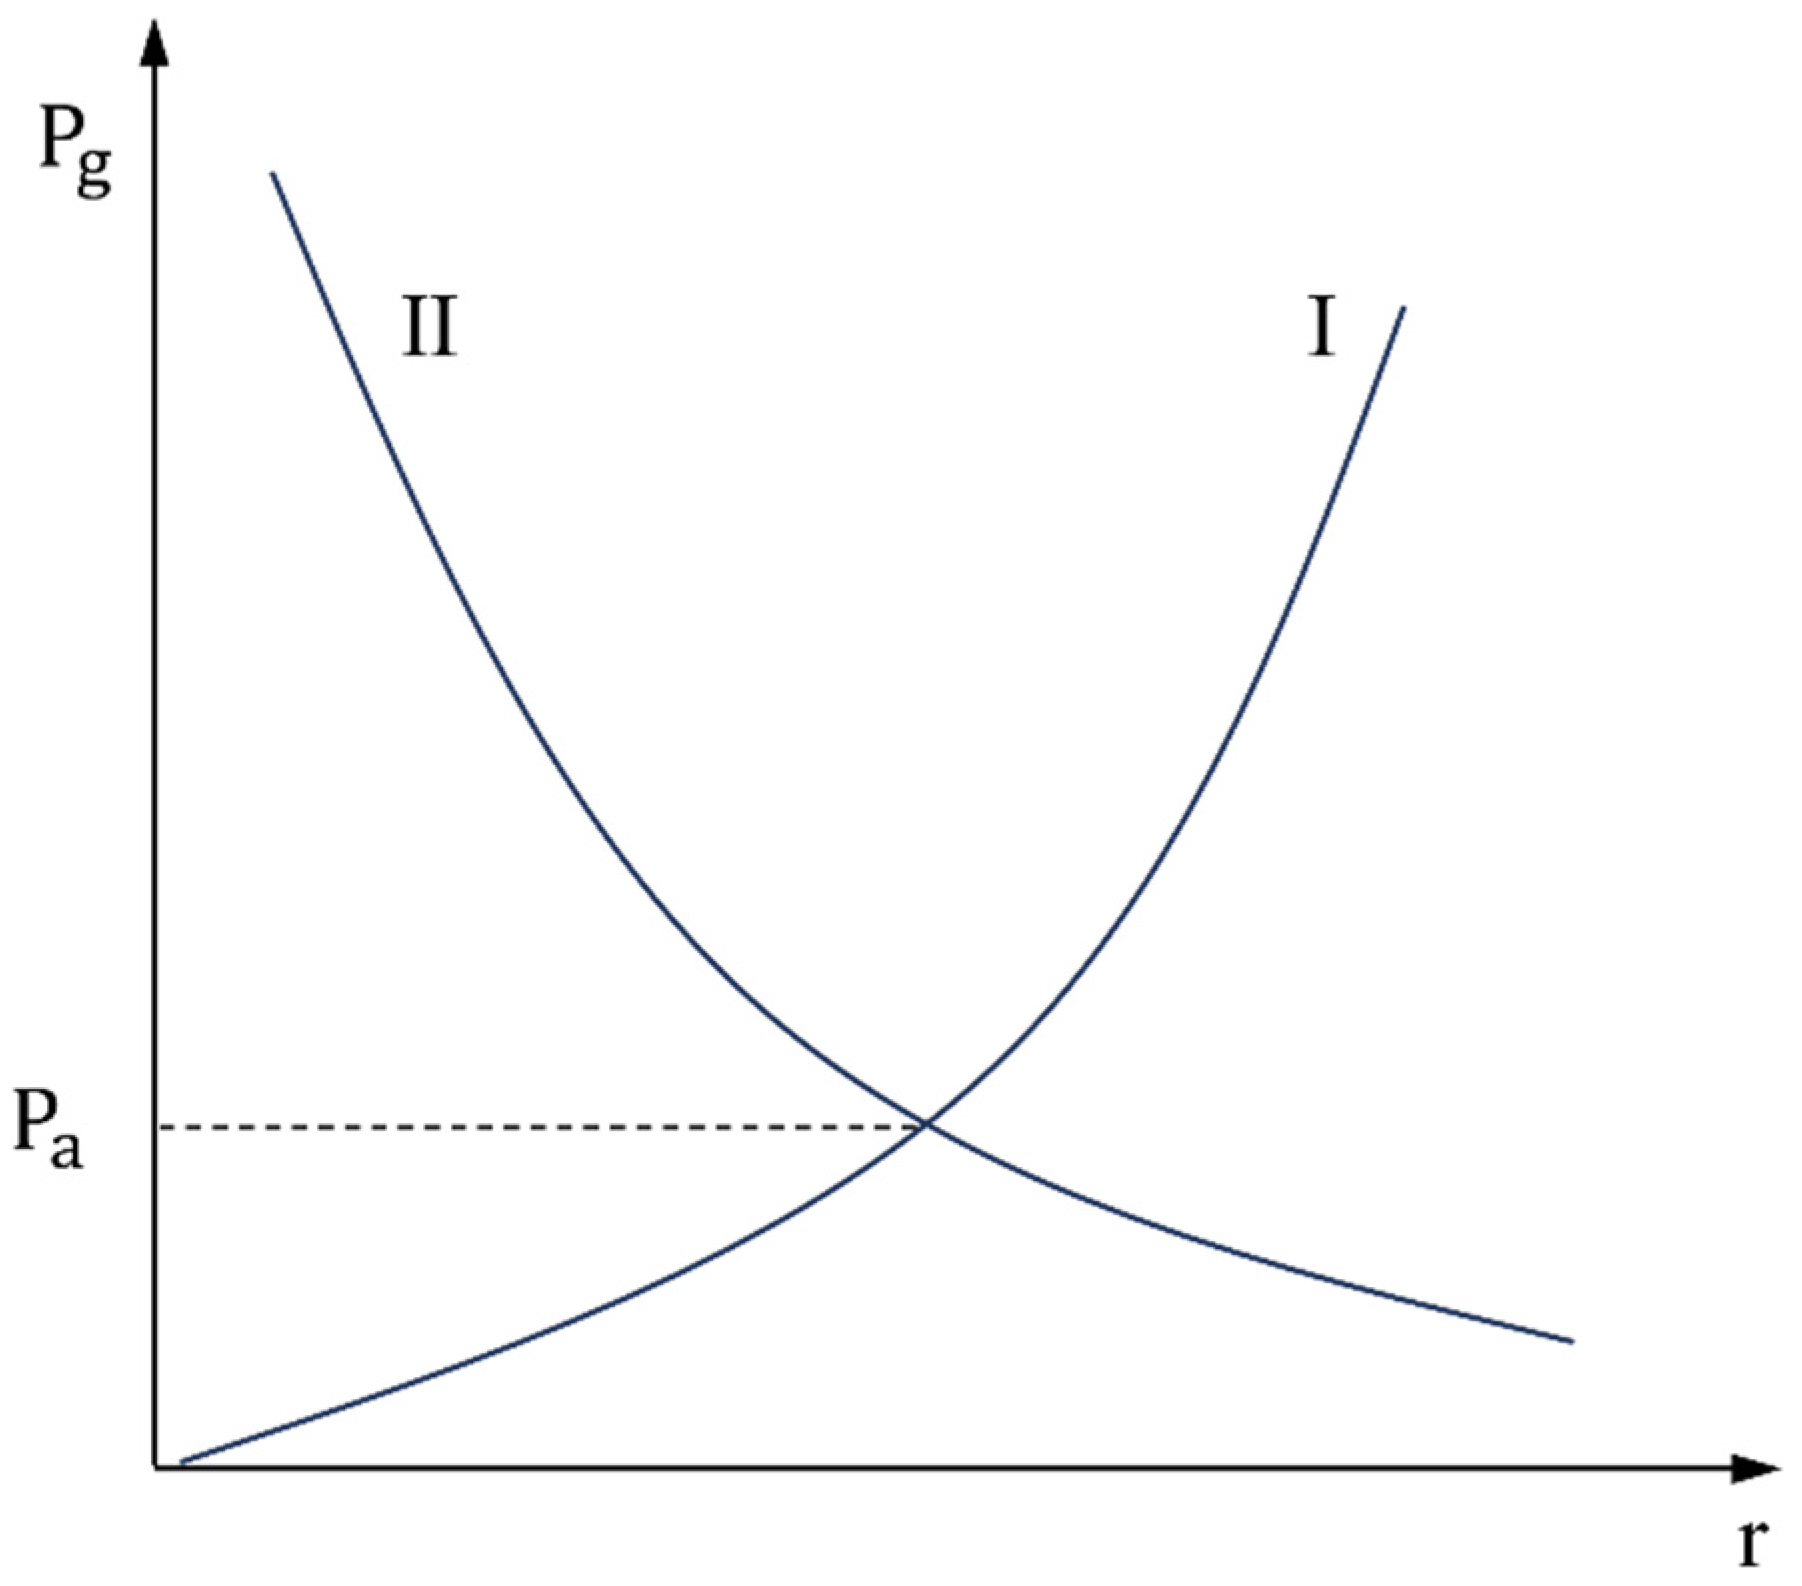
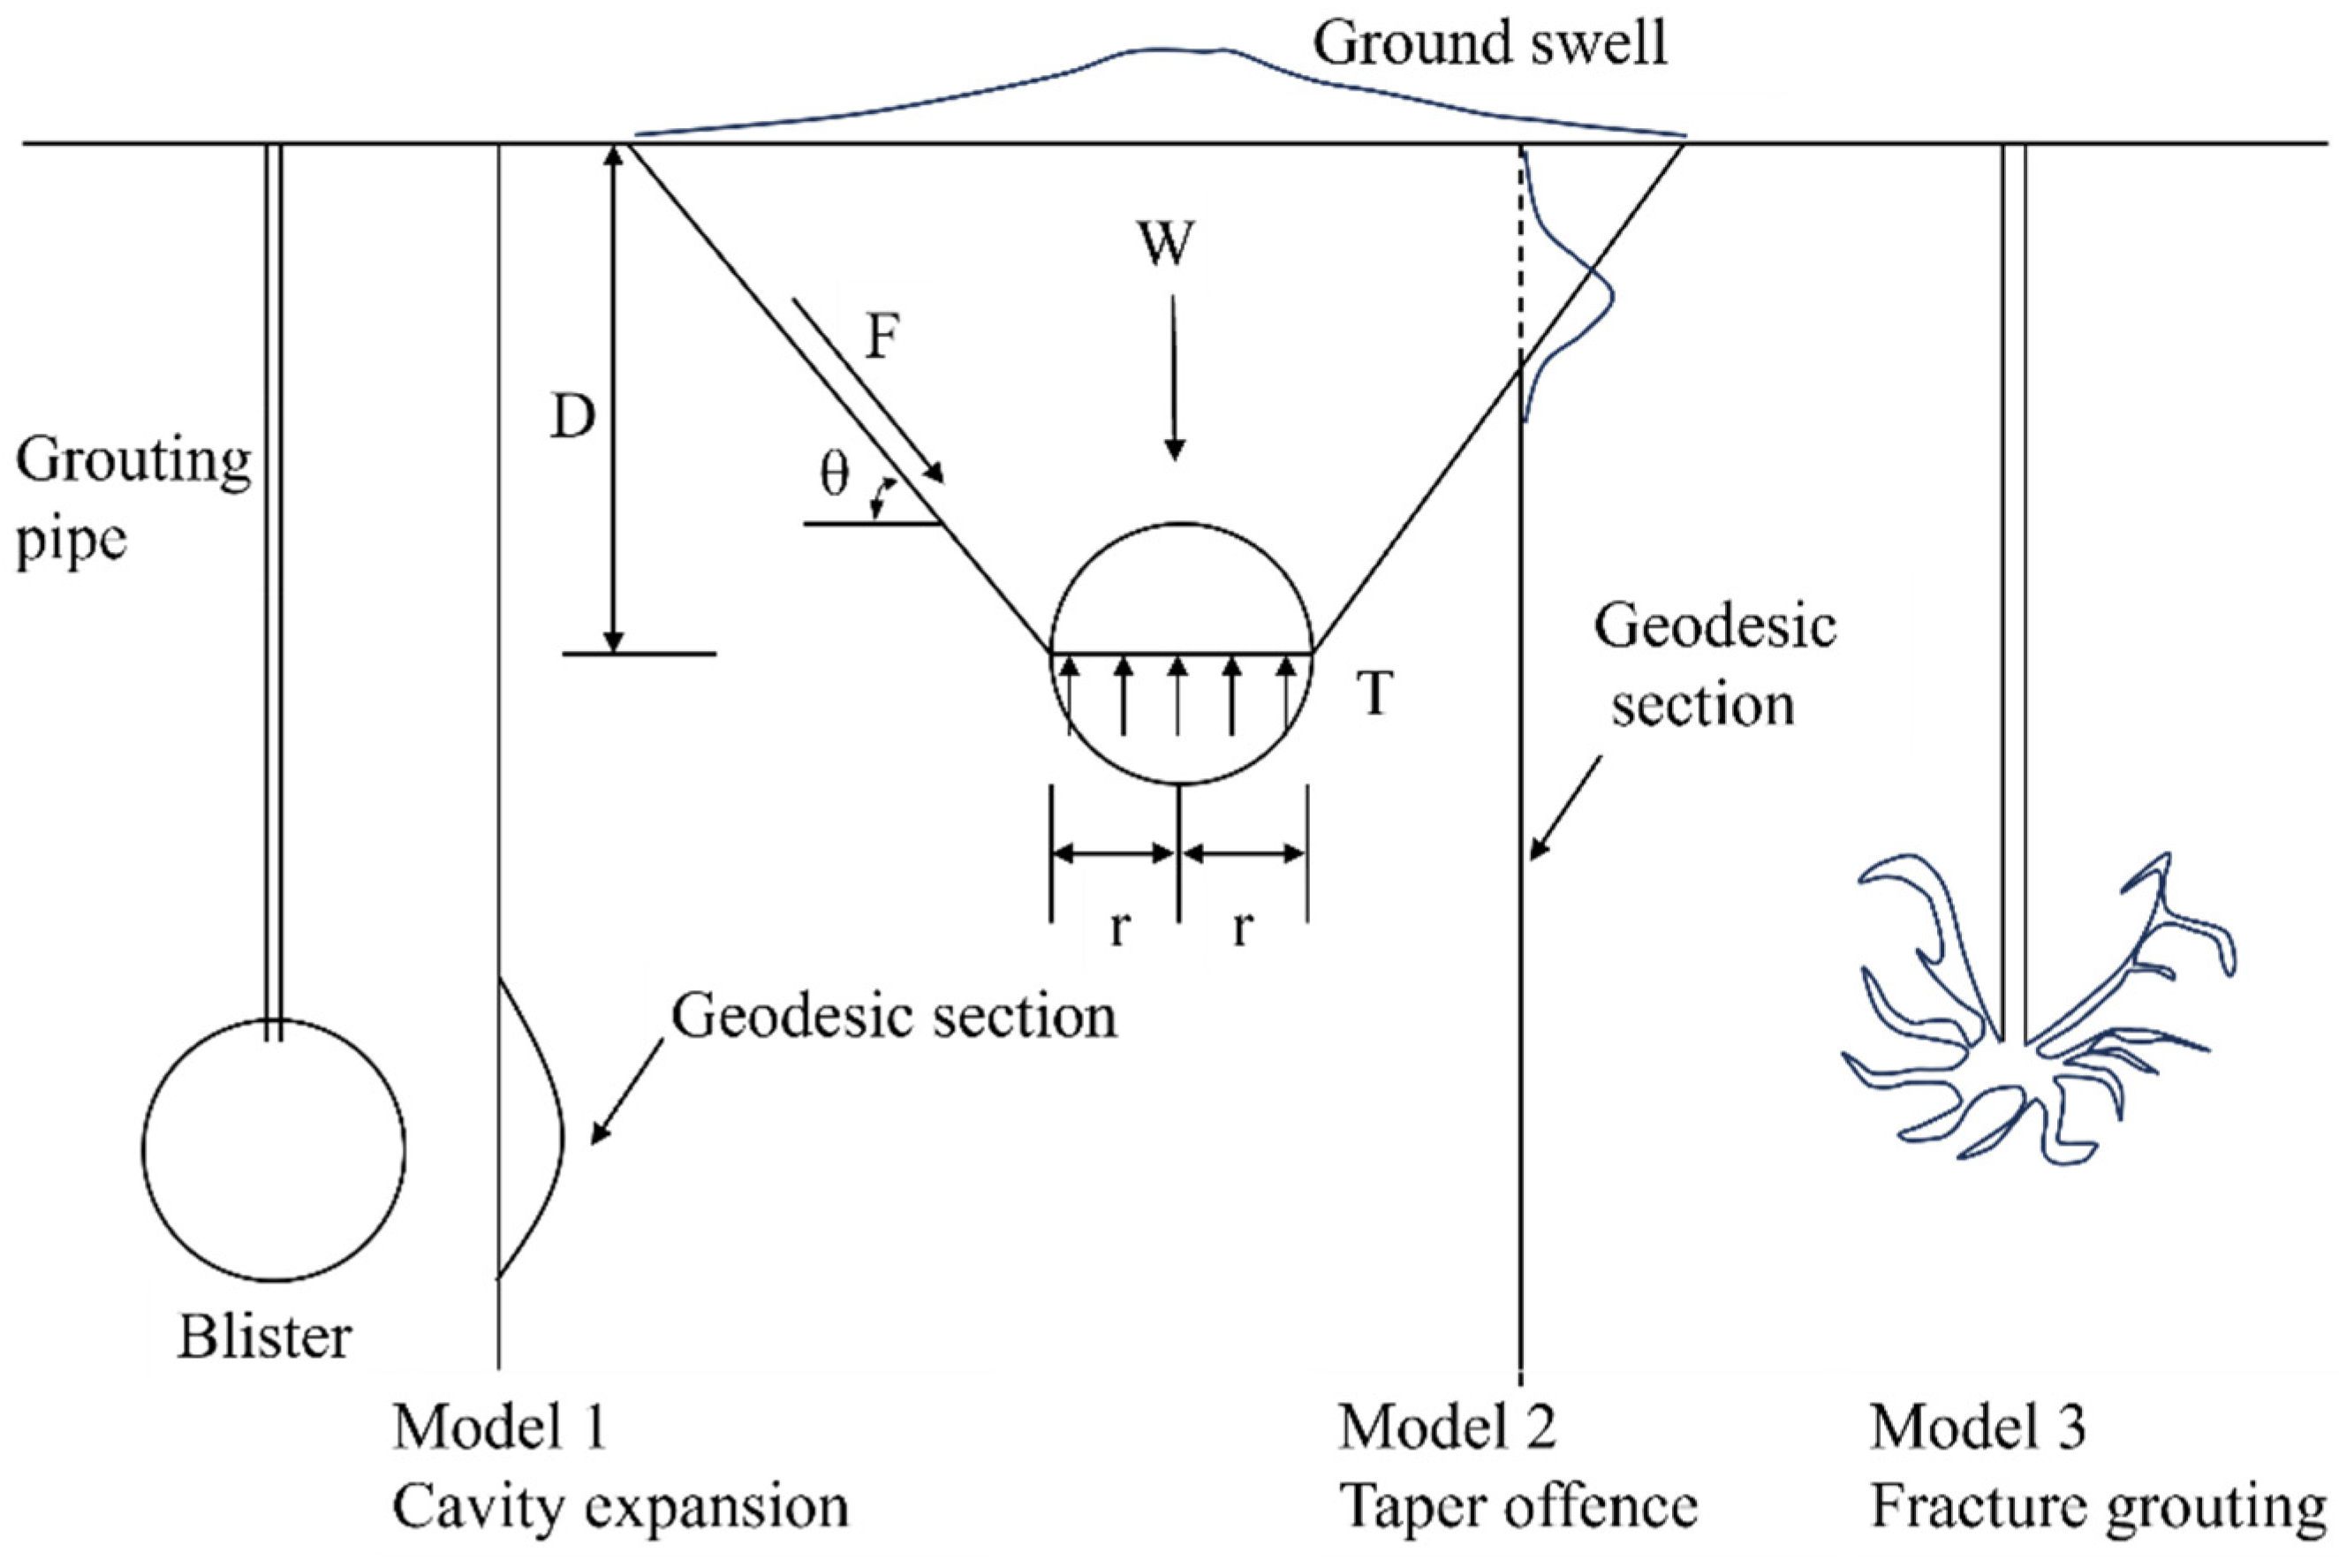
2.1. Theoretical Analysis

Compaction grouting involves pumping highly viscous grout into targeted soil layers using specialized high-pressure pumps. This process forms spherical or cylindrical grout bulbs that compress the surrounding soil, creating a plastic deformation zone near the bulb and an elastic deformation zone in farther regions. Sufficient grout volume strengthens the soil and lifts the stratum. During the initial injection, grout bulbs are small, and pressure is primarily radial (horizontal). As bulb volume increases, upward pressure intensifies, making compaction grouting effective for ground reinforcement and settlement rectification. In unsaturated soils, densification is pronounced; in saturated soils, grouting first induces excess pore water pressure, and soil density improves only after this pressure dissipates.
During compaction grouting, the radius r of the formed grout bulb increases with the grouting pressure P g , as qualitatively depicted by Curve I in Figure 1. When the product of the grout bulb’s horizontal projected area and P g (i.e., the uplift force) becomes sufficient to lift the overlying soil layer, the grouting pressure ceases to rise, and grouting should be terminated. For a specific overlying soil thickness, the required P g to achieve the critical uplift force depends on the grout bulb’s radius or horizontal projected area, a relationship illustrated by Curve II in Figure 1. Notably, Curve II shifts upward with increasing overlying soil thickness. The intersection point a of Curves I and II corresponds to the critical uplift pressure P a , which increases with both the thickness of the overlying soil layer and the ground stiffness. The latter is influenced by soil type, density, moisture content, and grouting rate, collectively determining the soil’s resistance to deformation during the grouting process.
Compact grouting can induce three modes of soil deformation, as shown in Figure 1. Which mode occurs depends on the cavity pressure at the contact surface between the slurry bubble and the surrounding soil. When the uplift force exceeds the weight of the overlying soil layer, a conical damage pattern will occur, and the corresponding ground uplift becomes evident. When the uplift force is less than the weight of the overburden, the surrounding soil expands elastically or plastically, resulting in very little ground uplift. With special attention to the fact that when the damage pattern changes, the slurry can easily flow down to the ground surface, resulting in significant splitting.
During compact grouting, if the grouting pressure or grouting time reaches or exceeds a certain determined value, shear damage occurs in the soil above the slurry bubble to produce uplift. Based on the observation of Graf [29], it is reasonable to assume that when the ground starts to be lifted, the upward force T exerted by the slurry bubble is equal to the self-weight W of the conical soil above the slurry bubble plus the shear force F on the conical surface, as shown in Equation (1). This is shown in Figure 2. For a single uniform soil layer, the angle θ between the damaged surface and the horizontal is π/2 − φ/2, and φ is the soil’s internal friction angle.
T W F s i n θ 0
T = π r 2 P g
W = γ V
F = C u S
where r is the radius of the slurry bubble; θ is the angle between the damaged surface and the horizontal plane; P g is the grouting pressure, here refers to the pressure required when the uplift phenomenon occurs during the grouting process; V is the volume of a similar inverted platform above the grouting body; γ is the soil gravity; C u is the undrained shear strength of the soil; S is the lateral area of the inverted platform above the grouting body.

2.2. Experiment Materials

The soil used in the test was a silty clay sample collected from the field and sieved in the laboratory. The natural average water content of the soil sample was 17.9%, and the bulk density was 1.92 g/cm3. The soil and water were mixed at a weight ratio of 100:18.6 to form remolded saturated silty clay. The basic physicomechanical property indices, such as density, saturated water content, pore ratio, liquid limit, and plastic limit of the remolded saturated chalky clay, were measured using indoor tests, as shown in Table 1. The body particle distribution curve is shown in Figure 3.

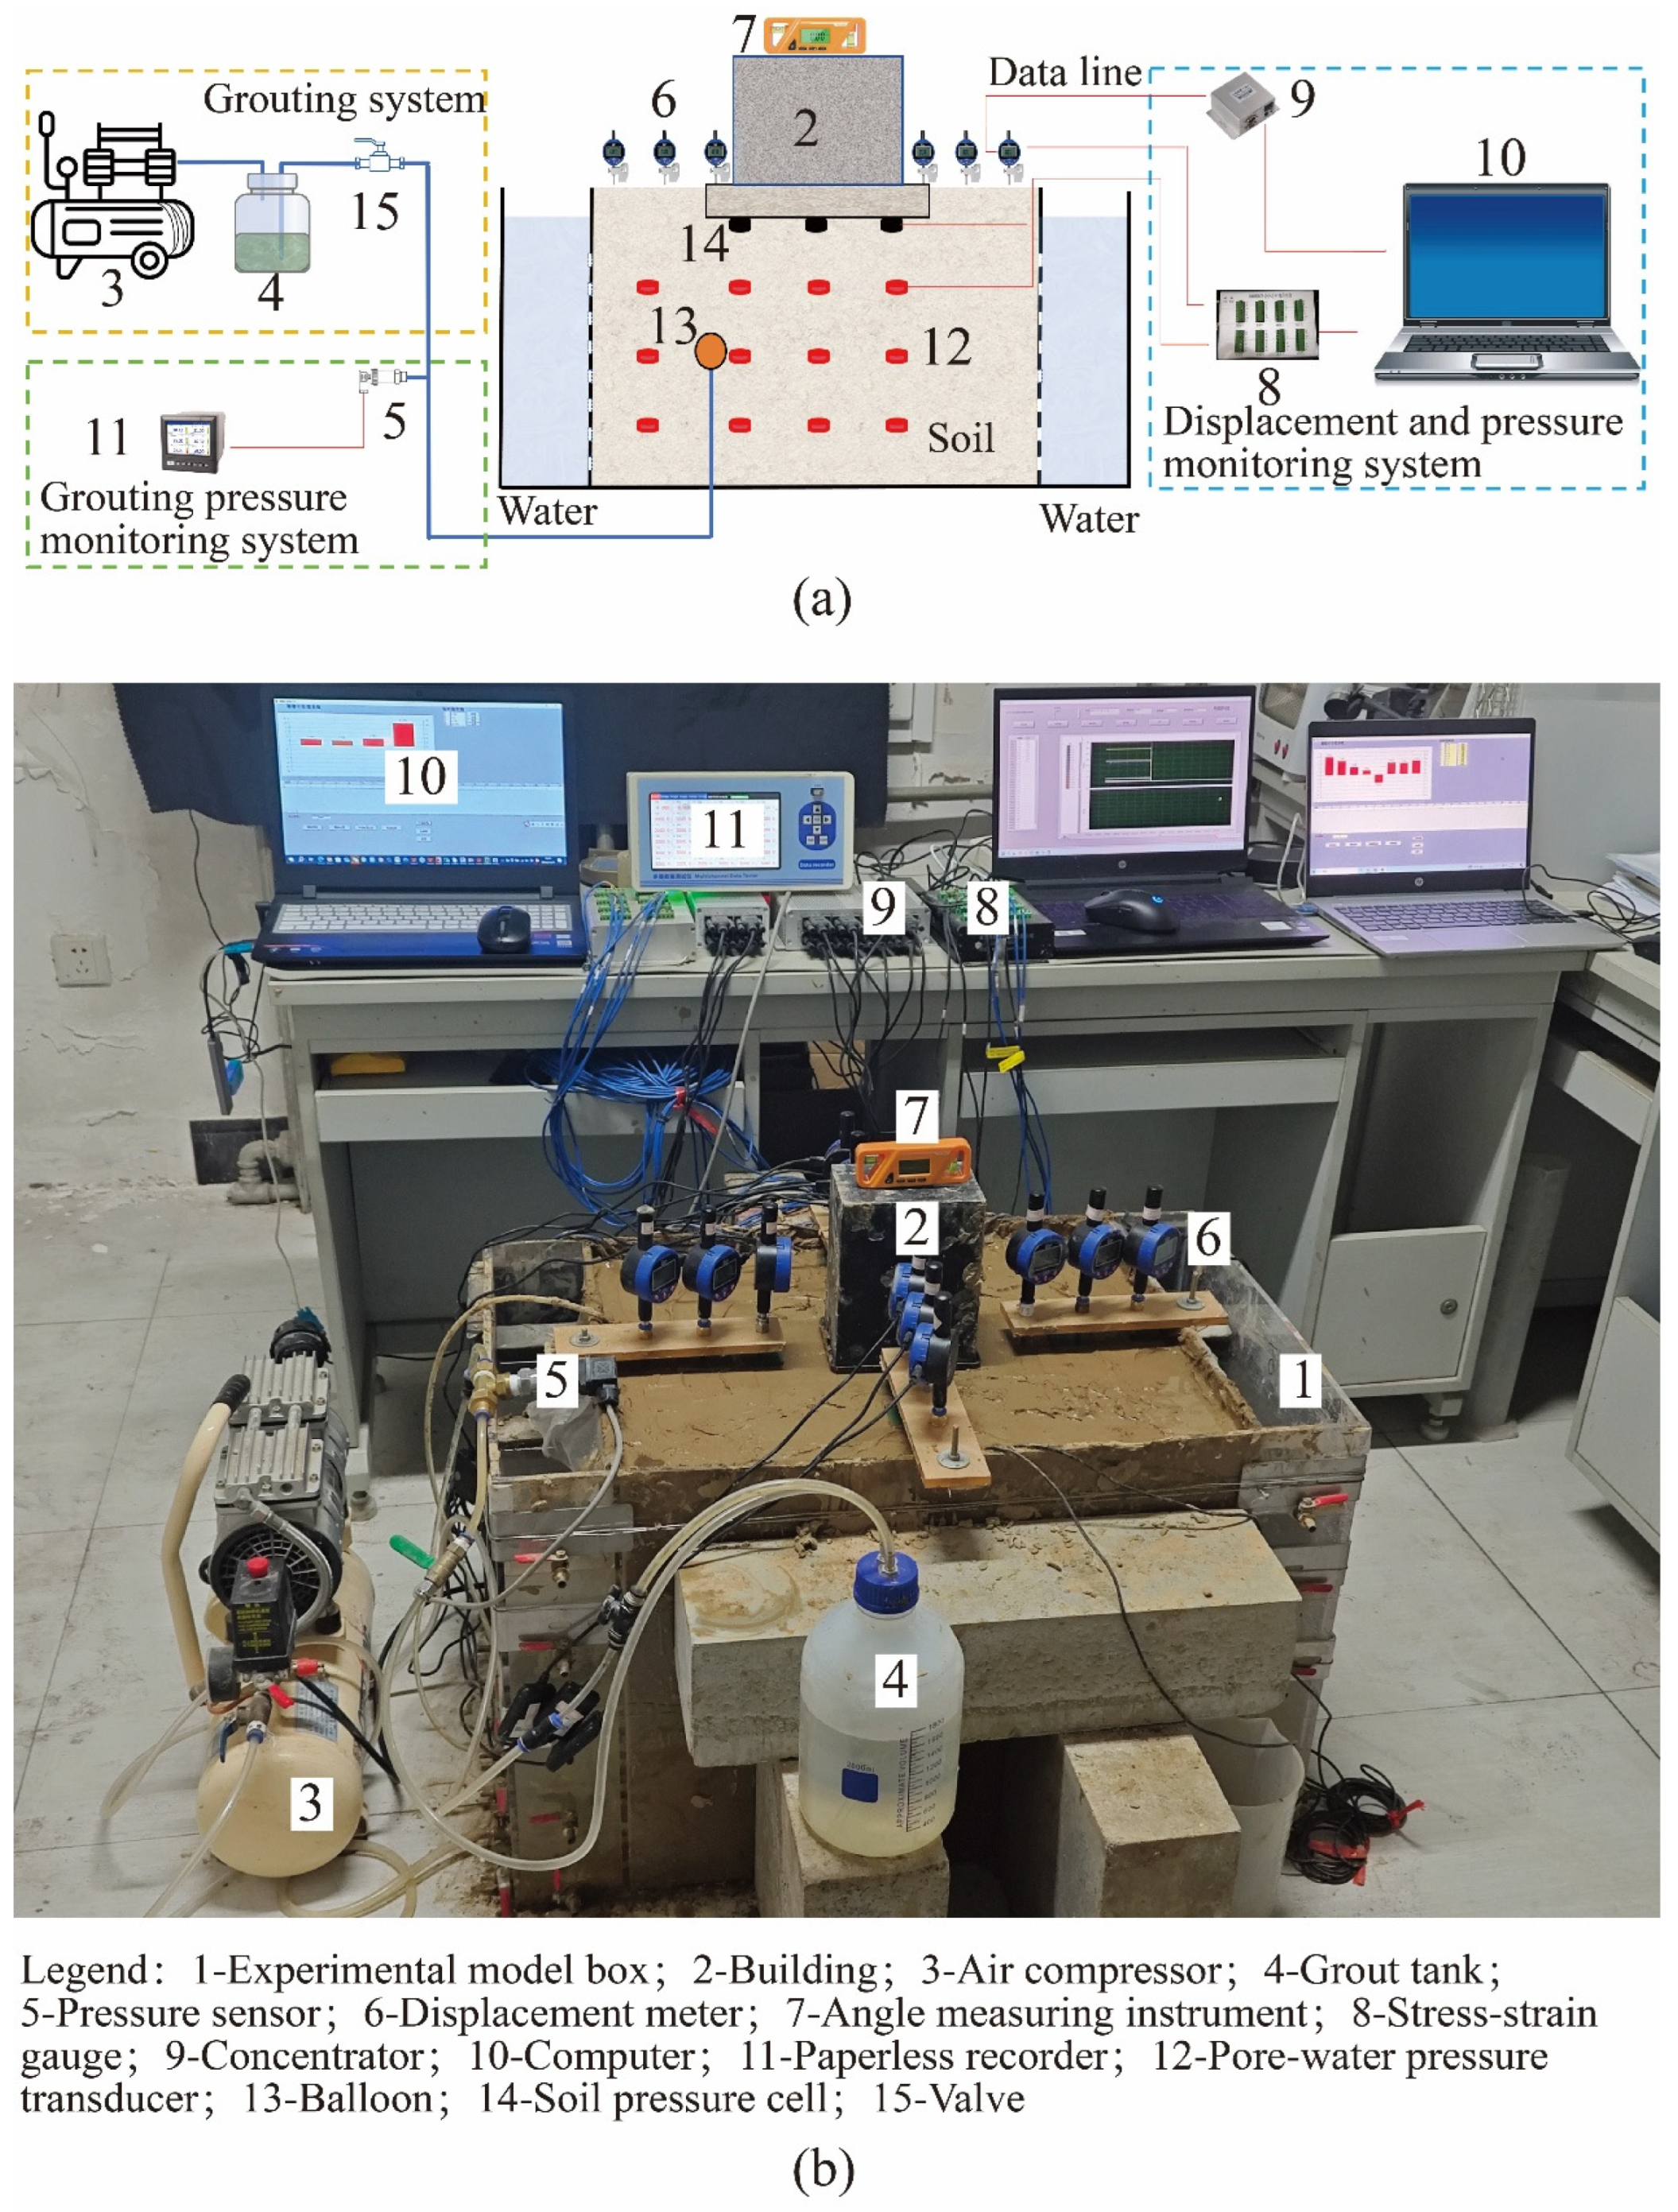
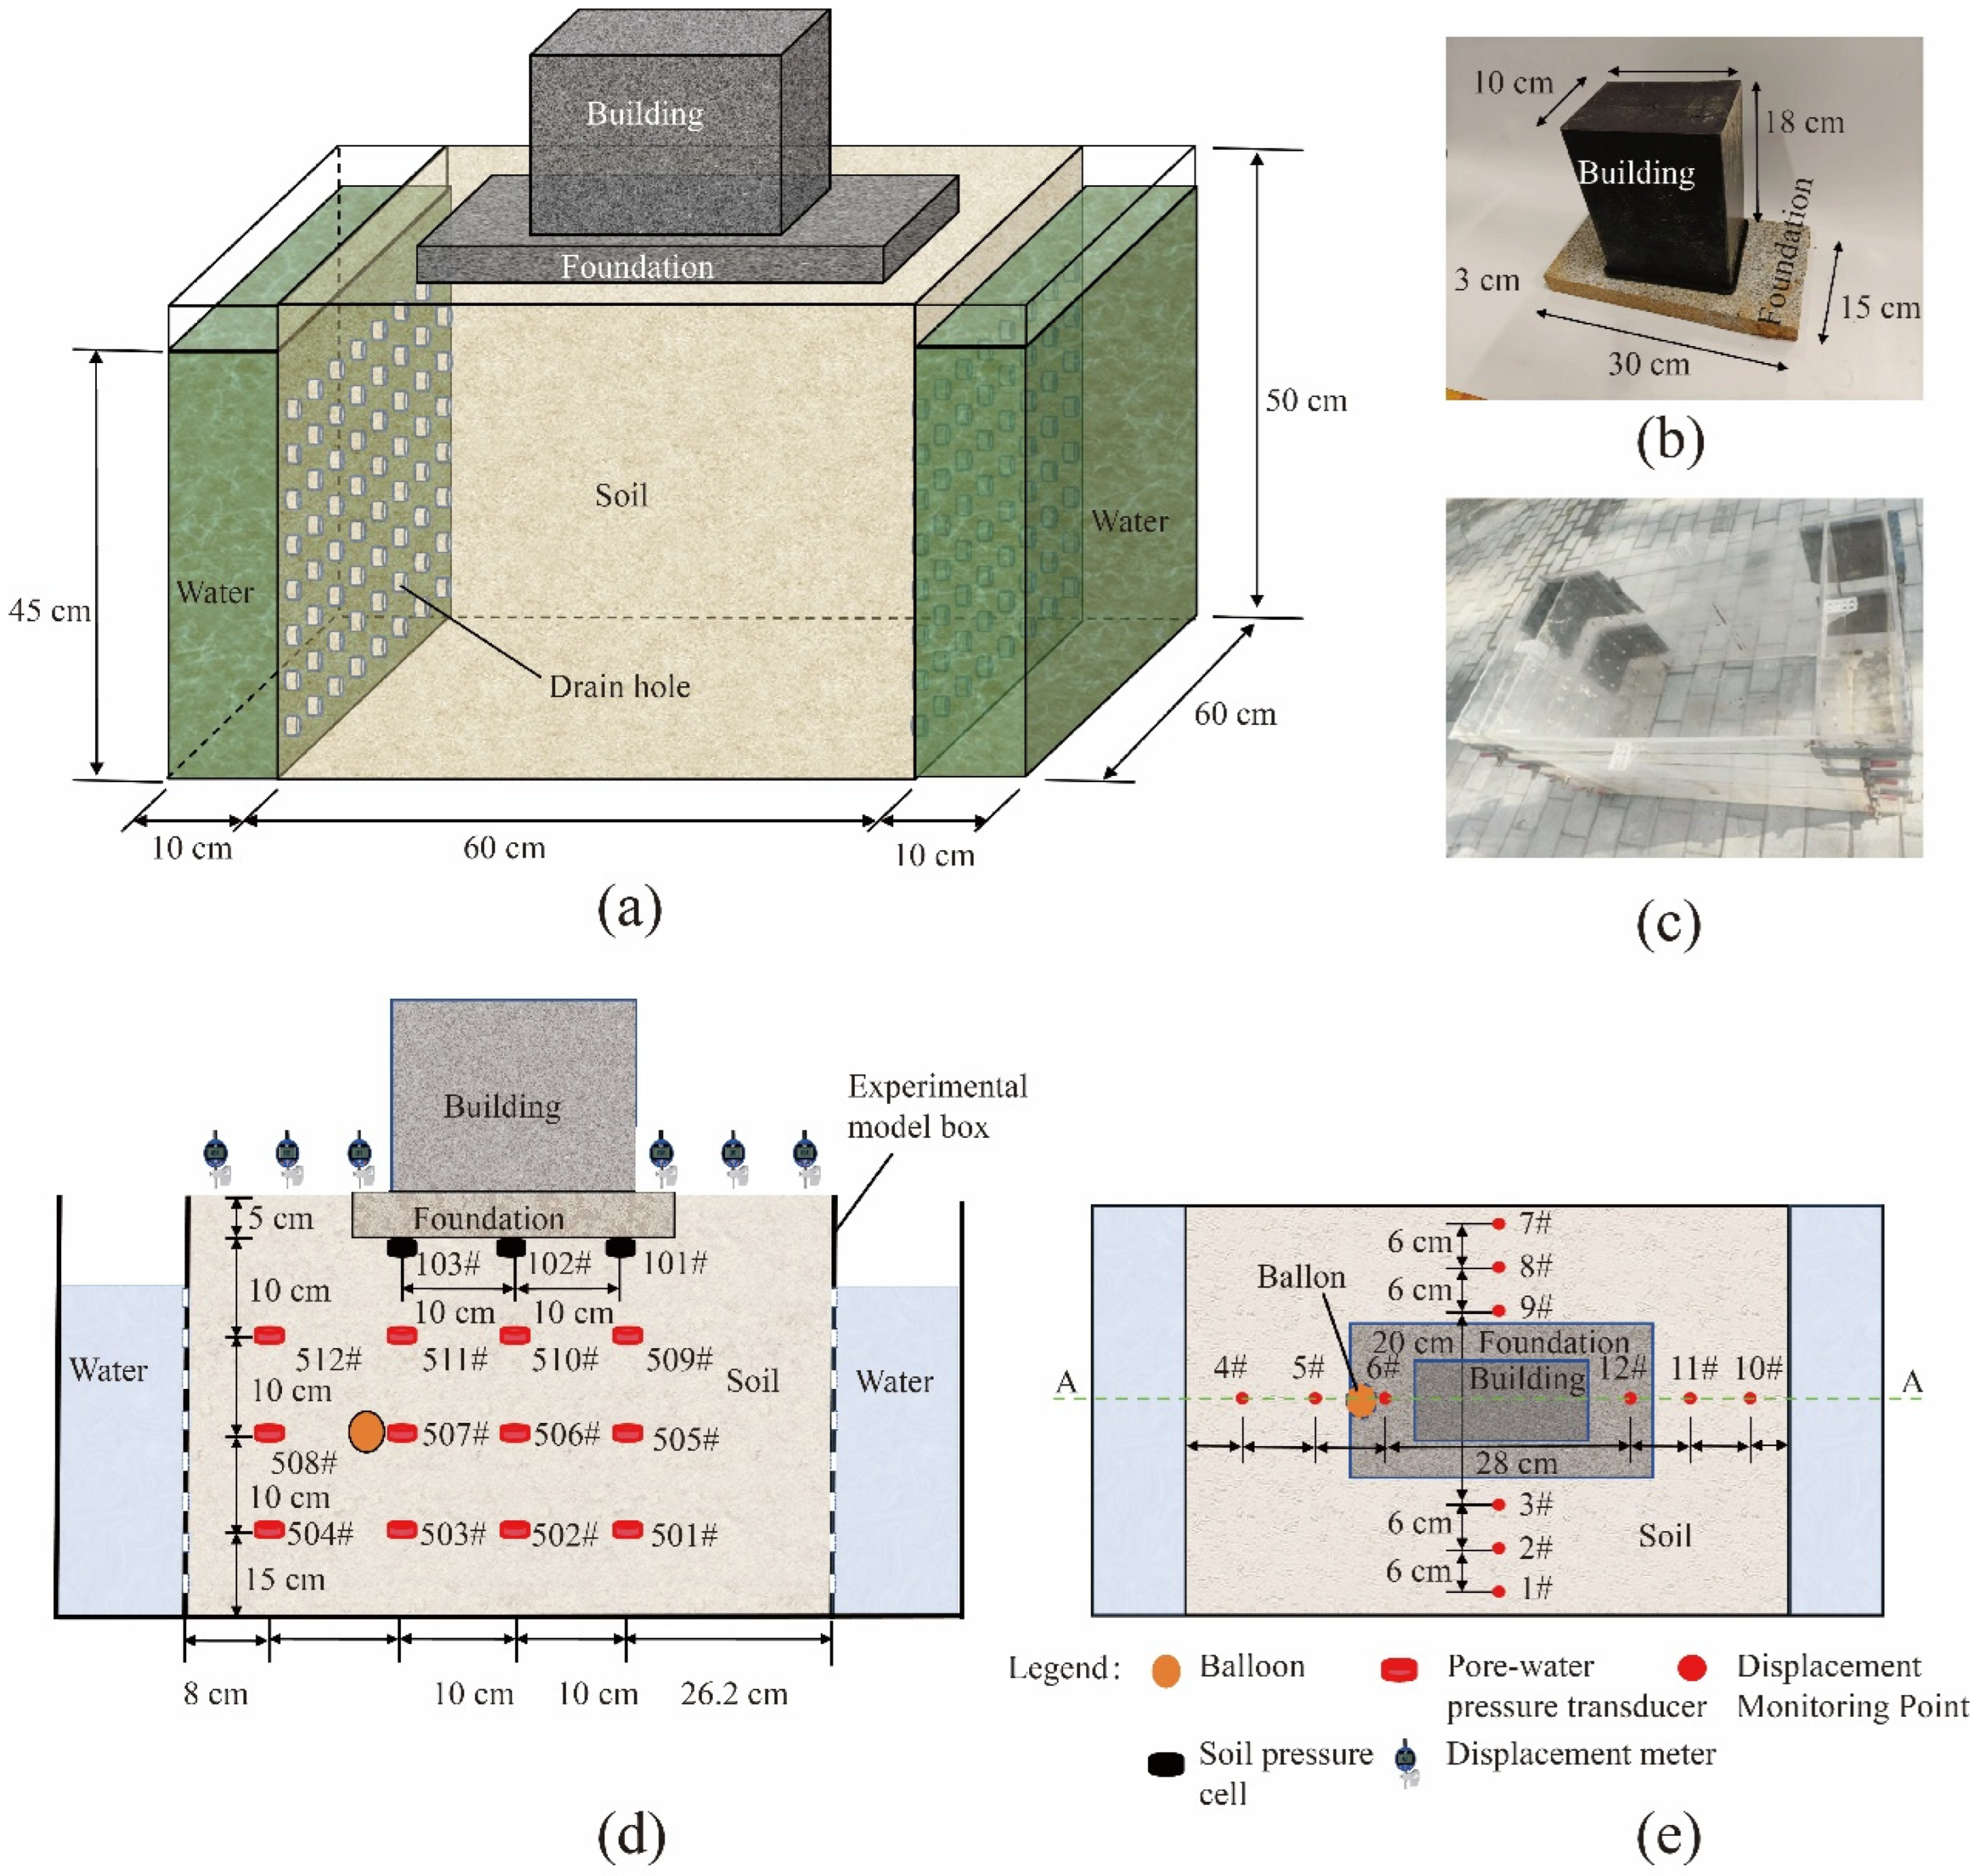
2.3. Experiment Equipment

Figure 4 shows the grouting experiment system. Before grouting, the building tilt angle was set to 0.6°, i.e., a 1% tilt, monitored by a digital angle measuring instrument at the top. By injecting air into the grouting tank through an air compressor, the slurry from the tank is poured into the pre-embedded balloon in the model box to simulate pressure-tight grouting, and the raft foundation is lifted to correct the deflection. During the test, pore water pressure gauges were used to monitor excess pore water pressure, soil pressure cells to monitor base soil pressure, pressure sensors to monitor grouting pressure, and electronic displacement gauges to monitor surface displacement.
The 1 cm thick acrylic model box had dimensions of 80 cm × 60 cm × 50 cm. The center 60 cm was filled with soil, and the sides were equipped with acrylic plates with small holes for drainage, covered with two layers of filter mesh. To simulate the groundwater level, water was added to a depth of 45 cm on both sides, as shown in Figure 5c. The concrete building model measured 15 cm × 10 cm × 18 cm (6.75 kg), while the foundation model was 30 cm × 15 cm × 3 cm (3.375 kg), exerting a base pressure of 2.25 kPa, as shown in Figure 5b. The model was placed in the center of the model box, with the long side parallel to the long side of the box.
During grouting, pore water manometer data were monitored by dynamic and static resistive strain gauges to record the excess pore water pressure changes in the soil. A total of 12 pore water pressure gauges were installed, numbered 501# to 512#, arranged in three layers with four gauges in each layer, located at 10 cm, 20 cm, and 35 cm below the base, and at horizontal distances of 8 cm, 21 cm, 31 cm, and 41 cm from the side of the model box, as shown in Figure 5d. Soil pressure box data were monitored using dynamic and static resistive strain gauges to record changes in earth pressure at the base of the raft slab. A total of three earth pressure boxes were set up under the footing, numbered 101#~103#, with a horizontal distance of 10 cm. The locations of the earth pressure boxes are shown in Figure 5d.
Electronic displacement gauges with a range of 50.8 mm were used to monitor surface displacement. A total of 12 displacement gauges, numbered 1# to 12#, were installed, with three gauges on each side, spaced 6 cm apart, as shown in Figure 5e. The displacement data were recorded using a micrometer system during the test.

2.4. Experiment Process

In this experiment, a two-factor and two-level test method was used to study the influence of grouting depth and grouting rate on the grouting volume, excess pore water pressure, soil pressure, and surface displacement. The grouting depth (h) was defined as the distance from the grouting balloon to the base of the raft foundation, with h set to 10 cm and 20 cm. The grouting rate (V) was set to 6 mL/s and 11.5 mL/s. The test was divided into four groups, with grouting depths of 10 cm and 20 cm and grouting rates of 6 mL/s and 11.5 mL/s.
After preparing the remolded soil, it was filled into the model box in five layers, with thicknesses of 15 cm, 10 cm, 10 cm, 10 cm, and 5 cm. Pore water pressure gauges and grouting balloons were placed at soil depths of 15 cm, 25 cm, and 35 cm. The process of backfill soil during the test is illustrated in Figure 6. Soil pressure cells and the raft foundation were placed at a soil depth of 45 cm. After filling, the tilted building model was placed according to the requirements. Electronic displacement gauges were installed to monitor surface displacement. Grouting lifting and rectification tests were conducted when the surface displacement settlement rate was less than 0.01 mm/h, indicating stability. The grouting was stopped when the building tilt angle reached 0°, and the valves were closed to monitor relevant test data.

3. Results and Discussion

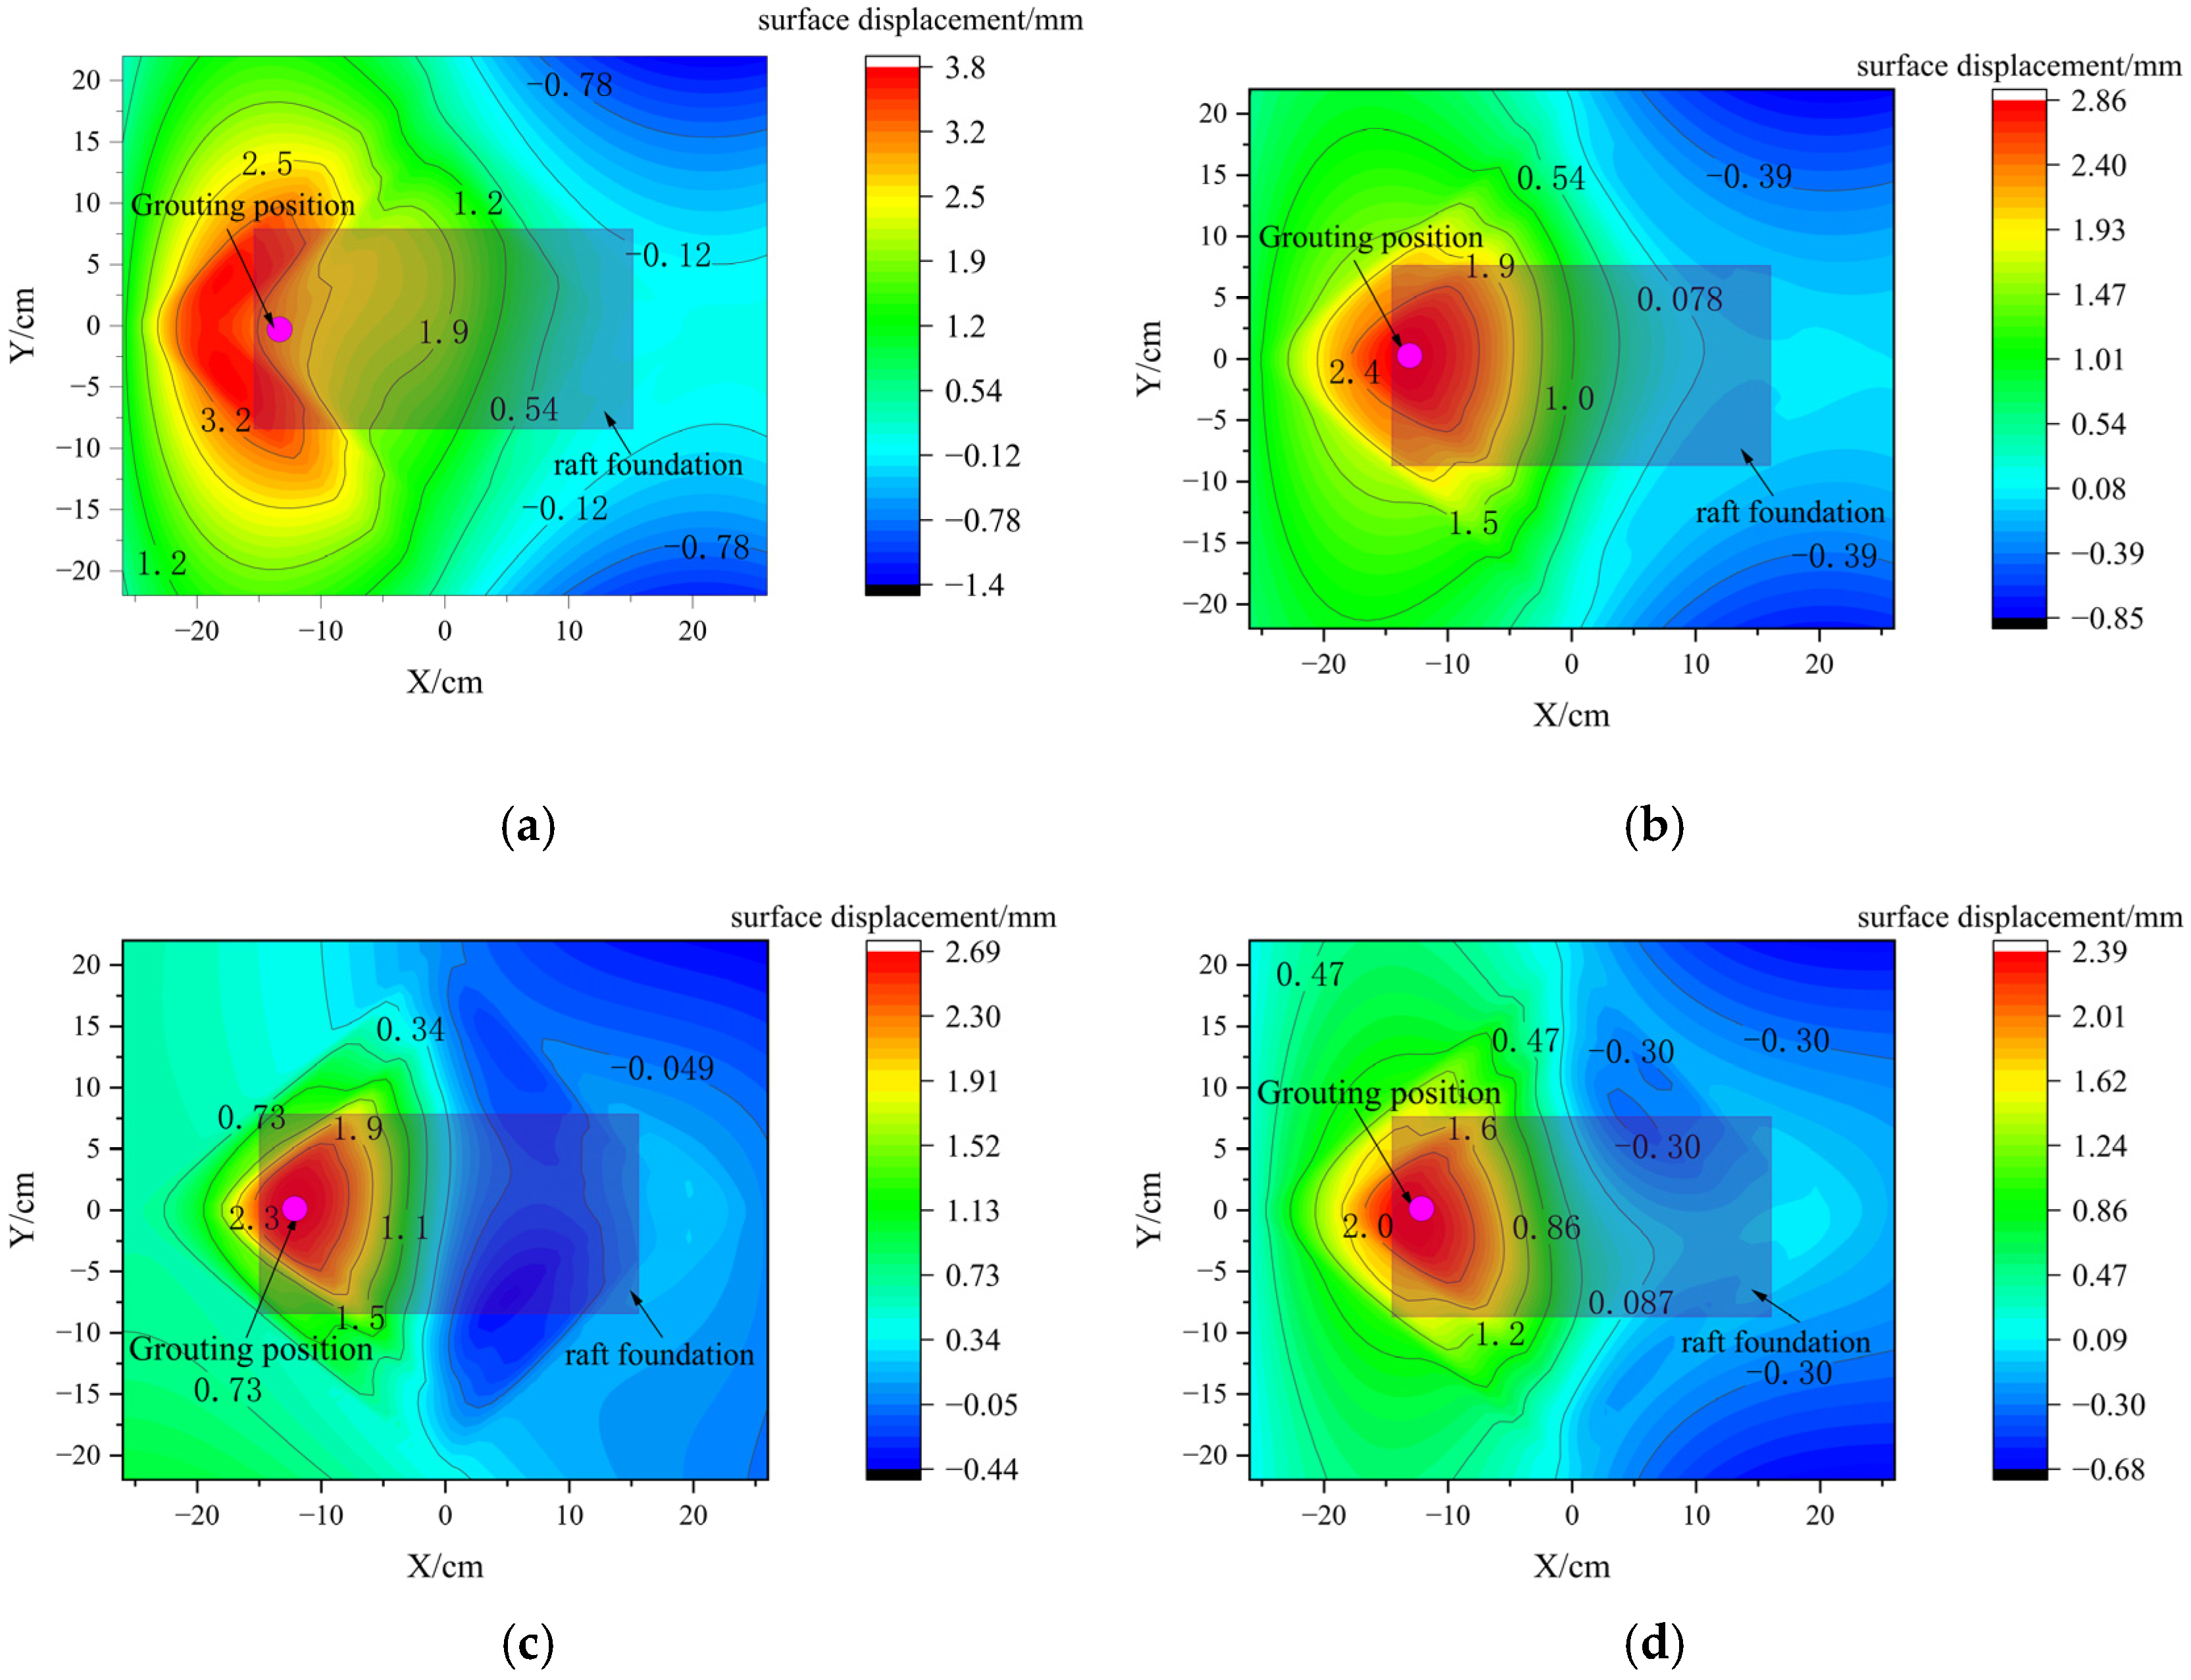
3.1. Surface Displacement

Figure 7 shows the surface displacement after grouting and the completion of excess pore water pressure dissipation in the A-A section (as shown in Figure 5e). As shown in Figure 7, the maximum surface displacement occurred directly above the grouting center, and displacement decreases gradually and symmetrically from the peak value along the vertical axis toward both sides. Surface displacement consistently diminishes as excess pore water pressure dissipates. To quantify this behavior, the grouting efficiency (η) is defined as the ratio of the surface displacement at full excess pore water pressure dissipation ( H c ) to the displacement at grouting completion ( H g ) [30]:
η = H c H g
Based on Equation (5), the grouting efficiency at each displacement monitoring point was calculated using Figure 7, and the average values were determined for each test group. At a grouting depth of 10 cm, the grouting efficiencies for injection rates of 6 mL/s and 11.5 mL/s were 72.3% and 81.3%, respectively, representing an increase of 11%. At a grouting depth of 20 cm, the grouting efficiencies for the same injection rates were 69% and 80.3%, respectively, showing an increase of 11.3%. These results align with findings from the literature [28], where grouting efficiencies of 70–80% were reported for vertical displacements after complete pore water pressure dissipation. The analysis of variance (ANOVA) for the two-factor experiment on grouting efficiency revealed that grouting depth had no significant effect on grouting efficiency, while grouting rate exhibited a statistically significant influence on grouting efficiency. The analytical results are presented in Table 2.
The spatial influence of grouting parameters on surface displacement varies, as demonstrated by the contour maps of surface heave displacement at grouting completion in Figure 8. Key findings from Figure 7 and Figure 8 include the following: The maximum surface uplift occurs directly above the grouting zone and gradually decreases with increasing distance from the center, consistent with experimental results from the literature [14,29]. When the grouting depth was 20 cm, the influence ranges for injection rates of 6 mL/s and 11.5 mL/s were 10 cm and 7.5 cm, respectively, representing a reduction of 50% in the affected area. The influence ranges for the same injection rates are 7.5 cm and 6.0 cm, respectively, showing a 25% reduction in the affected area at a grouting depth of 10 cm.
Figure 9 presents the maximum and average surface heave displacements. The maximum heave displacements for injection rates of 6 mL/s and 11.5 mL/s are 3.59 mm and 2.85 mm, respectively, representing a 20.6% reduction at a grouting depth of 20 cm. The corresponding maximum displacements are 2.58 mm and 2.35 mm, respectively, showing an 8.9% reduction at a grouting depth of 10 cm. A two-factor ANOVA was conducted to analyze the effects of grouting depth and injection rate on maximum heave displacement. The results (Table 3) indicate that the grouting depth (h) has no significant influence (F = 4.12, p = 0.068), whereas the injection rate (V) exhibits highly significant effects (F = 19.15, p < 0.001). A similar analysis for average displacement reveals identical significance trends for both grouting depth and injection rate.
Displacement monitoring points 6# and 12# are located on both sides of the raft foundation. The calculated tilt correction angles based on displacement measurements are 0.606°, 0.583°, 0.527°, and 0.518°, respectively. Figure 10 illustrates the variation in building tilt angles over time. Post-grouting, the tilt meter readings reset to 0°, showing a 10–15% deviation from the displacement-derived correction angles. This discrepancy is attributed to instrumental precision limitations; however, the final tilt angles after correction are all below the code-specified threshold of 0.14°, confirming compliance with the requirements. The building rectification rate is closely tied to the grouting injection rate. From an engineering safety perspective, rapid injection rates may exacerbate risks due to pre-existing internal cracks and stress concentrations in tilted structures. Post-grouting, as excess pore water pressure dissipates, surface displacements gradually decrease, and the building tilt angles partially recover. When the grouting rate remains constant, both the grouting pressure and grout volume exhibit a positive correlation with depth. As the grouting depth increases, the compaction effect of grout bulbs on the surrounding soil becomes more pronounced. This enhanced compaction reduces soil deformation caused by the dissipation of excess pore water pressure, thereby minimizing post-correction tilt recovery of the building. Conversely, at a fixed grouting depth, a lower injection rate results in higher excess pore water pressure. As this pressure gradually dissipates, the resulting soil recompression leads to a greater degree of tilt recovery in the structure.

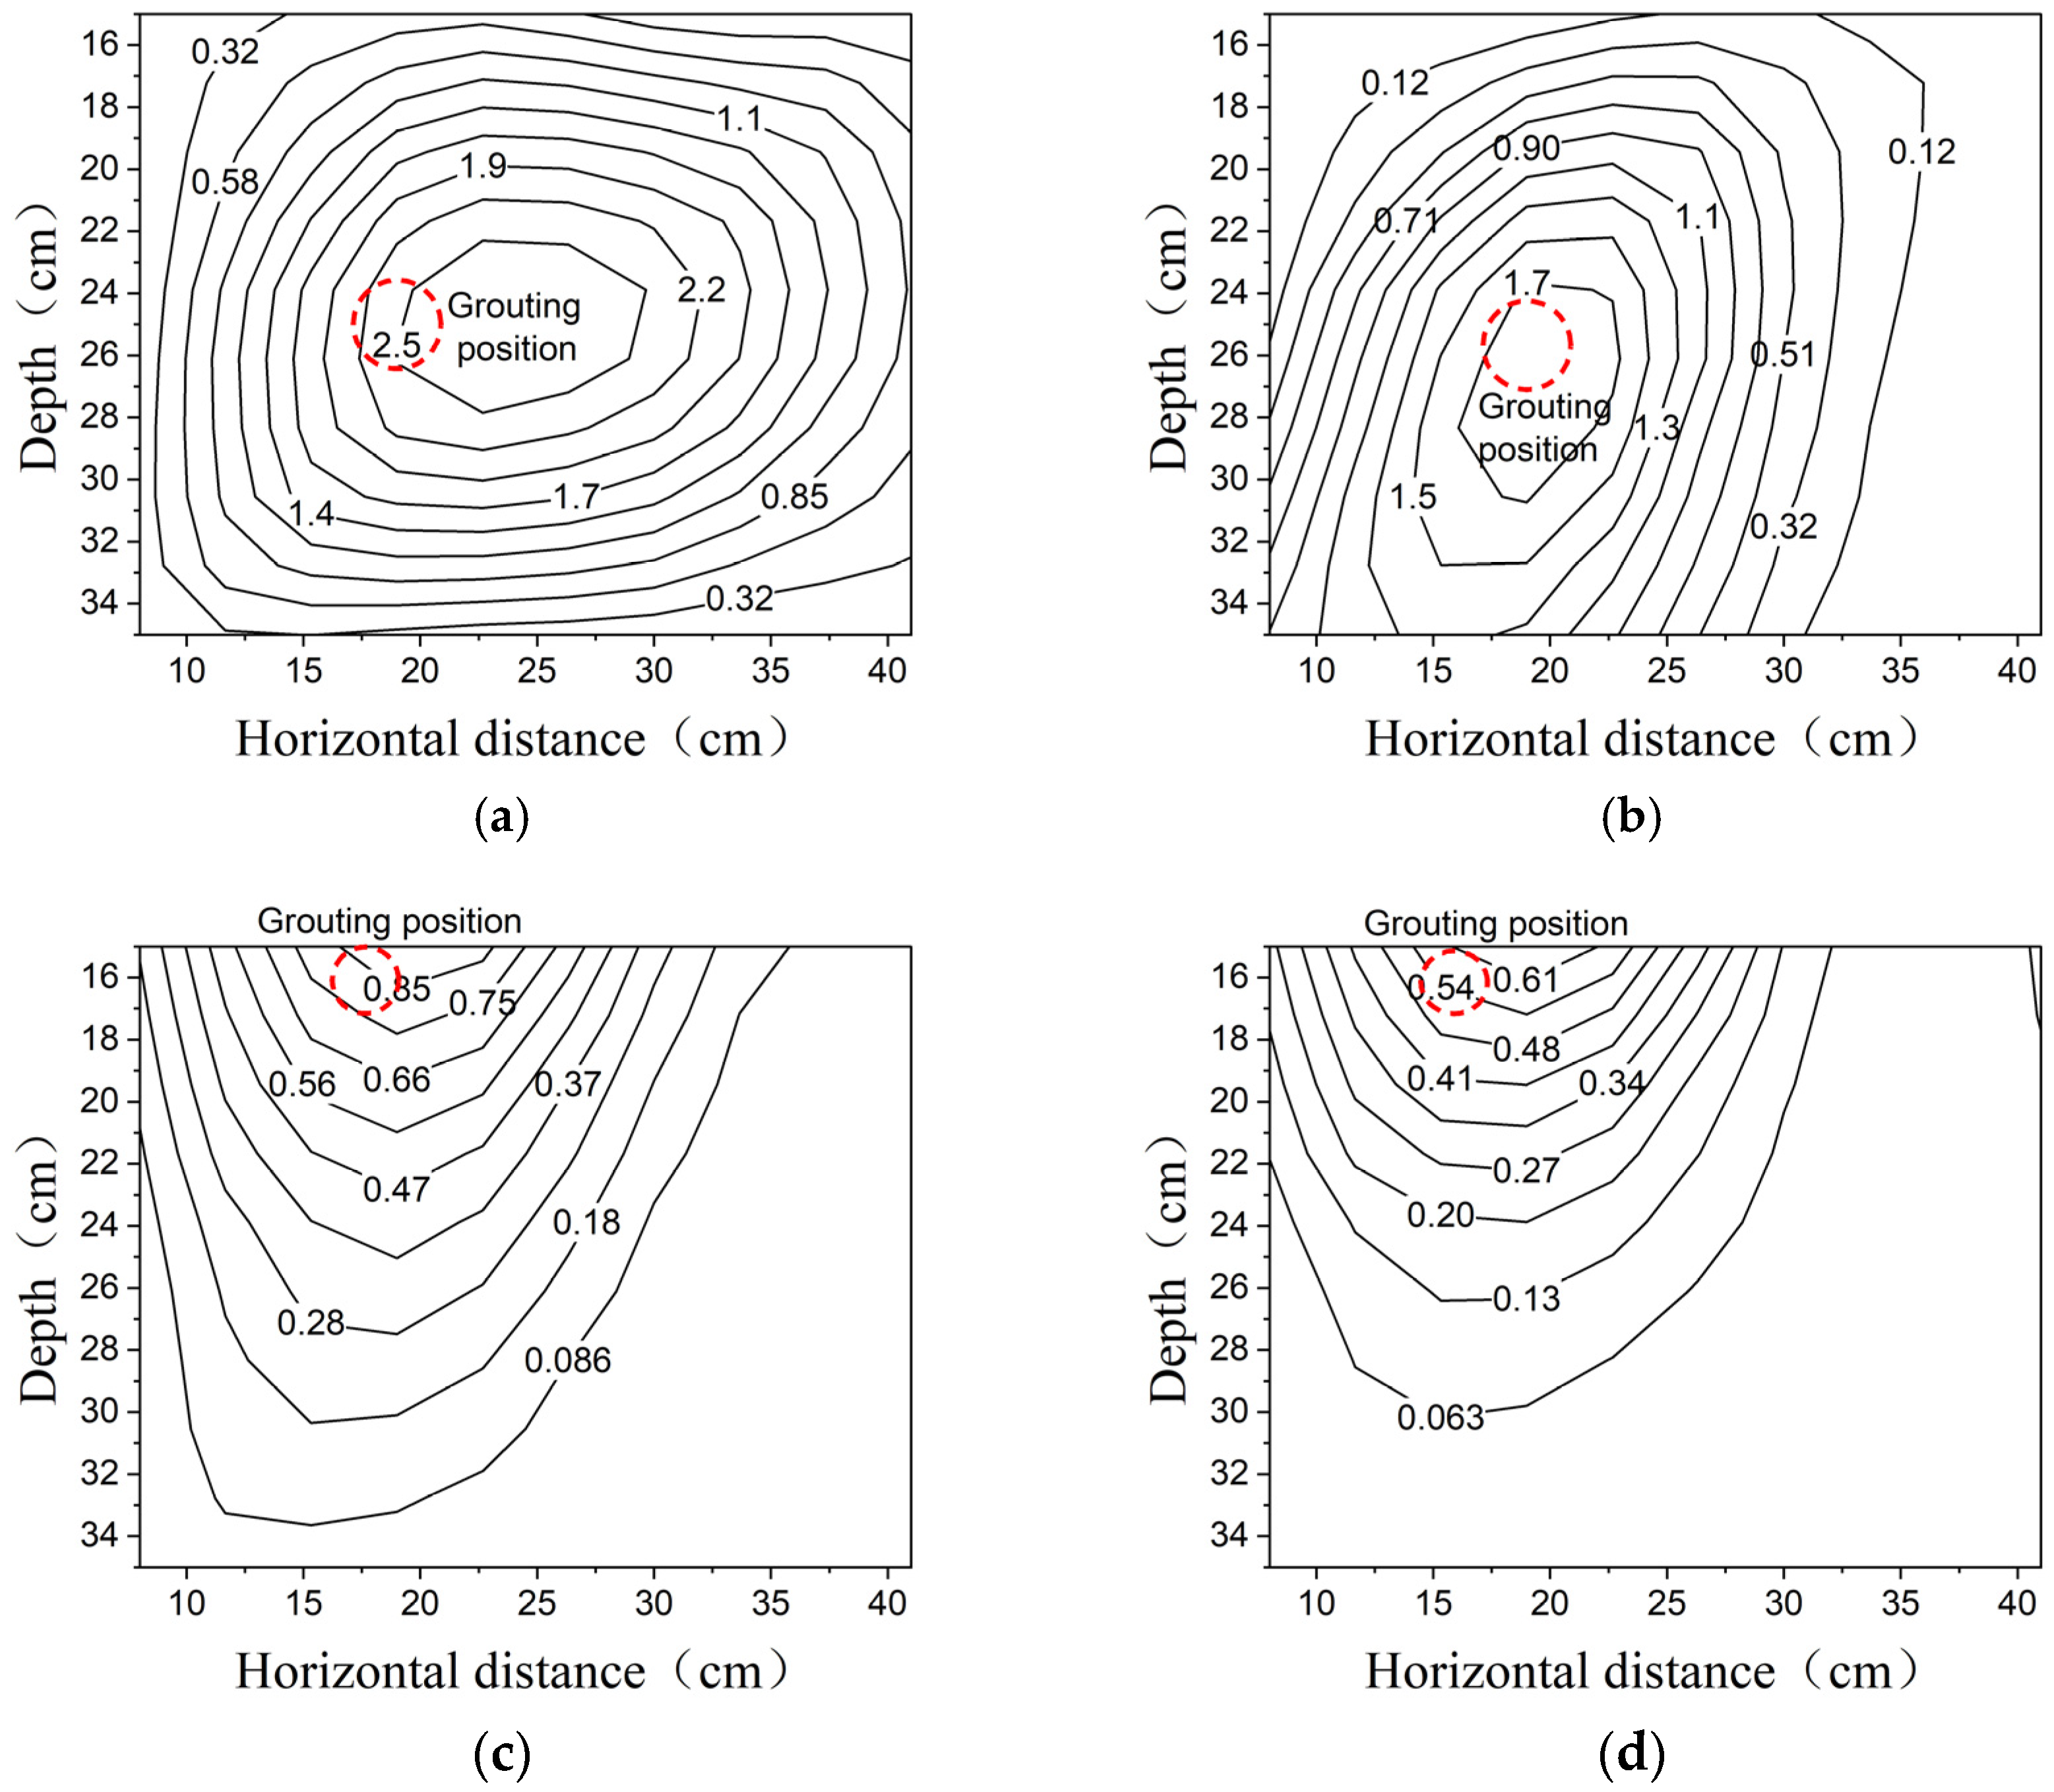
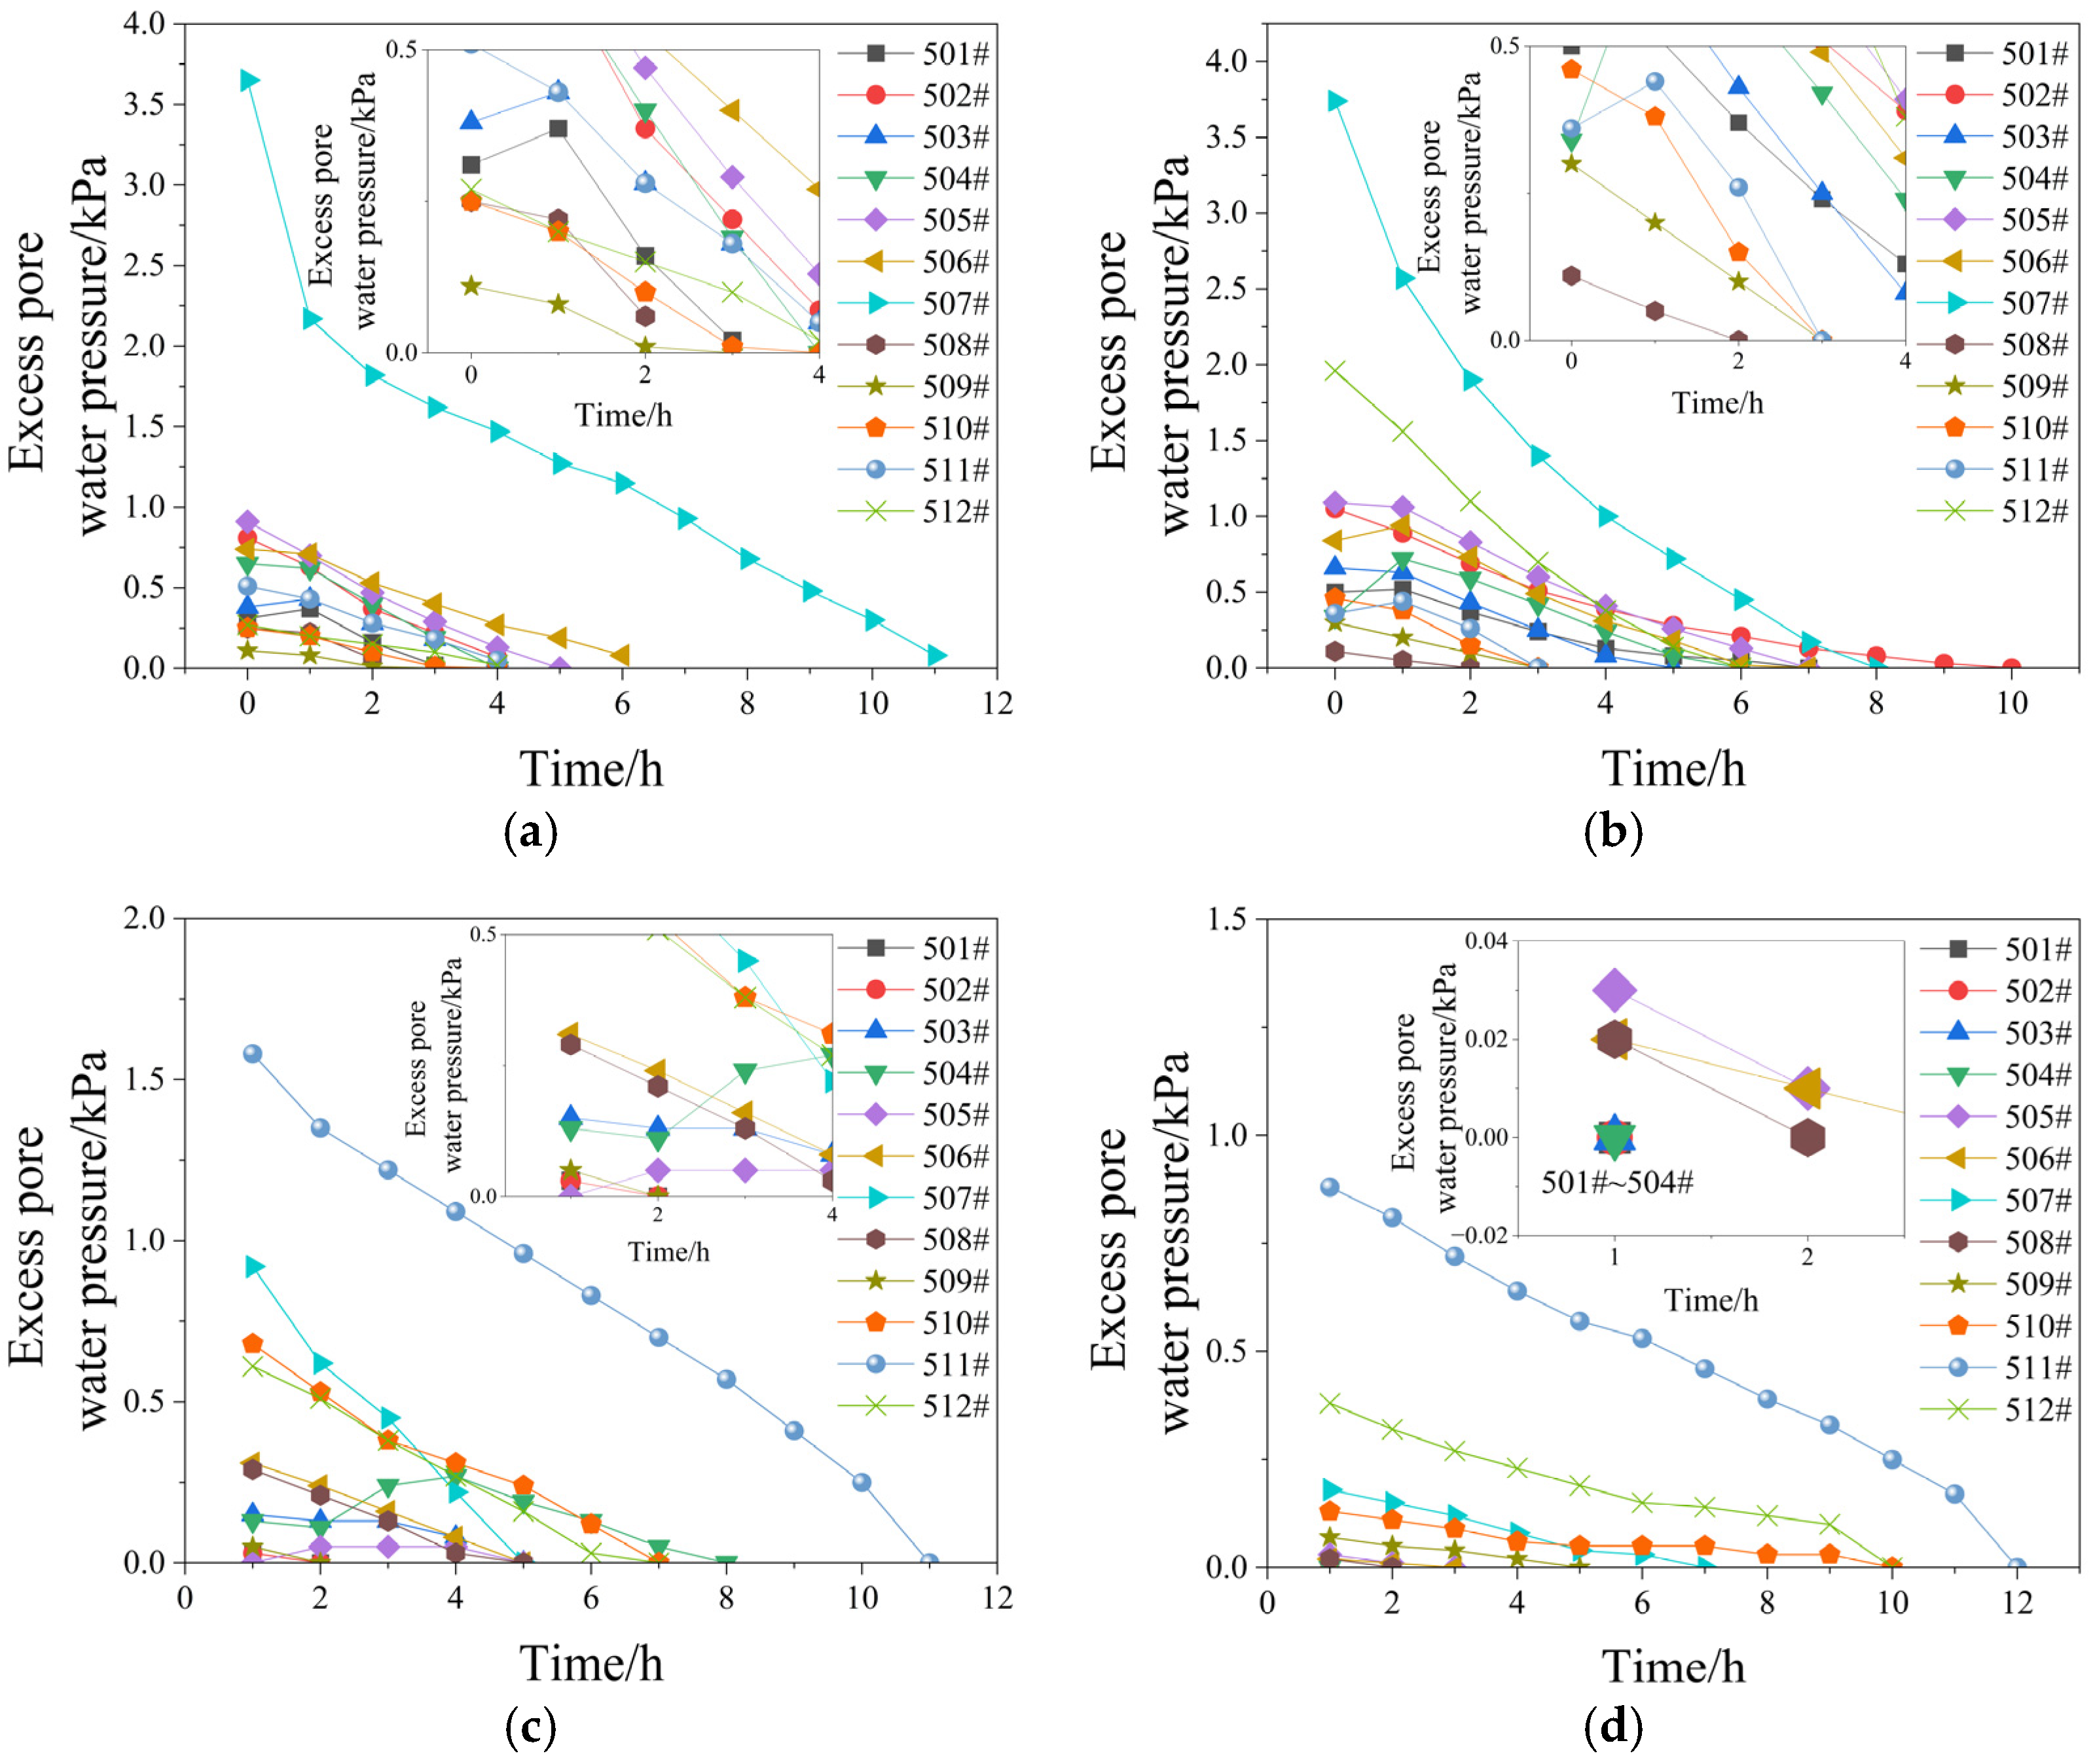
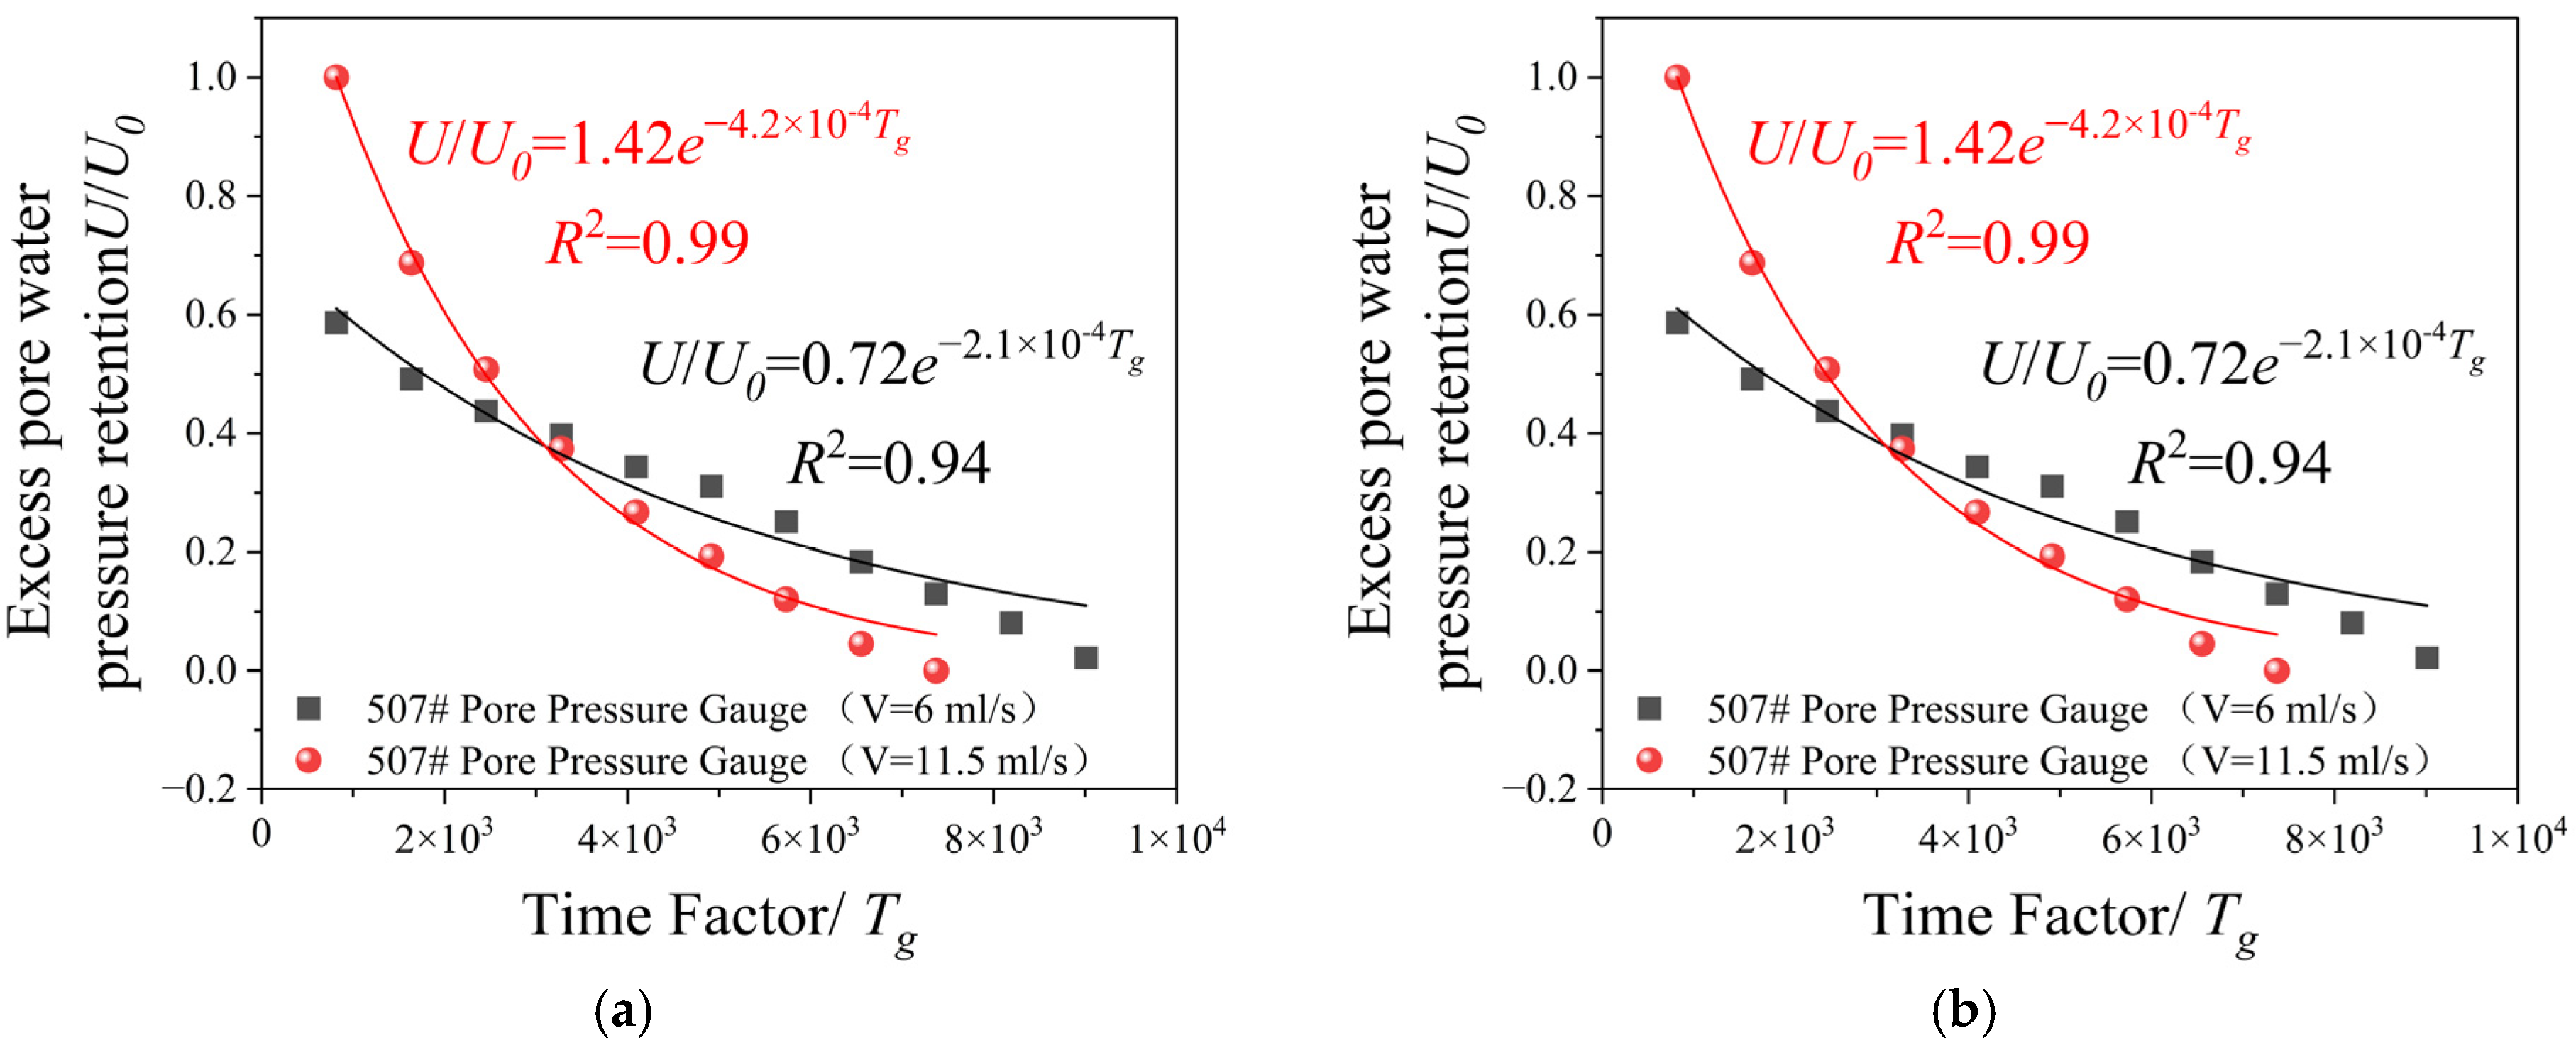
3.2. Excess Pore Water Pressure

Figure 11 illustrates the spatial distribution of excess pore water pressure in the soil upon grouting completion. As shown in Figure 11, the excess pore water pressure gradually decreases radially outward from the grouting center. The pressure generated during grouting at a depth of 20 cm is significantly higher than that at a depth of 10 cm. This phenomenon can be attributed to the conical failure criterion established by Graf and Edward D [31] indicate that at greater grouting depths, the uplift force increases due to the larger weight of the overlying conical soil mass above the grouting zone, thereby generating higher excess pore water pressure. Specifically, at a grouting depth of 20 cm, the excess pore water pressure at an injection rate of 6 mL/s is 47% higher than that at an injection rate of 11.5 mL/s, while at a depth of 10 cm, the corresponding pressure increase is 39%.
The excess pore water pressure was normalized and statistically analyzed, revealing that the normalized pressure U m a x C u and the normalized distance r R c can be fitted using a power function. This relationship, similar to the expressions proposed by Wang [32] and Wu et al. [33], is expressed as
U m a x C u = α ( r R c ) β
where U m a x is the maximum excess pore water pressure induced by grouting, α and β are fitting coefficients, r represents the distance between the grouting hole center and the pore pressure gauge, R c is the radius of the grout bulb formed in the soil after injection, and C u denotes the undrained shear strength of the soil. The relationship between normalized excess pore water pressure and normalized distance for all test groups is shown in Figure 12. Although the values of α and β in this study differ from those reported by Wang [32] and Wu et al. [33] due to variations in experimental conditions, the general trend of excess pore water pressure reduction remains consistent. Figure 12 demonstrates that the excess pore pressure gradually decreases as the distance from the grouting hole increases. The most rapid attenuation occurs within the range r R c = 0~2, suggesting that grouting is most effective in controlling soil deformation within a zone of 2 R c . Therefore, grouting distances in practical engineering should not exceed this range. In contrast, Reference [34] observed the fastest pore pressure decay within r R c = 0~11. This discrepancy arises from differences in boundary conditions and scale effects between the current laboratory model tests and the field grouting tests described in Reference [34]. Despite quantitative deviations, the underlying mechanisms governing pore pressure attenuation align. To address these differences, future research will focus on conducting field trials to validate and refine the findings under real-world conditions.
Figure 13 illustrates the dissipation pattern of excess pore water pressure over time after grouting completion. Monitoring the dissipation process using pore pressure gauges revealed distinct behaviors at different grouting depths. For a grouting depth of 20 cm, the excess pore pressure dissipated rapidly during the initial phase due to the high hydraulic gradient; however, the dissipation rate gradually slowed in the later stages. In contrast, at a grouting depth of 10 cm, the smaller hydraulic gradient resulted in a more stable and consistent dissipation rate throughout the process. These observations highlight the critical role of hydraulic gradient magnitude in governing both the temporal evolution and spatial characteristics of pore pressure dissipation.
In their study on the temporal evolution of grouting efficiency during the injection process, Soga et al. [24] expressed grouting efficiency as a function of the normalized time factor T g , defined as
T g = k σ c t κ γ w r 1 2
where k is the permeability coefficient, σ c is the confining pressure, t is time, κ is the swelling index of clay in the Cambridge model, γ w is the unit weight of water, and r1 is the horizontal distance between the calculation point and the grouting hole. Based on this formula, the dissipation time of excess pore water pressure induced by grouting can be estimated to determine the stabilization time of soil deformation. Following Soga et al.’s [24] definition of T g , this study also defines the time factor T g as kσct/(κγwr12). Additionally, to investigate the dissipation pattern of excess pore water pressure over time, the retention rate of excess pore water pressure U     U 0 is defined, where     U 0 represents the initial excess pore water pressure in the soil immediately after grouting, and U denotes the residual excess pore water pressure during dissipation. As shown in Figure 14, the dissipation time of excess pore water pressure correlates with its magnitude; thus, the maximum excess pore water pressure from each test group was selected for analysis. With a permeability coefficient k = 8.424 × 10⁻³ m/h, pore pressure gauges embedded at depths of 0.25 m (507#) and 0.15 m (511#), confining pressures σ c = 4.375 kPa and 2.625 kPa, a swelling index κ = 0.005 for silty clay, and γ w = 10 kN/m3, the relationship between the retention rate U     U 0 and the normalized time factor T g was derived (Figure 14). The retention rate U     U 0 can be expressed as an exponential function of T g :
U     U 0 = α e β T g
In this experiment, the coefficient of determination ( R 2 ) for the relationship between U     U 0 and T g ranged from 94% to 99%, confirming the reliability of Equation (8) in describing the retention rate. This formula can be applied to estimate the dissipation time of pore water pressure and the stabilization time of soil deformation at varying distances from the grouting source. As illustrated in Figure 14, when grouting at a depth of 20 cm, higher grouting rates resulted in faster dissipation of excess pore water pressure, whereas at a grouting depth of 10 cm, the dissipation rate remained consistent across different grouting rates. The normalized time factor ( T g ) provides a mathematical framework for analyzing temporal variations, while the retention rate ( U     U 0 ) quantifies the residual pore pressure dynamics, with the swelling index ( κ ) serving as a critical parameter in modeling clay behavior. The high R 2 values further validate the accuracy of the proposed exponential model.

3.3. Substrate-Additional Pressure

Figure 15 illustrates the distribution of additional base pressure after grouting. As shown in the figure, the maximum additional base pressure occurs at position 103# (directly above the grouting location), and the pressure decreases with increasing horizontal distance from the grouting center. For a grouting depth of 10 cm and grouting rates of 6 mL/s and 11.5 mL/s, the additional soil pressures recorded by the 103# earth pressure cell were 4.94 kPa and 4.68 kPa, respectively. At a grouting depth of 20 cm with the same rates, the corresponding pressures were 3.00 kPa and 2.08 kPa. A two-factor analysis of variance (ANOVA) was conducted on the additional base pressure at 103#, and the results (Table 4) indicate that the grouting rate had no significant effect on the additional base pressure, whereas the grouting depth exerted a statistically significant influence.

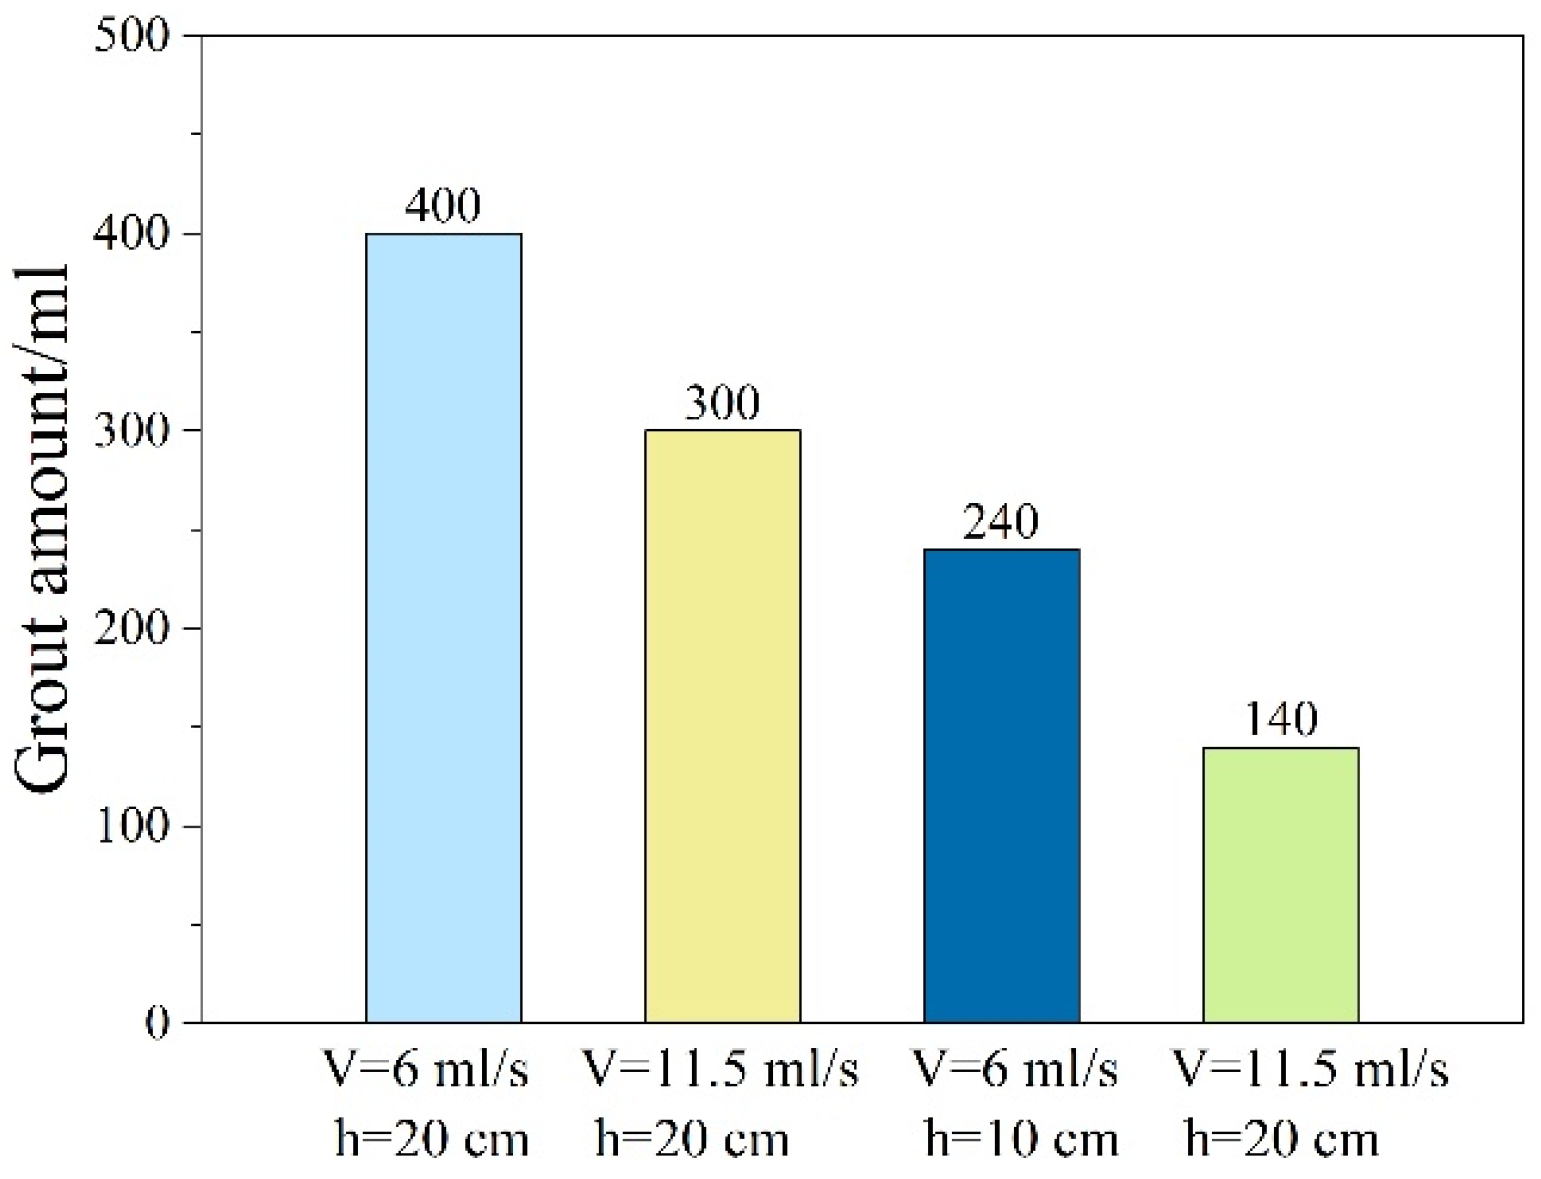
3.4. Grouting Volume

Figure 16 presents the grouting volume after grouting. As shown in the figure, for a grouting depth of 20 cm with grouting rates of 6 mL/s and 11.5 mL/s, the corresponding grouting volumes were 400 mL and 300 mL, respectively. At a grouting depth of 10 cm, the volumes were 300 mL and 140 mL, indicating that lower grouting rates under the same depth require higher total grout volumes. For rectifying buildings with identical tilt angles, a slower grouting rate prolongs the duration of simulated grout bulb expansion, increasing the proportion of soil compaction volume relative to the grouting volume. Conversely, higher grouting rates shorten the compaction time, reduce the compacted soil volume, and decrease the total grouting volume. From the perspective of soil reinforcement, employing a lower grouting rate enhances grout volume, intensifies soil compaction and reinforcement, improves soil density, increases interparticle contact, and elevates soil-bearing capacity. Under identical grouting rates, increasing the grouting depth resulted in grouting volume increments of 66.7% and 114.3%, respectively. This is attributed to the larger soil volume requiring grout filling at greater depths, as well as the potential complexity of grout distribution and diffusion, which may lead to uneven grouting in certain areas. In summary, grouting depth exhibits a positive correlation with grouting volume—greater depths typically necessitate higher grout quantities.

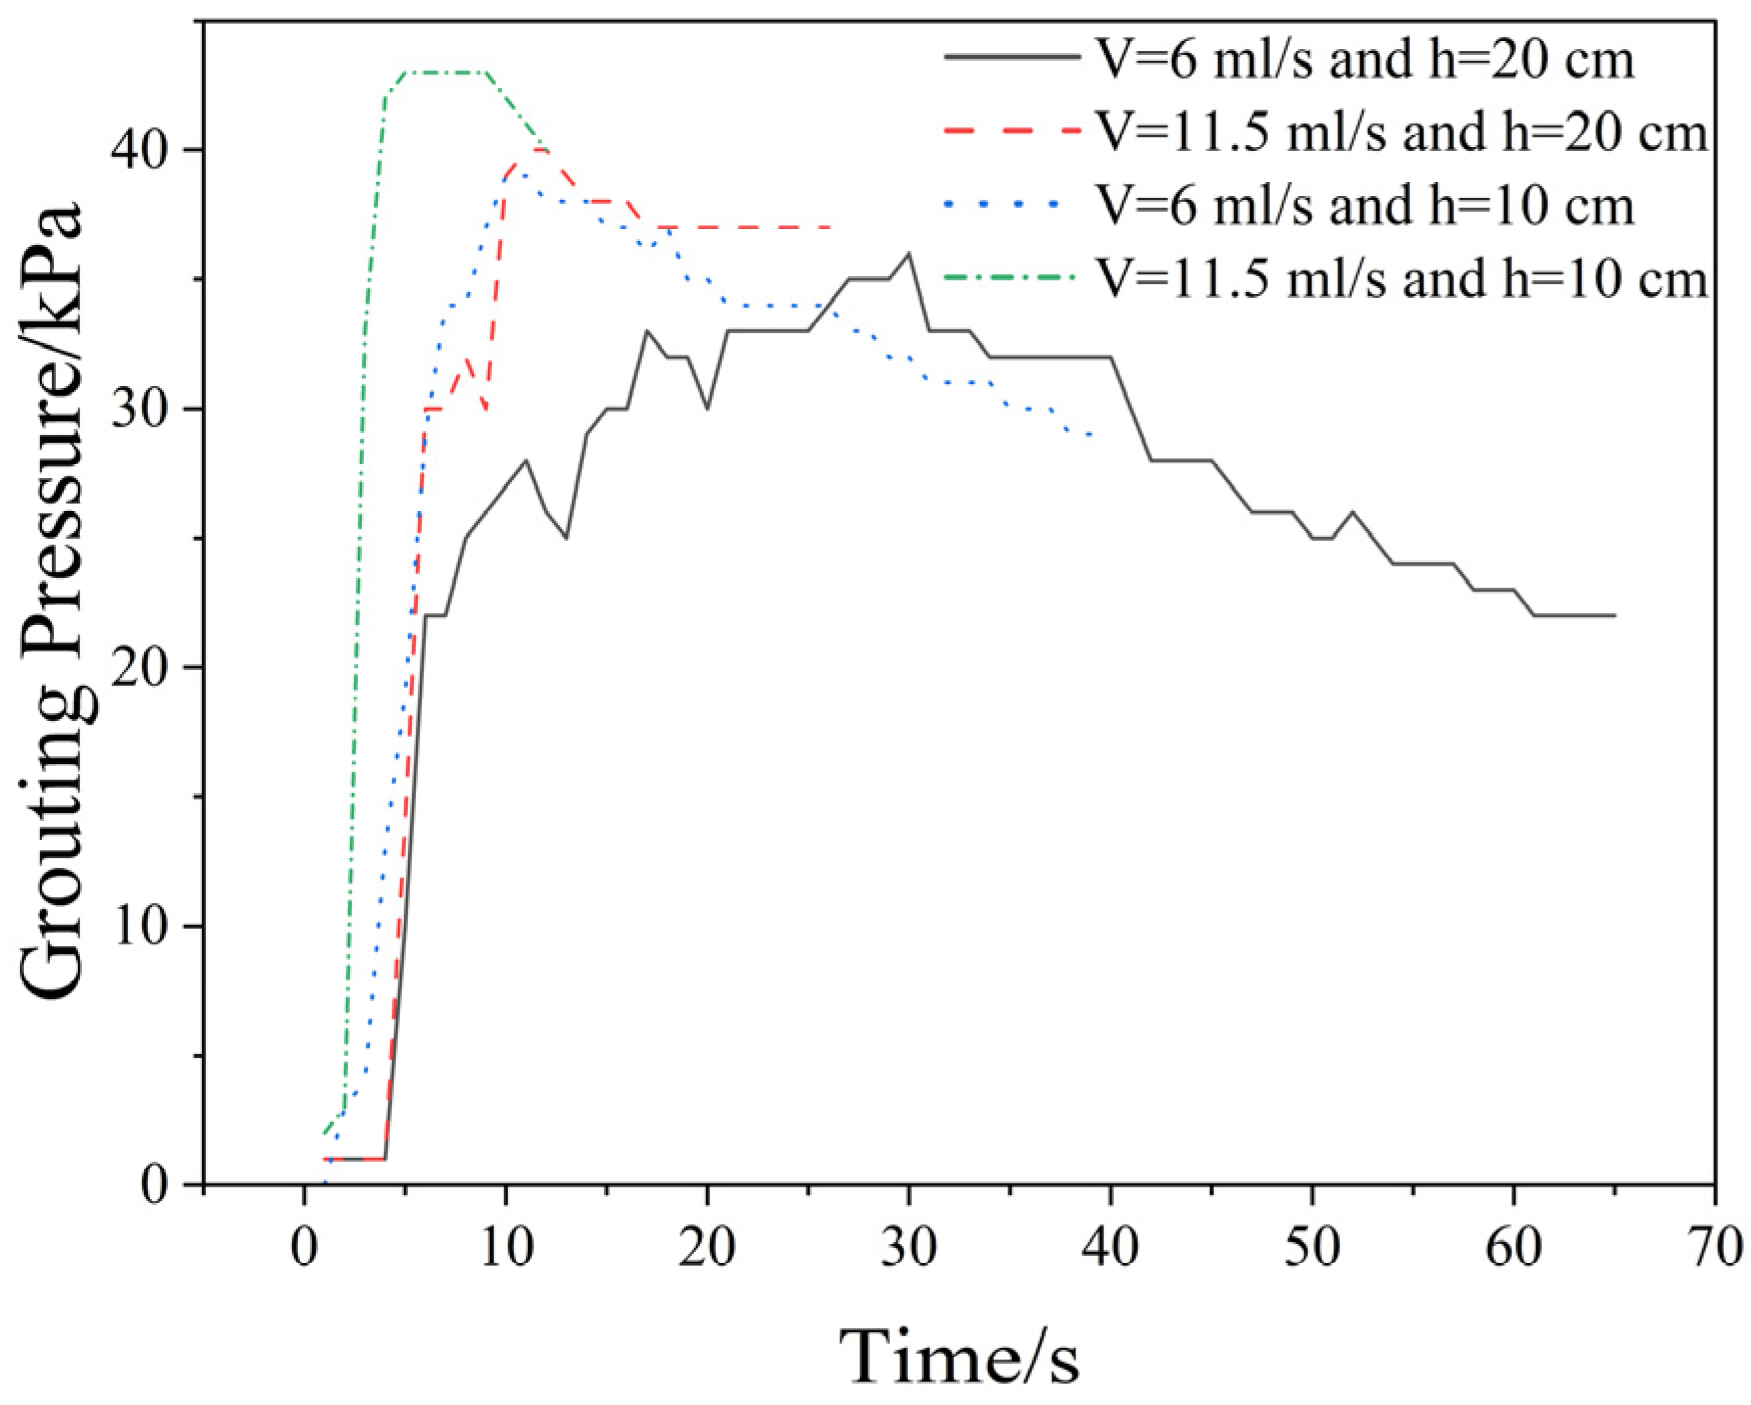
3.5. Grouting Pressure

Figure 17 displays the variation curve of grouting pressure over time during the injection process. In the initial stage of grouting, the pressure surged sharply, reaching its peak near the end of the injection phase, followed by a gradual decay. The highest recorded peak grouting pressure of 43 kPa occurred in the test with a grouting depth of 10 cm and a grouting rate of 11.5 mL/s. Subsequent peaks of approximately 39 kPa were observed in two other test conditions: one with a grouting depth of 10 cm and a rate of 6 mL/s and another with a depth of 20 cm and a rate of 11.5 mL/s. The lowest peak pressure of 36 kPa was recorded in the test with a depth of 20 cm and a rate of 6 mL/s. For ideal compaction grouting, regardless of grouting depth, an increase in grouting rate consistently led to higher grouting pressures. Faster injection rates necessitate greater pressure due to the rapid rise in pore water pressure within the soil, which must be overcome to ensure the formation of a grout bulb. However, excessively high grouting rates risk inducing soil failure or uneven settlement. Consequently, practical operations require careful control of grouting rates to balance injection pressure with soil stability, ensuring both effective grout penetration and structural integrity of the treated ground.

3.6. Limitations and Prospects of the Study

The natural sedimentary structure of undisturbed soil (flocculent/honeycomb configuration) is completely disrupted during the remolding process. The remolded soil material exhibits a moisture content of 39.86%, significantly higher than the field-measured moisture content of 28.5% for the undisturbed soil. Additionally, parameters such as the permeability coefficient and undrained shear strength differ between the remolded and undisturbed soils. This experiment did not account for the effects of permeability and pressure filtration on grouting effectiveness, and the laboratory tests were inevitably influenced by scale effects. Further investigations, such as field grouting trials or laboratory centrifuge grouting tests, are required to better understand the long-term performance of grouting-induced uplift. While this simulation focused on raft foundations, future work should extend to buildings with other foundation types, such as isolated foundations and strip foundations, to comprehensively evaluate the applicability of the findings.

4. Conclusions

This study conducted model tests on the uplift rectification of raft foundation buildings in saturated silty clay using a self-designed experimental setup. The patterns of ground surface displacement, excess pore water pressure, and foundation-additional pressure induced by grouting were analyzed, along with the influence of grouting depth and injection rate on rectification effectiveness. The main conclusions are as follows:
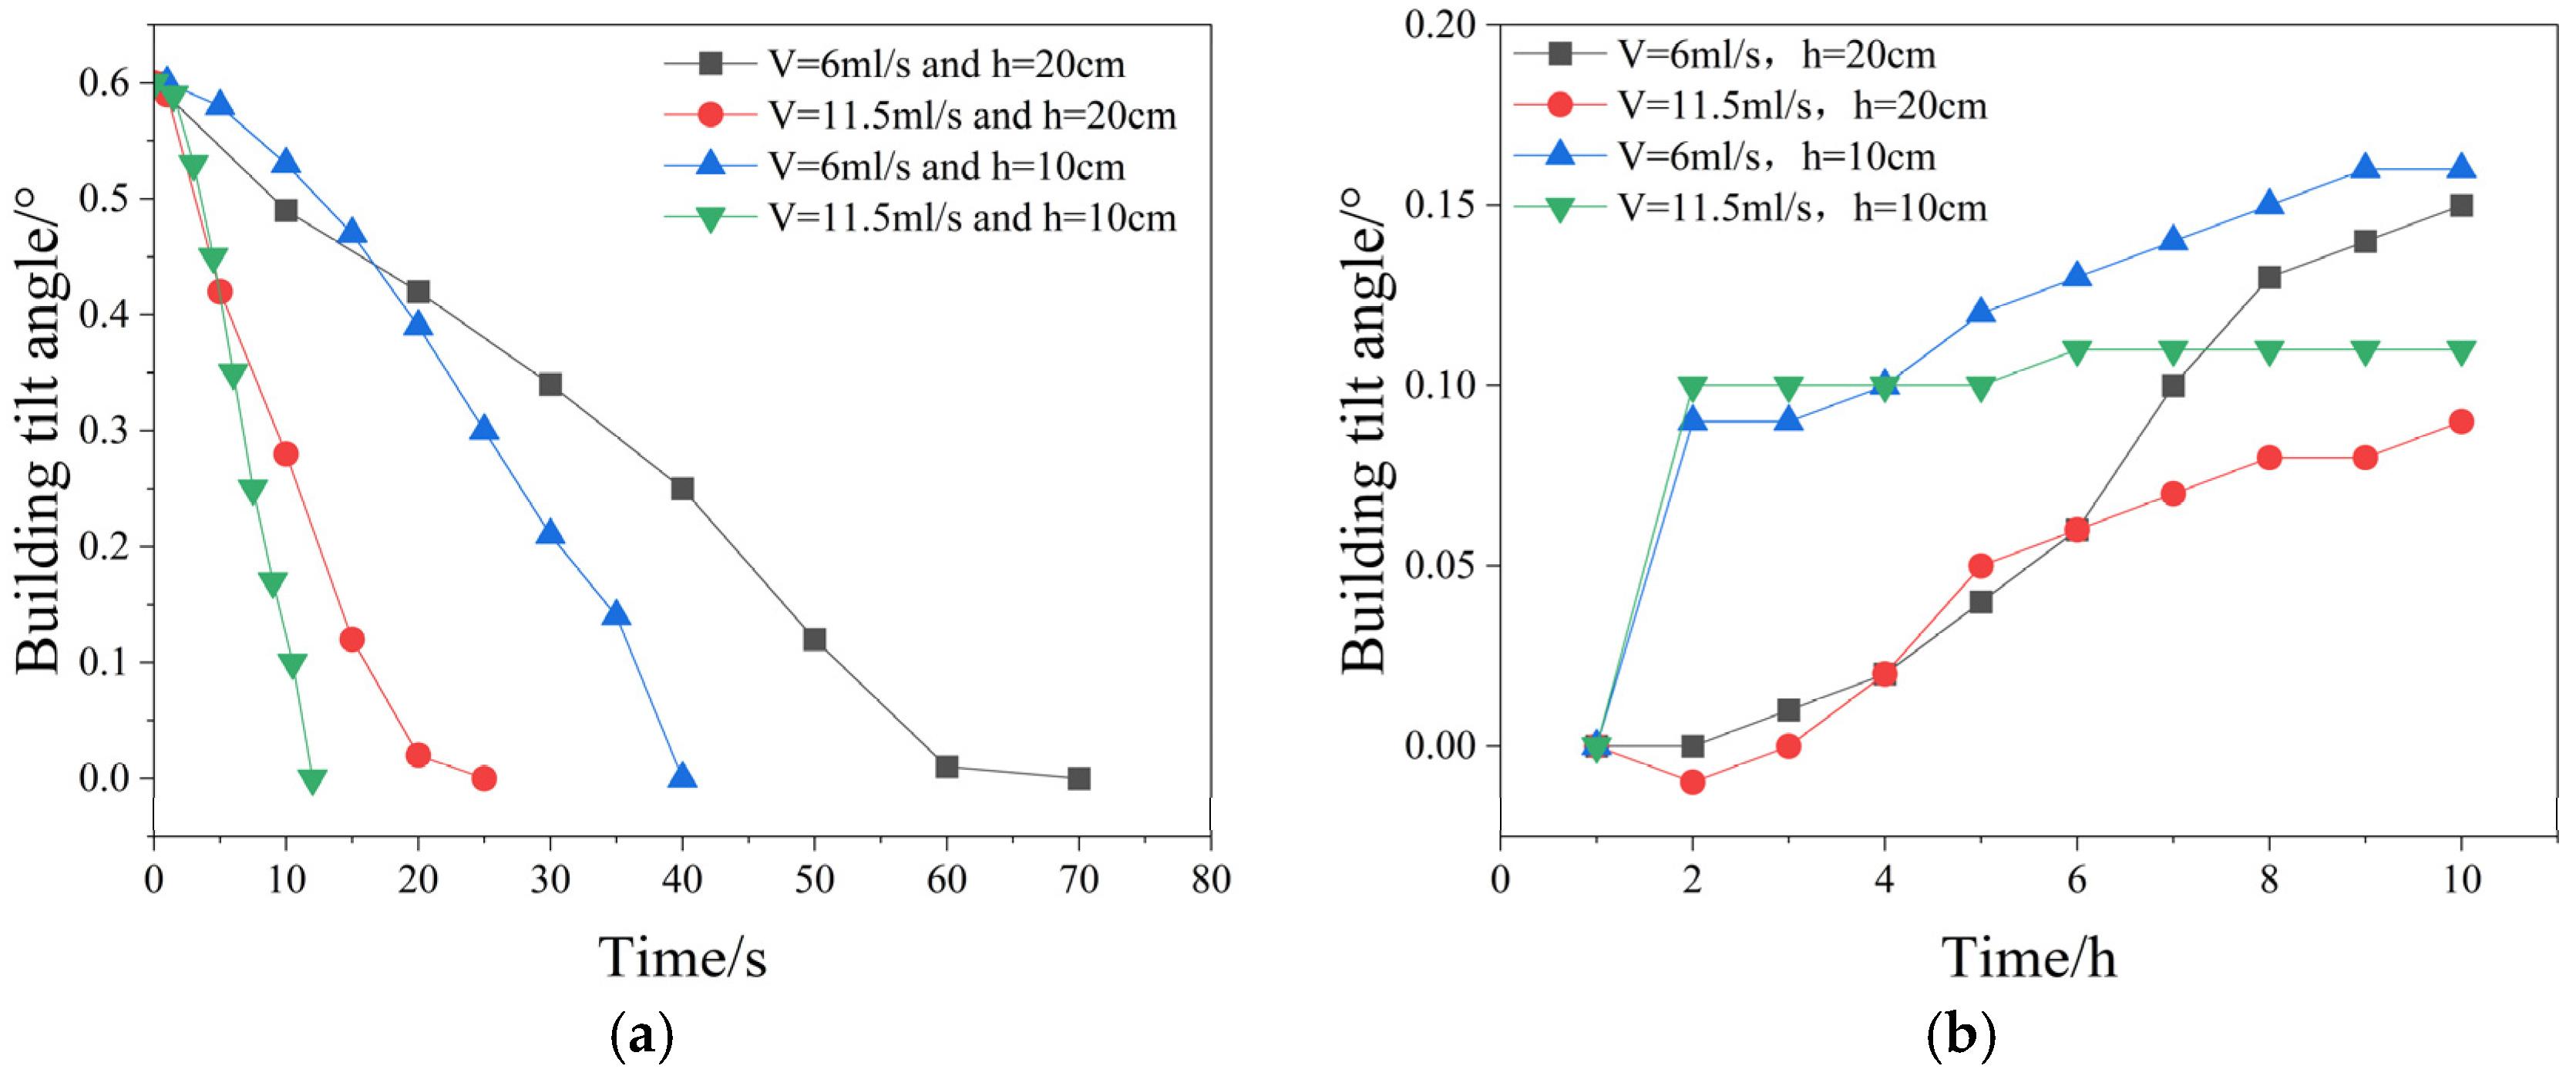
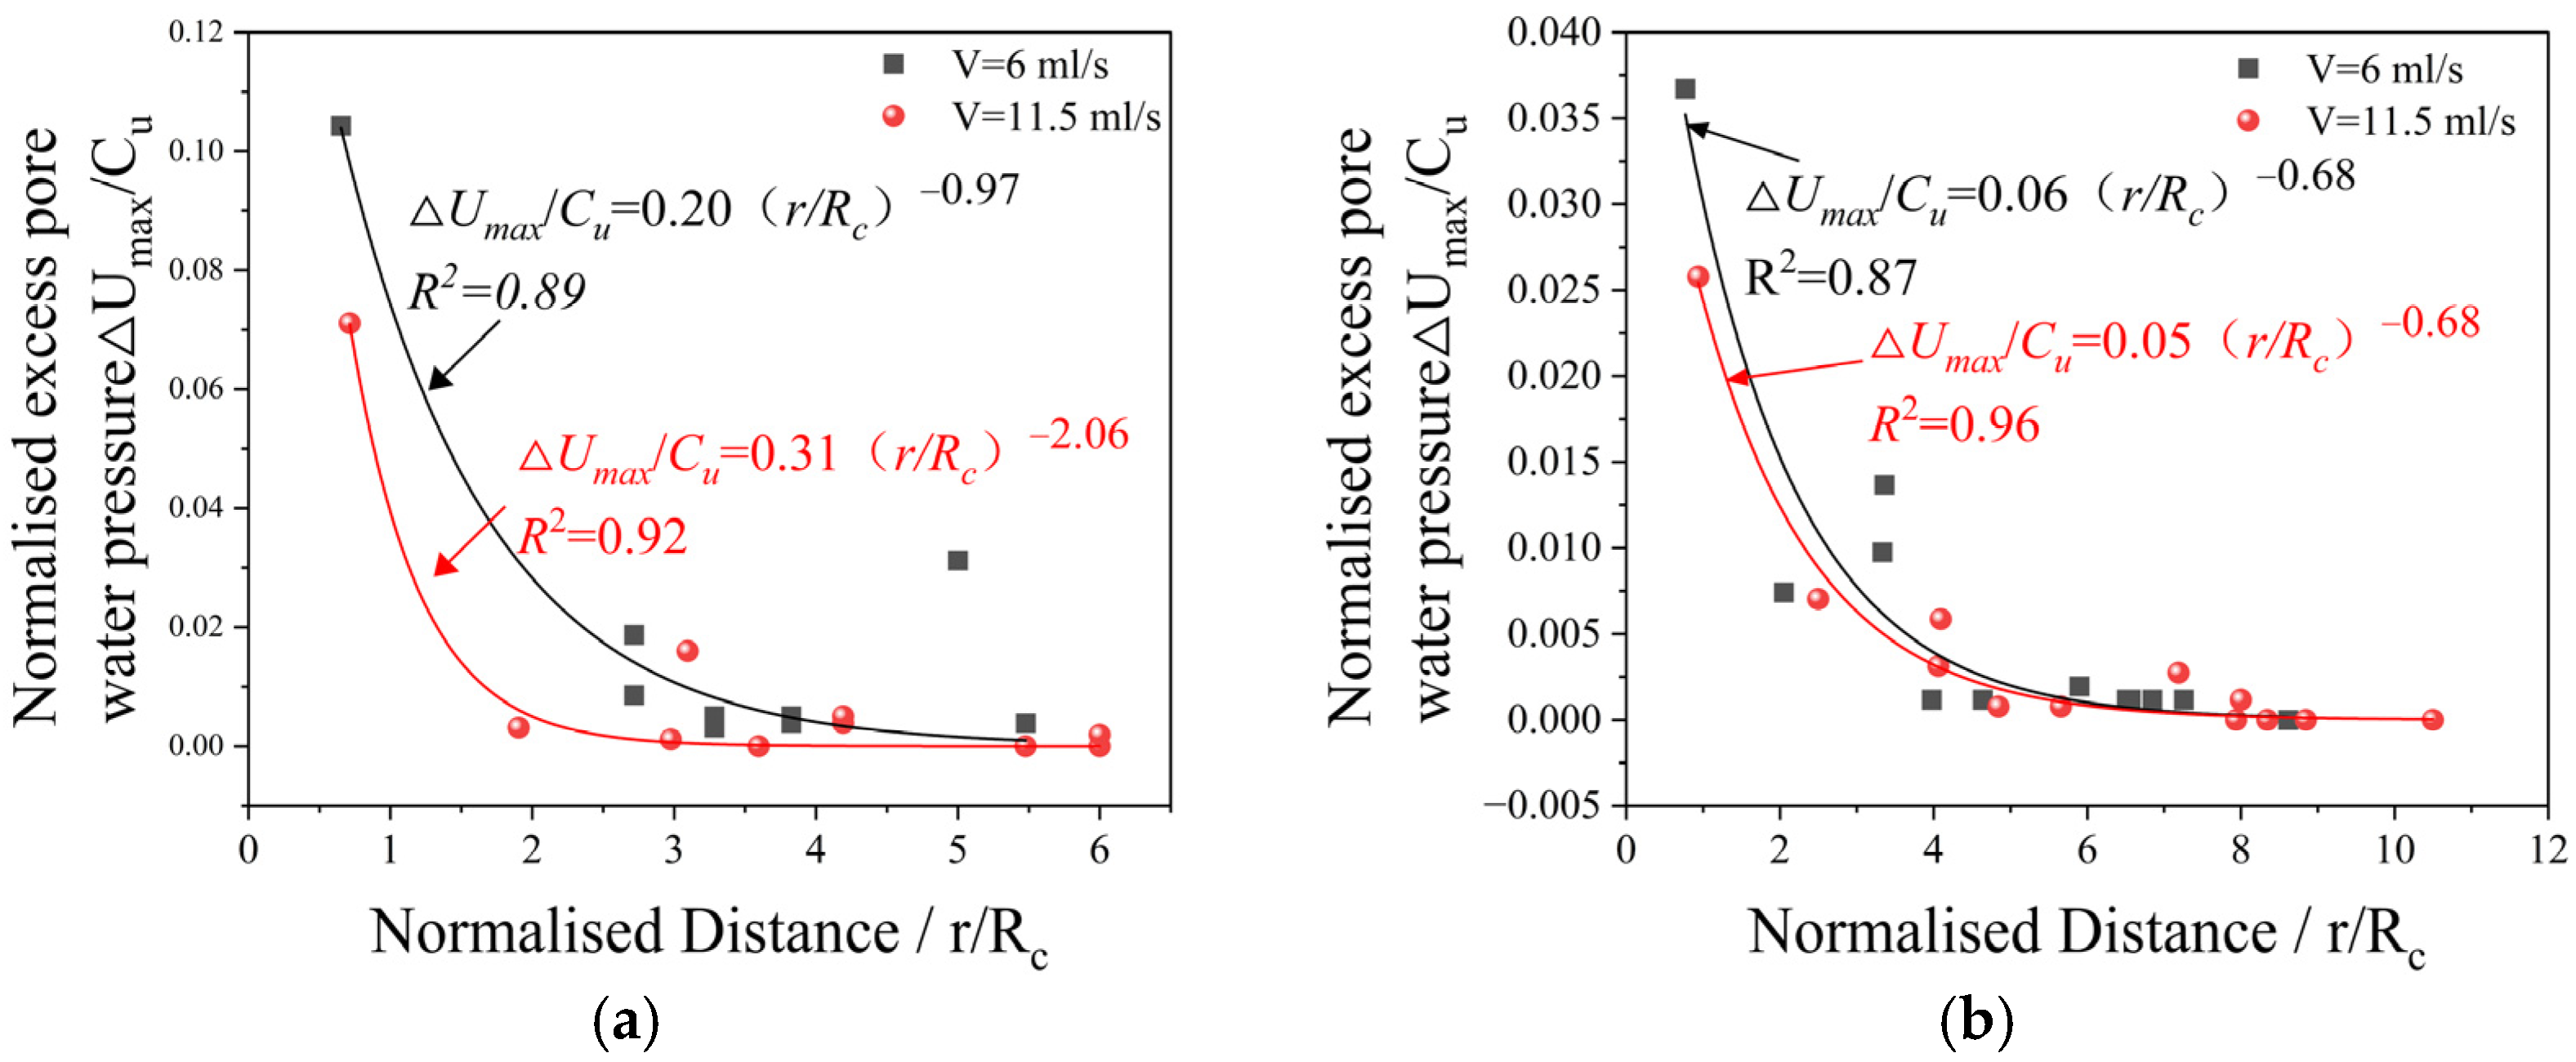
  • The magnitude of excess pore water pressure generated by grouting decreases with increasing distance from the grouting center, following a power function. Within a range of 2Rc, the excess pore water pressure attenuates most rapidly. The dissipation of excess pore water pressure over time conforms to an exponential function. The dissipation of excess pore water pressure leads to reduced grouting efficiency and partial recovery of the building’s tilt angle.
  • The grouting rate has a greater impact on grouting efficiency and foundation-additional pressure than the grouting depth. The grouting volume is positively correlated with grouting depth but negatively correlated with grouting rate. Regardless of grouting depth, grouting pressure consistently increases with higher injection rates.
This study focused on the variations in excess pore water pressure, ground surface displacement, grouting volume, and foundation-additional pressure during compaction grouting-induced uplift rectification in saturated silty clay. Due to limitations inherent in laboratory-scale model tests, further research involving field trials, large-scale simulations, and experiments on various foundation types (e.g., isolated or strip foundations) is required to validate the findings and enhance their practical applicability.

Author Contributions

Conceptualization, T.C., Y.S. and F.H.; methodology, T.C., Y.S. and F.H.; data curation, T.C., Y.S. and F.H.; writing—original draft preparation, T.C., Y.S. and F.H.; writing—review and editing, T.C. and Y.S. All authors have read and agreed to the published version of the manuscript.

Funding

This research received no external funding.

Data Availability Statement

The original contributions presented in this study are included in the article. Further inquiries can be directed to the corresponding author.

Conflicts of Interest

Author Tengyue Cui was employed by the company Beijing Hengxiang Hongye Foundation Reinforcement Technology Co., Ltd. The remaining authors declare that the research was conducted in the absence of any commercial or financial relationships that could be construed as a potential conflict of interest.

Abbreviations

The following abbreviations are used in this manuscript:
P g Grouting pressure
P a Grouting pressure in case of cone breakage
r radius of a bubble
θ The angle between the damaged surface and the horizontal plane
V The volume above the grouting body resembles an inverted round table.
T The upward force exerted by the pulp bubble
W Self-weight of the cone above the pulp bubble
F Shear resistance on conical surfaces
γ The soil gravity
C u The undrained shear strength of the soil mass
S The lateral area of the inverted circular table above the grout body
HGrouting depth
σzThe total additional stress
ρMass density
ωWater content
ePore ratio
ωLLiquid limit
ωpPlastic limit
IPPlasticity index
EsCompression modulus
CcCohesion
φThe angle of internal friction
KCoefficient of permeability
hThe grouting depth
VThe grouting rate
ηThe grouting efficiency
H c The surface displacement after excess pore water pressure dissipation
H g The surface displacement after grouting
α The significant level
U m a x The maximum excess pore water pressure
α , β Fitting coefficients
r The distance between the grouting hole center and the pore pressure gauge
R c The radius of the grout bulb formed in the soil
R 2Coefficient of determination
T g A function of the normalized time factor
σ c The enclosing pressure
t Time
κ The expansion index of the clay in the Cambridge model
γ w The heaviness of the water
r 1 The distance between the calculation point and the grouting hole
U The excess pore water pressure in the soil in the dissipation process
U 0 The excess pore water pressure in the soil after grouting

References

  1. Heping, Y. Research of Treatment for Inclinationof Building on Soft Soil Foundation. Master’s Thesis, China University of Geosciences, Beijing, China, 2008. [Google Scholar]
  2. Vesić, A.S.; Clough, G.W. Behavior of granular materials under high stresses. J. Soil Mech. 1968, 94, 661–688. [Google Scholar] [CrossRef]
  3. Sagaseta, C. Analysis of undrained soil deformation due to ground loss. Geotechnique 1987, 37, 301–320. [Google Scholar] [CrossRef]
  4. El-Kelesh, A.M.; Mossaad, M.E.; Basha, I.M. Model of compaction grouting. J. Geotech. Geoenviron. Eng. 2001, 127, 955–964. [Google Scholar] [CrossRef]
  5. Kummerer, C.; Gollegger, J.; Schweiger, H.; Conzales, C.; Sagaseta, C. Numerical and analytical studies of the effects of compensation grouting. In Proceedings of the NUMOG VIII, Rome, Italy, 10–12 April 2002; pp. 379–384. [Google Scholar] [CrossRef]
  6. Ni, J.C.; Cheng, W.-c. Using fracture grouting to lift structures in clayey sand. J. Zhejiang Univ.-Sci. A 2010, 11, 879–886. [Google Scholar] [CrossRef]
  7. Ni James, C.; Cheng, W.-C. Monitoring and Modeling Grout Efficiency of Lifting Structure in Soft Clay. Int. J. Geomech. 2010, 10, 223–229. [Google Scholar] [CrossRef]
  8. Tang, Z.; Zhao, C.; Zhang, D. Design of displacement grouting and prediction of the effect for construction of underground structures. Tumu Gongcheng Xuebao (China Civ. Eng. J.) 2007, 40, 79–84. [Google Scholar] [CrossRef]
  9. Tang, Z.-W.; Zhao, C.-G. Mechanisms of ground heave by grouting and analytical solutions & numerical modeling. Rock Soil Mech. 2008, 29, 1512–1516. [Google Scholar]
  10. Basu, P.; Madhav, M.; Prezzi, M. Estimation of heave due to inclined compaction grouting. In Advances in Ground Improvement: Research to Practice in the United States and China; The American Society of Civil Engineers: Orlando, FL, USA, 2009; pp. 234–241. [Google Scholar]
  11. Guo, F.; Liu, X.; Tong, W.; Shan, Z. Prediction of ground surface displacement caused by grouting. J. Cent. S. Univ. 2015, 22, 3564–3570. [Google Scholar] [CrossRef]
  12. Zhang, M.; Wang, X.-h.; Wang, Y. Mechanism of grout bulb expansion and its effect on ground uplifting. J. Cent. S. Univ. Technol. 2011, 18, 874–880. [Google Scholar] [CrossRef]
  13. Fu, Y.; Chen, X.; Wu, P. Analysis on Mechanism of Longitudinal Grouting Uplift of Existing Metro Tunnel. Mod. Tunn. Technol. 2020, 57, 184–192. [Google Scholar] [CrossRef]
  14. Zhang, S.; Liu, R.; Li, S.; Zhang, L.; Jiang, P. Experimental Study on Ground Surface Heave Affected by Grouting in Sandy Soil Layer. Chin. J. Undergr. Space Eng. 2018, 14, 1097–1104. [Google Scholar]
  15. Cui, X. Analysis of the influence of the top load on the lifting effect of compact grouting. Energy Rep. 2024, 12, 5473–5481. [Google Scholar] [CrossRef]
  16. Dai, X.; Huang, F.; Wang, G.; Cui, T.; Cui, X.; Guo, F. Displacement prediction of inclined existing buildings with a raft foundation restored by compaction grouting in clay. J. Build. Eng. 2024, 91. [Google Scholar] [CrossRef]
  17. Wang, Y.; Wang, X.H.; Zhang, M.J.A.M.R. Research on mechanisms and ground uplifting effects by grouting taken the grouting-soil-building interaction into account. Adv. Mater. Res. 2011, 163, 3488–3498. [Google Scholar] [CrossRef]
  18. Cheng, W.; Ni, J.C.; Hwang, H. Jacking tilted building by automatic multiple grouting. In Characterization, Modeling, and Evaluation of Geotechnical Engineering Systems; ASCE: Orlando, FL, USA, 2014; pp. 50–57. [Google Scholar]
  19. Cui, X. Nondestructive controllable grouting: A novel method to correct deviation of building foundation. Adv. Civ. Eng. 2023, 2023, 1835403. [Google Scholar] [CrossRef]
  20. Jafari, M.; Au, S.; Soga, K.; Bolton, M.; Karim, U.; Komiya, K. Experimental and numerical investigation of compensation grouting in clay. In Proceedings of the ISRM International Symposium, Melbourne, Australia, 19 November 2000; p. ISRM–IS-2000-2327. [Google Scholar]
  21. Soga, K.; Au, S.K.A.; Jafari, M.R.; Bolton, M.D. Laboratory investigation of multiple grout injections into clay. Géotechnique 2004, 54, 81–90. [Google Scholar] [CrossRef]
  22. Au, S.K.A.; Soga, K.; Jafari, M.R.; Bolton, M.D.; Komiya, K. Factors Affecting Long-Term Efficiency of Compensation Grouting in Clays. J. Geotech. Geoenviron. Eng. 2003, 129, 254–262. [Google Scholar] [CrossRef]
  23. Soga, K.; Bolton, M.D.; Au, S.K.A.; Komiya, K.; Hamelin, J.P.; Cotthem, A.V.; Buchet, G.; Michel, J.P. Development of compensation grouting modelling and control system. In Proceedings of the Geotechnical Aspects of Underground Construction in Soft Ground, Tokyo, Japan, 19–21 July 1999; pp. 425–430. [Google Scholar]
  24. Cheong, M.; Soga, K. Influence of underground excavation on compensation grouting in clays; Small-scale laboratory experiments. In Proceedings of the Geotechnical Aspects of Underground Construction in Soft Ground: Proceedings of the 5th International Symposium TC28, Amsterdam, The Netherlands, 15–17 June 2005; p. 369. [Google Scholar]
  25. Zheng, G.; Zhang, X.; Diao, Y.; Lei, H.J.G. Engineering. Experimental study on the performance of compensation grouting in structured soil. Geomech. Eng. 2016, 10, 335–355. [Google Scholar] [CrossRef]
  26. Zheng, G.; Zhang, X.; Diao, Y.; Lei, H. Experimental study on grouting in underconsolidated soil to control excessive settlement. Nat. Hazards 2016, 83, 1683–1701. [Google Scholar] [CrossRef]
  27. Li, M.; Zhang, X.; Li, S.; Zhang, Q.; Zuo, J.; Lan, X. Grouting lifting numerical methods based on numerical simulation and model experiment. J. Harbin Inst. Technol. 2019, 51, 159–166. [Google Scholar] [CrossRef]
  28. Cheng, X.; Zhao, L.; Pan, J.; Zheng, G.; Jia, J.; Jiao, Y. Research on Deformation Laws of Soil Caused by Grouting and Grouting Efficiency. Ind. Constr. 2023, 53, 171–179. [Google Scholar] [CrossRef]
  29. Graf Edward, D. Compaction Grouting Technique and Observations. J. Soil Mech. Found. Div. 1969, 95, 1151–1158. [Google Scholar] [CrossRef]
  30. Zheng, G.; Ruozhan, W.; Cheng, X. In situ test study of influence of grouting on horizontal deformation of adjacent soil. J. Tianjin Univ. 2019, 52, 959–968. [Google Scholar] [CrossRef]
  31. Graf, E.D. Compaction grout. In Grouting, Soil Improvement and Geosynthetics; ASCE: Orlando, FL, USA, 1992; pp. 275–287. [Google Scholar]
  32. Wang, Z.; Shen, S.; Ho, C.; Kim, Y. Investigation of field-installation effects of horizontal twin-jet grouting in Shanghai soft soil deposits. Can. Geotech. J. 2013, 50, 288–297. [Google Scholar] [CrossRef]
  33. Wu, H.; Zhang, P.; Chen, R.; Lin, X.; Liu, Y. Ground Response to Horizontal Spoil Discharge Jet Grouting with Impacts on the Existing Tunnels. J. Geotech. Geoenvironmental Eng. 2020, 146. [Google Scholar] [CrossRef]
  34. Guo, J.; Zheng, G.; Zhao, L.; Pan, J.; Zhang, Z.; Zhou, Q.; Cheng, X. Experimental study of soil deformation and pore pressure caused by multi-row grouting. Rock Soil Mech. 2023, 44, 896–907. [Google Scholar]
Figure 1. Stress analysis of compact grouting.
Buildings 15 01415 g001
Figure 2. Deformation patterns of soils.
Buildings 15 01415 g002
Figure 3. Particle distribution curve.
Buildings 15 01415 g003
Figure 4. Grouting experimental system. (a) Schematic diagram of grouting lifting experiment; (b) grouting lifting experiment.
Buildings 15 01415 g004
Figure 5. The experimental model box. (a) Schematic diagram of the experimental model box; (b) building and foundation; (c) the actual experimental model box; (d) location diagram of pore-water pressure transducer and soil pressure cell; (e) location diagram of displacement meter.
Buildings 15 01415 g005
Figure 6. Filling flow chart.
Buildings 15 01415 g006
Figure 7. Surface displacement curves after grouting and completion of superstition pore water pressure dissipation in profile A-A. (a) Grouting depth h = 20 cm; (b) grouting depth h = 10 cm.
Buildings 15 01415 g007
Figure 8. Surface displacement map after grouting: (a) V = 6 mL/s and h = 20 cm; (b) V = 11.5 mL/s and h = 20 cm; (c) V = 6 mL/s and h = 10 cm; (d) V = 6 mL/s and h = 10 cm.
Buildings 15 01415 g008
Figure 9. Maximum and average surface uplift displacements. (a) Maximum lift displacement and average lift displacement at 20 cm grouting depth; (b) maximum lift displacement and mean lift displacement at 10 cm grouting depth.
Buildings 15 01415 g009
Figure 10. Building tilt angle vs. time variation curve. (a) during grouting; (b) after grouting is complete.
Buildings 15 01415 g010
Figure 11. Spatial distribution of excess pore water pressure in the soil after grouting. (a) V = 6 mL/s and h = 20 cm; (b) V = 11.5 mL/s and h = 20 cm; (c) V = 6 mL/s and h = 10 cm; (d) V = 6 mL/s and h = 10 cm.
Buildings 15 01415 g011
Figure 12. Relationship between normalized excess pore water pressure and normalized distance. (a) Grouting depth h = 20 cm; (b) grouting depth h = 10 cm.
Buildings 15 01415 g012
Figure 13. Variation curve of excess pore water pressure dissipation with time after grouting completion. (a) V = 6 mL/s and h = 20 cm; (b) V = 11.5 mL/s and h = 20 cm; (c) V= 6 mL/s and h = 10 cm; (d) V = 6 mL/s and h = 10 cm.
Buildings 15 01415 g013
Figure 14. Excess pore water pressure retention versus normalized time factor. (a) Grouting depth h = 20 cm; (b) grouting depth h = 10 cm.
Buildings 15 01415 g014
Figure 15. Substrate-additional pressure after grouting.
Buildings 15 01415 g015
Figure 16. Grouting volume after grouting.
Buildings 15 01415 g016
Figure 17. Variation curve of grouting pressure with time during the grouting process.
Buildings 15 01415 g017
Table 1. Basic physicomechanical properties of remolded saturated silty clays.
Title 1 PropertyValue
Mass density ρ (g/cm3)1.75
Water content ω (%)39.86
Pore ratio e (%)0.76
Liquid limit ωL (%)26.61
Plastic limit ωp (%)15.52
Plasticity index IP11.10
Compression modulus Es (MPa)5.62
Cohesion Cc (kPa)25.63
The angle of internal friction φ (°)15.82
Coefficient of permeability K (cm/s)2.34 × 10−6
Table 2. Two-way ANOVA results for grouting efficiency.
Source of VariationDegrees of FreedomF-Valuep-ValueSignificance (α = 0.05)
Grouting depth (h)13.500.098Not significant
Injection rate (V)177.90<0.001Significant
Interaction (h × V)12.150.180Not significant
Table 3. Two-way ANOVA results for maximum surface displacement.
Source of VariationDegrees of FreedomF-Valuep-ValueSignificance (α = 0.05)
Grouting depth (h)14.120.068Not significant
Injection rate (V)119.15<0.001Significant
Interaction (h × V)11.090.317Not significant
Table 4. Two-way ANOVA results for additional base pressure.
Source of VariationDegrees of FreedomF-Valuep-ValueSignificance (α = 0.05)
Grouting depth (h)127.45<0.001significant
Injection rate (V)13.120.105Not Significant
Interaction (h × V)11.280.284Not significant
Disclaimer/Publisher’s Note: The statements, opinions and data contained in all publications are solely those of the individual author(s) and contributor(s) and not of MDPI and/or the editor(s). MDPI and/or the editor(s) disclaim responsibility for any injury to people or property resulting from any ideas, methods, instructions or products referred to in the content.

