Article

Shear Strength of Concrete Incorporating Recycled Optimized Concrete and Glass Waste Aggregates as Sustainable Construction Materials

1
Civil Engineering Department, Kafrelsheikh University, Kafr El-Sheikh 6860404, Egypt
2
Department of Engineering and Technology, East Texas A&M University, Commerce, TX 75429, USA
3
Civil and Environmental Engineering, University of Missouri, Columbia, MO 65211, USA
4
Department of Civil Engineering, College of Engineering and Architecture, Umm Al-Qura University, Makkah 24382, Saudi Arabia
*
Author to whom correspondence should be addressed.
Buildings 2025, 15(9), 1420; https://doi.org/10.3390/buildings15091420
Submission received: 25 March 2025 / Revised: 17 April 2025 / Accepted: 21 April 2025 / Published: 23 April 2025
(This article belongs to the Special Issue Advances and Applications of Recycled Concrete in Green Building)

Abstract

:
While the development of sustainable construction materials, such as green concrete made from glass waste or recycled concrete aggregate, has been extensively researched, much of the existing work has focused narrowly on these two components. This limited scope highlights the need for further investigation to comprehensively address their drawbacks and expand the available knowledge base. Moreover, the current study uniquely emphasizes the shear response of green concrete, a critical aspect that has not been previously explored. Push-off shear samples made of green concrete, a mixture of recycled concrete, and glass waste, were built and subjected to direct shear loading testing to investigate shear response. In different proportions (0, 10, 25, 50, and 100%), fine glass aggregate is used in place of river sand. At different ratios (0, 10, 20, and 40%), coarse glass aggregate was substituted for coarse natural aggregate to form four mixtures. Additionally, recycled concrete and coarse glass aggregates were utilized instead of coarse natural aggregates. In the last group, coarse natural aggregate was substituted with recycled concrete aggregates in different proportions (0, 16, 40, and 80%). Measurements were made of the applied shear force and the sliding of the shear transfer plane during the test. The tested mixtures’ failure, shear strength, shear slip, shear stiffness, and shear stress slip correlations were examined. According to the results, all of the samples failed in the shear transfer plane. The shear strength of mixes containing 10, 25, 50, and 100% fine glass was, respectively, 12.8%, 14.7%, 29.5%, and 39% lower than the control combination without fine glass. As the amount of recycled glass and concrete materials grew, so did the shear slip at the shear transfer plane. In recent years, numerous studies have proposed formulas to predict the push-off shear strength of plain concrete, primarily using compressive strength as the key parameter—often without accounting for the influence of infill materials. The present study introduces an improved predictive model that incorporates the contents of recycled concrete aggregate, coarse glass aggregate, or fine glass aggregate as correction factors to enhance accuracy.

1. Introduction

Given that the construction sector generates 30% of all trash and more than 33% of carbon emissions worldwide, it is imperative that the detrimental effects of waste generation on the environment and the economy be addressed [1,2]. Effective waste management and landfill volume reduction are key components of sustainable development. To solve environmental issues and advance sustainable development, construction and demolition waste—such as recycled glass and concrete aggregate—can be integrated into civil engineering uses. The rising problem of effective glass recycling in nations that develop may be resolved by using discarded glass as a natural aggregate alternative in concrete. According to Tan and Du [3], glass recycling is less common in developing nations than it is for other solid waste materials, and research by Afshinnia et al. [4] showed that even though efforts to recycle glass waste have increased recently, over 50% of the collected waste glass in some parts of the world is still dumped in landfills. According to Chesner et al. [5], a significant amount of garbage of comparatively low standard could be used as building construction materials. Numerous studies have indicated that the manufacture of concrete can efficiently handle waste materials such as fly ash, glass bottles, building and demolition trash, and rice husk [6,7]. Waste glass can be utilized as an alternative to conventional concrete aggregate, according to previous research [8,9]. According to Shayan and Xu [10], glass particles may replace up to 30% of the cement or aggregate in concrete without having any consequences in the future.
On the other hand, for the building sector to grow sustainably, concrete debris must be recycled. The viability of recycling concrete waste has been the subject of much investigation by several scientists. According to the investigations, it is widely accepted that concrete with recycled aggregate (R) has worse qualities than concrete with natural aggregate. Concrete’s functionality [11], weight [12], porosity [13], hardness [14], and elastic modulus [15] all drop when the R substitution rate rises. Additionally, bleed [16], drying shrinkage [17], and creep deforming [18,19] all increase. The existence of adhering mortar in R is responsible for these modifications in the characteristics of the concrete [20,21,22]. As a result, ongoing efforts have been undertaken to raise the recycled aggregate concrete’s quality. Therefore, the primary goal of this project is to experiment with using recycled concrete aggregate in concrete rather than natural aggregates. Many practical studies [23,24] have been conducted on the use of recycled concrete and other waste (recycled plastic fibers) within concrete manufacturing. These studies achieved good results on the behavior of structural elements such as columns and concrete beams. Some properties of concrete were also enhanced with these materials, such as compressive, tensile and cohesion properties.
Most previous studies have focused on the behavior of concrete in compression and tension, but studies related to shear property are very rare, so this is the subject of this research. Strength of compression, size of aggregate, weight of the concrete, component dimensions, loading circumstances, internal crack trends, and aggregate interlock are some of the variables that affect plain concrete’s shear resistance. In order to guarantee the dependability of concrete buildings, contemporary structural design regulations and standards progressively recognize the impact of each of these parameters on the concrete’s resistance to shear stresses. The size impact on shear strength, which describes the observed decrease in shear strength as concrete element size grows, is one of these and a basic factor in the design of structures. This issue is particularly significant for big structural elements, such beams and slabs, where shear strength does not scale proportionately with size, as demonstrated by empirical data and experimental research [25]. This disparity can be explained by the fact that bigger specimens are more likely to have discontinuities or material flaws that compromise the whole framework [26].
In plain concrete systems, aggregate interlock naturally facilitates load transfer across discontinuities such as cracks, primarily through shear action. The shear strength of concrete is largely influenced by the size of both the aggregates and the structural elements. Aggregate size plays a critical role in affecting crack propagation, interfacial bond strength, and overall durability of concrete elements. Larger aggregates can enhance shear resistance by improving frictional interlock along fracture surfaces. However, excessively large aggregates may disrupt the continuity of the cement matrix and localize stress around the coarse particles, potentially creating weak zones. Research highlights that selecting the optimal aggregate size is essential for maximizing shear strength, with the ideal size depending on the structural application and specific concrete mix design.
Concrete components’ longevity, fracture propagation, and interfacial bond strength are all impacted by aggregate size [27,28,29]. Through improved frictional resistance, larger aggregates frequently increase resistance to shear pressures by improving interlock at fracture surfaces. Aggregates that are excessively big, however, have the potential to break up the continuity of the cement paste and concentrate stress around bigger particles, which might result in weaker areas within the concrete matrix [30,31]. According to studies, choosing the right aggregate size is crucial for maximizing shear strength; the appropriate size varies according on the intended structural use and the design of the concrete mix [29,32,33]. To increase concrete’s longevity and maximize its use in constructions where strong shear resistance is essential, it is essential to comprehend how aggregate size affects shear strength. Investigators may mimic and evaluate shear transfer processes across defined planes, including building connections, precast-to-cast interactions, cracks, and surfaces with different levels of imperfections, by using push-off tests, which are frequently used to study the behavior of shear-transfer layers within concrete buildings [34,35,36].
Focusing on structural applications and the specific opportunities and challenges in Southeast Asia, Neupane et al. [37] present a comprehensive review of the use of recycled concrete aggregate (RCA) and recycled aggregate concrete (RAC) in construction projects. Previous studies indicate that RAC exhibits mechanical and physical limitations, with compressive strengths typically 10% to 20% lower than those of natural aggregate concrete (NAC). At the structural level, elements constructed with RAC demonstrate reductions of up to 15% in axial, bond, shear, and flexural strengths compared to their NAC counterparts.
This investigation focuses on the push-off shear behavior of green concrete samples, addressing the current gap in research concerning the combined effects of recycled concrete and glass waste on shear properties. To examine shear response, the glass waste and recycled concrete mixes were constructed and put through direct shear loading testing. River sand was substituted with fine glass aggregate in varying amounts (0, 10, 25, 50, and 100%). Four combinations were created by substituting coarse glass aggregate for coarse natural aggregate in varying percentages (0, 10, 20, and 40%). Furthermore, coarse natural aggregate was substituted with recycled concrete aggregate and coarse glass aggregate. Additionally, recycled concrete aggregates were used in varying amounts to replace coarse natural aggregate (0, 16, 40, and 80%).

2. Problem Statement

Although the idea of creating green concrete from glass waste or/and aggregate reused old concrete has been extensively studied, much of it has focused on these two elements separately. Few studies have combined glass trash with recycled concrete aggregate to create green concrete; further research is needed to complete drawbacks and then induce information. Previous studies on green concrete composites incorporating various aggregates have primarily focused on compressive and tensile properties. The present research expands this understanding by investigating the shear behavior of green concrete—an area that has received limited attention. By addressing this gap, the study contributes to a more comprehensive understanding of green concrete’s performance, particularly in structural applications where shear properties play a crucial role in the integrity and behavior of concrete elements. The shear response of green concrete—which has never been examined before—made of recycled glass and recycled concrete particles is the main focus of this investigation. The research’s aim is to use recycled fine glass as a substitute for all or some of the fine natural aggregate. Additionally, coarse recycled glass aggregate was used instead of coarse natural material. Additionally, the coarse natural material was replaced with a mixture of used concrete aggregate and reclaimed rough glass aggregate. Combining both types of aggregate is crucial to mitigating environmental risks, avoiding pollution and disposing of massive amounts of rubble. It also creates a surplus of natural aggregate, especially since some countries lack natural aggregate and import it from abroad.

3. Experimental Work

3.1. Materials Used

The mixes’ constituents include both fine and coarse aggregates, water combined with superplasticizer, and cement. Sand from rivers in the form of natural aggregate and fine recycled glass (F) were used to create fine aggregates, with coarse natural aggregate, recycled concrete aggregate (R), and coarser recycled glass (C) serving as coarse aggregates. Ordinary Portland cement was used. The specific weight of it was 3.14. To increase the functionality of the fresh concrete, a superplasticizer weighing 0.50% of the cement used was added. As shown in Table 1, aggregate materials underwent sieve analysis trials in line with Egyptian code [38]. Table 2 also contains a summary of the materials’ properties.
Basalt aggregates with particle sizes smaller than 12 mm are the coarse natural aggregates (CN) used in the present study. Recycled concrete aggregate (R) used in this study was obtained from previously tested concrete beams. These beams were tested in the concrete laboratory at the Faculty of Engineering, Kafrelshiekh University, Egypt. The original concrete had a compressive strength of 30 MPa and was produced using basalt as the coarse natural aggregate.
The method of manufacturing R comprised several phases, including breaking down concrete specimens into small pieces, then crushing the gemstones to the required particle size with an electric crusher, and finally sieving. The Rs were carefully cleaned with water before the aggregates were left to dry. The recovered glass aggregates in the present research were derived from clear sheet glass trash, which might be fine (F) or coarse (C) shapes. The resulting sheets had a median depth ranging from 7 to 9 mm, although their lengths varied and were not uniform. Crushing equipment is utilized to reduce glass sheets to small fragments. When the machine finished, sieves were used to separate the fine and coarse aggregates. Granules larger than 12 mm were eliminated. A 4.75 mm sieve was used to separate the aggregates of fine and coarse recycled glass. The F particles passed through a 4.75 mm filter, and the C particles were contained inside it.

3.2. Mixtures Planning

The current investigation included four groups of concrete mixes (A, B, C, and D). The cement and water content were the same in all four groups. Cement and water are injected at rates of 310 and 200 kg/m3, correspondingly. On the contrary, the proportions of aggregates varied in each blend. The selection of aggregate proportions in this study was guided by preliminary testing, which helped establish a suitable mix design. Previous research also influenced the chosen proportions, particularly through varying replacement rates of coarse aggregates. This study aimed to evaluate a comprehensive range of replacement levels, from 0% to 100%, to assess their impact on concrete performance.
In group A, five mixes (F0, F10, F25, F50, and F100) were developed in which F substituted river sand. These included four mixes (F10, F25, F50, and F100) that included F instead of the natural sand, as well as a single reference mixture (F0) that did not. The numbers after the letter “F” indicate the substance of the F. F25, for example, was composed of 25% F and 75% sand. The coarse natural aggregate (CN) made up 100% of the coarse stone in group A.
Sand was utilized as the fine aggregate in the other three groups, B, C, and D, with additional coarse aggregates (CN, C, and R) employed in varying proportions. In group B, four mixtures (C0, C10, C20, and C40) were formed by replacing CN with C. Three mixtures and one reference mixture (C0) with no replacements were created. Mix C20, for example, comprised 20% C and 80% CN. Group C produced four compositions (R0-20, R16-20, R40-20, and R80-20). Each mixture in this category has three distinct kinds of coarse aggregates (20% C, R, and CN). Three mixes with different Rs (16, 40, and 80%) and one reference (R0-20) without R were created. CN and R can be modified from 0% to 100%, while C is set at 20% of the coarse aggregate. The R80-20 blend had 80% R, 0% CN, and 20% C. The R40-20 blend consisted of 40% R, 40% CN, and 20% C. Group D produced four mixes (R0-0, R16-0, R40-0, and R80-0). In this group, R was used instead of CN. This set of mixes contained no coarse recycled glass (C). Three mixes with different replacing percentages (16, 40, and 80%) and one control mix (R0) without R were created. R16-0, for example, had 16% R and 84% CN. To separate out the application of coarse recycled glass (C), both groups C and D were given the same substitution percentage of the aggregate C.

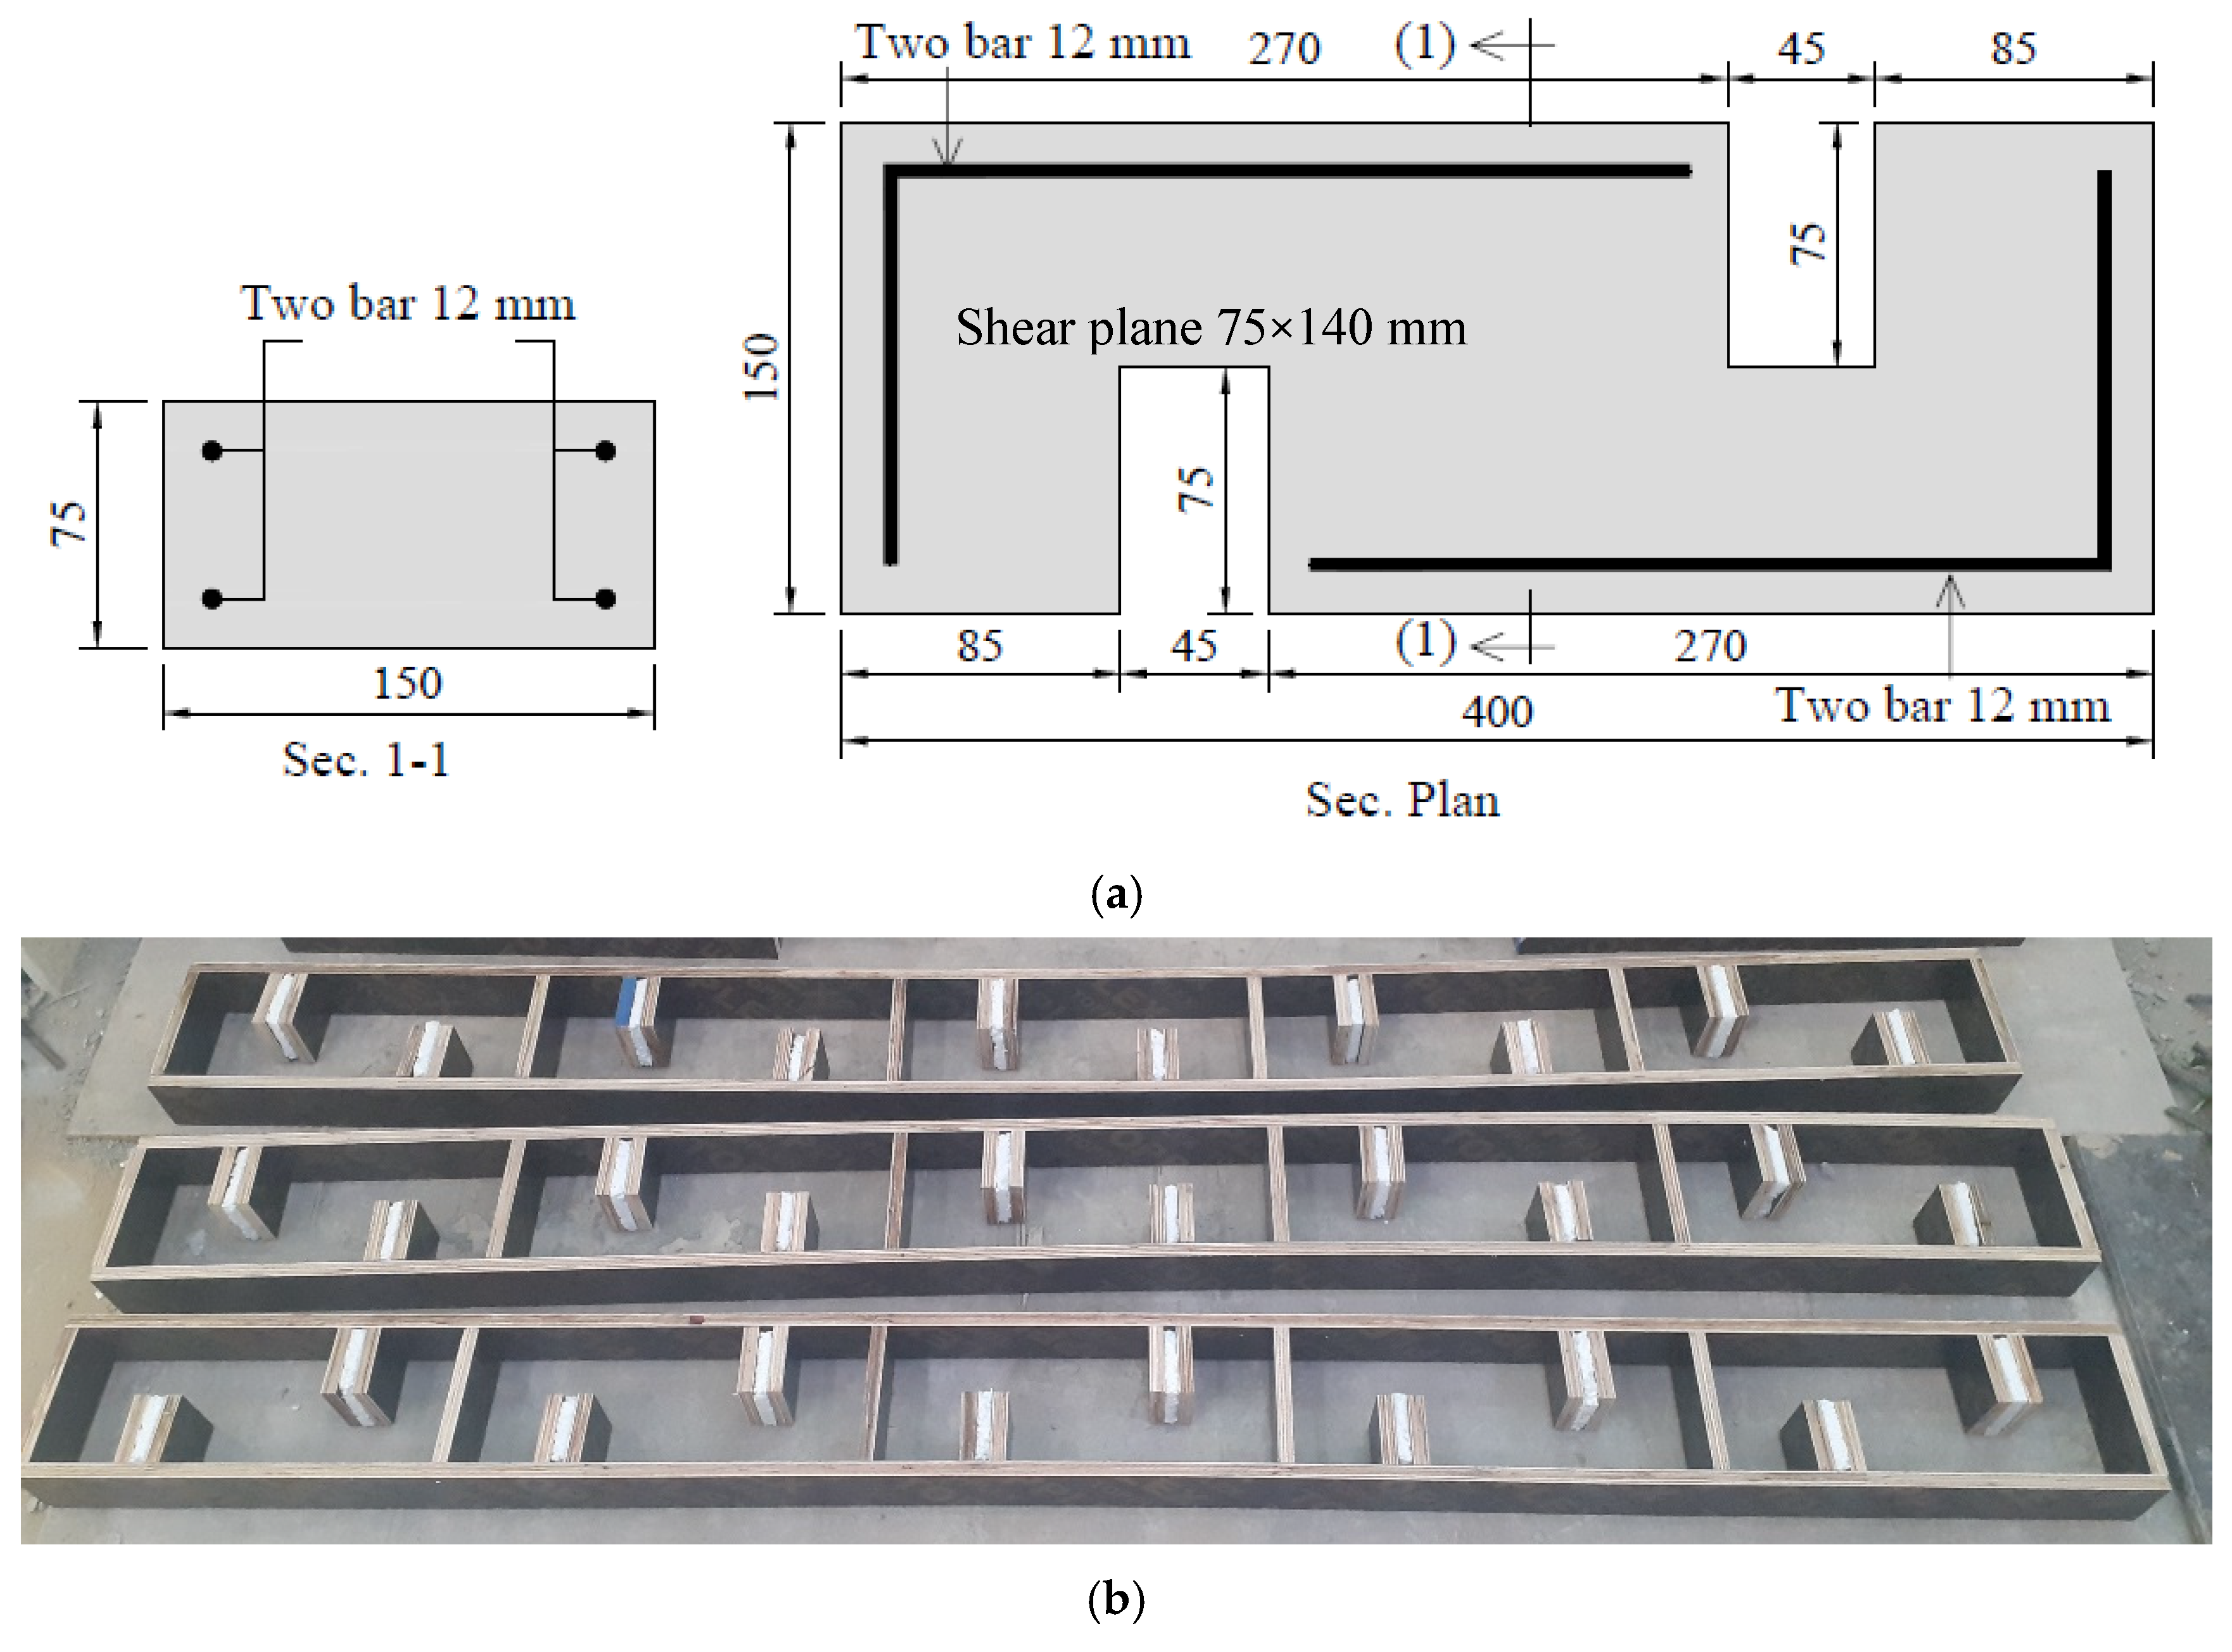
3.3. Shear Specimens

There were 19 examples of push-off shear samples generated. A specimen was obtained from each blend. Each specimen’s section was 150 by 75 mm, its overall length was 400 mm, and the measurement spacing was 140 mm (Figure 1). A number of investigations demonstrated that in order for the breaking plane to extend normally, the sample’s breadth had to be at least five times the maximum size of the aggregate used. As a result, the specimen breadth in the present experiments was 75 mm, more than five times larger than the allowed aggregate size of 12 mm. The samples were stored in timber forms until testing to preserve moisture around the sample and minimize drying. To test the compression resistance of each combination, three 150 mm cubes were made from each of them. Two 12 mm steel bars were placed within the sample to prevent flexure failure. The direct shear was created by push-off specimens. Each specimen was made up of two L-shaped concrete sections joined at the shear plane and internally strengthened with two longitudinal rebars. Push-off shear specimens were selected for this study due to their straightforward design and reliable shear testing capability. Each specimen consisted of two L-shaped concrete segments connected at a defined shear plane and reinforced with longitudinal bars to ensure that failure occurred along the intended plane. The testing setup was designed to secure the specimen firmly and distribute the load evenly across the shear interface. Special attention was given to alignment to prevent eccentric loading, which could compromise the accuracy of the results. The load was applied gradually until failure, allowing for detailed observation and documentation of shear strength and failure mechanisms for further analysis.

3.4. Shear Test

Specimens were tested using monitored compression testing equipment. The setup guaranteed that the sample was securely placed in the apparatus, allowing the stress to be applied equally across the shear plane. Special care was taken to ensure adequate alignment to avoid eccentric loading, which might distort the results. The load was applied progressively until the specimen failed, allowing thorough recording of shear strength and failure processes for future investigation. The vertical compression force was given to the push-off specimen, as shown in Figure 2. A displacement transducer was vertically installed to measure sliding over a 140 mm longitudinal distance at the shear plane. The applied shear force and sliding of the shear plane were measured during the test. To determine shear stress, the shear force was divided by the shear plane area (75 × 140 mm). Additionally, the failure path was noted on the sample face following the test. To accurately capture the shear strength and identify the failure mechanisms for further analysis, the load was applied gradually until specimen failure. A relatively slow loading rate of 3 kN/min was used to ensure precise observation and data collection throughout the test.

4. Results and Analysis

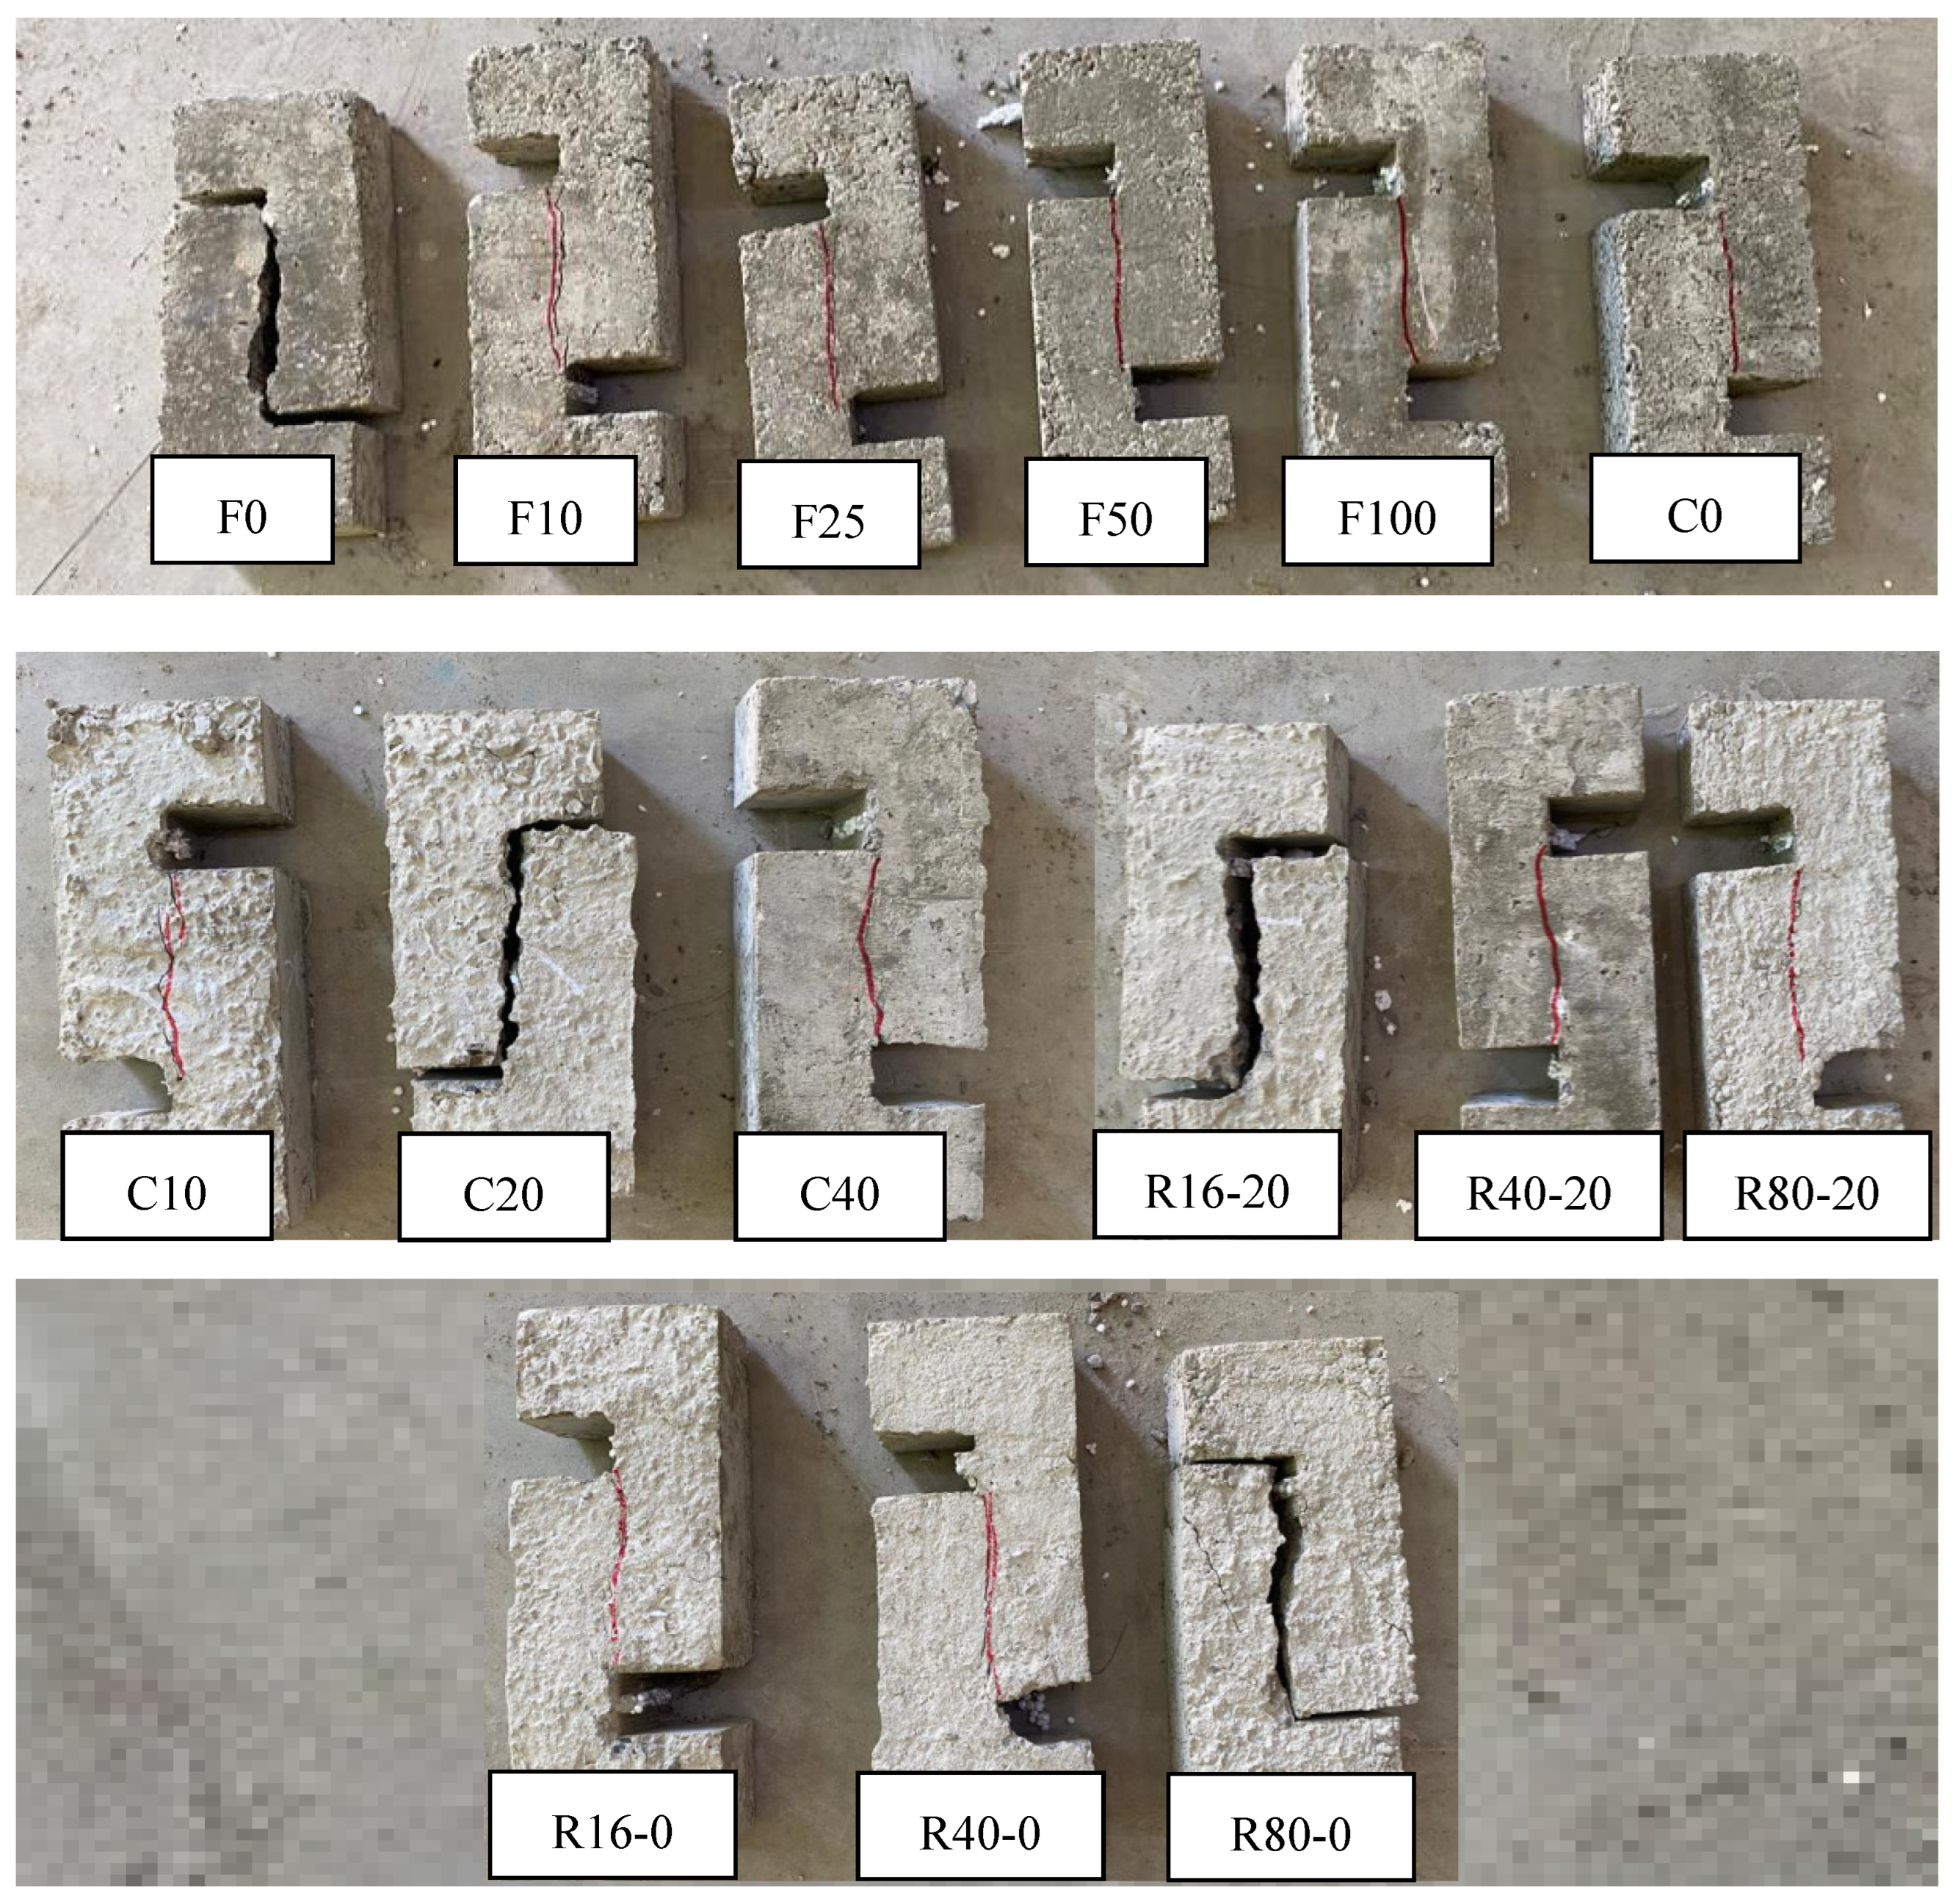
4.1. Modes of Failure

Figure 3 depicts the failure mechanisms of the studied samples across four series. Every sample exhibited the same pattern of failure. In general, failures occurred on the shear-transfer plane. The most common method of failure was the creation of discrete fractures along the critical shear surface, which resulted in the specimens separating into two halves and indicated a brittle failure mechanism. This type of failure occurred when the specimen attained its ultimate shear strength, resulting in fast fracture propagation over the shear-transfer plane. At modest loading levels, the sample developed no fractures. The fractures began at around 90% of each sample’s peak load. Following, the sample was divided into two pieces (Figure 4a); the resisted applied load decreased rapidly following the highest point. The collapsed surfaces showed that the coarse glass grains were broken at the shear plane, as depicted in Figure 4b. This happened because of the weakness of these grains to withstand shear forces at this level. After splitting the sample into two halves, the fracture surface (shear plane) was closely examined to assess the behavior of the aggregate particles. Some recycled aggregate particles were observed to have fractured, while others remained intact. This variation suggests that certain particles exhibited sufficient strength, particularly in mixtures of lower overall strength, which is likely attributed to the weak cement paste matrix. These stronger particles contributed to resisting shear forces even after cracking occurred, thereby delaying the complete failure of the specimen. Furthermore, the irregularities along the fracture surface increased the interlocking and frictional resistance. In contrast, samples incorporating glass aggregates revealed a distinctly different failure behavior. The fracture surfaces were smoother and more uniform, and the glass particles were found to be broken with little resistance. Due to the inherently smooth and brittle nature of glass, these particles offered limited friction and interlocking capacity, leading to reduced shear resistance and a more rapid collapse of the specimen.

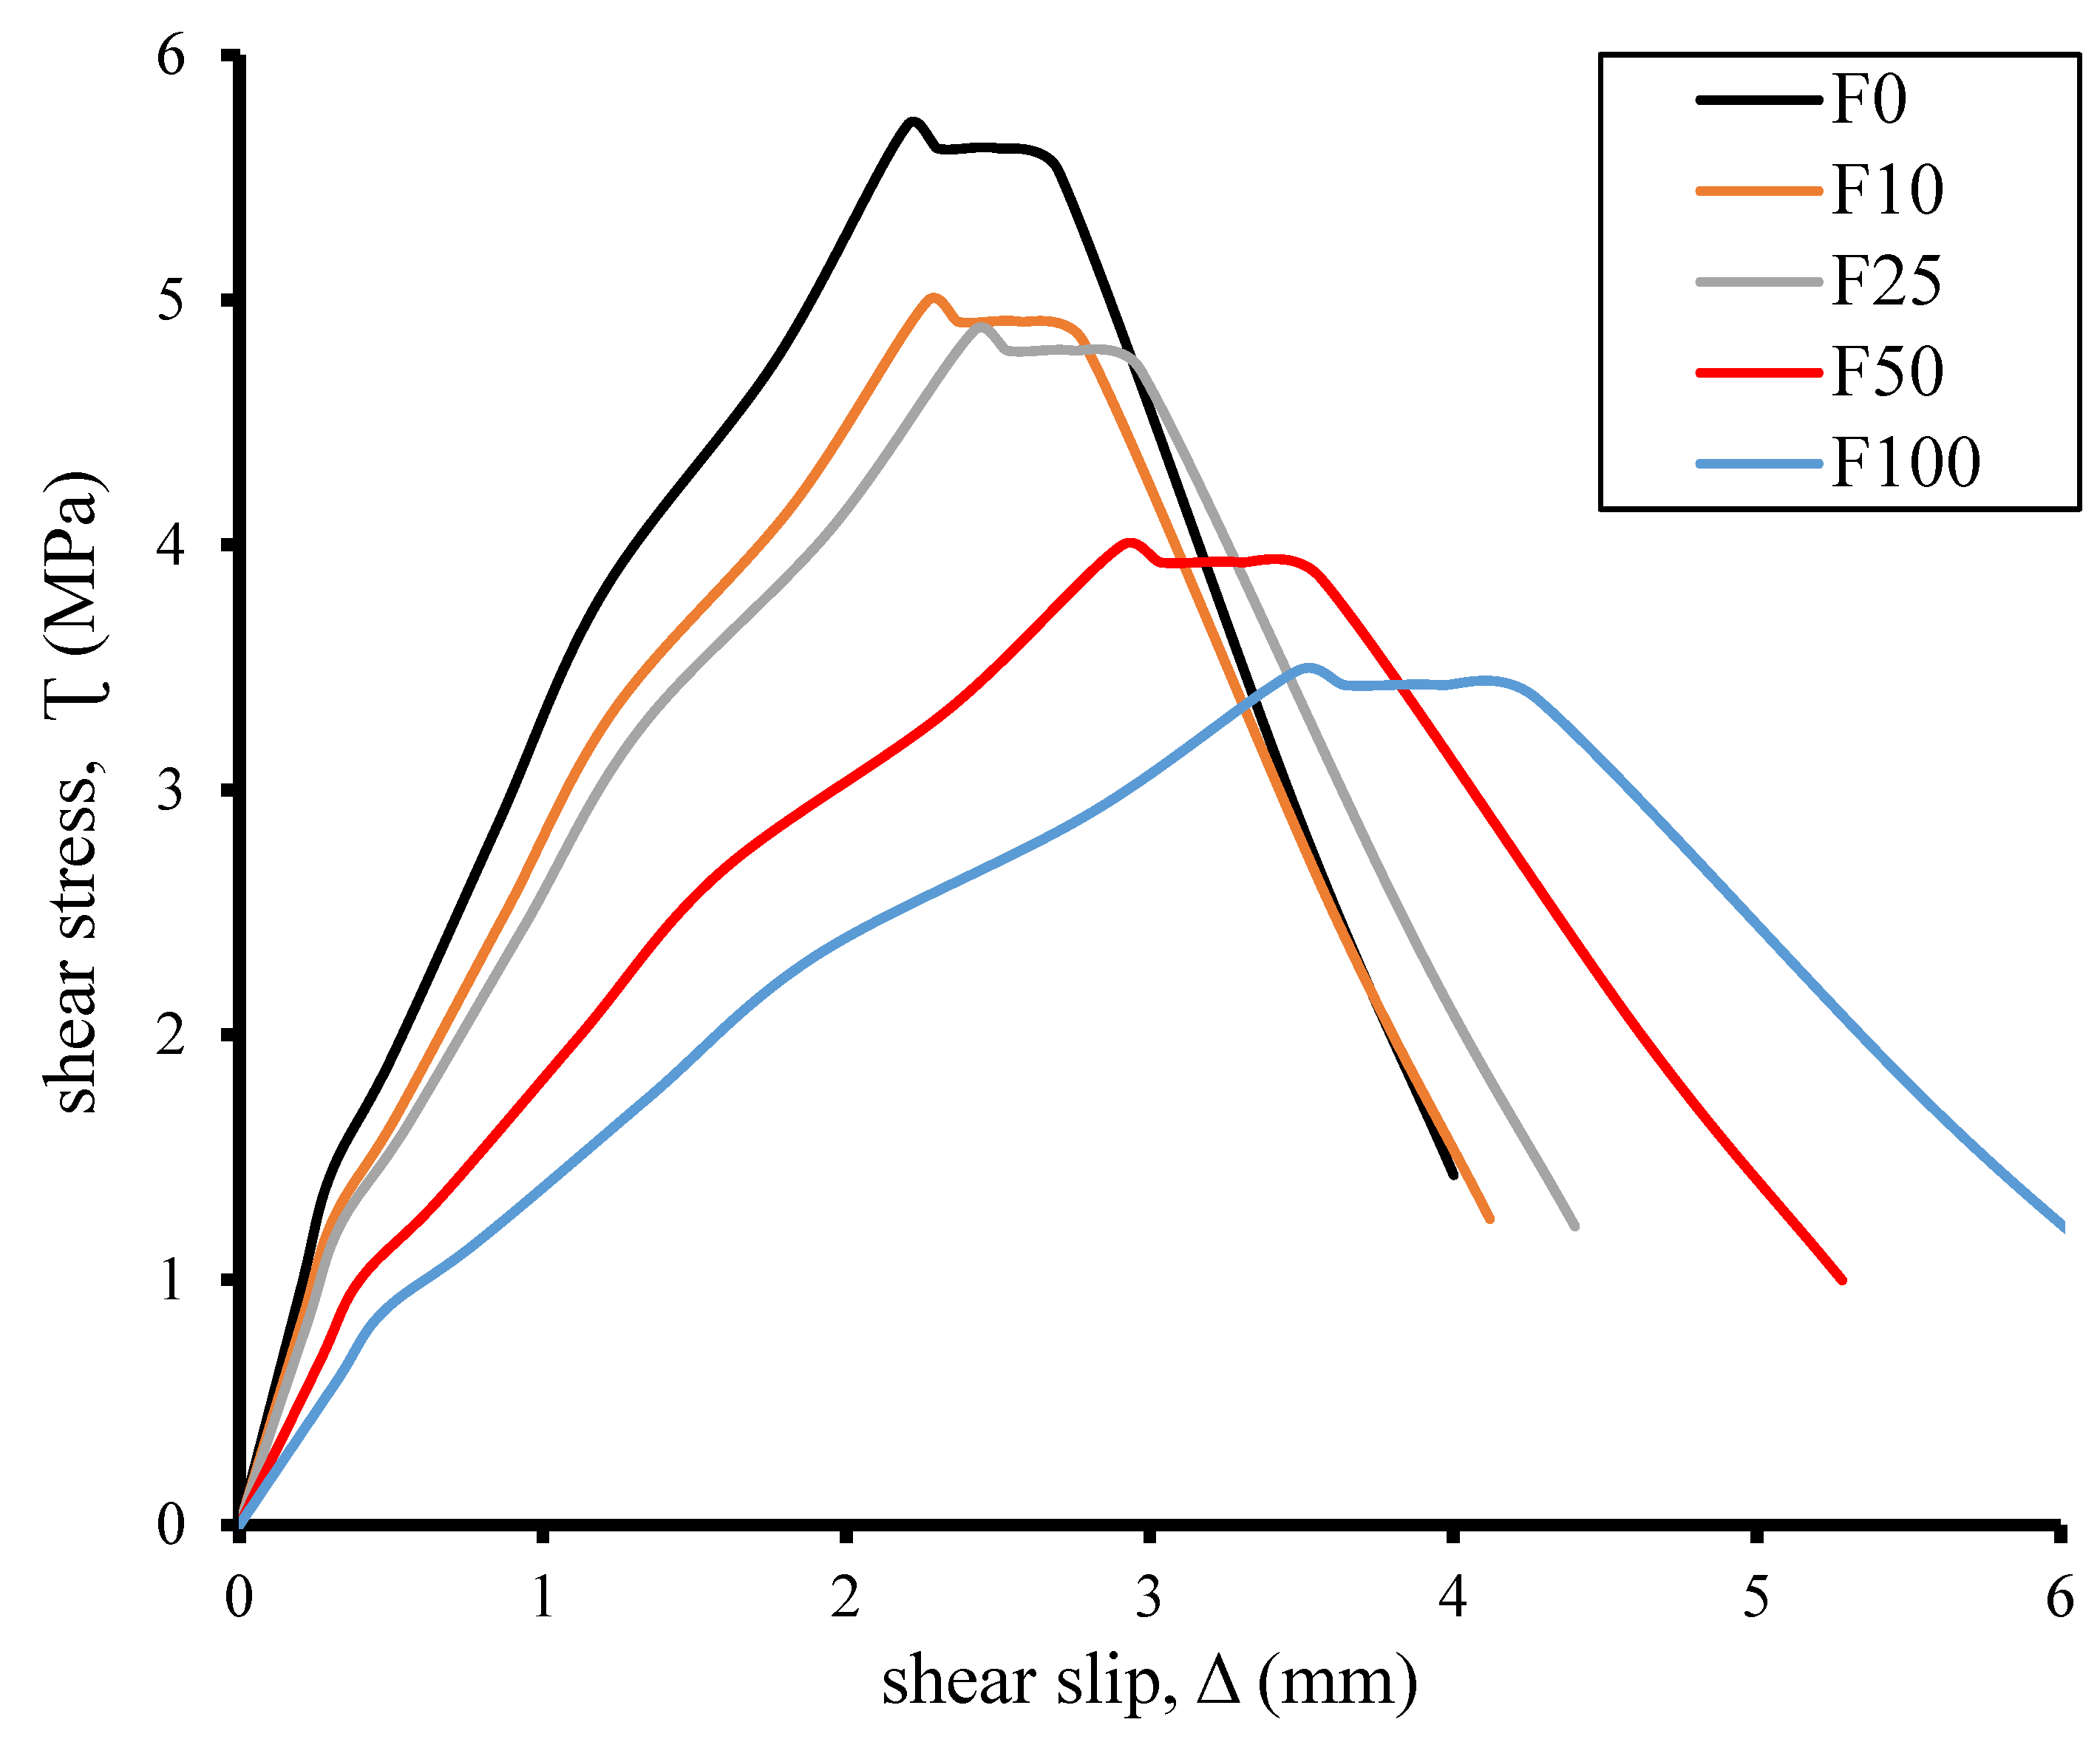
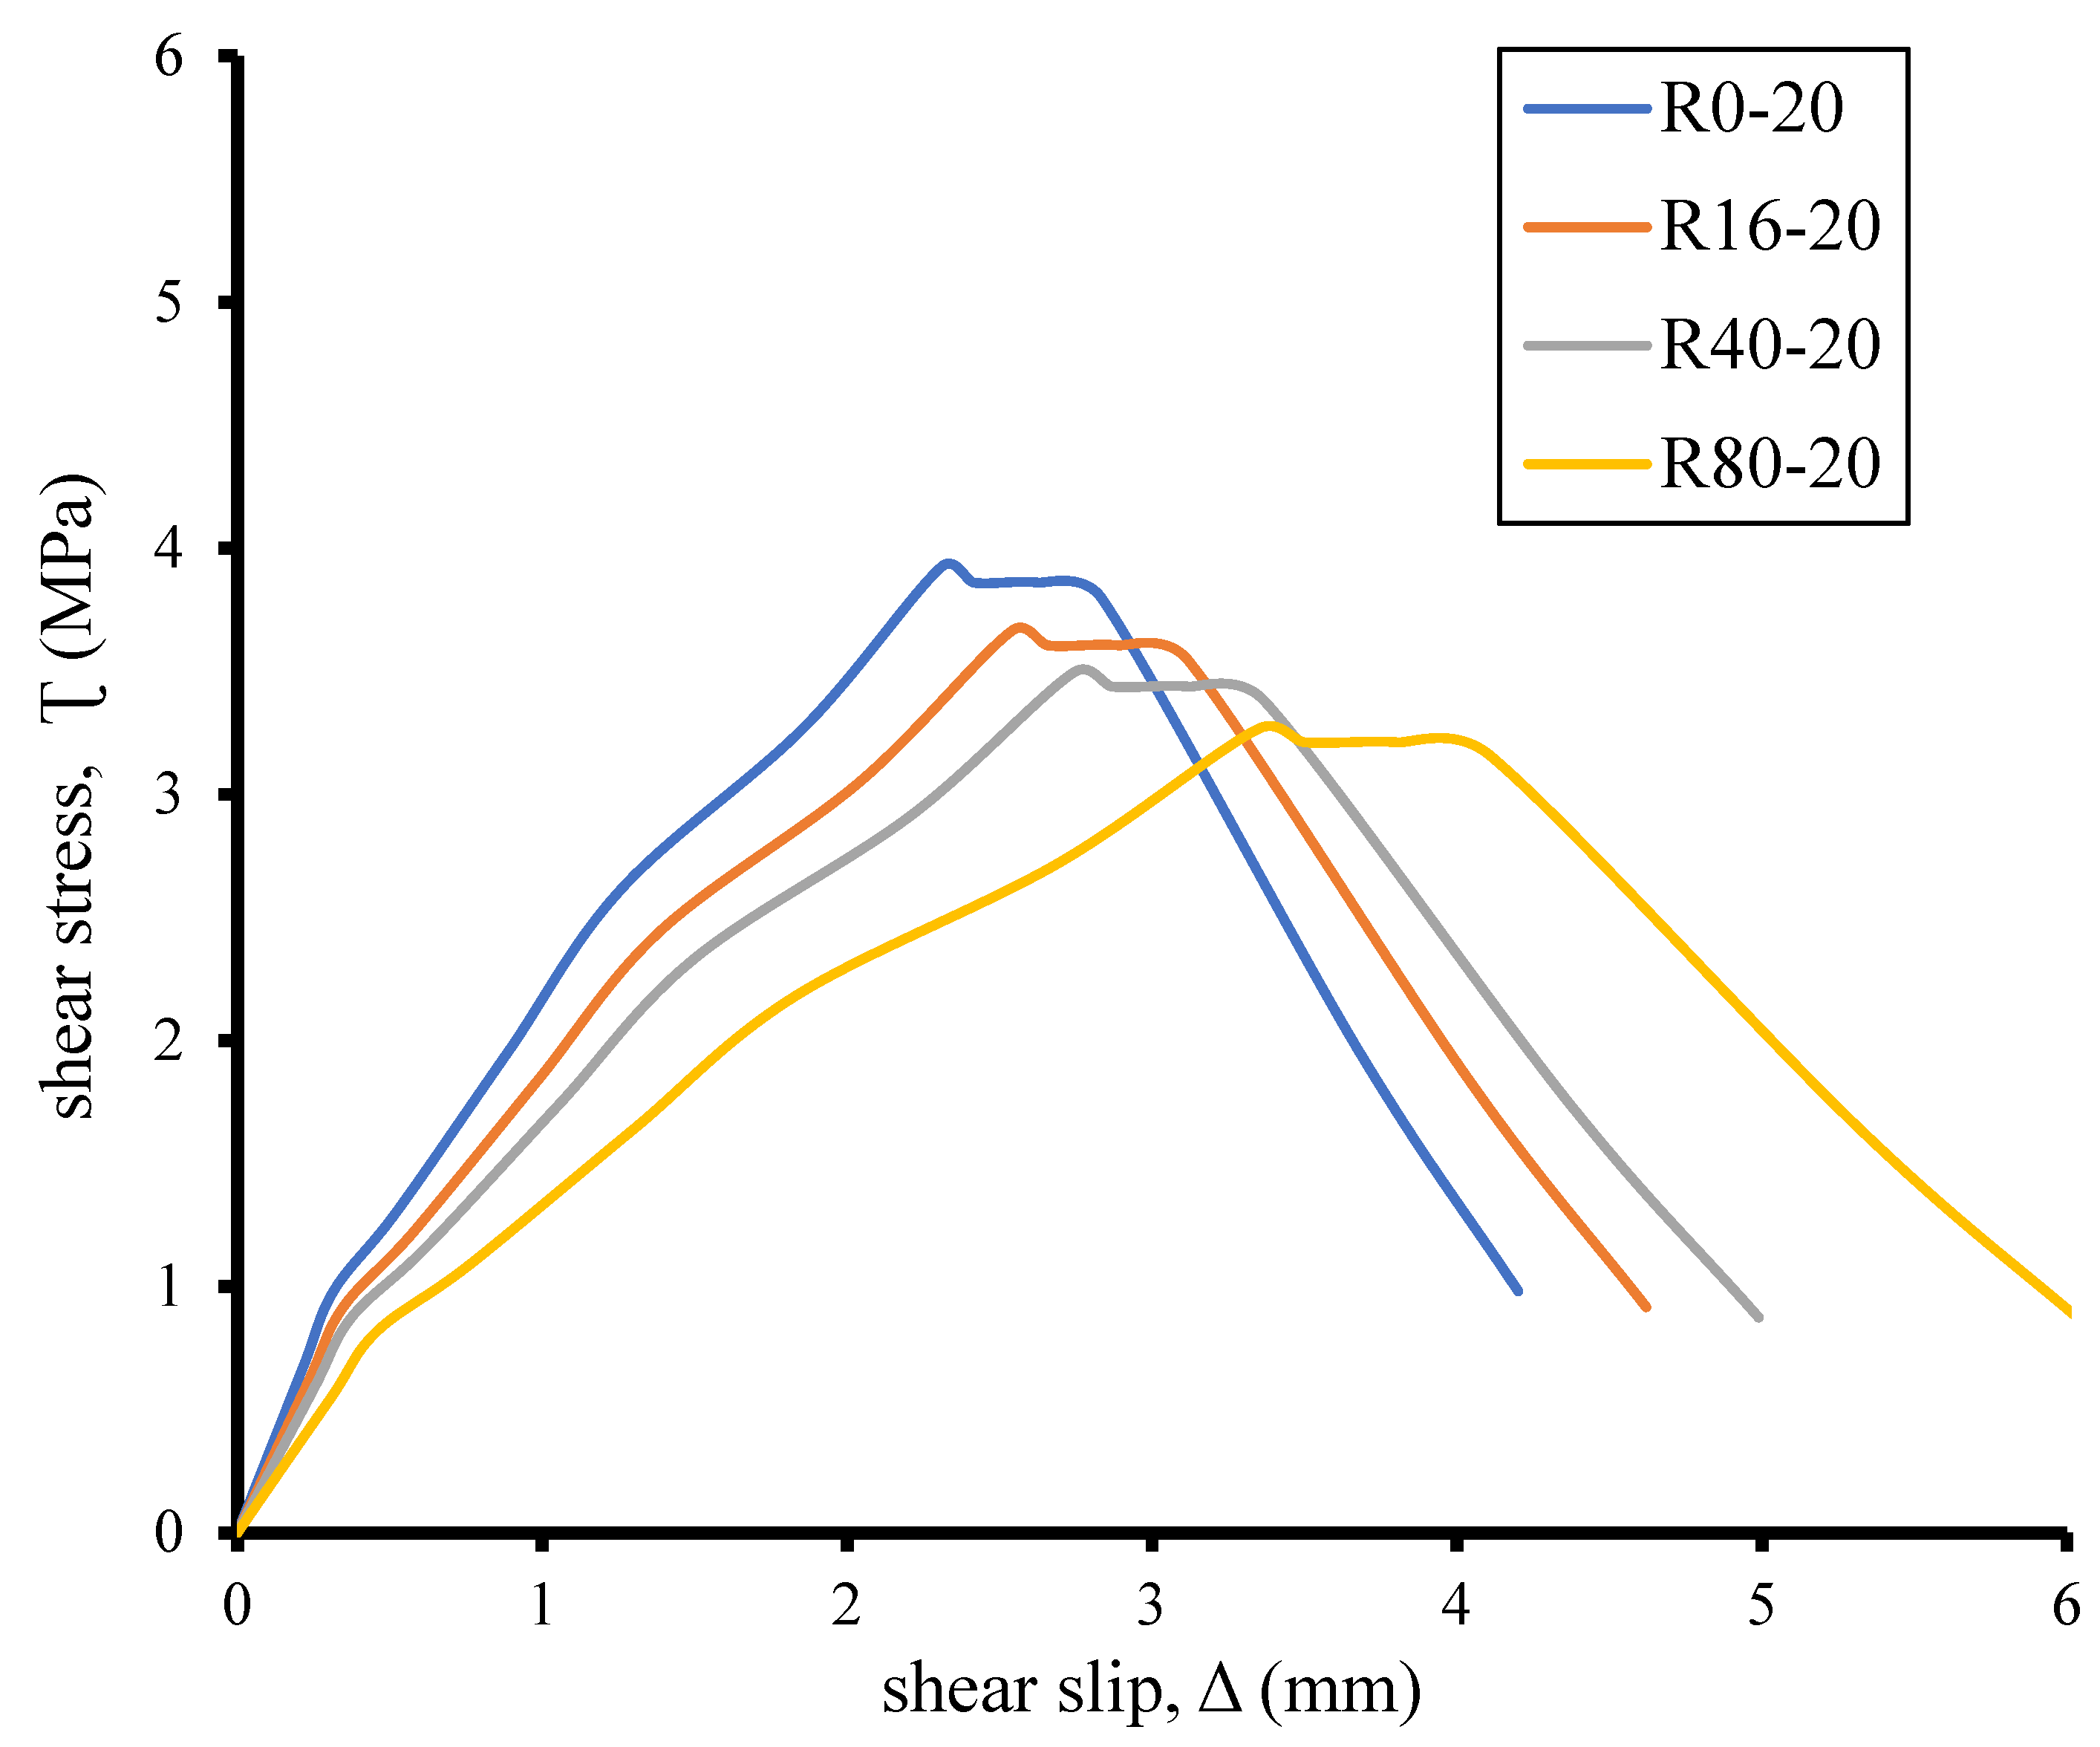
4.2. Shear Stress-Slip Curves

The applied shear stress (Ʈ) versus the slippage of shear plane (Δ) was recorded. Ʈ-Δ curves of groups A, B, C, and D were drawn in Figure 5, Figure 6, Figure 7 and Figure 8, respectively. In general, it turned out that all Ʈ-Δ curves took a non-linear shape. At the beginning of pregnancy, the rate of shear stress rise is rapid and then decreases as the load increases. When the curve reaches the peak, it declines quickly due to the push-off sample splitting into two parts at the shear plane. In all samples, the fall after the peak is rapid, indicating bombardment collapse. The slip of shear plane values for all samples exceeded 2 mm at the peak of the curve in all samples. It is clear that the content of the recycled glass aggregates did not change the form of the relationship Ʈ-Δ. The difference occurred in the reduction of shear stress (Ʈ) values at the same slip level for the samples containing recycled glass aggregates compared to the reference sample with no glass. The higher the waste glass content, the lower the shear (Ʈ) at the same sliding level (Δ). The same behavior also occurred with using recycled concrete aggregate (R) instead of natural aggregate (NA).
The concrete’s compression property (fcu), highest shear stress (Ʈm), shear slip at Ʈmm), shear stiffness (estimated by calculating the slope of the initial linear section of every specimen curve), and shear toughness (Σ) are all listed in Table 3. The influence on Ʈm, Δm, shear stiffness, and Σ of varying replacement amounts of recycled glasses and recycled concrete aggregates will be explained in detail in the parts that follow.

4.3. Shear Strength

Figure 9 and Table 3 show the values of shear strength of the tested mixtures. Overall, the findings demonstrated that the shear strength (Ʈm) was negatively impacted when natural aggregates were substituted with recycled concrete aggregates and glass aggregates in either fine or coarse form. The shear strength decreased further when recycled concrete aggregates and recycled glass replacement levels rose. The Ʈm values of mixtures F10, F25, F50, and F100 in group A were, respectively, 12.8%, 14.7%, 29.5%, and 39% lower than that of the control mixture (F0). In contrast to the control mixture (F0), which contained no fine recycled glass, the shear strength in this group decreased more as the substitution levels of fine recycled glass rose. The decrease in the compressive concrete strengths of combinations including fine recycled glass was the cause. The Ʈm values of mixtures C10, C20, and C40 in group B were, respectively, 23.7%, 31.3%, and 33.25% lower than that of the control mixture (C0). In contrast to the control combination (C0), which contained no coarse recycled glass, the shear strength in this group decreased more as the substitution levels of coarse recycled glass rose. The decrease in compressive concrete strengths of combinations including coarse recycled glass was the cause. The Ʈm values of mixtures R16-20, R40-20, and R80-20 in group C were 6.77%, 10.7%, and 16.6% lower than that of the control mixture (R0-20), respectively. Shear strength decreased more in this group as coarse recycled glass replacement levels rose than in the control mixture (R0-20), which included no coarse recycled glass. The cause was the reduction in the compressive concrete strengths of combinations that contained recycled glass that was coarse. In comparison to the control mixture (R0-0), the Ʈm values of mixtures R16-0, R40-0, and R80-0 in group D were 9.8%, 11.45%, and 21.88%, respectively. In this group, the shear strength decreased more as the amount of recycled concrete aggregate (R) substituted increased than in the control mixture (R0-0), which had no R. Compressive concrete strengths of combinations including coarse recycled glass declined, which was the reason.
The incorporation of fine glass particles into the concrete mix results in a smoother surface texture, which leads to weaker bonding between the fine and coarse components of the mixture. This reduced bond strength can contribute to a decline in compressive strength. Several factors may be responsible for this reduction, including diminished adhesion between the cement paste and the waste glass aggregate surface, an increased proportion of fine aggregates, and a lower compacting factor. As compressive strength decreases, shear strength correspondingly declines. This is further exacerbated by the presence of glass particles, which exhibit poor shear resistance at the failure surface (i.e., the shear plane of push-off specimens). Unlike natural basalt aggregates, glass particles are brittle and smooth, making them less capable of resisting shear forces. They tend to fracture earlier during loading and contribute to a smoother shear plane, which reduces interfacial friction and accelerates failure. Moreover, the smooth surface of glass aggregates limits particle interlock, increasing crack propagation rates. Reduced aggregate interlock and increased crack widths negatively impact the overall shear capacity of the green concrete. Additionally, a relatively weak interfacial transition zone (ITZ) typically forms between the old and new mortar, which promotes early crack initiation and propagation, leading to further reductions in shear strength [39,40,41]. Several previous investigations have been conducted to explore the mechanical behavior of concrete elements under similar conditions [42,43,44,45,46,47].

4.4. Shear Slip

In addition to the shear strength of the studied mixtures, shear plane slip at the shear transfer plane needs to be assessed. As seen in Figure 10, the findings demonstrated that the shear slip of mixtures composed of fine and coarse glass was greater than that of control mixes (F0 and C0) devoid of glass. As the amount of recycled glass replacement and recycled concrete aggregates grew, the shear slip (Δm) increased even more. In comparison to the control mixture (F0), the Δm of mixes F10, F25, F50, and F100 in group A were 3%, 10%, 32%, and 58% higher, respectively. Shear slip increased as a result of combinations including fine recycled glass having lower compressive concrete strengths. However, group B’s C10, C20, and C40 combinations had Δm values that were, respectively, 9%, 5%, and 15.5% greater than the control mixture (C0). The Δm of mixtures R16-20, R40-20, and R80-20 in group C were 10%, 17%, and 42% higher than that of the control mixture (R0-20), respectively. The Δm of mixes R16-0, R40-0, and R80-0 in group D were 8%, 20%, and 31.88% higher, respectively, than the control mixture (R0-0). Compared to the control mixture (R0-0), which had no R, the shear slip rose greater in this group as the amount of recycled concrete aggregate (R) replaced increased.
The results revealed that variations in aggregate surface texture were directly reflected in the roughness of the failure planes among the tested specimens. Notably, specimens incorporating glass aggregates exhibited smoother failure surfaces and less evidence of aggregate shearing, indicating reduced mechanical interlock and lower resistance to shear failure prior to collapse. In lower-strength concrete mixes—such as F50, F100, C40, R80-20, and R80-0—shear slip values reached approximately 3 mm, compared to around 2 mm in the control mixes. This difference is attributed to the behavior of cracks propagating around the glass aggregates along the interfacial transition zone (ITZ), where the fracture paths became more dispersed and exhibited greater roughness. In these cases, aggregate interlock became more pronounced, suggesting that the interaction between the aggregates and the surrounding matrix played a critical role in contributing to shear resistance in weaker mixes. Furthermore, due to the inherent brittleness of the glass particles, the failure mechanism transitioned from interlocking-based resistance to particle shearing, where glass aggregates fractured more easily than their natural counterparts. This shift further underscores the limited shear capacity provided by glass aggregates compared to conventional aggregates like basalt.

4.5. Shear Stiffness

It is necessary to evaluate the examined mixes’ initial shear stiffness in addition to their shear strength capability. Stiffness refers to a material’s ability to maintain its shape under load. There are three reasons why stiffness is important. The first focuses on stable deflections. Instability failure ranks third, followed by energy absorption. The results showed that the shear stiffness of mixtures made of fine and coarse glass was lower than that of control mixes (F0 and C0) without glass, as shown in Figure 11. According to Table 3, stiffness decreased by 61.47%, 42%, 43%, and 41.18% in groups A, B, C, and D, respectively. As the amount of recycled glass replacement and recycled concrete aggregates grew, the shear stiffness declined even more. In comparison to the control mixture (F0), the stiffness of mixes F10, F25, F50, and F100 in group A declined by 15%, 22.4%, 47%, and 61.47%, respectively. Combinations including fine recycled glass and lower compressive concrete strengths resulted in a reduction in shear stiffness. Nevertheless, the stiffness values of the C10, C20, and C40 combinations in group B were, respectively, 26.5%, 34.5%, and 42% lower than those of the control mixture (C0). In comparison to the control mixture (R0-20), the stiffness of mixtures R16-20, R40-20, and R80-20 in group C was 15%, 25%, and 42.95% lower, respectively. In comparison to the control mixture (R0-0), the stiffness of mixes R16-0, R40-0, and R80-0 in group D was 17%, 26.47%, and 41.18% lower, respectively. As the proportion of recycled concrete aggregate (R) substituted increased, the shear stiffness in this group decreased more than in the control mixture (R0-0), which included no R.
It is essential for structural designers to consider the stiffness of elements made with green concrete, especially when subjected to shear forces. These elements typically exhibit lower stiffness compared to those made with conventional natural aggregates. Despite this, all structural members must still satisfy the minimum serviceability criteria established by relevant design codes. Green concrete elements are likely to undergo greater deformations when subjected to their ultimate design loads. As a result, these increased deformations may lead to serviceability issues, such as excessive deflections or crack widths, that exceed permissible limits. To mitigate these effects, designers should account for the reduced stiffness by applying more conservative design loads or by adjusting structural dimensions and reinforcement accordingly. Ultimately, recognizing and accommodating the lower stiffness of green concrete is critical to maintaining both safety and serviceability in structural performance.

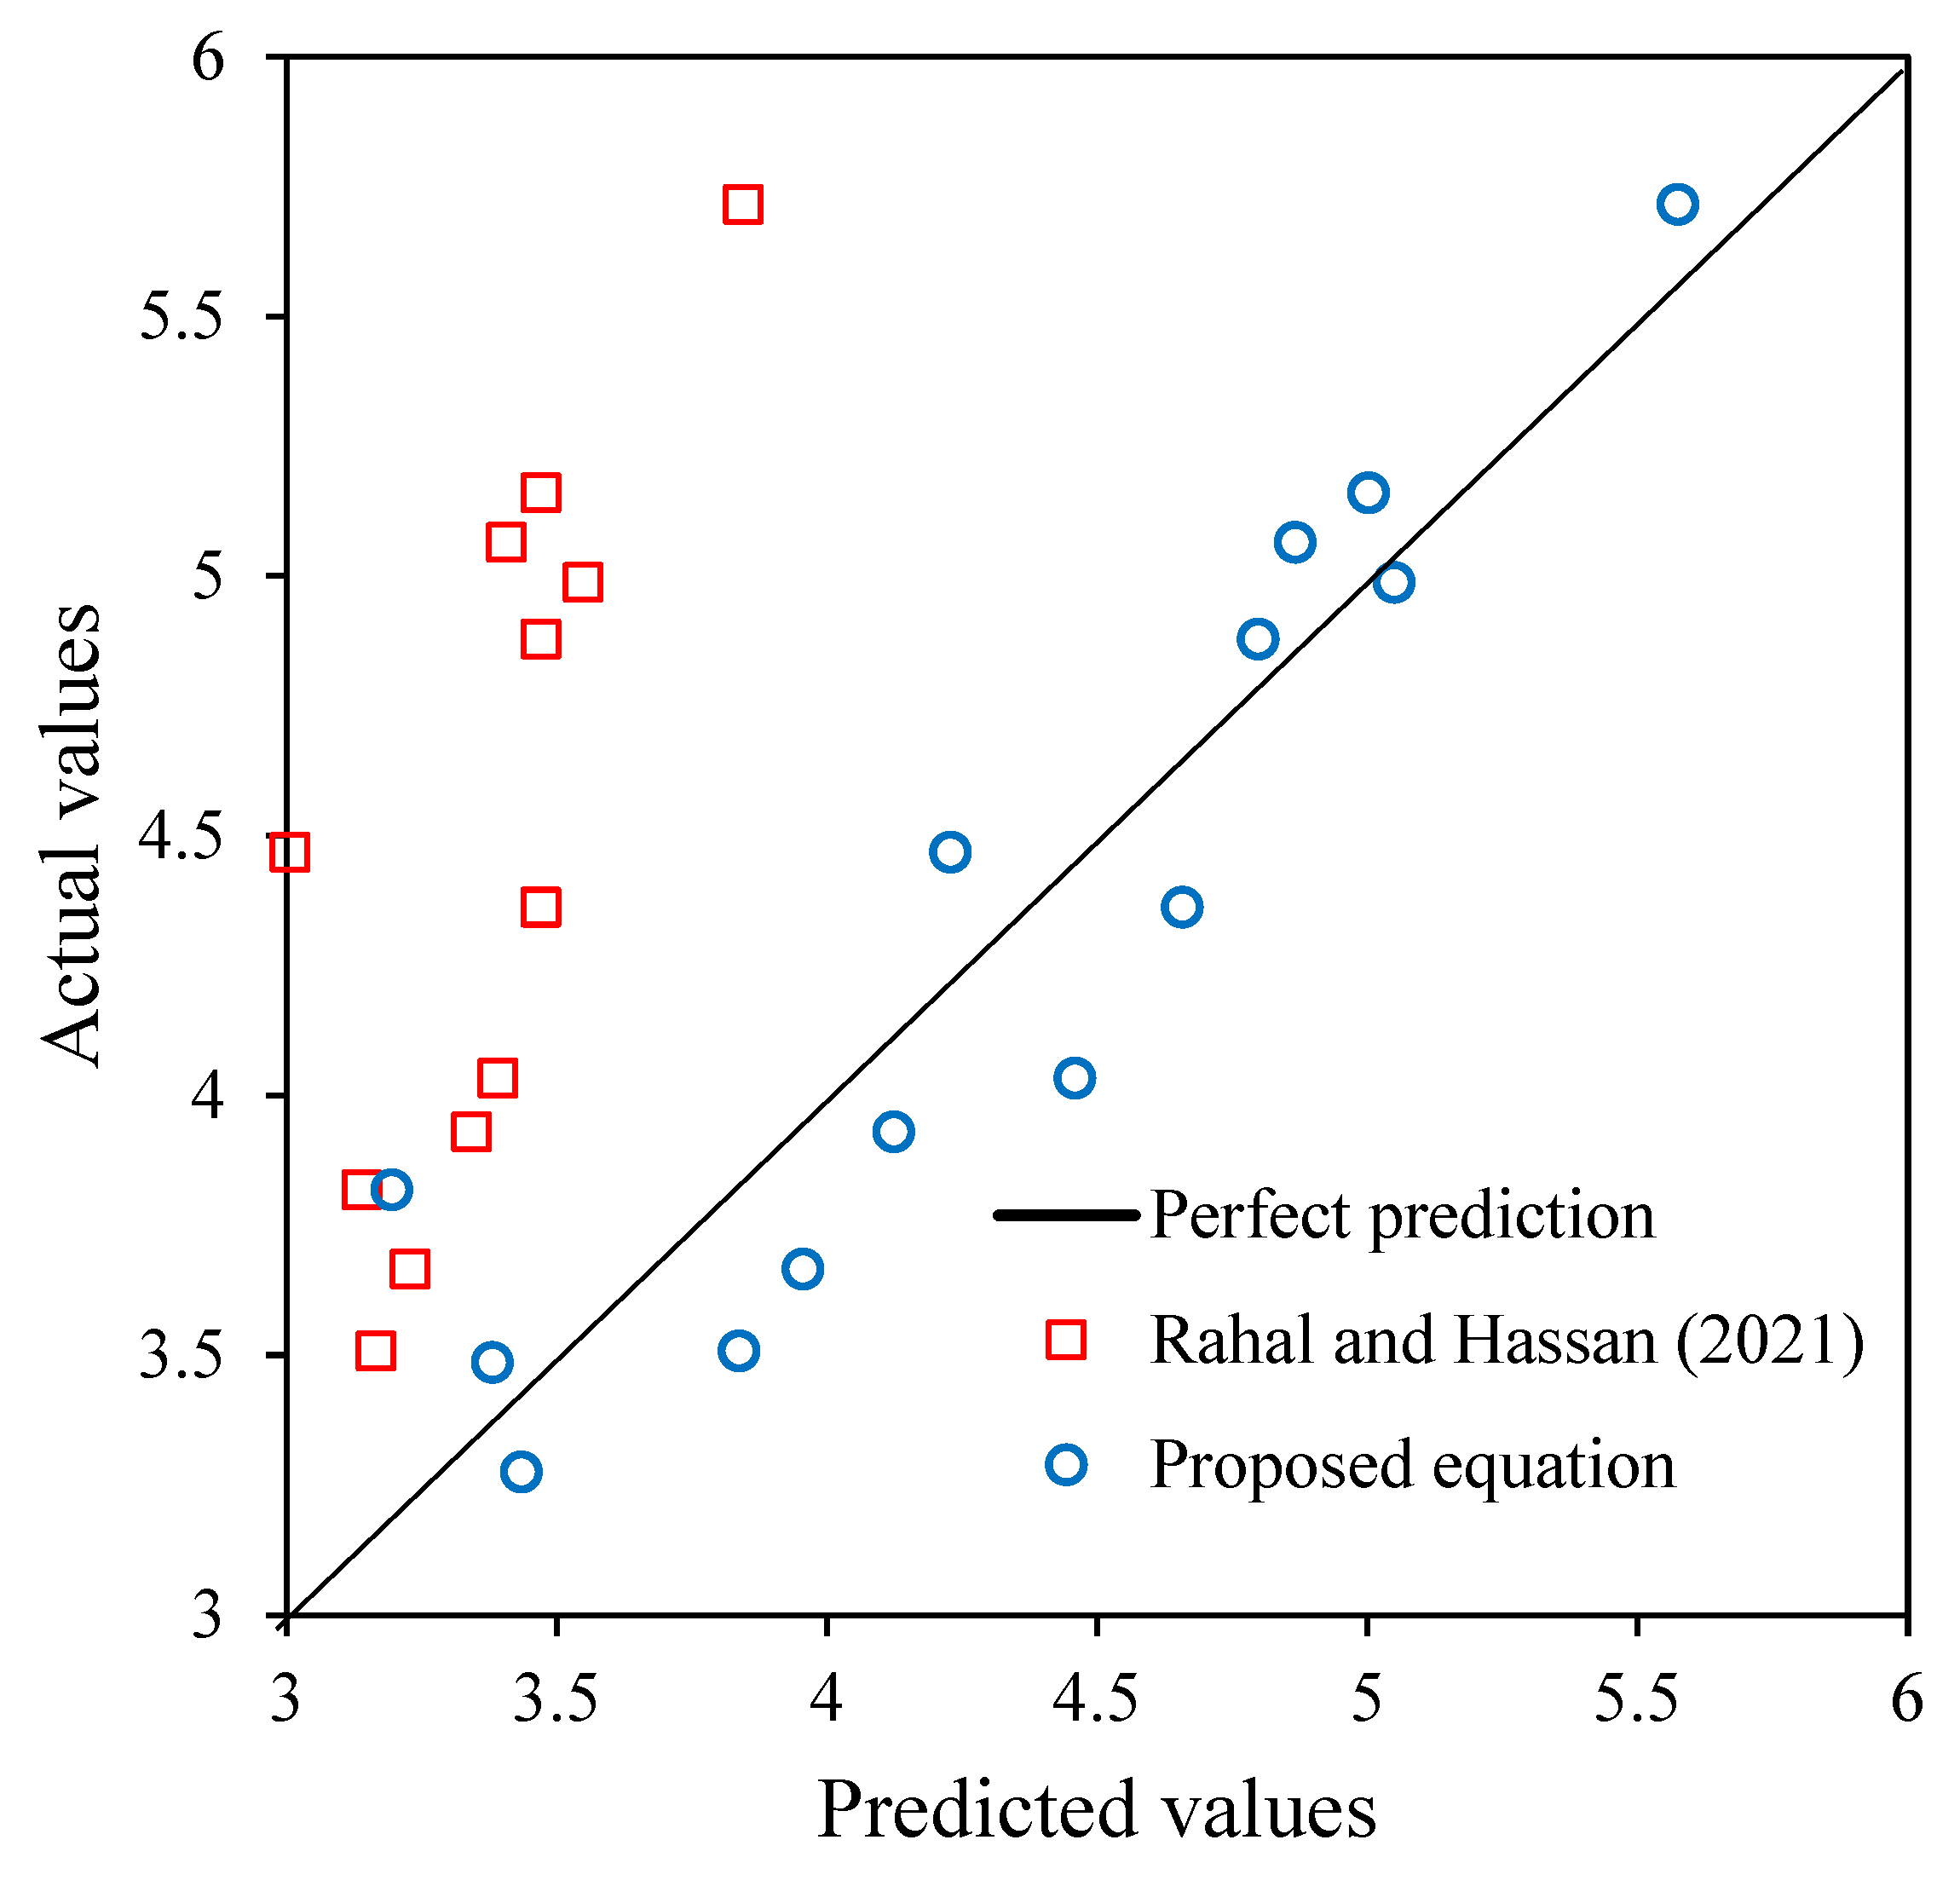
5. Proposed Formula for the Shear Strength Prediction

Push-off shear strength represents a mix of stress types acting on the shear-transfer plane rather than offering a measurement of pure shear strength alone. The primary force acting on this plane is shear stress, which is produced when the applied load pushes one side of the specimen against the other. The test’s primary metric is the shear stress’s effort to induce sliding along the plane. Other stresses, however, enter the picture and affect the total resistance along the shear plane. Notably, the clamping action of the applied load causes normal compressive stress to build perpendicular to the shear plane. By increasing frictional resistance along the plane, this compressive stress effectively raises the observed push-off shear strength. Frictional stress results from the contact of the shear plane’s surfaces in addition to shear and compressive forces. The degree of normal compressive stress, the quality of the ITZ, and the aggregate surface roughness all affect this frictional component, which in turn raises the barrier to sliding. Minor tensile strains can occasionally also be seen along the plane, especially when loading causes a tendency for separation or fracture. In contrast to the principal shear and compressive stresses, these tensile stresses are usually secondary and have less of an impact. All things considered, push-off specimen tests offer a fundamental framework for creating models that forecast shear transfer across interfaces in a range of structural applications, such as construction joints, corbels, precast parts, and beam end supports. The complex interplay of shear, compressive, and frictional stresses operating on the shear-transfer plane is captured by the push-off shear strength, which reflects the many stress interactions that are essential for dependable performance in these elements.
With compressive strength as the main variable, a number of research studies have created formulas in recent years to forecast the push-off shear strength of plain concrete. Rahal and Hassan, for example, put out a prediction model (Equation (1)), the parameters of which were adjusted to match the outcomes of experiments [48]. The content of recycled concrete aggregate (R), coarse glass aggregate (C), and fine glass aggregate (F), which can have a substantial impact on shear strength but were not taken into account in the previous analysis, were not taken into account in this equation. Additionally, Thanongsak Imjai et al. [49] proposed a new formula for predicting the shear strength of recycled aggregate concrete; however, their model did not consider the use of recycled glass aggregates. Similarly, Setkit et al. [50] developed a predictive formula for the shear strength of recycled aggregate concrete beams, but their approach also excluded the influence of glass aggregates. These previous studies overlooked the combined effects of glass aggregates and the specific behavior of green concrete. Therefore, the present study aims to address this gap by proposing a new equation that incorporates the influence of recycled glass aggregates on shear strength.
Ʈ m = 0.74 f c u
In light of these drawbacks, the current study suggests an improved prediction model that incorporates the amount of recycled concrete aggregate (R), coarse glass aggregate (C), or fine glass aggregate (F) as a correction factor (λ), as shown in Equation (2). The model aims to give a more complete and flexible equation for real-world applications under a variety of structural circumstances by including these factors.
Ʈ m = λ f c u
To improve predicted accuracy, regression analysis was used to obtain the correction factor (λ). The estimation of the λ based on the content of F, C, and R is shown in Equation (3). Table 4 explains how to use the suggested equation to estimate shear strength. The correctness of the suggested equation is demonstrated by the experimental-to-theoretical shear strength ratio, which ranges from 0.84 to 1.1.
The proposed equation is specifically developed for green concrete mixtures containing waste glass and/or recycled concrete aggregates, within the following constraints: compressive strength ranging from 15 to 27 MPa, fine glass aggregate replacement levels between 0–100%, recycled concrete aggregate replacement levels between 0–80%, and coarse glass aggregate replacement levels between 0–40%. This new equation is particularly valuable for practical applications, as it incorporates correction factors to account for the varying content of recycled concrete aggregate (R), coarse glass aggregate (C), and fine glass aggregate (F). Unlike previous models—many of which estimate the push-off shear strength of plain concrete based primarily on compressive strength and ignore the influence of recycled infill materials—this equation captures the effect of these recycled aggregates on shear behavior. The equation is also user-friendly and adaptable. By simply determining the replacement percentages of R, C, and F in the mix, designers can substitute these values into the equation to estimate the shear strength of green concrete. This makes the equation a practical tool for evaluating the structural performance of sustainable concrete mixtures.
λ = 1.073 − (0.002F + 0.008C + 0.0004R)
While equations from previous research reveal significant discrepancies, Figure 12 demonstrates that predictions from the proposed equation closely match actual data, clustering around the 45-degree line. The durability of the suggested model is demonstrated by this high correlation, highlighting its potential as a trustworthy instrument in engineering applications and laying the groundwork for future studies on shear behavior under various circumstances.
The price of the materials utilized in this program should be known. The components included cement, water mixed with superplasticizer, and both fine and coarse particles. While coarse naturally occurring aggregate, recycled concrete aggregate, and coarser recycled glass served as coarse aggregates, fine recycled glass and sand from nearby rivers were utilized to generate fine aggregates. The whole cost was fifteen thousand Egyptian pounds.

6. Conclusions

In the construction sector and its projects, the concept of producing sustainable construction materials such as green concrete using glass waste or recycled concrete aggregate has been extensively studied; however, most research has focused solely on these two materials, highlighting the need for further investigation to comprehensively address their limitations and support informed decision-making in construction project management. To examine shear response, push-off shear samples composed of green concrete were constructed and put through direct shear loading tests. Four sets of concrete mixtures were used in the current experiment. All four groups had the same amount of cement and water, but different aggregates were used. River sand was replaced by fine glass aggregate in the first series at varying percentages (0, 10, 25, 50, and 100%). In the other three categories, sand was used as the fine aggregate. The mixes in the second set were created by substituting coarse glass aggregate for coarse natural aggregate at varying percentages (0, 10, 20, and 40%). The third group, which consisted of mixes, was created by substituting recycled concrete aggregates and coarse glass aggregate for coarse natural aggregate. In the final group, recycled concrete aggregates were used at varying percentages (0, 16, 40, and 80%) to replace coarse natural aggregate to create mixes. To determine the compressive properties of each mixture, push-off shear samples and cubes were cast from each mixture. Two L-shaped concrete pieces connected at the shear transfer plane comprised each push-off shear specimen. During the test, the sliding of the shear transfer plane and the applied shear force were measured. Shear stress-slip relationships, shear strength, shear slip, shear stiffness, and failure of tested mixes were examined in relation to the rates of aggregate substitution. The results showed the following points:
  • At the shear-transfer plane, every sample failed. The specimens separated into two halves as a result of the failure, which was the formation of distinct fractures at the critical shear surface. This suggested a brittle failure mechanism.
  • In comparison to the control combination without fine glass, the shear strengths of mixtures containing 10, 25, 50, and 100% fine glass were, respectively, 12.8%, 14.7%, 29.5%, and 39% lower. In comparison to the control mixture, the shear strengths of mixtures containing 10, 20%, and 40% were, respectively, 23.7%, 31.3%, and 33.25% lower. The shear strength of combinations containing 16, 40, and 80% recycled concrete aggregate decreased by 9.8%, 11.45%, and 21.88%, respectively, as compared to the control mixture.
  • Compared to control mixes without glass, the shear slip of mixtures made of fine and coarse glass aggregates was higher. The shear slip at the shear transfer plane rose more as the quantity of recycled concrete aggregates and recycled glass replacement increased.
  • Compared to control mixes, the shear stiffness of mixtures composed of fine and coarse glass was lower. In the first, second, third, and fourth groups, stiffness dropped by 61.47%, 42%, 43%, and 41.18%, respectively.
  • This study introduced a new formula to predict shear strength of the plain concrete considering the content of fine glass, coarse glass, and recycled concrete aggregates.

Author Contributions

Conceptualization, S.F.; data curation, S.F.; formal analysis, S.F., A.E.-Z., H.S., E.A.M., R.W.B. and M.G.; investigation, S.F.; methodology, A.E.-Z., H.S. and E.A.M.; project administration, M.G.; supervision, R.W.B. and M.G.; validation, A.E.-Z., E.A.M. and M.G.; visualization, R.W.B.; writing—original draft, S.F., E.A.M. and R.W.B.; writing—review and editing, A.E.-Z., H.S. and M.G. All authors have read and agreed to the published version of the manuscript.

Funding

This research received no external funding.

Informed Consent Statement

Informed consent was obtained from all individual participants included in this study. All the authors agree that the article will be published after acceptance.

Data Availability Statement

The experimental data can be obtained through email communication with the corresponding author.

Acknowledgments

The experimental tests were carried out by the reinforced concrete laboratory of the faculty of Engineering, Kafer Elshiekh University, Egypt.

Conflicts of Interest

The authors declare that they have no competing interests.

References

  1. Baek, C.; Park, S.-H.; Suzuki, M.; Lee, S.-H. Life cycle carbon dioxide assessment tool for buildings in the schematic design phase. Energy Build. 2013, 61, 275–287. [Google Scholar] [CrossRef]
  2. Akinade, O.O.; Oyedele, L.O. Integrating construction supply chains within a circular economy: An ANFIS-based waste analytics system (A-WAS). J. Clean. Prod. 2019, 229, 863–873. [Google Scholar] [CrossRef]
  3. Tan, K.H.; Du, H. Use of waste glass as sand in mortar: Part I–Fresh, mechanical and durability properties. Cem. Concr. Compos. 2013, 35, 109–117. [Google Scholar] [CrossRef]
  4. Afshinnia, K.; Rangaraju, P.R. Impact of combined use of ground glass powder and crushed glass aggregate on selected properties of Portland cement concrete. Constr. Build. Mater. 2016, 117, 263–272. [Google Scholar] [CrossRef]
  5. Chesner, W.H.; Collins, R.J.; MacKay, M.H.; Emery, J. User Guidelines for Waste and By-Product Materials in Pavement Construction; Recycled Materials Resource Center: Washington, DC, USA, 2002. [Google Scholar]
  6. Jani, Y.; Hogland, W. Waste glass in the production of cement and concrete—A review. J. Environ. Chem. Eng. 2014, 2, 1767–1775. [Google Scholar] [CrossRef]
  7. Olofinnade, O.M.; Ndambuki, J.M.; Ede, A.N.; Booth, C. Application of waste glass powder as a partial cement substitute towards more sustainable concrete production. Int. J. Eng. Res. Afr. 2017, 31, 77–93. [Google Scholar] [CrossRef]
  8. Olofinnade, O.; Ede, A.; Ndambuki, J. Sustainable green environment through utilization of waste soda-lime glass for production of concrete. J. Mater. Environ. Sci. 2017, 8, 1139–1152. [Google Scholar]
  9. Olofinnade, O.M.; Ede, A.N.; Ndambuki, J.M.; Innovation, T. Experimental investigation on the effect of elevated temperature on compressive strength of concrete containing waste glass powder. Int. J. Eng. Technol. Innov. 2017, 7, 280–291. [Google Scholar]
  10. Shayan, A.; Xu, A. Performance of glass powder as a pozzolanic material in concrete: A field trial on concrete slabs. Cem. Concr. Res. 2006, 36, 457–468. [Google Scholar] [CrossRef]
  11. Grabiec, A.M.; Zawal, D.; Rasaq, W.A. The Effect of Curing Conditions on Selected Properties of Recycled Aggregate Concrete. Appl. Sci. 2020, 10, 4441. [Google Scholar] [CrossRef]
  12. Al Ajmani, H.; Suleiman, F.; Abuzayed, I.; Tamimi, A. Evaluation of Concrete Strength Made with Recycled Aggregate. Buildings 2019, 9, 56. [Google Scholar] [CrossRef]
  13. Vieira, G.L.; Schiavon, J.Z.; Borges, P.M.; da Silva, S.R.; de Oliveira Andrade, J.J. Influence of recycled aggregate replacement and fly ash content in performance of pervious concrete mixtures. J. Clean. Prod. 2020, 271, 122665. [Google Scholar] [CrossRef]
  14. Xiao, J.; Li, J.; Zhang, C. Mechanical properties of recycled aggregate concrete under uniaxial loading. Cem. Concr. Res. 2005, 35, 1187–1194. [Google Scholar] [CrossRef]
  15. Etxeberria, M.; Vázquez, E.; Marí, A.; Barra, M. Influence of amount of recycled coarse aggregates and production process on properties of recycled aggregate concrete. Cem. Concr. Res. 2007, 37, 735–742. [Google Scholar] [CrossRef]
  16. Poon, C.S.; Kou, S.C.; Lam, L. Influence of recycled aggregate on slump and bleeding of fresh concrete. Mater. Struct. 2007, 40, 981–988. [Google Scholar] [CrossRef]
  17. Zhang, H.; Wang, Y.; Lehman, D.E.; Geng, Y.; Kuder, K. Time-dependent drying shrinkage model for concrete with coarse and fine recycled aggregate. Cem. Concr. Compos. 2020, 105, 103426. [Google Scholar] [CrossRef]
  18. Silva, R.; de Brito, J.; Dhir, R. Comparative analysis of existing prediction models on the creep behaviour of recycled aggregate concrete. Eng. Struct. 2015, 100, 31–42. [Google Scholar] [CrossRef]
  19. Fan, Y.; Xiao, J.; Tam, V.W.Y. Effect of old attached mortar on the creep of recycled aggregate concrete. Struct. Concr. 2014, 15, 169–178. [Google Scholar] [CrossRef]
  20. Kim, J. The Effect of Residual Mortar in Recycled Aggregate on Behavior of Recycled Aggregate Concrete. Ph.D. Thesis, Korea University of Technology and Education, Cheonan, Republic of Korea, 2016. [Google Scholar]
  21. Jayasuriya, A.; Adams, M.P.; Bandelt, M.J. Understanding variability in recycled aggregate concrete mechanical properties through numerical simulation and statistical evaluation. Constr. Build. Mater. 2018, 178, 301–312. [Google Scholar] [CrossRef]
  22. Saravanakumar, P.; Abhiram, K.; Manoj, B. Properties of treated recycled aggregates and its influence on concrete strength characteristics. Constr. Build. Mater. 2016, 111, 611–617. [Google Scholar] [CrossRef]
  23. Fayed, S.; Mansour, W. Behavior of RC columns incorporating with steel and recycled plastic fibers under eccentric load: An experimental work. Struct. Concr. 2023, 24, 3443–3460. [Google Scholar] [CrossRef]
  24. Fayed, S.; Madenci, E.; Bahrami, A.; Özkiliç, Y.O.; Mansour, W. Experimental study on using recycled polyethylene terephthalate and steel fibers for improving behavior of RC columns. Case Stud. Constr. Mater. 2023, 19, e02344. [Google Scholar] [CrossRef]
  25. Saleh, A.M. Size effect on shear strength of normal and high strength concrete shallow beams. J. Eng. Appl. Sci. 2007, 54, 91–103. [Google Scholar]
  26. Mouli, C.C.; Rao, G.V.R. Effect of Specimen Size on Flexural Behavior of Doubly Reinforced Concrete Beams. Int. J. Eng. Trends Technol. 2023, 71, 168–175. [Google Scholar] [CrossRef]
  27. Liu, Q.; Cheng, A.; Sun, C.; Chen, K.; Wang, Y.; Li, W. Effects of aggregate’s type and orientation on stress concentration and crack propagation of modeled concrete applied a shear force. J. Build. Eng. 2024, 95, 110340. [Google Scholar] [CrossRef]
  28. Jin, L.; Wan, S.; Li, D.; Miao, L.; Du, X. Influence of concrete strength and aggregate size on the size effect of shear capacity of RC beam-column joints under monotonic loading: Mesoscale numerical tests. Structures 2022, 37, 671–685. [Google Scholar] [CrossRef]
  29. Albidah, A.S.; Alqarni, A.S.; Wasim, M.; Abadel, A.A. Influence of aggregate source and size on the shear behavior of high strength reinforced concrete deep beams. Case Stud. Constr. Mater. 2023, 19, e02260. [Google Scholar] [CrossRef]
  30. Barham, W.S.; Obaidat, Y.T.; Qublan, A.W. Effect of maximum coarse aggregate size upon shear strengthening of RC beams using NSM-CFRP strips. Structures 2023, 53, 652–663. [Google Scholar] [CrossRef]
  31. Yi, W.-J.; Deng, Q.; Tang, F. Effect of Coarse Aggregate Size on the Shear Behavior of Beams without Shear Reinforcement. ACI Struct. J. 2017, 114, 1131. [Google Scholar] [CrossRef]
  32. Reba, T.C.; Aure, T.W. Influence of aggregate size on shear mechanism of reinforced concrete beam subjected to impact load. SN Appl. Sci. 2022, 4, 224. [Google Scholar] [CrossRef]
  33. Cho, S.; Kim, M.O. Effect of Aggregate Type on the Shear Behavior of Reinforced Lightweight Concrete Beams. Appl. Sci. 2024, 14, 5992. [Google Scholar] [CrossRef]
  34. da Cunha, B.F.; de Andrade Pinto, R.C.; Savaris, G. Evaluation of self-consolidating concrete shear strength by means of push-off test. Mag. Concr. Res. 2022, 74, 879–888. [Google Scholar] [CrossRef]
  35. Ganeshan, M.; Venkataraman, S. Interface shear strength evaluation of self compacting geopolymer concrete using push-off test. J. King Saud Univ. Eng. Sci. 2022, 34, 98–107. [Google Scholar] [CrossRef]
  36. Jongvivatsakul, P.; Attachaiyawuth, A.; Pansuk, W. A crack-shear slip model of high-strength steel fiber-reinforced concrete based on a push-off test. Constr. Build. Mater. 2016, 126, 924–935. [Google Scholar] [CrossRef]
  37. Neupane, R.P.; Imjai, T.; Makul, N.; Garcia, R.; Kim, B.; Chaudhary, S. Use of recycled aggregate concrete in structural members: A review focused on Southeast Asia. J. Asian Archit. Build. Eng. 2023, 1–24. [Google Scholar] [CrossRef]
  38. ECP 203-2018; Egyptian Code for the Design and Construction of Concrete Structures. Egyptian Code Committee: Giza, Egypt, 2018; tests guide, part II.
  39. Zhao, H.; Zhou, A.; Zhang, L.; Arulrajah, A. A novel three-dimensional DEM model for recycled aggregate concrete considering material heterogeneity and microcrack evolution. Compos. Struct. 2025, 352, 118677. [Google Scholar] [CrossRef]
  40. Zhao, H.; Zhou, A. Effects of recycled aggregates on mechanical and fractural properties of concrete: Insights from DEM modelling. Compos. Part A Appl. Sci. Manuf. 2024, 186, 108395. [Google Scholar] [CrossRef]
  41. Zhao, H.; Wu, Z.; Liu, A.; Zhang, L. Numerical insights into the effect of ITZ and aggregate strength on concrete properties. Theor. Appl. Fract. Mech. 2022, 120, 103415. [Google Scholar] [CrossRef]
  42. Badawi, M.; Bahrami, A.; Ghalla, M.; Emara, M.; Mlybari, E.A.; Elsamak, G. Flexural strengthening of reinforced concrete cantilever beams having insufficient splice length. Results Eng. 2024, 24, 102869. [Google Scholar] [CrossRef]
  43. Ghalla, M.; Bahrami, A.; Badawi, M.; Elsamak, G.; Emara, M.; Abdallah, A.M. Sustainable shear strengthening of defected RC beams using aluminum boxes and high-performance concretes. Ain Shams Eng. J. 2025, 16, 103354. [Google Scholar] [CrossRef]
  44. Ghalla, M.; Bahrami, A.; Badawi, M.; Mlybari, E.A. Novel sustainable techniques for enhancing shear strength of RC beams mitigating construction failure risk. Ain Shams Eng. J. 2024, 15, 103017. [Google Scholar] [CrossRef]
  45. Hamoda, A.; Basha, A.; Fayed, S.; Sennah, K. Experimental and numerical assessment of reinforced concrete beams with disturbed depth. Int. J. Concr. Struct. Mater. 2019, 13, 55. [Google Scholar] [CrossRef]
  46. Fayed, S.; Basha, A.; Elsamak, G. Behavior of RC stepped beams with different configurations: An experimental and numerical study. Struct. Concr. 2020, 21, 2601–2627. [Google Scholar] [CrossRef]
  47. Shaheen, Y.B.; Eltaly, B.A.; Yousef, S.G.; Fayed, S. Structural performance of ferrocement beams incorporating longitudinal hole filled with lightweight concrete. Int. J. Concr. Struct. Mater. 2023, 17, 21. [Google Scholar] [CrossRef]
  48. Rahal, K.N.; Hassan, W. Shear strength of plain concrete made of recycled low-strength concrete aggregates and natural aggregates. Constr. Build. Mater. 2021, 311, 125317. [Google Scholar] [CrossRef]
  49. Imjai, T.; Kefyalew, F.; Aosai, P.; Garcia, R.; Kim, B.; Abdalla, H.M.; Raman, S.N. A new equation to predict the shear strength of recycled aggregate concrete Z push-off specimens. Cem. Concr. Res. 2023, 169, 107181. [Google Scholar] [CrossRef]
  50. Setkit, M.; Leelatanon, S.; Imjai, T.; Garcia, R.; Limkatanyu, S. Prediction of Shear Strength of Reinforced Recycled Aggregate Concrete Beams without Stirrups. Buildings 2021, 11, 402. [Google Scholar] [CrossRef]
Figure 1. Details of the shear specimens. (a) Schematic diagram (dimensions are in mm). (b) Preparing specimens.
Buildings 15 01420 g001
Figure 2. Shear test.
Buildings 15 01420 g002
Figure 3. Failure modes of the tested samples.
Buildings 15 01420 g003
Figure 4. Analysis of the shear failure. (a) Two L-shaped pieces after test. (b) Shear plane after test.
Buildings 15 01420 g004
Figure 5. Ʈ-Δ curves of group A.
Buildings 15 01420 g005
Figure 6. Ʈ-Δ curves of group B.
Buildings 15 01420 g006
Figure 7. Ʈ-Δ curves of group C.
Buildings 15 01420 g007
Figure 8. Ʈ-Δ curves of group D.
Buildings 15 01420 g008
Figure 9. Shear strength of tested mixtures.
Buildings 15 01420 g009
Figure 10. Shear slip of tested mixtures.
Buildings 15 01420 g010
Figure 11. Shear stiffness of tested mixtures.
Buildings 15 01420 g011
Figure 12. Predicted against actual values for shear strength of the presented mixes [48].
Buildings 15 01420 g012
Table 1. Gradation distribution of the materials utilized.
Size (mm)Passing of C (%)Passing of R (%)Passing of Sand (%)Passing of F (%)Passing of CN (%)
12 mm100100----100
9.75 mm5382----78
4.75 mm124010010015
2.3 mm0091600
1.20 mm0081390
0.9 mm0063320
0.42 mm009220
0.22 mm001140
0.07 mm00----0
Table 2. Physical properties of the materials used.
MaterialItem Weight
kg/m3
S.GParticles Size mm/mmAbsorption Ability to Water wt. (%)
Fine aggregateRiversand 1229.52.52.36/0.0751.65
Fine recycled glass (F)1397.32.872.36/0.0750.13
Coarse aggregateCoarse naturally aggregate (CN)14562.7310/21.5
R11502.7410/26
C15112.810/20.08
Table 3. Summary of the experimental findings.
GroupSamplefcu (MPa)Ʈm (MPa)Decline in Ʈm (%)Δm (mm)Gain in Δm (%)Stiffness (MPa/mm)Decline in Stiffness (%)
AF0275.720.002.200.004.760.00
F10234.9912.802.273.004.0415.10
F25224.8814.722.4210.003.6922.41
F50214.0329.502.9032.002.5247.00
F100153.4939.063.4858.401.8361.47
BC0275.720.002.20.004.760.00
C10224.3623.742.49.093.4926.58
C2020.43.9331.302.315.003.1234.54
C40183.8233.252.5415.452.7642.02
CR0-2020.43.930.002.310.003.120.00
R16-2019.043.676.732.549.962.6415.38
R40-2018.33.5110.742.716.882.3325.32
R80-2015.23.2716.673.342.861.7842.95
DR0-0275.720.002.20.004.760.00
R16-0225.169.802.388.183.9517.02
R40-021.25.0611.452.6420.003.5026.47
R80-016.54.4721.882.931.822.8041.18
Table 4. Results of shear strength using proposed equation.
Mix IDfcu (MPa)Ʈm (exp) (MPa)F (%)C (%)R (%)Ʈm (theo) (MPa)Ʈm (theo)/Ʈm (exp)
F0275.720005.580.98
F10234.9910005.051.01
F25224.8825004.800.98
F50214.0350004.461.11
F100153.49100003.380.97
C0275.720005.580.98
C10224.3601004.661.07
C2020.43.9302004.121.05
C40183.8204003.190.84
R0-2020.43.9302004.121.05
R16-2019.043.67020163.961.08
R40-2018.33.51020403.841.09
R80-2015.23.27020803.431.05
R0-0275.720005.580.98
R16-0225.1600165.000.97
R40-021.25.0600404.870.96
R80-016.54.4700804.230.95
Disclaimer/Publisher’s Note: The statements, opinions and data contained in all publications are solely those of the individual author(s) and contributor(s) and not of MDPI and/or the editor(s). MDPI and/or the editor(s) disclaim responsibility for any injury to people or property resulting from any ideas, methods, instructions or products referred to in the content.

