
Transforming Waste Red-Bed Mudstone into Sustainable Controlled Low-Strength Materials: Mix Design for Enhanced Engineering Performance


Abstract
:1. Introduction
2. Materials and Methods
2.1. Materials
2.2. Mix Proportions
- (1)
- The ratio of the mass of cement to the mass of soil particles, termed the cement-to-soil ratio (C/S).
- (2)
- The ratio of the mass of water to the total mass of solid particles, referred to as the water-to-solid ratio (W/S).
2.3. Test Methods
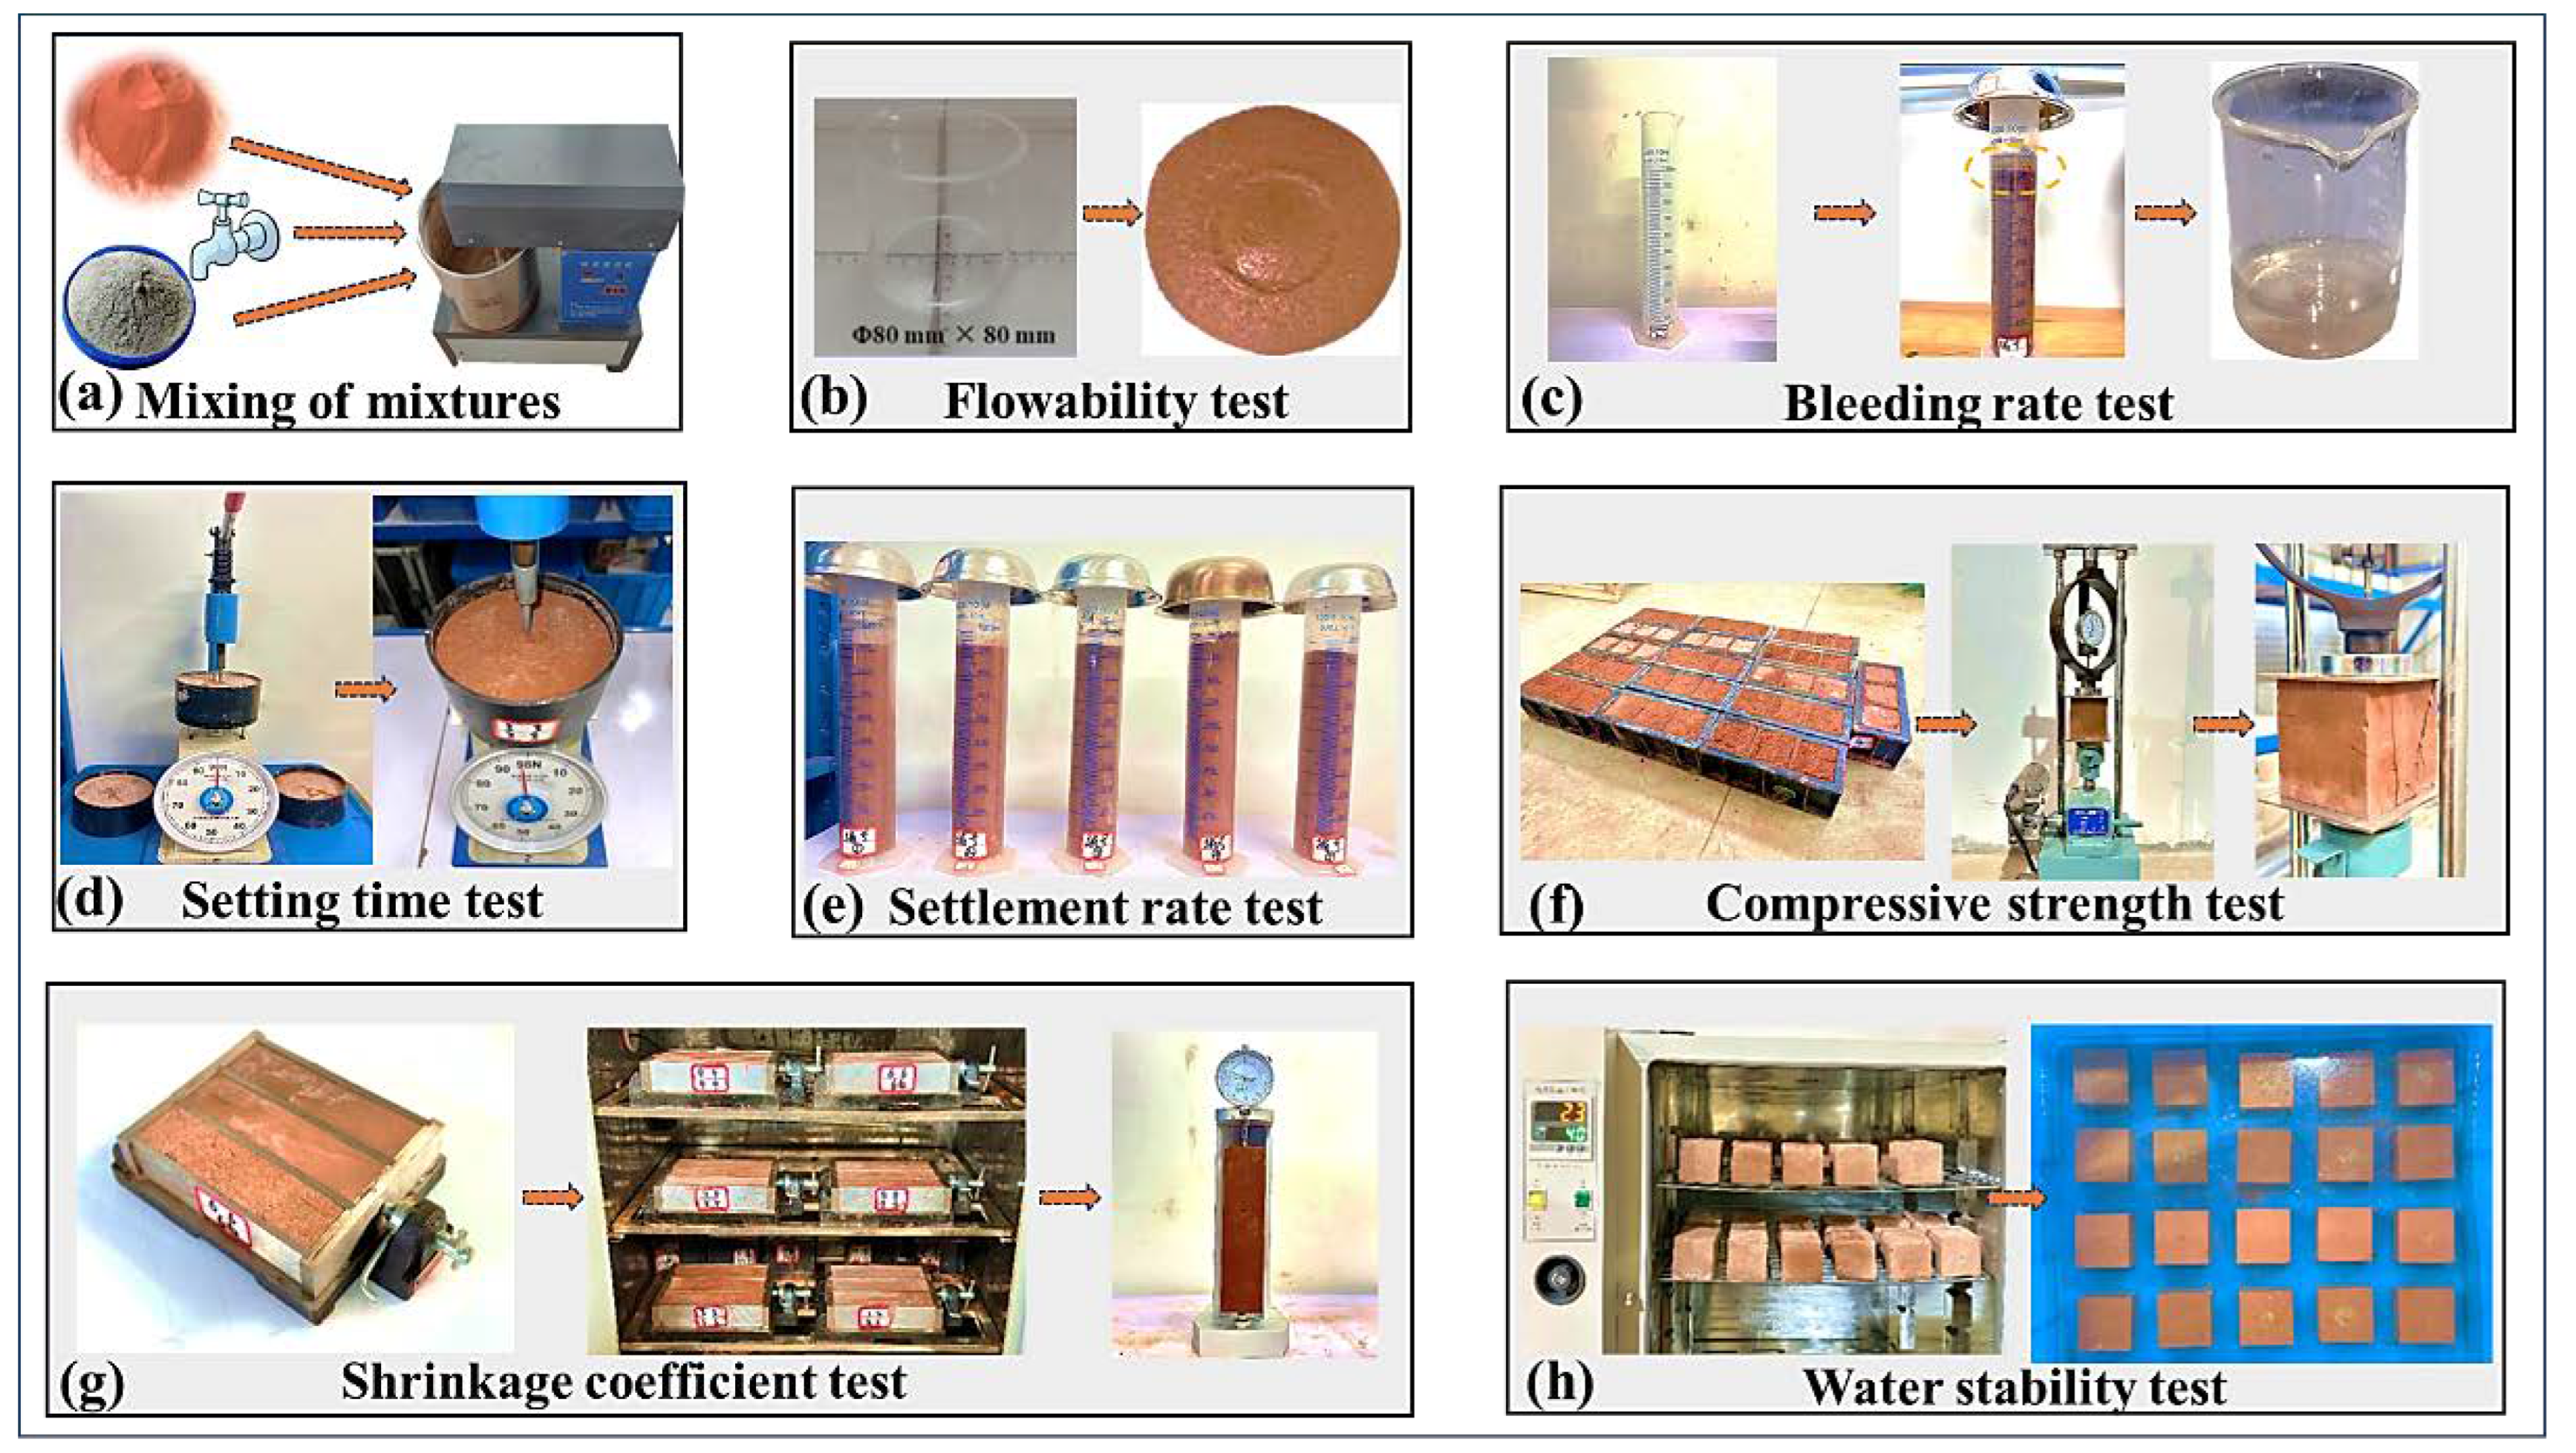
2.3.1. Types of Tests
2.3.2. Testing of Fresh Mix Properties
- (1)
- Flowability test
- (2)
- Bleeding rate test
- (3)
- Setting time test
- (4)
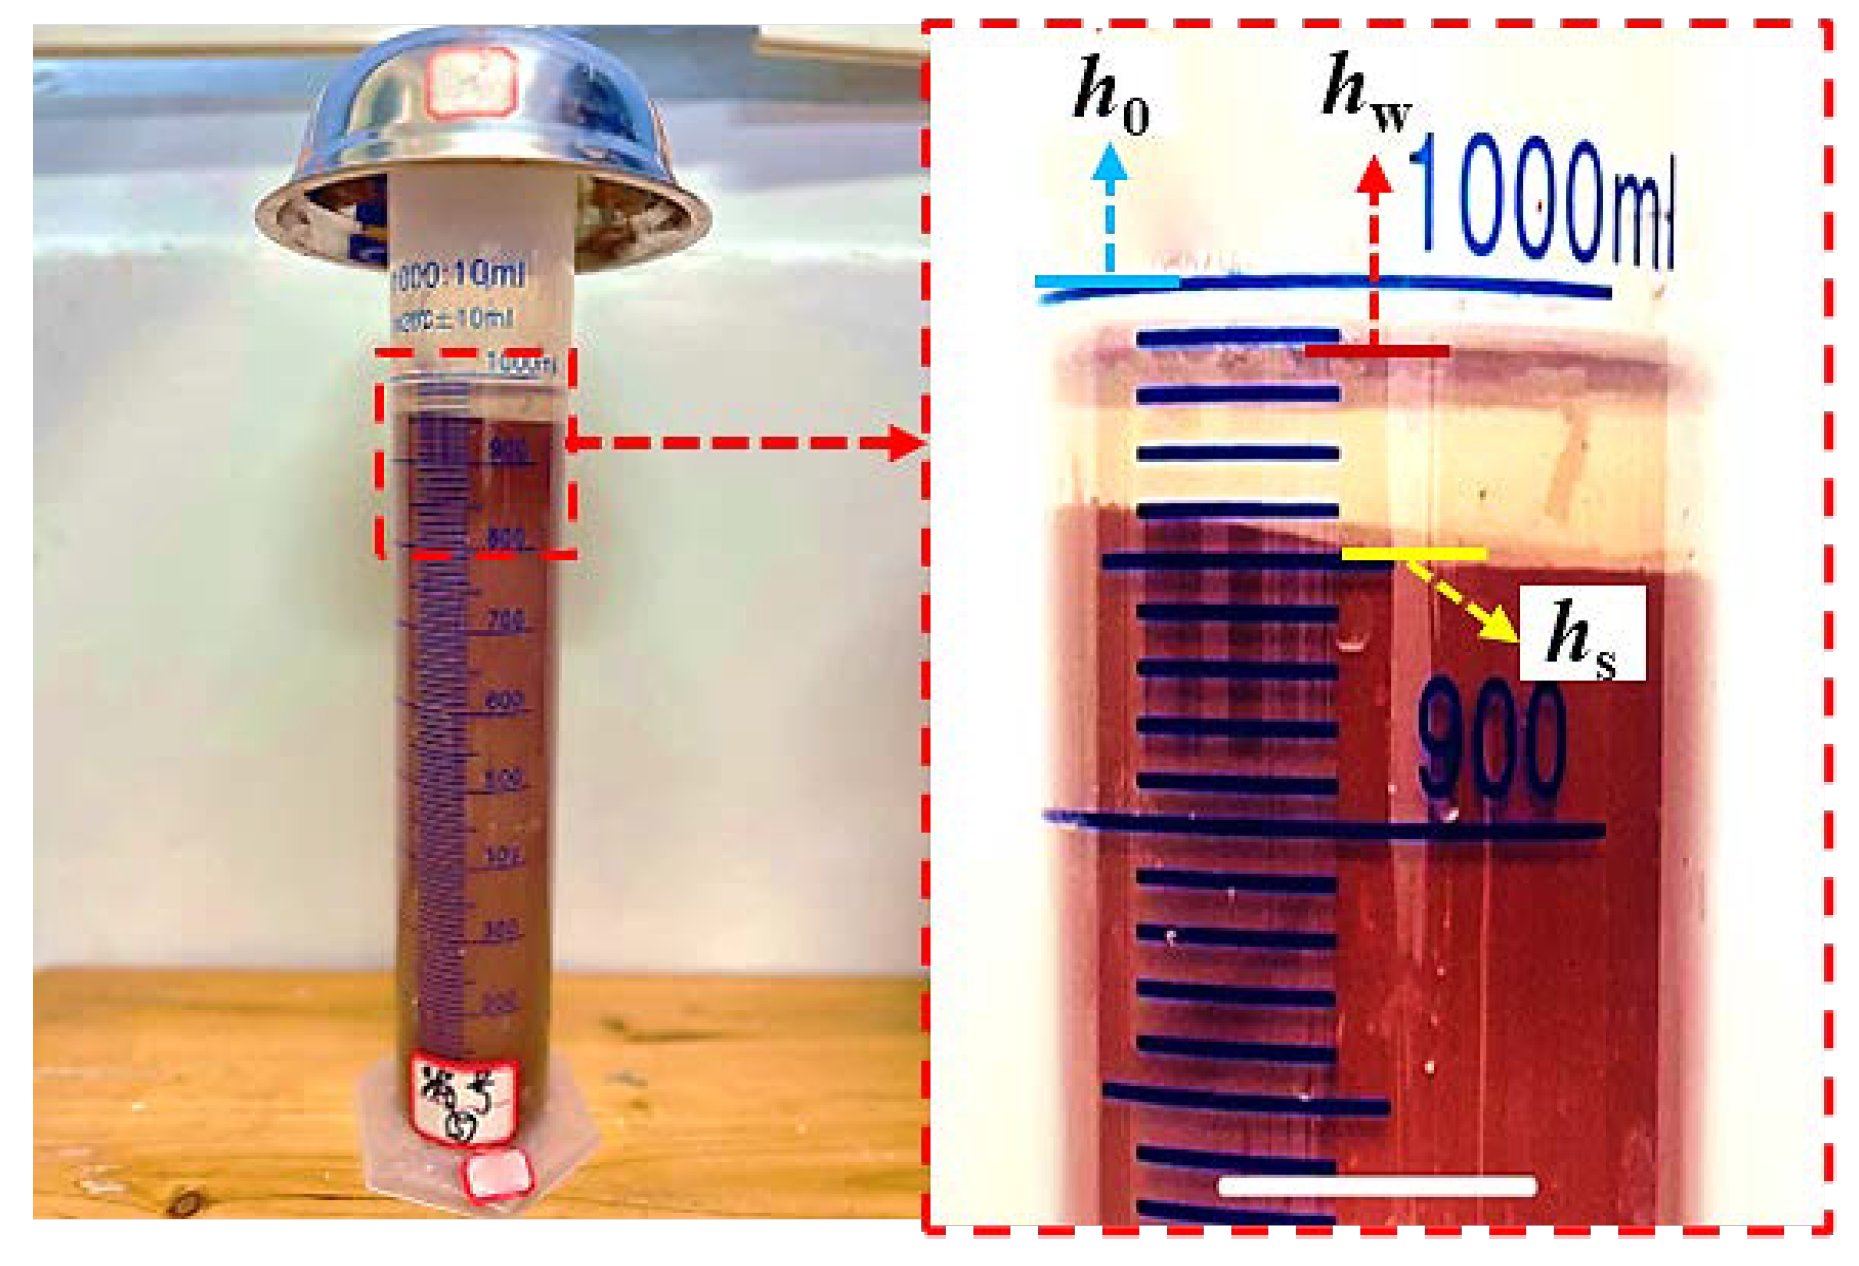
- Subsidence rate test
2.3.3. Testing of Hardened Mix Properties
- (1)
- Compressive strength test
- (2)
- Drying shrinkage rate test
- (3)
- Water stability test
3. Results and Discussion
3.1. Properties of the Fresh Mix
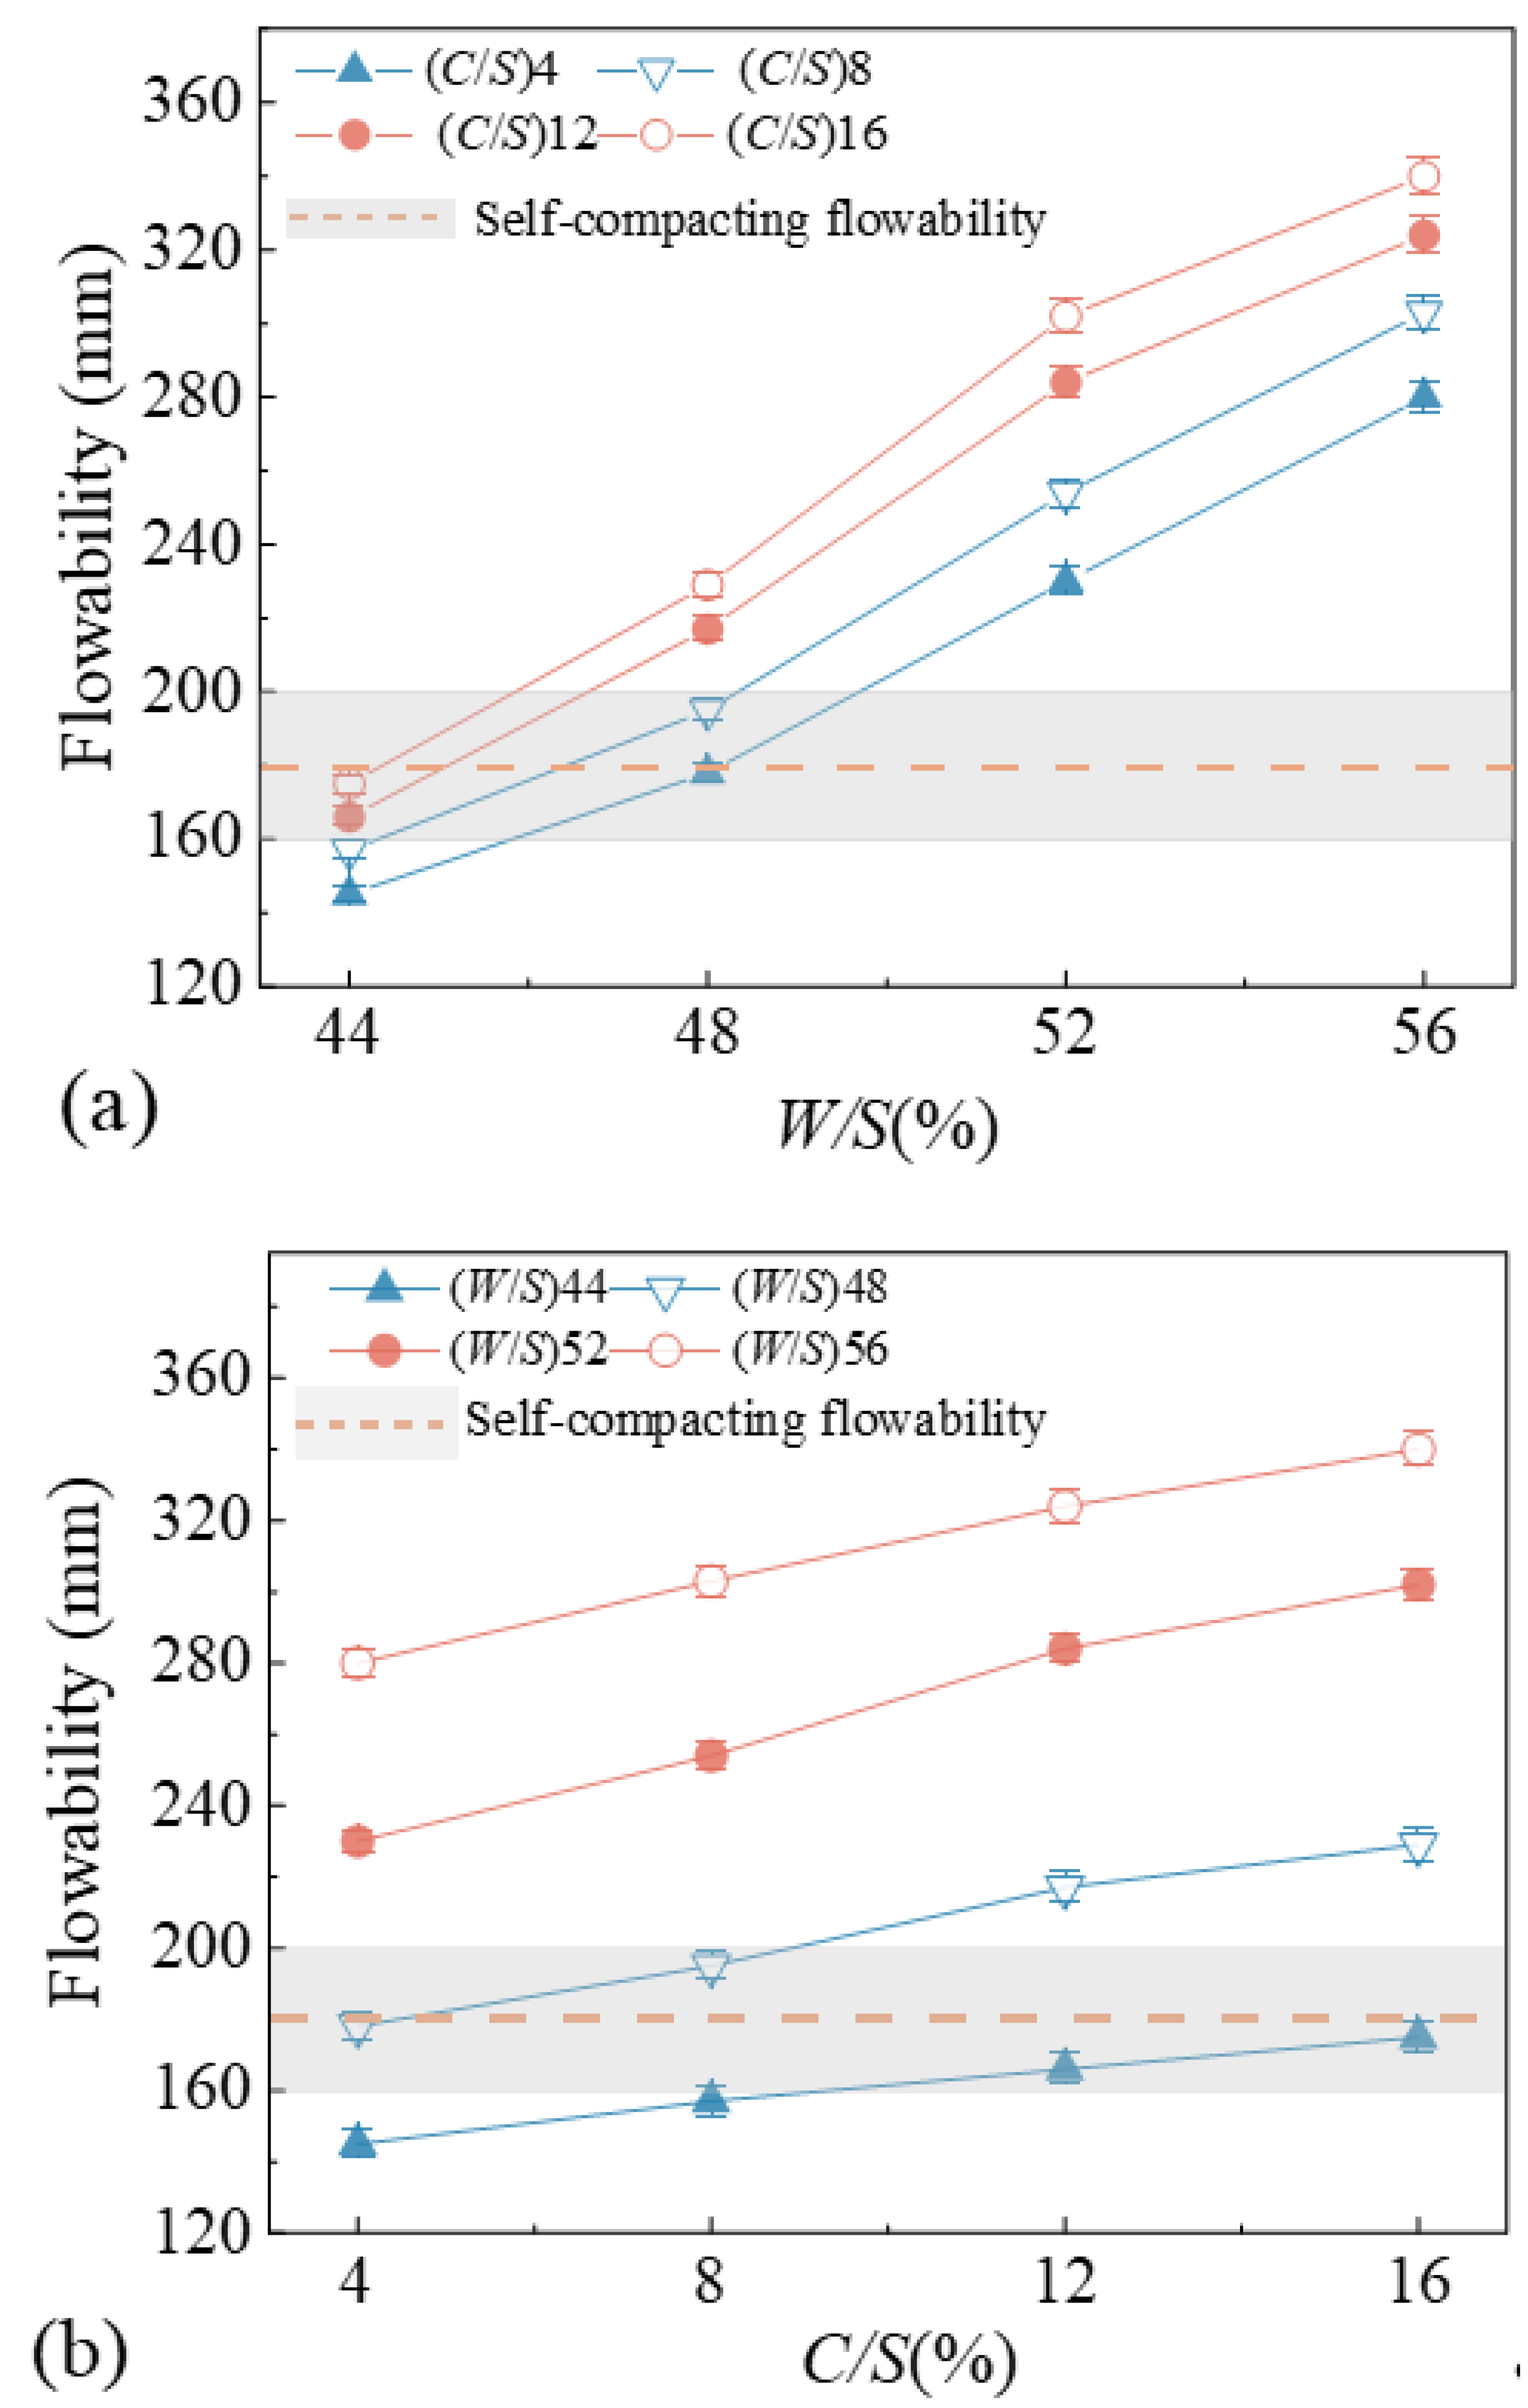
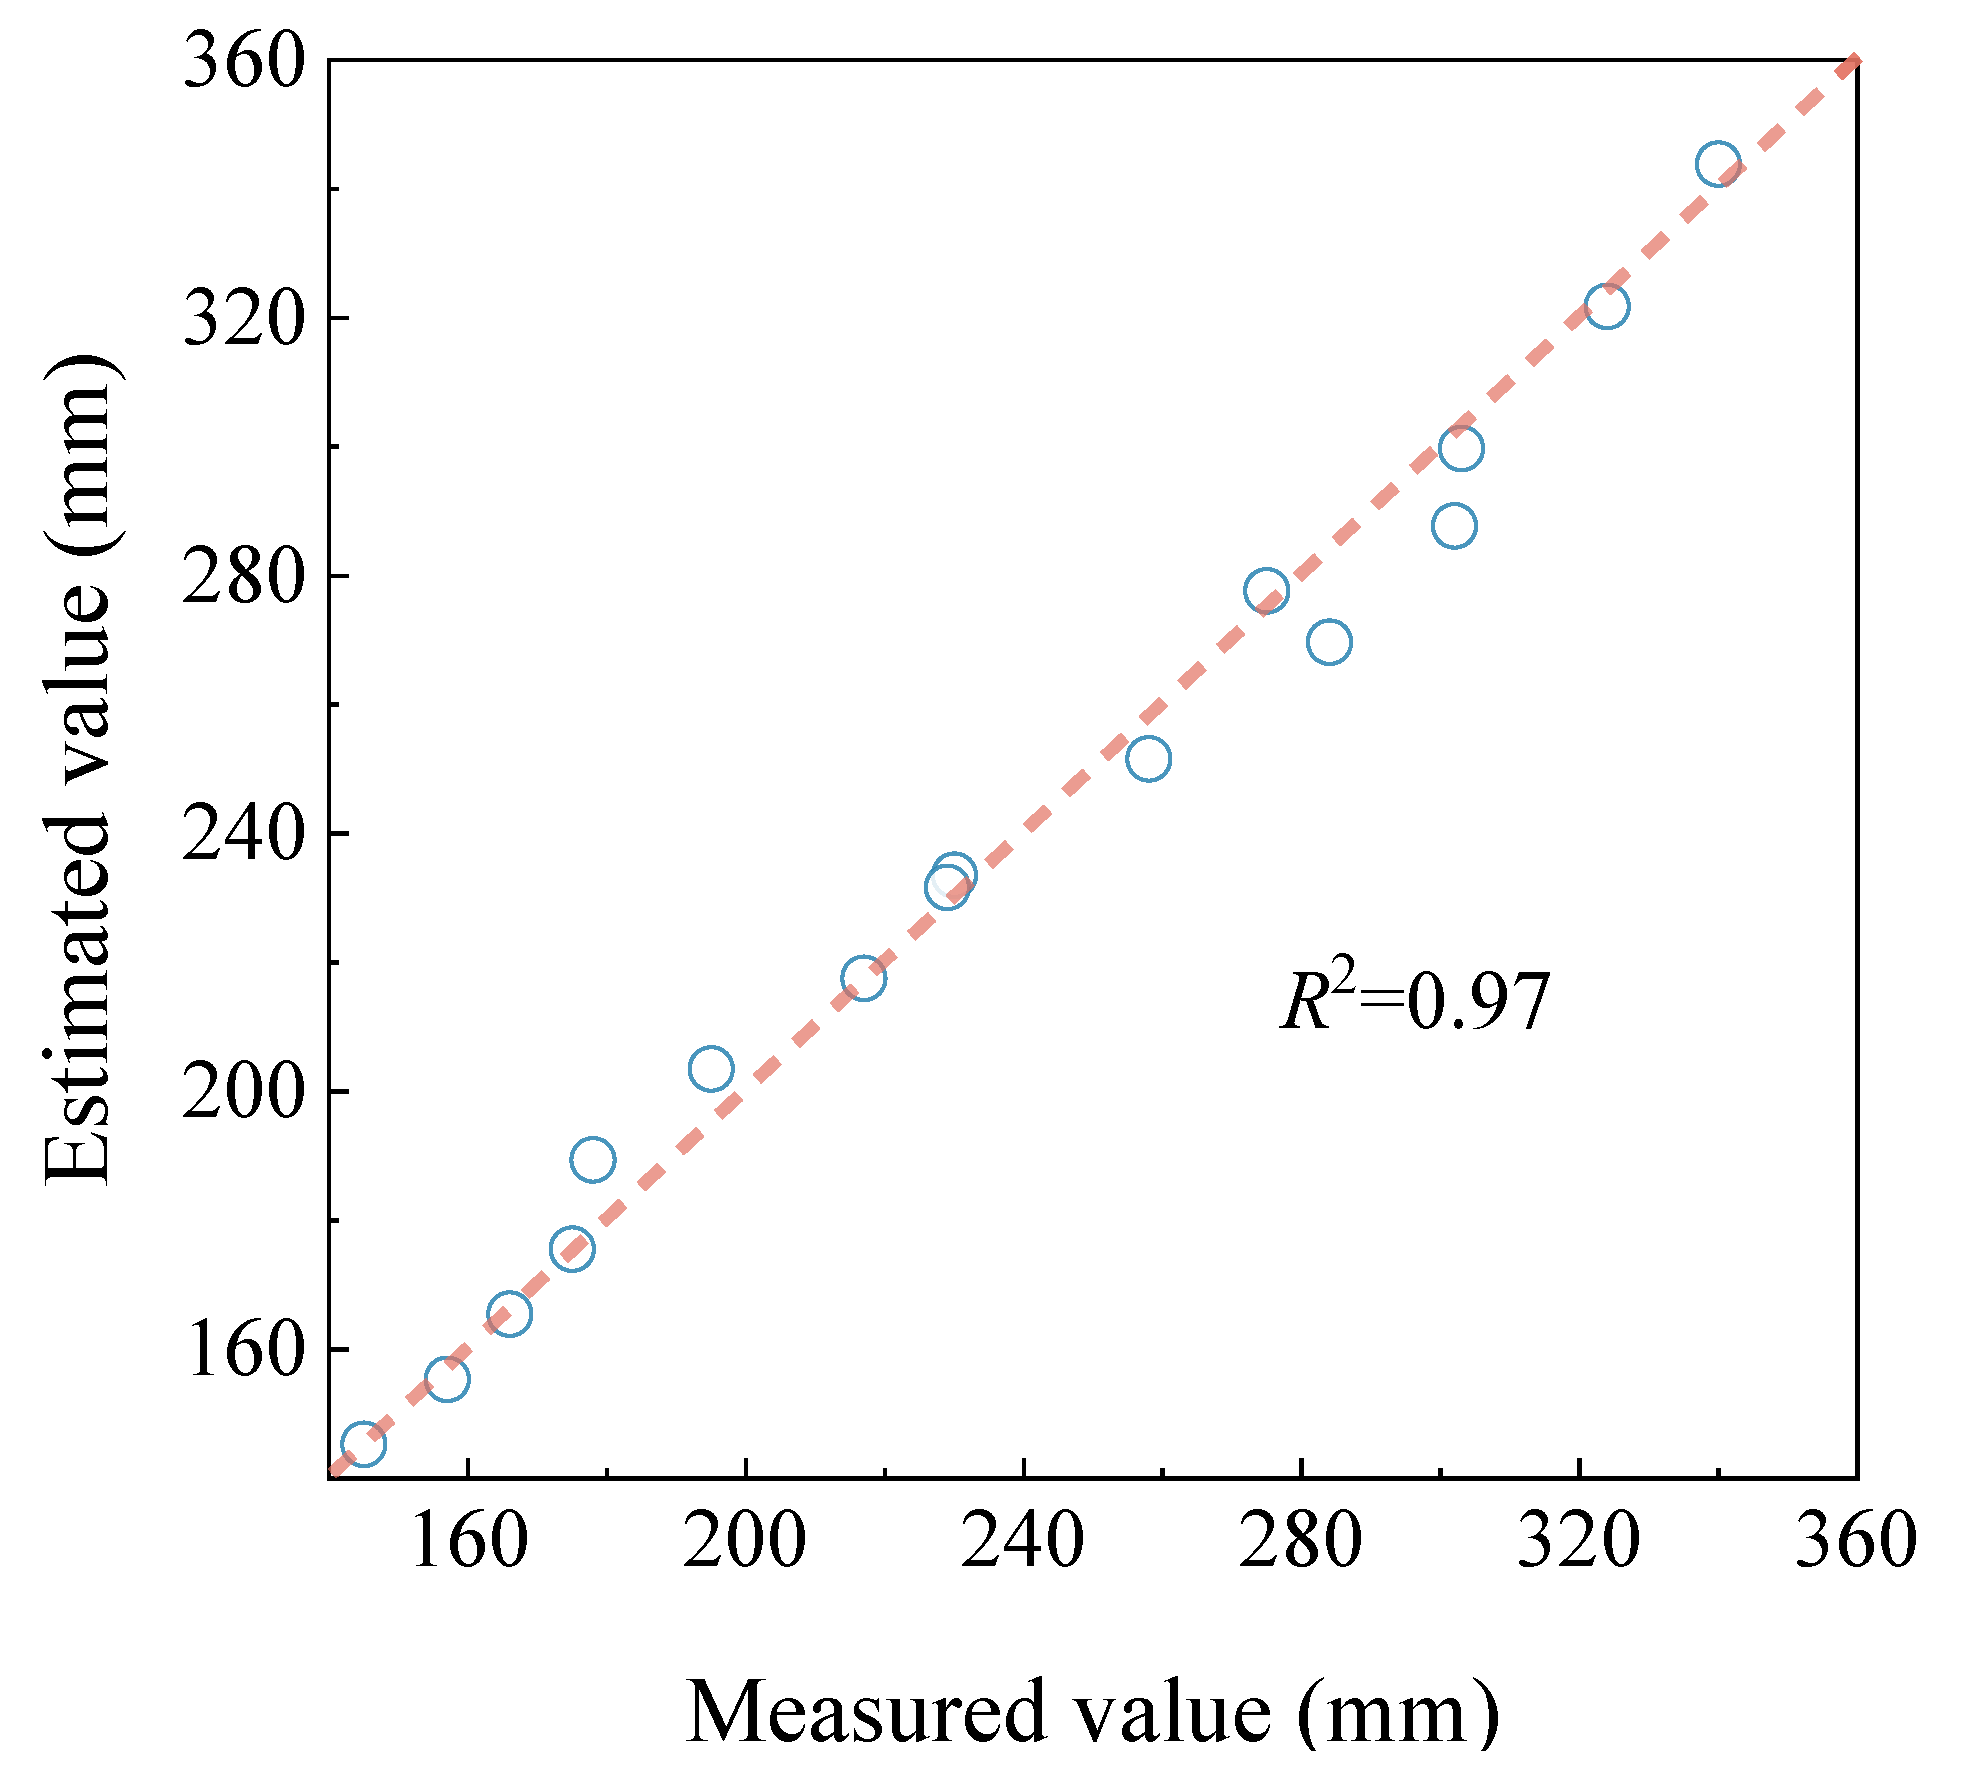
3.1.1. Flowability
- (1)
- Initial flowability
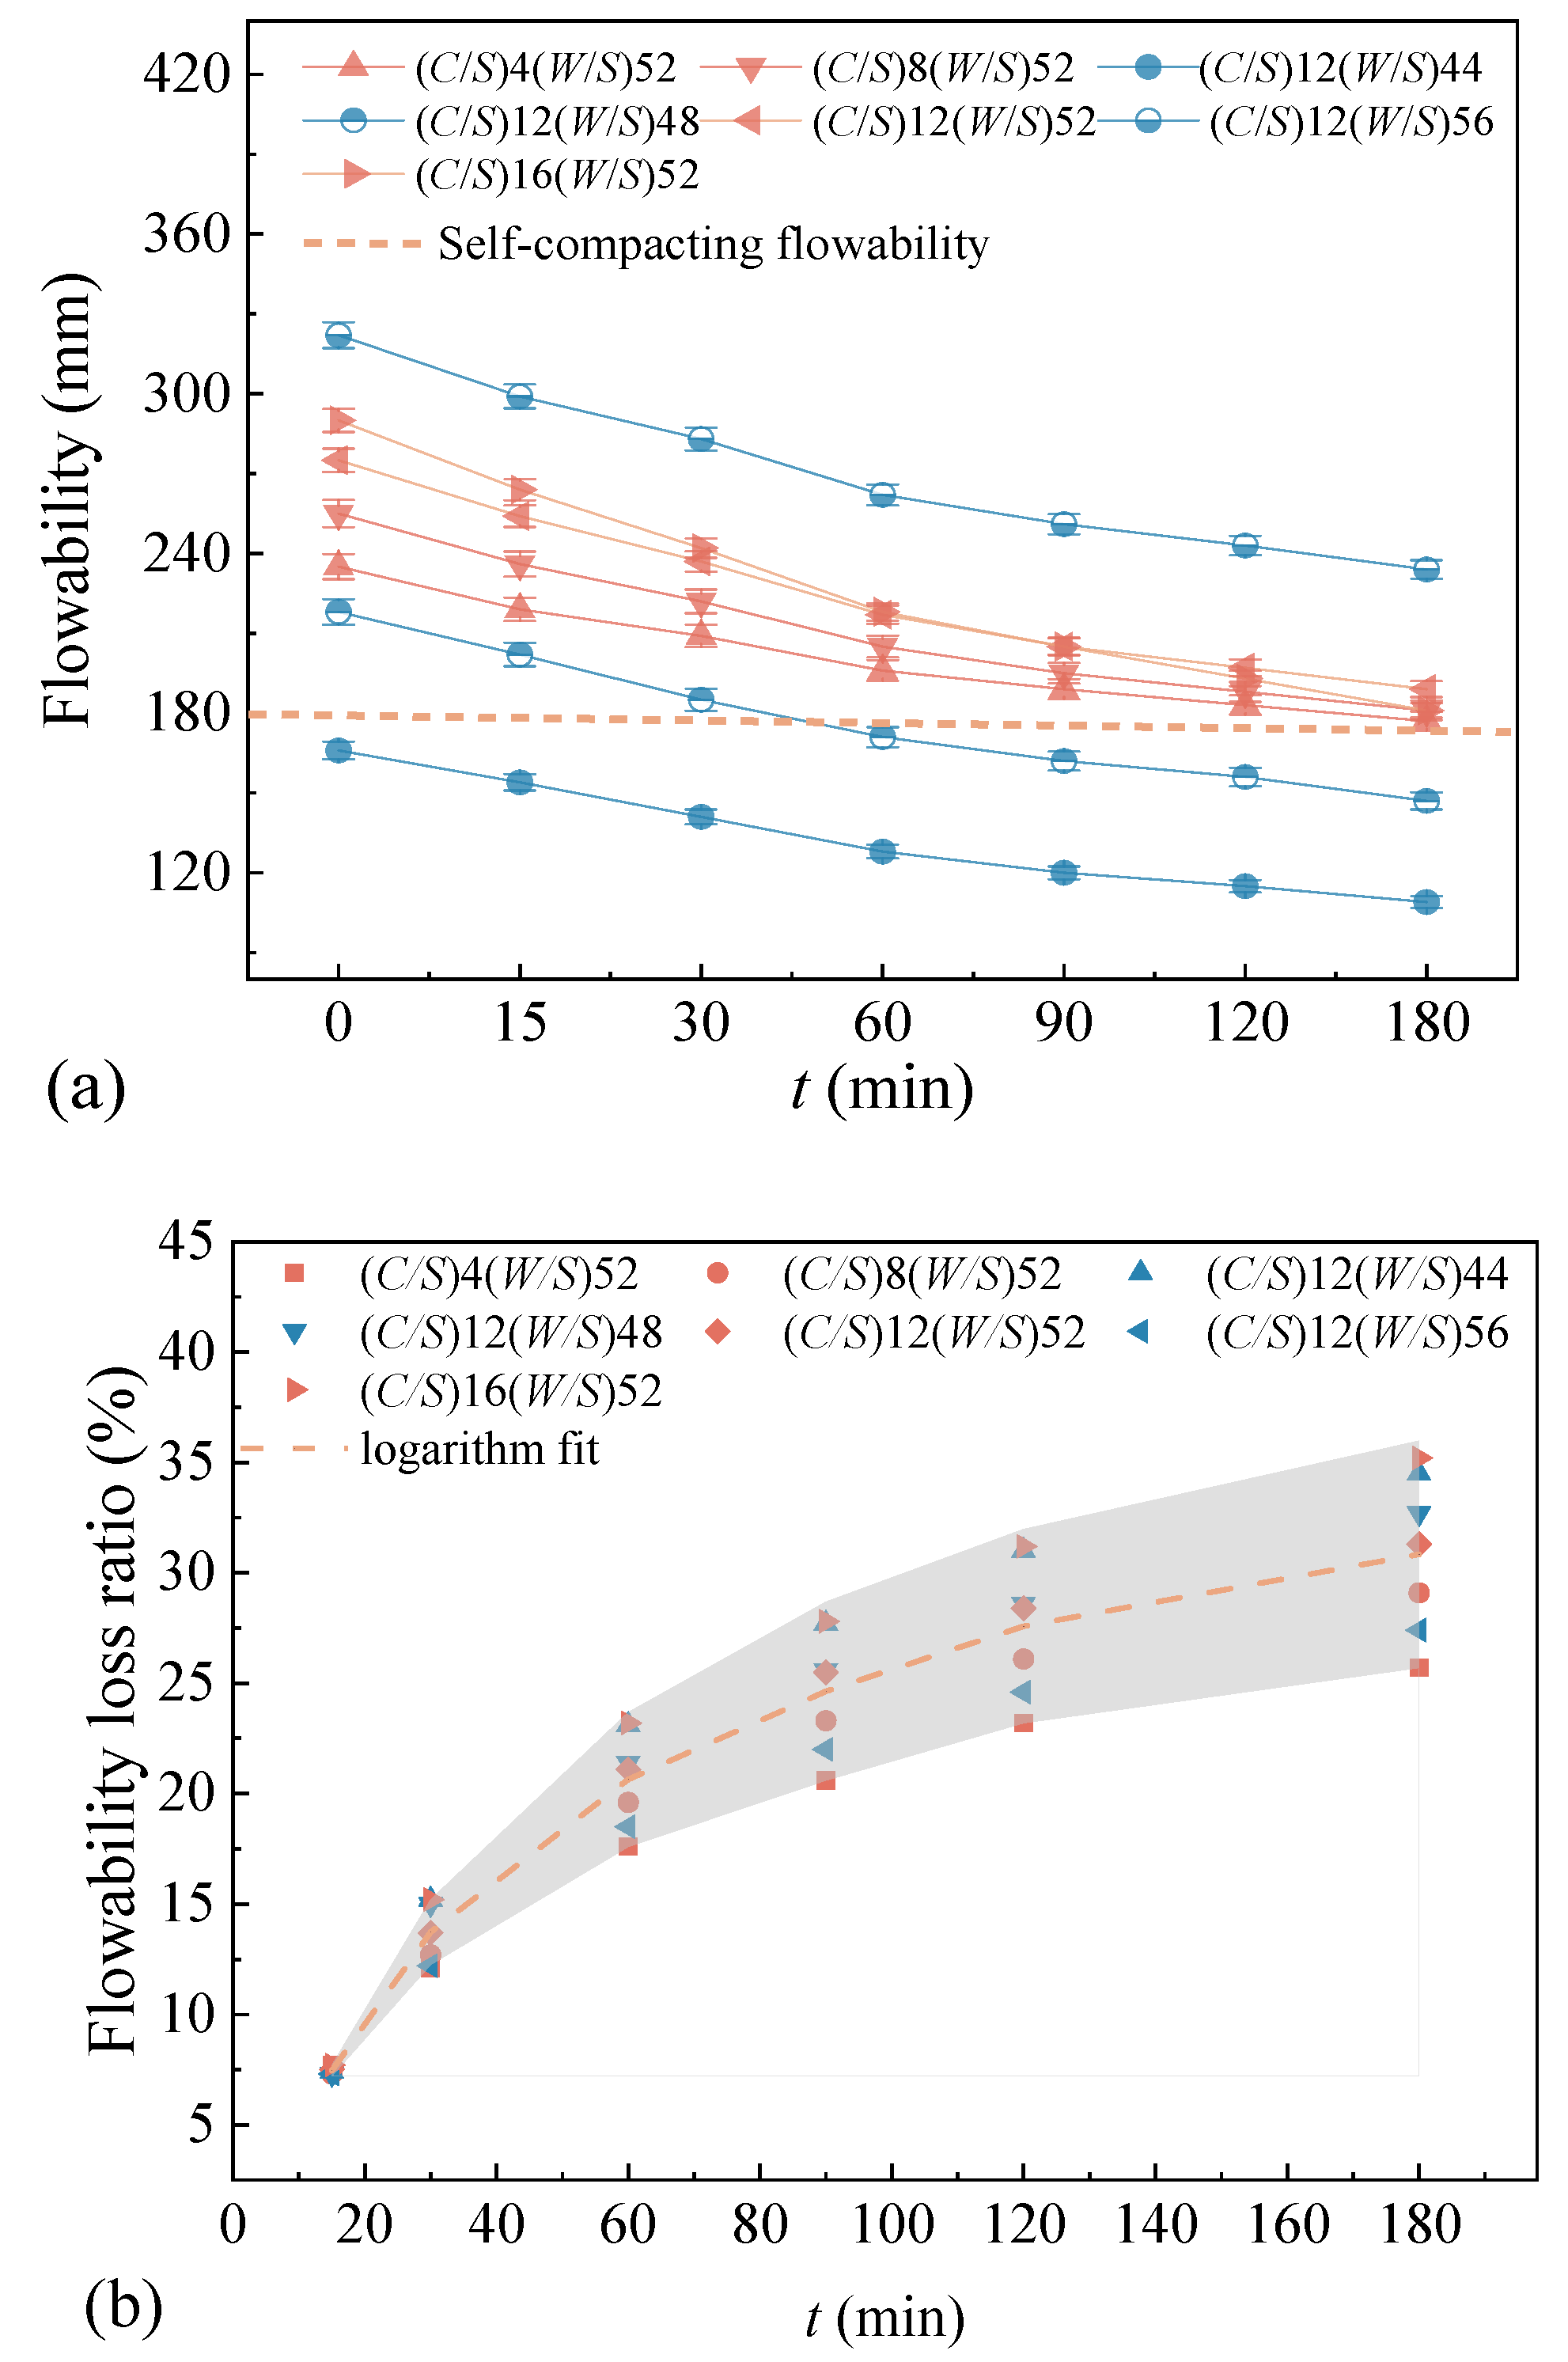
- (2)
- Time-dependent variation in flowability
3.1.2. Bleeding Rate
3.1.3. Setting Time
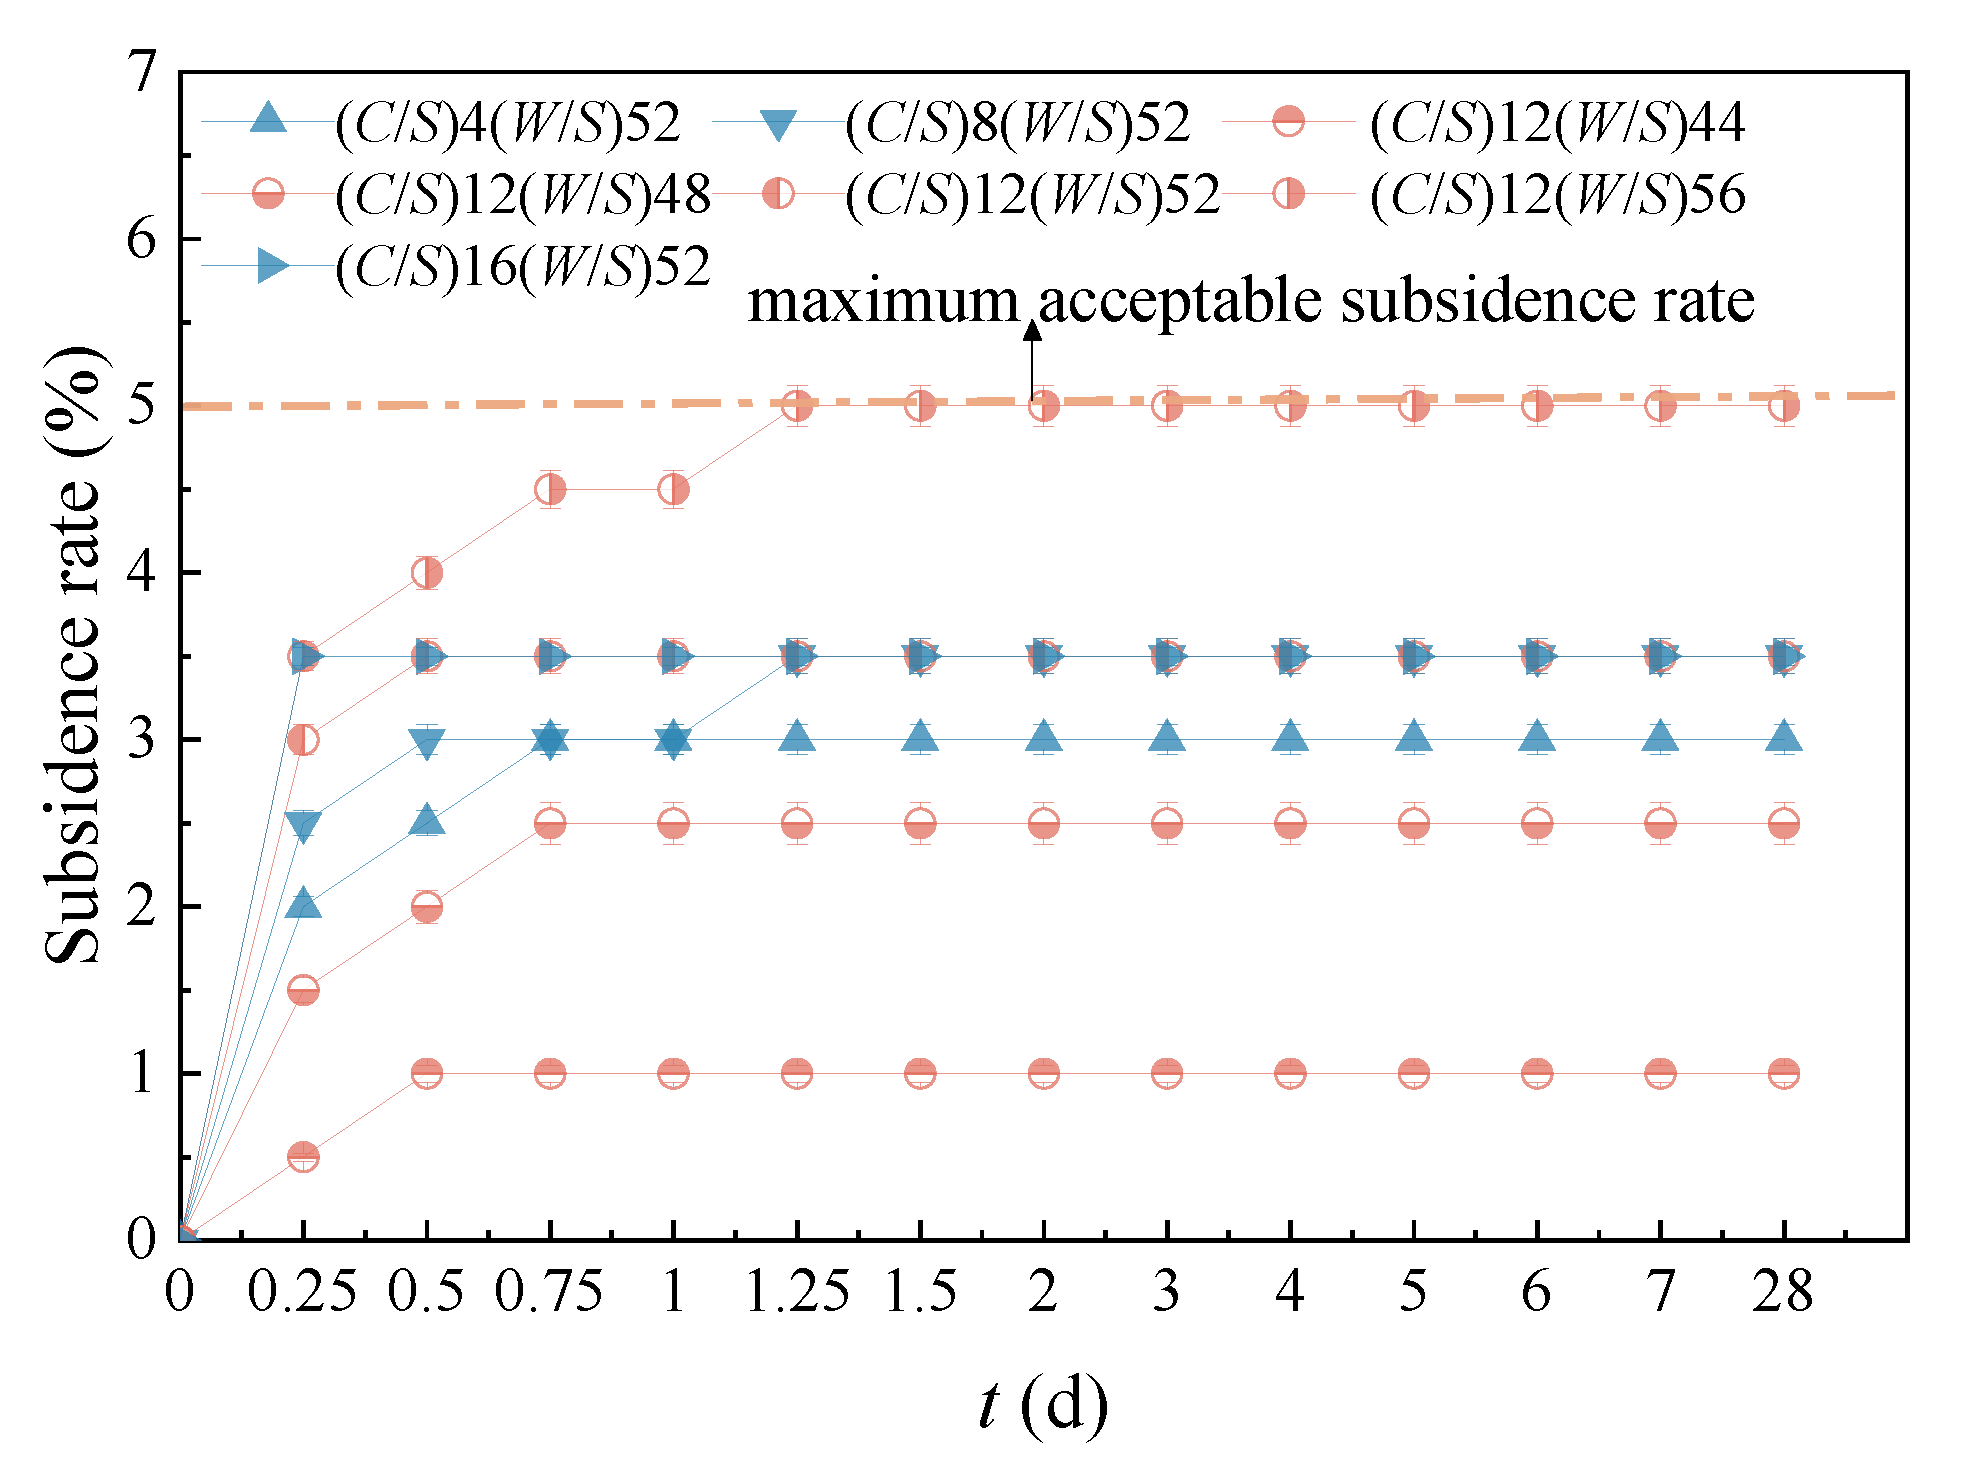
3.1.4. Subsidence Rate
3.2. Properties of the Hardened Mix
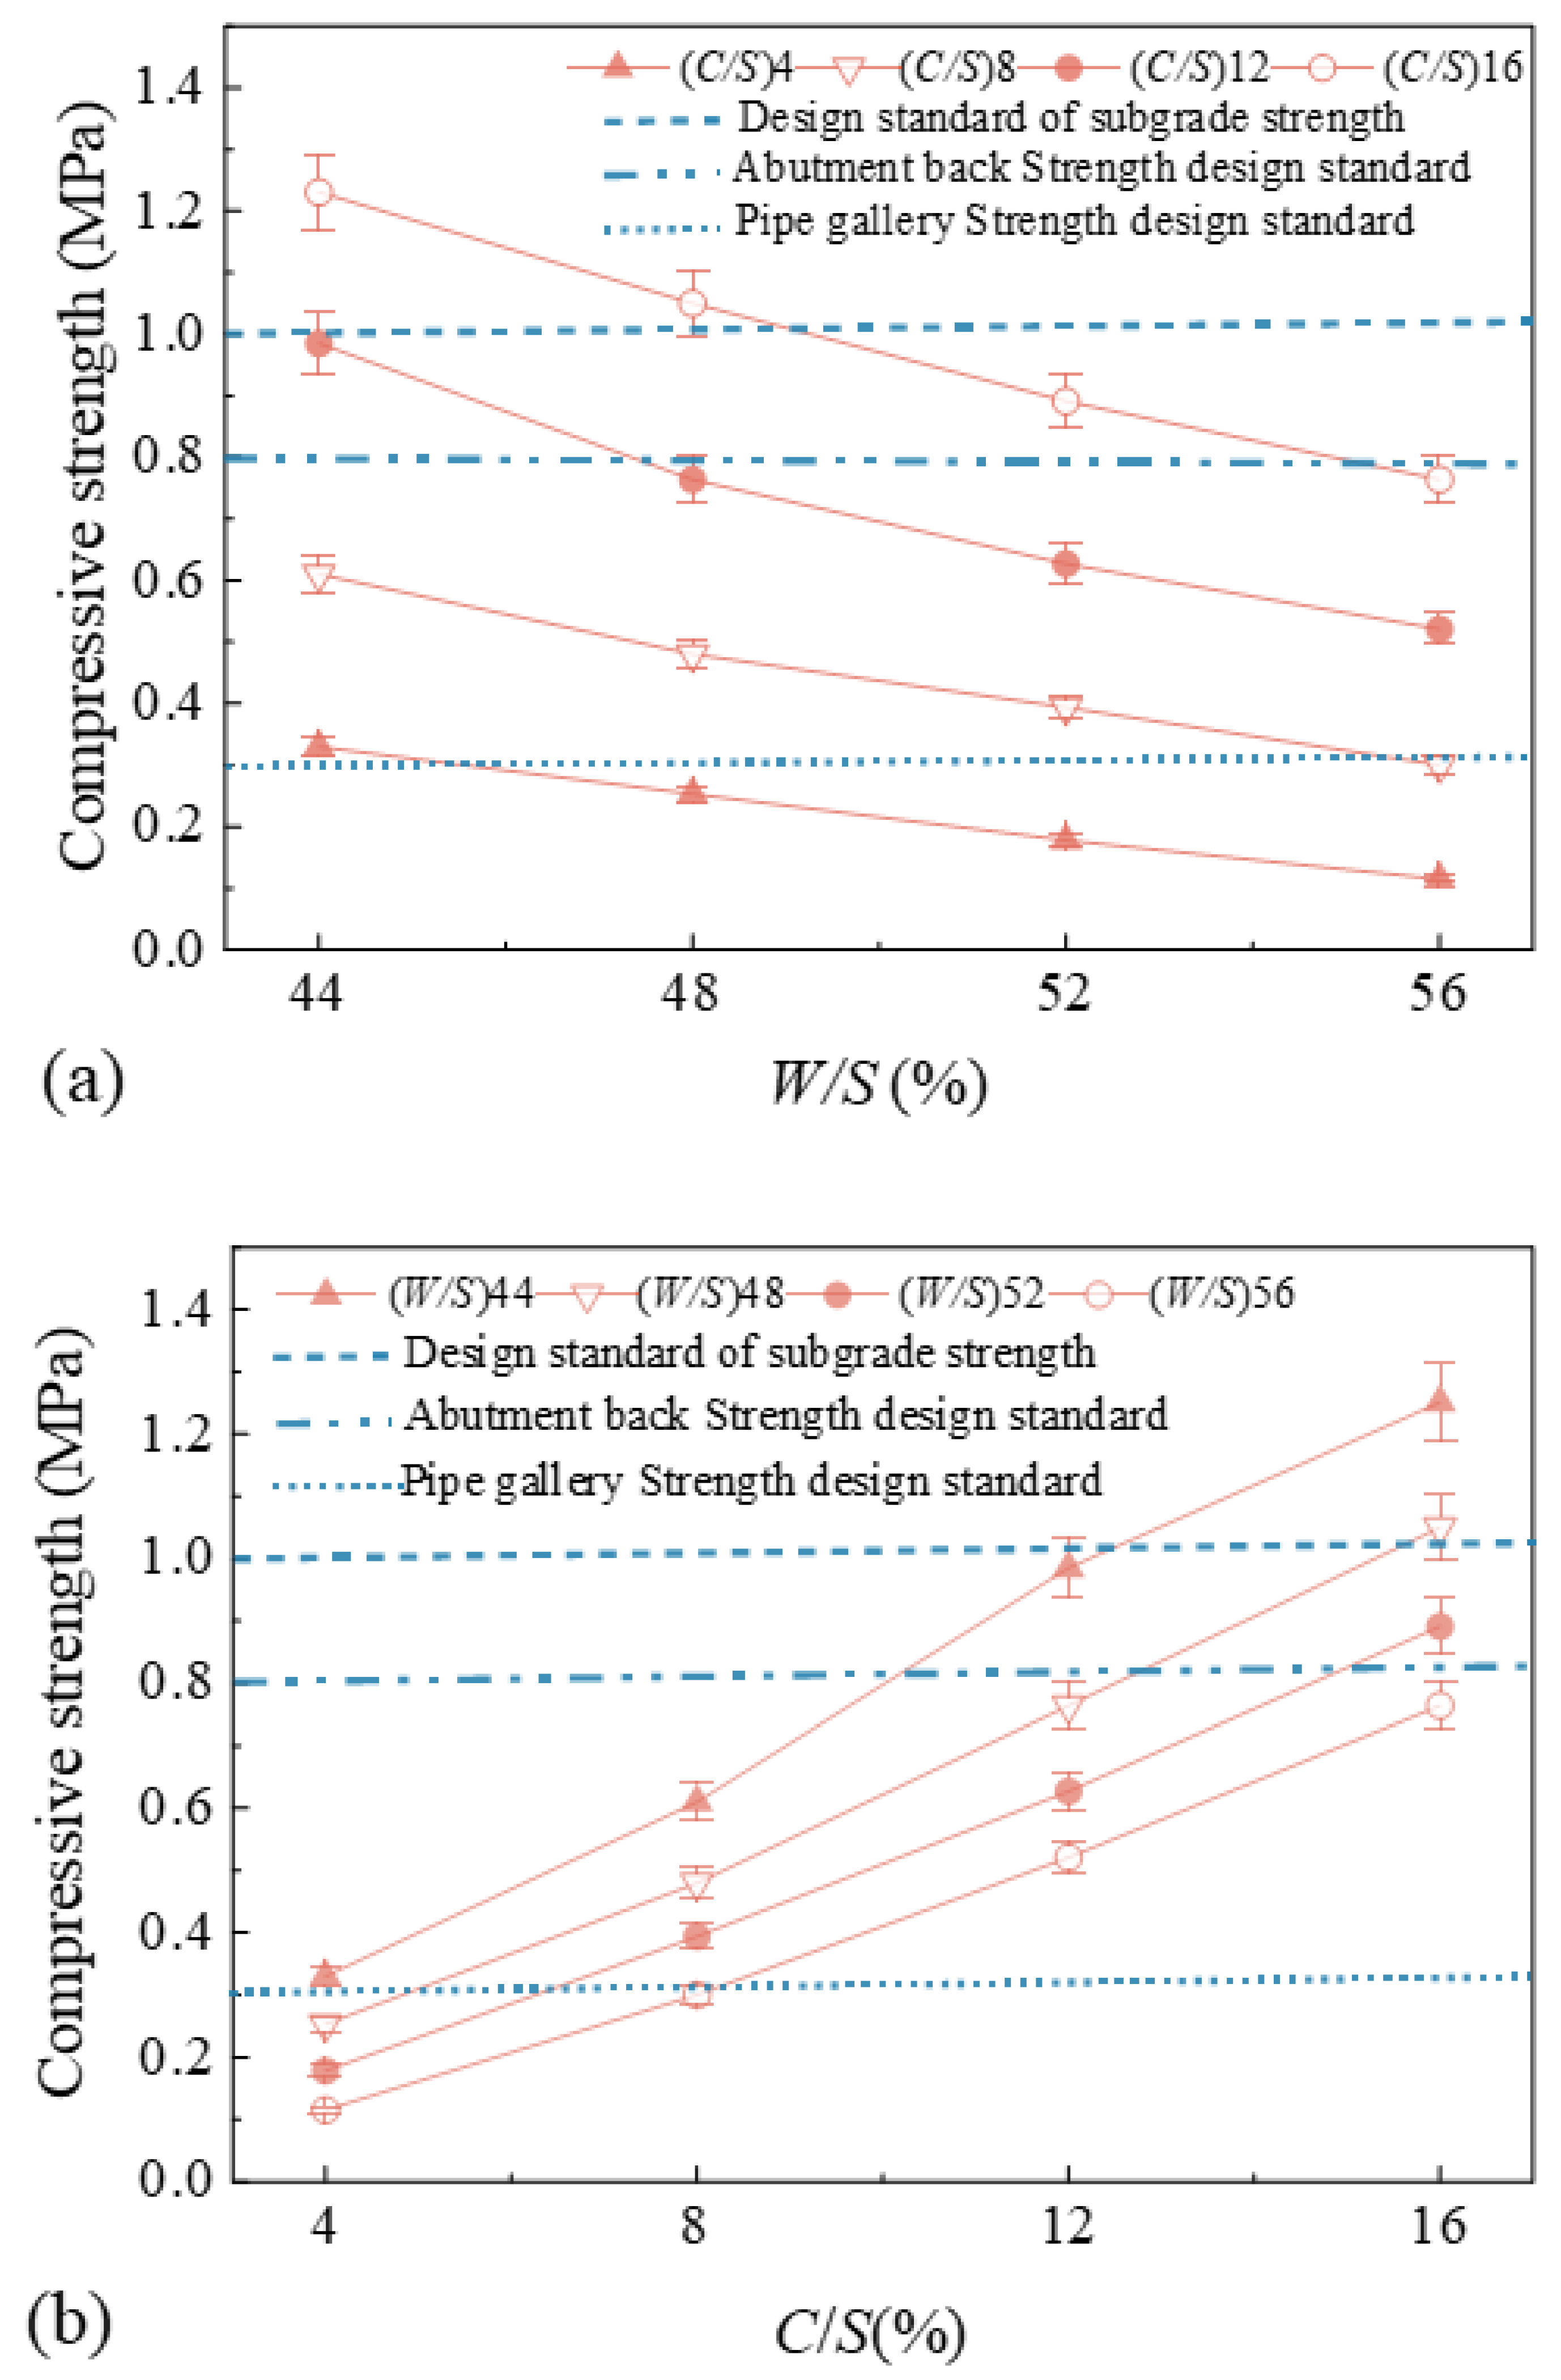
3.2.1. Compressive Strength
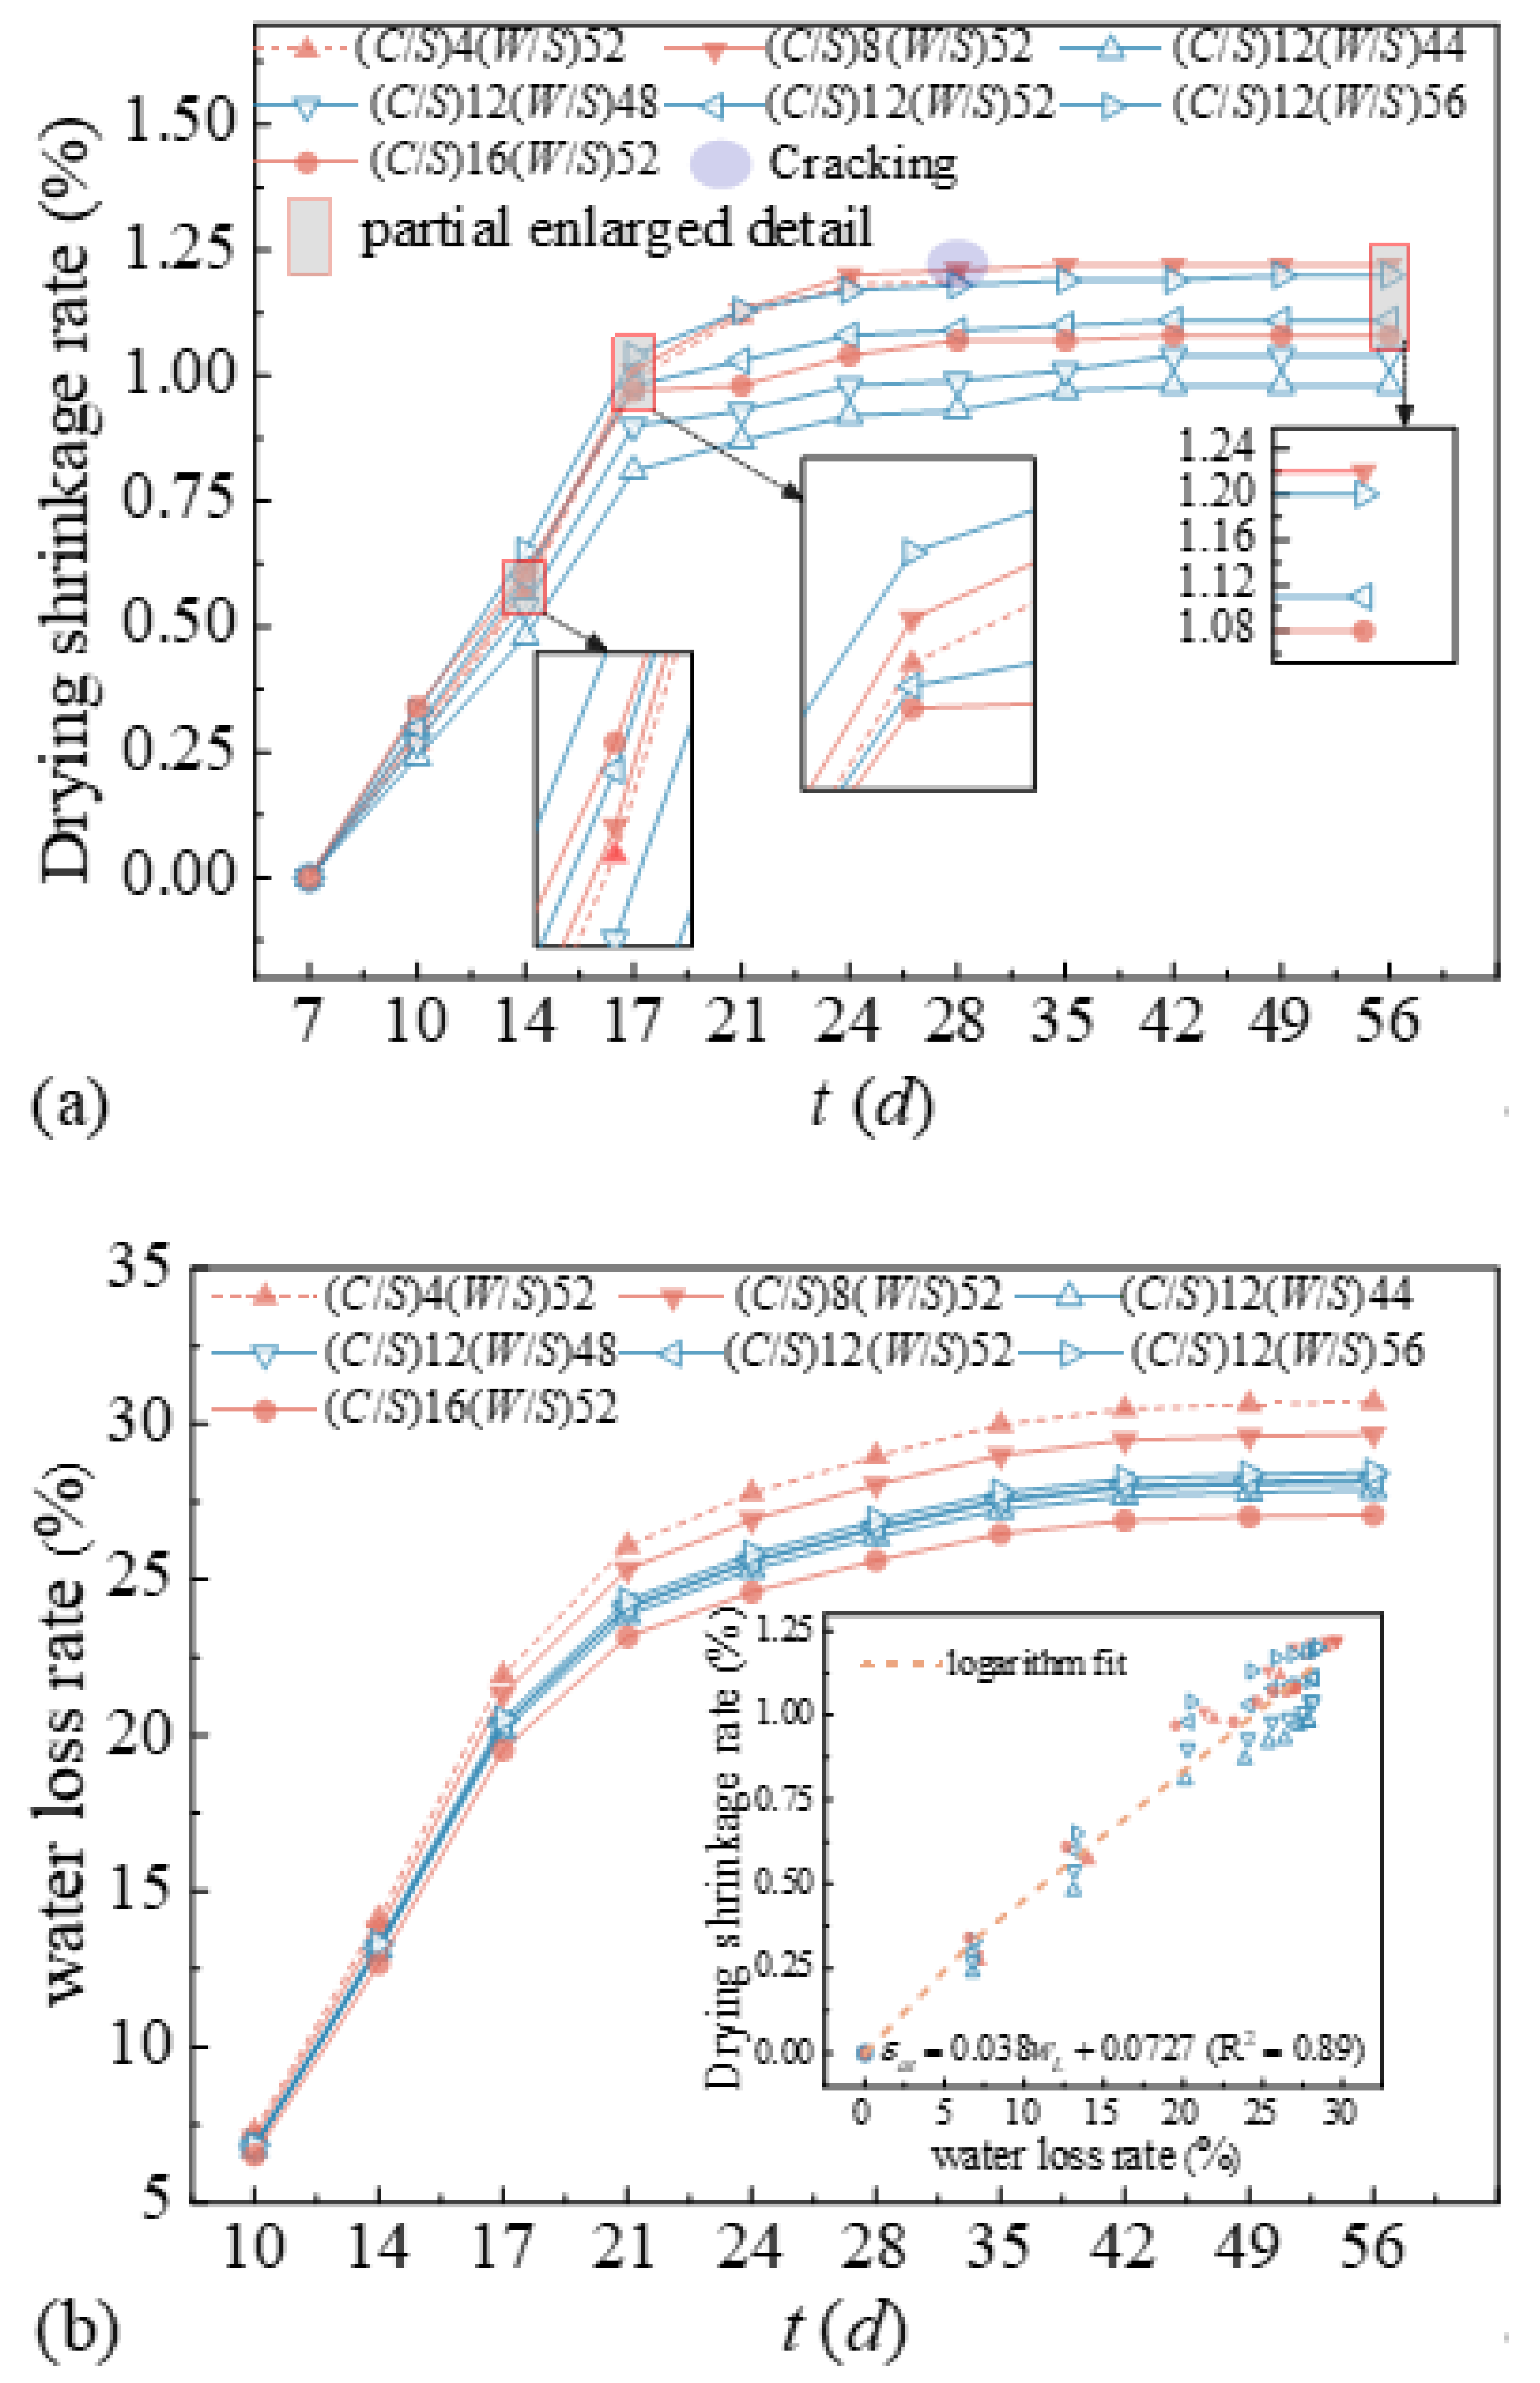
3.2.2. Drying Shrinkage Rate
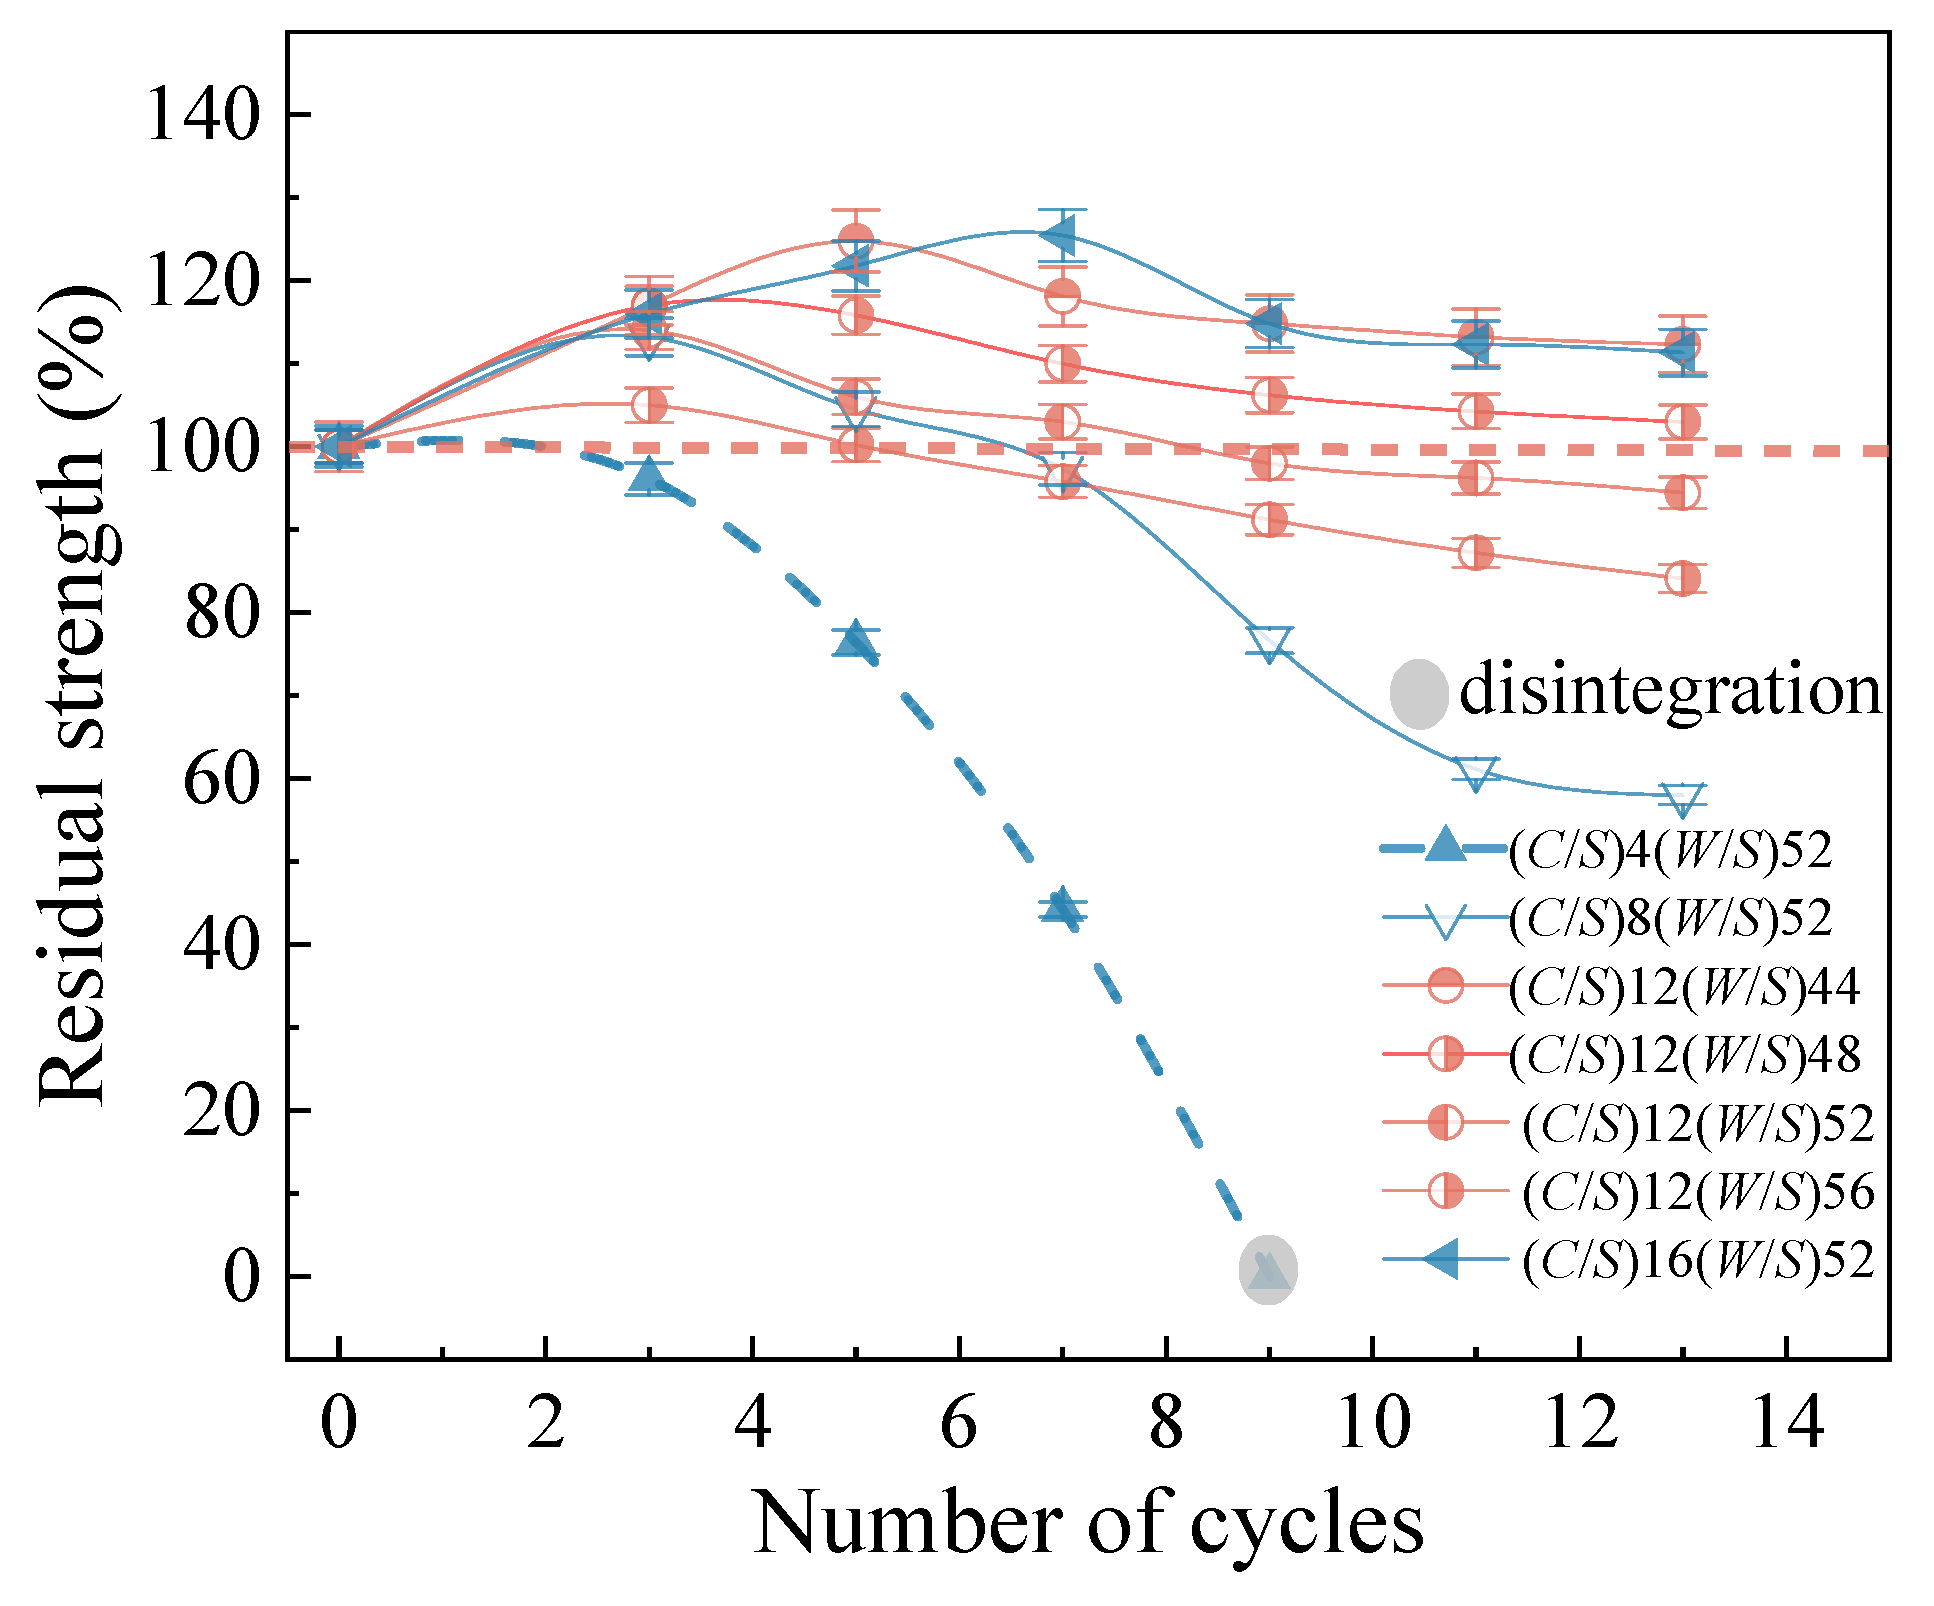
3.2.3. Water Stability
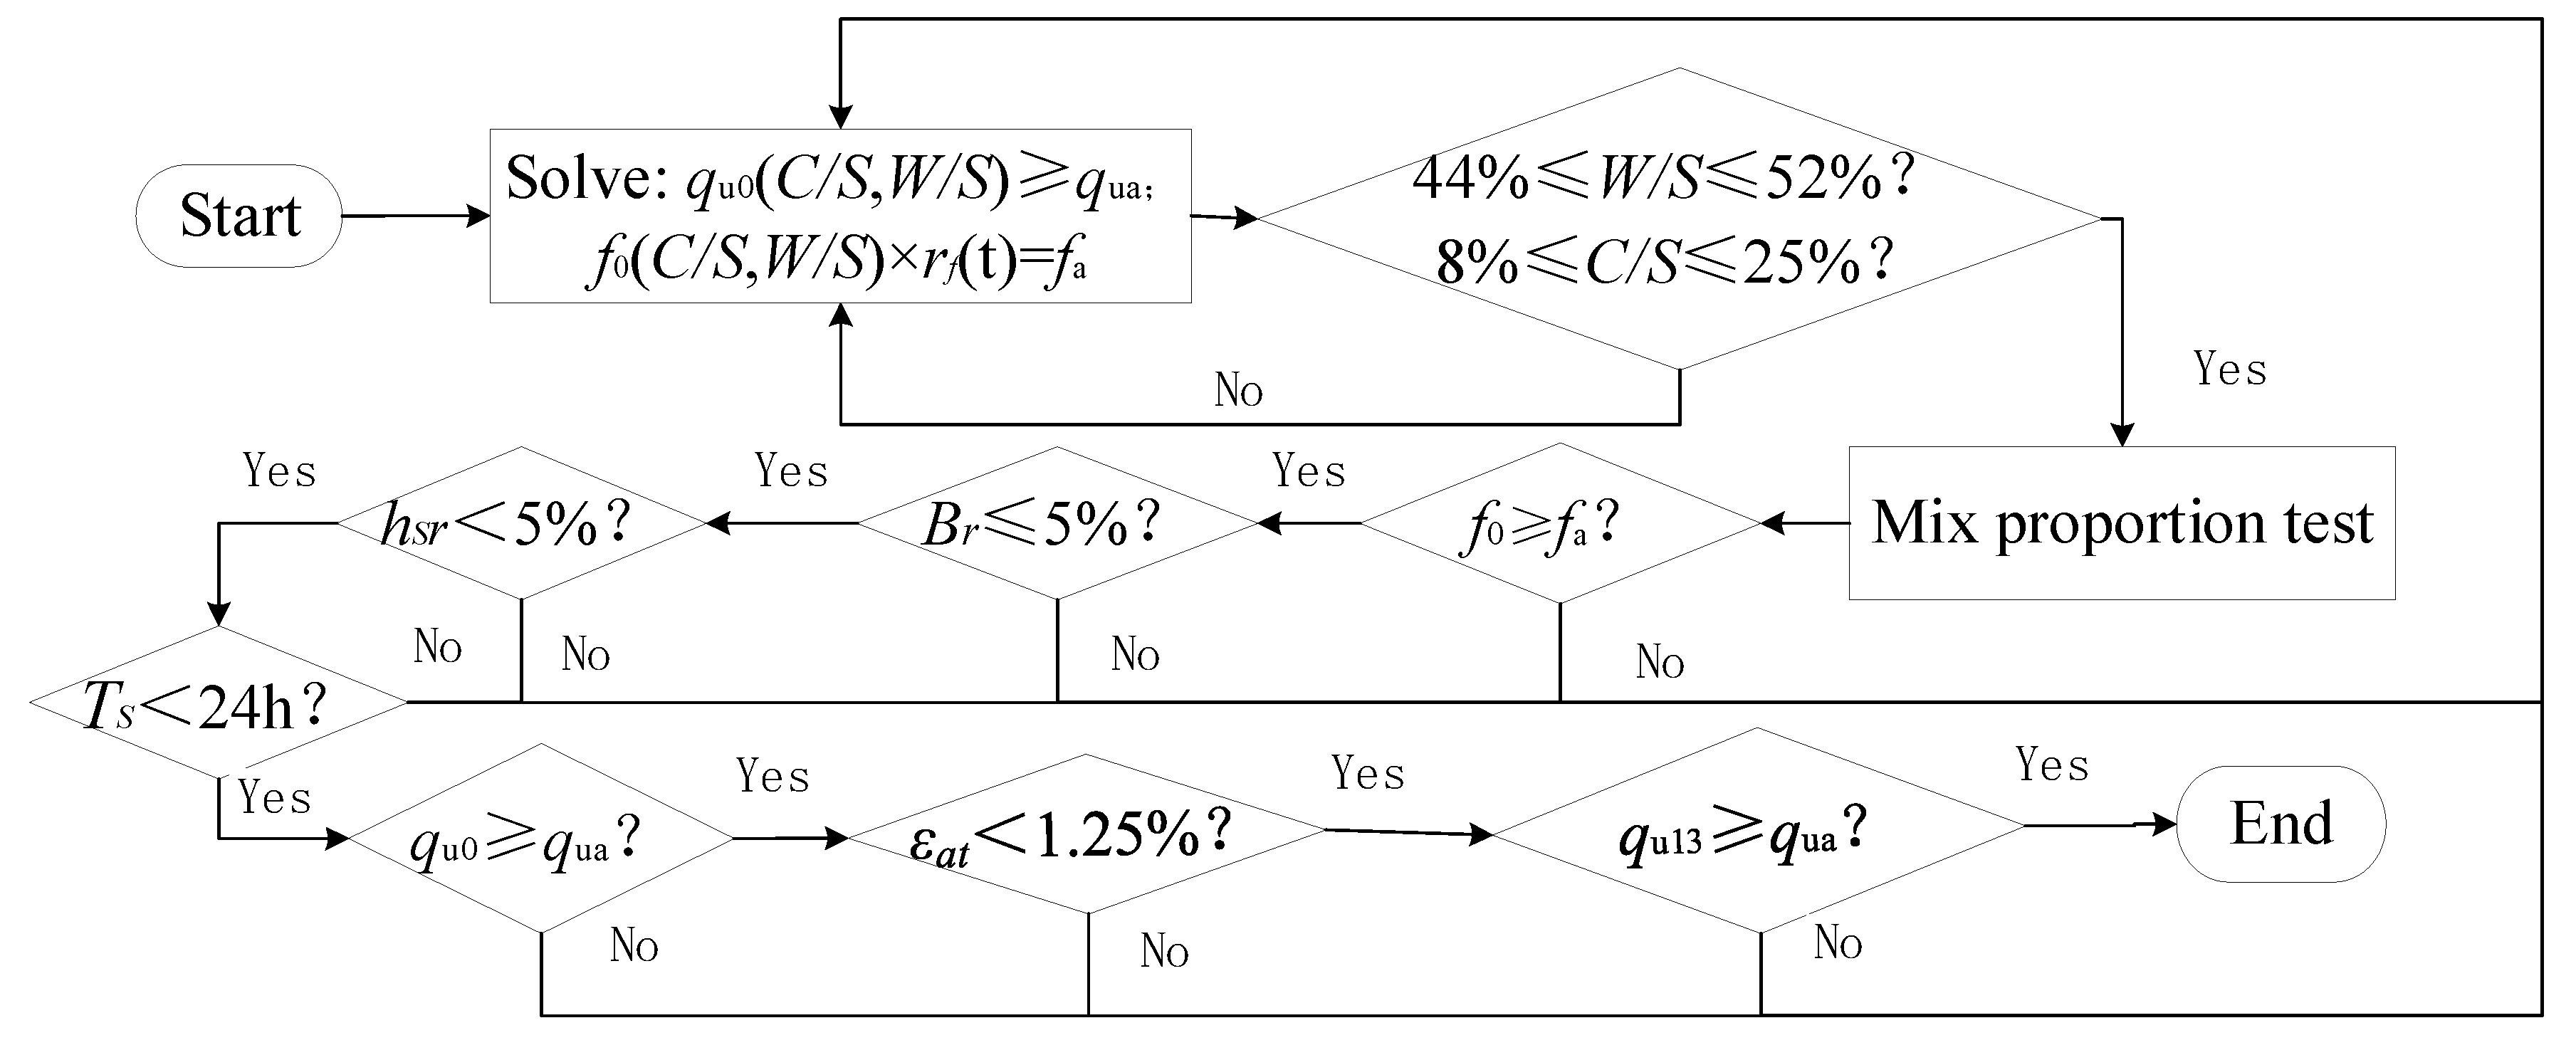
3.3. Mix Design
3.3.1. Reasonable Range of Mix Design
3.3.2. Optimal Mix Proportion
4. Conclusions
Author Contributions
Funding
Data Availability Statement
Conflicts of Interest
References
- Aehnelt, M.; Hilse, U.; Pudlo, D.; Heide, K.; Gaupp, R. On the Origin of Bleaching Phenomena in Red Bed Sediments of Triassic Buntsandstein Deposits in Central Germany. Geochemistry 2021, 81, 125736. [Google Scholar] [CrossRef]
- Cheng, Y.; Wang, M.; Li, G.; Chen, Y.; Li, H. Analysis on The Causes of Landslide of Bazhong-Nanchong-Guang’an highway in East sichuan of Red Beds Area. J. Geol. Hazards Environ. Preserv. 2016, 27, 1–6. [Google Scholar] [CrossRef]
- Pan, Z.; Peng, H. Comparative Study on the Global Distribution and Geomorphic Development of Red Beds. Sci. Geogr. Sin. 2015, 35, 1575–1584. [Google Scholar] [CrossRef]
- Hu, Q.; Zhang, L.; Luo, Q.; Yu, K.; Connolly, D.P.; Qin, L.; Wang, L.; Wang, T. Impact of Polycarboxylate Superplasticizer Dosage on Controlled Low Strength Material Flowability and Bleeding: Insights from Water Film Thickness. Constr. Build. Mater. 2024, 447, 138145. [Google Scholar] [CrossRef]
- Du, J.; Zhang, L.; Hu, Q.; Luo, Q.; Connolly, D.P.; Liu, K.; Hu, T.; Zhu, J.; Wang, T. Characterization of Controlled Low-Strength Materials from Waste Expansive Soils. Constr. Build. Mater. 2024, 411, 134690. [Google Scholar] [CrossRef]
- Arm, M.; Wik, O.; Engelsen, C.J.; Erlandsson, M.; Hjelmar, O.; Wahlström, M. How Does the European Recovery Target for Construction & Demolition Waste Affect Resource Management? Waste Biomass Valoriz. 2017, 8, 1491–1504. [Google Scholar] [CrossRef]
- Duan, H.; Miller, T.R.; Liu, G.; Tam, V.W.Y. Construction Debris Becomes Growing Concern of Growing Cities. Waste Manag. 2019, 83, 1–5. [Google Scholar] [CrossRef]
- Zhang, N.; Duan, H.; Sun, P.; Li, J.; Zuo, J.; Mao, R.; Liu, G.; Niu, Y. Characterizing the Generation and Environmental Impacts of Subway-Related Excavated Soil and Rock in China. J. Clean. Prod. 2020, 248, 119242. [Google Scholar] [CrossRef]
- ACI 229R-13; Report on Controlled Low-Strength Materials, Farmington Hills. American Concrete Institute Committee: Farmington Hills, MI, USA, 2013.
- Qian, J.; Hu, Y.; Zhang, J.; Xiao, W.; Ling, J. Evaluation the Performance of Controlled Low Strength Material Made of Excess Excavated Soil. J. Clean. Prod. 2019, 214, 79–88. [Google Scholar] [CrossRef]
- Luo, Y.; Jiang, L.; Qin, L.; Luo, Q.; Connolly, D.P.; Wang, T. Optimizing Cement Content in Controlled Low-Strength Soils: Effects of Water Content and Hydration Time. Materials 2024, 17, 5915. [Google Scholar] [CrossRef]
- Wu, Y.; Geng, J.; Zhu, H.; Jin, C.; Kang, N. Development and Characterization of Sustainable Cement-Free Controlled Low Strength Material Using Titanium Gypsum and Construction Waste Soil. Materials 2024, 17, 5698. [Google Scholar] [CrossRef]
- Xu, J.; Luo, Q.; Tang, Y.; Zeng, Z.; Liao, J. Experimental Study and Application of Controlled Low-Strength Materials in Trench Backfilling in Suqian City, China. Materials 2024, 17, 775. [Google Scholar] [CrossRef] [PubMed]
- Wang, C.; Li, Y.; Wen, P.; Zeng, W.; Wang, X. A Comprehensive Review on Mechanical Properties of Green Controlled Low Strength Materials. Constr. Build. Mater. 2023, 363, 129611. [Google Scholar] [CrossRef]
- Kim, Y.; Dinh, B.H.; Do, T.M.; Kang, G. Development of Thermally Enhanced Controlled Low-Strength Material Incorporating Different Types of Steel-Making Slag for Ground-Source Heat Pump System. Renew. Energy 2020, 150, 116–127. [Google Scholar] [CrossRef]
- Zhang, J.; Wang, J.; Li, X.; Zhou, T.; Guo, Y. Rapid-Hardening Controlled Low Strength Materials Made of Recycled Fine Aggregate from Construction and Demolition Waste. Constr. Build. Mater. 2018, 173, 81–89. [Google Scholar] [CrossRef]
- Liu, X.; Liu, X.; Zhang, Z.; Ai, X. Effect of Carbonation Curing on the Characterization and Properties of Steel Slag-Based Cementitious Materials. Cem. Concr. Compos. 2024, 154, 105769. [Google Scholar] [CrossRef]
- Zhu, J.; Wang, Z.; Tao, Y.; Ju, L.; Yang, H. Macro–Micro Investigation on Stabilization Sludge as Subgrade Filler by the Ternary Blending of Steel Slag and Fly Ash and Calcium Carbide Residue. J. Clean. Prod. 2024, 447, 141496. [Google Scholar] [CrossRef]
- Hu, B.; Shan, Y.; Zhao, Y.; Wang, B.; Zhou, S.; Alberti, G.S.; Ma, W.; Detmann, B.; Briançon, L. Tunneling beneath the Pile-Raft Foundations of High-Speed Railways: Progressive Arching Deformation and Pile Settlement Behavior. Undergr. Space 2025, in press. [Google Scholar] [CrossRef]
- Liu, H.; Luo, Q.; El Naggar, M.H.; Zhang, L.; Wang, T. Centrifuge Modeling of Stability of Embankment on Soft Soil Improved by Rigid Columns. J. Geotech. Geoenviron. Eng. 2023, 149, 04023069. [Google Scholar] [CrossRef]
- Zhao, G.; Pan, X.; Yan, H.; Tian, J.; Han, Y.; Guan, H.; Ruan, Y.; Liu, B.; Chen, F. Optimization and Characterization of GGBFS-FA Based Alkali-Activated CLSM Containing Shield-Discharged Soil Using Box-Behnken Response Surface Design Method. Case Stud. Constr. Mater. 2024, 21, e03800. [Google Scholar] [CrossRef]
- Nataraja, M.C.; Nalanda, Y. Performance of Industrial By-Products in Controlled Low-Strength Materials (CLSM). Waste Manag. 2008, 28, 1168–1181. [Google Scholar] [CrossRef] [PubMed]
- JTG 3420-2020; Testing Methods of Cement and Concrete for Highway Engineering. Ministry of Transport of the People’s Republic of China: Beijing, China, 2020.
- ASTM-D2487-17; Standard Practice for Classification of Soils for Engineering Purposes (UnifiedSoil Classification System). American Society for Testing and Materials: Conshohocken, PA, USA, 2025.
- DBJ51/T 188-2022; Technical Standard for Engineering Application by Using Premixed Fluidized Stabilized Soil. Sichuan Provincial Department of Housing and Urban-Rural Development: Chengdu, China, 2022.
- JHS A 313-1992; Test Method for Air Mortar and Air Milk. Japan Highway Public Corporation: Tokyo, Japan, 1992.
- ASTM D6103; Standard Test Method for Flow Consistency of Controlled Low Strength Material (CLSM). American Society for Testing and Materials: Conshohocken, PA, USA, 2017.
- ASTM C940-16; Standard Test Method for Expansion and Bleeding of Freshly Mixed Grouts for Preplaced-Aggregate Concrete in the Laboratory. American Society for Testing and Materials: Conshohocken, PA, USA, 2016.
- Pierce, C.E.; Blackwell, M.C. Potential of Scrap Tire Rubber as Lightweight Aggregate in Flowable Fill. Waste Manag. 2003, 23, 197–208. [Google Scholar] [CrossRef] [PubMed]
- Yan, D.Y.S.; Tang, I.Y.; Lo, I.M.C. Development of Controlled Low-Strength Material Derived from Beneficial Reuse of Bottom Ash and Sediment for Green Construction. Constr. Build. Mater. 2014, 64, 201–207. [Google Scholar] [CrossRef]
- Parhi, S.K.; Dwibedy, S.; Panda, S.; Panigrahi, S.K. A Comprehensive Study on Controlled Low Strength Material. J. Build. Eng. 2023, 76, 107086. [Google Scholar] [CrossRef]
- Zhu, H. Study on Preparation and Performance of Controlled Low Strength Materials (CLSM) Based on Red Gypsum. Master’s Thesis, Zhejiang University, Hangzhou, China, 2021. [Google Scholar]
- Yin, S.; Yan, Z. The effect of coarse aggregate on the bleeding and mechanical properties of cemented paste backfill. J. Cent. South Univ. 2023, 30, 555–567. [Google Scholar] [CrossRef]
- Kuo, W.-T.; Wang, H.-Y.; Shu, C.-Y.; Su, D.-S. Engineering Properties of Controlled Low-Strength Materials Containing Waste Oyster Shells. Constr. Build. Mater. 2013, 46, 128–133. [Google Scholar] [CrossRef]
- Wang, L.; Feng, W.; Lazaro, S.A.M.; Li, X.; Cheng, Y.; Wang, Z. Engineering Properties of Soil-Based Controlled Low-Strength Materials Made from Local Red Mud and Silty Soil. Constr. Build. Mater. 2022, 358, 129453. [Google Scholar] [CrossRef]
- JGJ/T70-2009; Standard for Test Method of Performance on Building Mortar. Ministry of Construction of the People’s Republic of China: Beijing, China, 2009.
- Tikalsky, P.; Bahia, H.; Deng, A.; Snyder, T. Excess Foundry Sand Characterization and Experimental Investigation in Controlled Low-Strength Material and Hot-Mixing Asphalt; Pennsylvania Transportation Institute: Media, PA, USA, 2004. [Google Scholar]
- Gabr, M. Controlled Low-Strength Material Using Fly Ash and AMD Sludge. J. Hazard. Mater. 2000, 76, 251–263. [Google Scholar] [CrossRef]
- JGJ/T 233-2011; Specification for Mix Proportion Design of Cement Soil. Ministry of Housing and Urban–Rural Development of the People’s Republic of China: Beijing, China, 2011.
- Khattab, S.A.; Al-Mukhtar, M.; Fleureau, J.-M. Long-Term Stability Characteristics of a Lime-Treated Plastic Soil. J. Mater. Civ. Eng. 2007, 19, 358–366. [Google Scholar] [CrossRef]
- Ahmed, A.; Ugai, K. Environmental Effects on Durability of Soil Stabilized with Recycled Gypsum. Cold Reg. Sci. Technol. 2011, 66, 84–92. [Google Scholar] [CrossRef]
- ASTM D559; Standard Test Methods for Wetting and Drying Compacted Soil-Cement Mixtures. American Society for Testing and Materials: Conshohocken, PA, USA, 2015.
- Huang, R.; Liu, G.; Zhu, Y.; Zhang, P. Controlled Low Strength Materials Based on Pipe Jacking Waste Soil and Their Property Influencing Factors. Tunn. Constr. 2021, 41, 346–352. [Google Scholar]
- Zhang, L.; Hu, Q.; Luo, Q.; Connolly, D.P.; Wang, T. Assessing Workability of Ready-Mixed Soils Derived from Excess Spoil. J. Mater. Civ. Eng. 2024, 36, 4024331. [Google Scholar] [CrossRef]
- Qian, J.; Shu, X.; Dong, Q.; Ling, J.; Huang, B. Laboratory Characterization of Controlled Low-Strength Materials. Mater. Des. 2015, 65, 806–813. [Google Scholar] [CrossRef]
- Zhang, S.; Jiao, N.; Ding, J.; Guo, C.; Gao, P.; Wei, X. Utilization of Waste Marine Dredged Clay in Preparing Controlled Low Strength Materials with Polycarboxylate Superplasticizer and Ground Granulated Blast Furnace Slag. J. Build. Eng. 2023, 76, 107351. [Google Scholar] [CrossRef]
- Qiu, Z.; Chen, F.; Yu, Y.; Gu, Y.; Wang, X.; Wang, Y. Effects of Water-Cement Ratio and Particle Diameter on the Mechanical Properties of Cement Paste Particles. Opt. Lasers Eng. 2025, 187, 108874. [Google Scholar] [CrossRef]
- Di Bella, C.; Wyrzykowski, M.; Lura, P. Evaluation of the Ultimate Drying Shrinkage of Cement-Based Mortars with Poroelastic Models. Mater. Struct. 2017, 50, 52. [Google Scholar] [CrossRef]
- Li, Y.; Wang, Q.; Zhang, Q.; Zhou, L.; Mu, J. Effect of Inorganic Curing Agents on the Structure and Properties of Fluid Cured Soils. Mater. Rep. 2023, 37, 156–162. [Google Scholar]
- Zhu, H.; Yu, F.; Geng, J.; Wang, X.; Qin, H. Strength and Volume Stability of Controlled Low-Strength Material Based on Titanium Gypsum. Bull. Chin. Ceram. Soc. 2021, 40, 3644–3653. [Google Scholar] [CrossRef]
- Kovler, K.; Zhutovsky, S. Overview and Future Trends of Shrinkage Research. Mater. Struct. 2006, 39, 827–847. [Google Scholar] [CrossRef]
- Ye, H.; Chu, C.; Xu, L.; Guo, K.; Li, D. Experimental Studies on Drying-Wetting Cycle Characteristics of Expansive Soils Improved by Industrial Wastes. Adv. Civ. Eng. 2018, 2018, 2321361. [Google Scholar] [CrossRef]
- Cuisinier, O.; Masrouri, F.; Mehenni, A. Alteration of the Hydromechanical Performances of a Stabilized Compacted Soil Exposed to Successive Wetting–Drying Cycles. J. Mater. Civ. Eng. 2020, 32, 04020349. [Google Scholar] [CrossRef]
- Du, J.; Luo, Q.; Jiang, L.; Wang, T.; Zhang, L. Fluidized solidification modification tests on expansive soil andits mixing proportions study. J. Zhejiang Univ. (Eng. Sci.) 2024, 58, 2137–2148. [Google Scholar]


| Index Property | Value | Unit |
|---|---|---|
| Appearance | Maroon colored | - |
| Specific gravity | 2.696 | - |
| Maximum dry density | 1.95 | g/cm3 |
| Optimal moisture content (OMC) | 10.65 | % |
| Liquid limit (LL) | 31.5 | % |
| Plasticity index (PI) | 14.4 | - |
| Particles < 75 μm | 78.9 | % |
| Free swelling ratio | 14.92 | % |
| Standard moisture absorption | 0.86 | % |
| Composition | SiO2 | Al2O3 | Fe2O3 | CaO | MgO | SO3 | Cl− |
|---|---|---|---|---|---|---|---|
| Content (%) | 24.99 | 8.26 | 4.03 | 51.42 | 3.71 | 2.51 | 0.043 |
| ID | C/S (%) | W/S (%) | Dry Red-Bed Mudstone (kg/m3) | Cement (kg/m3) | Water (kg/m3) |
|---|---|---|---|---|---|
| 1 | 4 | 44 | 1189 | 48 | 576 |
| 2 | 4 | 48 | 1133 | 45 | 598 |
| 3 | 4 | 52 | 1082 | 43 | 619 |
| 4 | 4 | 56 | 1036 | 41 | 638 |
| 5 | 8 | 44 | 1148 | 92 | 555 |
| 6 | 8 | 48 | 1093 | 87 | 577 |
| 7 | 8 | 52 | 1044 | 84 | 597 |
| 8 | 8 | 56 | 999 | 80 | 615 |
| 9 | 12 | 44 | 1109 | 133 | 537 |
| 10 | 12 | 48 | 1056 | 127 | 558 |
| 11 | 12 | 52 | 1009 | 121 | 577 |
| 12 | 12 | 56 | 965 | 116 | 594 |
| 13 | 16 | 44 | 1073 | 172 | 519 |
| 14 | 16 | 48 | 1022 | 163 | 539 |
| 15 | 16 | 52 | 975 | 156 | 558 |
| 16 | 16 | 56 | 933 | 149 | 575 |
| Engineering Performance | Engineering Type | Design Standard | Standard/Reference |
|---|---|---|---|
| Flowability | I | ≥180 mm | JHS A 313-1992 [26] |
| II | ≥200 mm | JHS A 313-1992 [26], DBJ51/T 188-2022 [25], and References [5,25,46] | |
| Bleeding rate | I | <5% | References [5,9,29,30,31,32,33] |
| II | <5% | ||
| Setting time | I | <24 h | References [5,34,35] |
| II | <24 h | ||
| Subsidence rate | I | <5% | Reference [38] |
| II | <5% | ||
| Compressive strength | I | ≥0.8 MPa | JHS A 313-1992 [26] and DBJ51/T 188-2022 [25] |
| II | ≥1.0 MPa | ||
| Drying shrinkage rate | I | <1.25% | DBJ51/T 188-2022 [25] |
| II | <1.25% | ||
| Residual strength | I | ≥0.8 MPa | DBJ51/T 188-2022 [25] and Reference [5] |
| II | ≥1.0 MPa |
| Sample | f0/mm | Br/% | TS/h | hsr/% | qu0/MPa | εat/% | qu13/MPa |
|---|---|---|---|---|---|---|---|
| (C/S)12(W/S)47 | 203 | 3.57 | 10 | 2.5 | 0.821 | 1.01 | 0.805 |
| (C/S)14.6(W/S)46.5 | 180 | 3.11 | 8 | 3.0 | 1.033 | 0.97 | 1.078 |
Disclaimer/Publisher’s Note: The statements, opinions and data contained in all publications are solely those of the individual author(s) and contributor(s) and not of MDPI and/or the editor(s). MDPI and/or the editor(s) disclaim responsibility for any injury to people or property resulting from any ideas, methods, instructions or products referred to in the content. |
© 2025 by the authors. Licensee MDPI, Basel, Switzerland. This article is an open access article distributed under the terms and conditions of the Creative Commons Attribution (CC BY) license (https://creativecommons.org/licenses/by/4.0/).
Share and Cite
Qi, W.; Fu, N.; Du, J.; Wang, X.; Wang, T. Transforming Waste Red-Bed Mudstone into Sustainable Controlled Low-Strength Materials: Mix Design for Enhanced Engineering Performance. Buildings 2025, 15, 1439. https://doi.org/10.3390/buildings15091439
Qi W, Fu N, Du J, Wang X, Wang T. Transforming Waste Red-Bed Mudstone into Sustainable Controlled Low-Strength Materials: Mix Design for Enhanced Engineering Performance. Buildings. 2025; 15(9):1439. https://doi.org/10.3390/buildings15091439
Chicago/Turabian StyleQi, Wei, Na Fu, Jianbiao Du, Xianliang Wang, and Tengfei Wang. 2025. "Transforming Waste Red-Bed Mudstone into Sustainable Controlled Low-Strength Materials: Mix Design for Enhanced Engineering Performance" Buildings 15, no. 9: 1439. https://doi.org/10.3390/buildings15091439
APA StyleQi, W., Fu, N., Du, J., Wang, X., & Wang, T. (2025). Transforming Waste Red-Bed Mudstone into Sustainable Controlled Low-Strength Materials: Mix Design for Enhanced Engineering Performance. Buildings, 15(9), 1439. https://doi.org/10.3390/buildings15091439