Article

Influence of Water-to-Binder Ratio on Autogenous Shrinkage and Electrical Resistivity of Cement Mortar

1
School of Civil Engineering and Architecture, Shandong University of Technology, Zibo 255000, China
2
Institute of Road and Bridge Engineering, Dalian Maritime University, Dalian 116026, China
3
Department of Civil and Environmental Engineering, Northwestern University, Evanston, IL 60208, USA
4
Department of Civil Engineering, University of Texas at Arlington, Arlington, TX 76019, USA
*
Authors to whom correspondence should be addressed.
Buildings 2025, 15(9), 1444; https://doi.org/10.3390/buildings15091444
Submission received: 31 March 2025 / Revised: 20 April 2025 / Accepted: 22 April 2025 / Published: 24 April 2025
(This article belongs to the Section Building Materials, and Repair & Renovation)

Abstract

:
This study investigates the effects of nano-metakaolin and fly ash contents, the water-to-binder ratio, and other factors on autogenous shrinkage, internal relative humidity, and resistivity. Hydration heat, scanning electron microscopy, X-ray diffraction, thermogravimetric analysis, mercury intrusion porosimetry, and other micro-testing techniques were employed to characterize the hydration process, phase composition, and pore structure of cementitious materials. The experimental results show that lower water-to-binder ratios lead to faster and more significant decreases in internal relative humidity within cement pastes. When nano-metakaolin and fly ash are combined, fly ash effectively mitigates the excessive autogenous shrinkage caused by nano-metakaolin under low water-to-binder ratios. Lower water-to-binder ratios result in faster resistivity growth in cement pastes. Specifically, when the water-to-binder ratio decreased from 0.35 to 0.30 and 0.25, the 28-day resistivity of nano-metakaolin–fly ash cement pastes increased by 8.08% and 7.33%, respectively. Additionally, the water-to-binder ratio has a relatively minor impact on the autogenous shrinkage and resistivity of fly ash cement pastes. Higher water-to-binder ratios accelerate the hydration rate and increase porosity, leading to the gradual coarsening of pore distributions. When the water-to-binder ratio increased from 0.25 to 0.35, the 28-day porosity increased by 50.31%. In hydration systems with lower water-to-binder ratios, internal relative humidity decreases more rapidly, pores become refined, capillary stresses increase, and autogenous shrinkage behavior becomes more pronounced. This research provides a practical foundation for studying the early-age autogenous shrinkage behavior of cementitious materials.

1. Introduction

Concrete, as a quasi-brittle material, is prone to cracking during service. Cracking in cementitious materials is a critical factor accelerating their deterioration and structural failure, significantly reducing the service life of buildings. In China, concrete structures often exhibit cracking within a few years of service, with some even showing visible cracks shortly after construction [1,2]. Extensive engineering practices indicate that cracks in concrete structures primarily arise from non-load stresses induced by environmental temperature/humidity changes or internal factors such as shrinkage and creep [3]. Among these, early-age autogenous shrinkage-induced cracks account for the majority and represent one of the most significant causes. Even without visible macroscopic cracks, microcracks formed during early-age autogenous shrinkage can severely compromise the long-term durability of concrete under environmental exposure. Therefore, studying autogenous shrinkage in cementitious materials is essential for enhancing concrete durability in practical engineering.
Autogenous shrinkage refers to volume deformation caused by internal physical and chemical changes, excluding deformations due to mass loss/gain, temperature variations, external forces, or constraint-induced stresses [4]. To improve autogenous shrinkage performance, researchers have proposed replacing cement with supplementary cementitious materials (SCMs) such as fly ash (FA). Fly ash [5], a solid waste from coal-fired power plants, reduces environmental impact when used in concrete. Additionally, its high alumina and silica content endows it with pozzolanic activity, improving the late-stage strength and durability of cementitious materials [6,7] while mitigating autogenous shrinkage [8,9]. Klemczak [10] reported that replacing 60% cement with FA reduced final shrinkage by 53% after 28 days of curing. Hao et al. [11] found that FA effectively reduced early autogenous shrinkage in cement pastes but increased shrinkage rates during mid-to-late curing. However, FA’s low early reactivity hinders early strength development [11,12]. Nano-metakaolin (NMK), a low-cost nanomaterial with high surface energy and reactivity, can activate FA [13,14], improving FA cement performance [15]. Nevertheless, NMK exacerbates autogenous shrinkage [16,17], increasing early cracking risks [18]. Weng et al. [16] observed increasing autogenous shrinkage with higher metakaolin content. Luo [19] reported faster shrinkage rates and larger shrinkage values in metakaolin-blended pastes. Conversely, Li et al. [20] found that metakaolin reduced autogenous shrinkage, while Luo et al. [21] attributed shrinkage reduction to moisture release from saturated metakaolin particles. These studies suggest that combined NMK-FA additions can multi-dimensionally improve cementitious properties but have complex effects on autogenous shrinkage. Current research on early shrinkage in NMK-FA systems remains limited, with conflicting conclusions on their individual and combined effects.
Autogenous shrinkage in cementitious materials primarily stems from internal relative humidity (RH) reduction. Systems with water-to-binder ratios (w/b) < 0.4 exhibit pronounced autogenous shrinkage, as lower w/b accelerates internal RH decline [22], increasing capillary tension and shrinkage. Wyrzykowski et al. [23] found that 0.30 w/b mortar experienced faster self-desiccation, lower RH, and greater shrinkage compared to 0.35 w/b mortar. He et al. [24] reported stable autogenous shrinkage values of 500 μm/m (0.30 w/b) and 200 μm/m (0.40 w/b). Dong [25] documented capillary tensions up to 100 kPa in low w/b pastes, causing significant shrinkage. With increasing applications of low w/b concretes, autogenous shrinkage in such systems demands urgent attention.
This study focuses on NMK-FA cement pastes, investigating autogenous shrinkage mechanisms and influencing factors via resistivity measurements and other tests in order to correctly understand the effect of nano-metakaolin and fly ash on self-shrinkage at low water–binder ratio. The objectives are to clarify hydration processes, autogenous shrinkage–resistivity relationships, and optimize shrinkage performance to reduce early cracking and enhance durability.

2. Experimental Materials and Methods
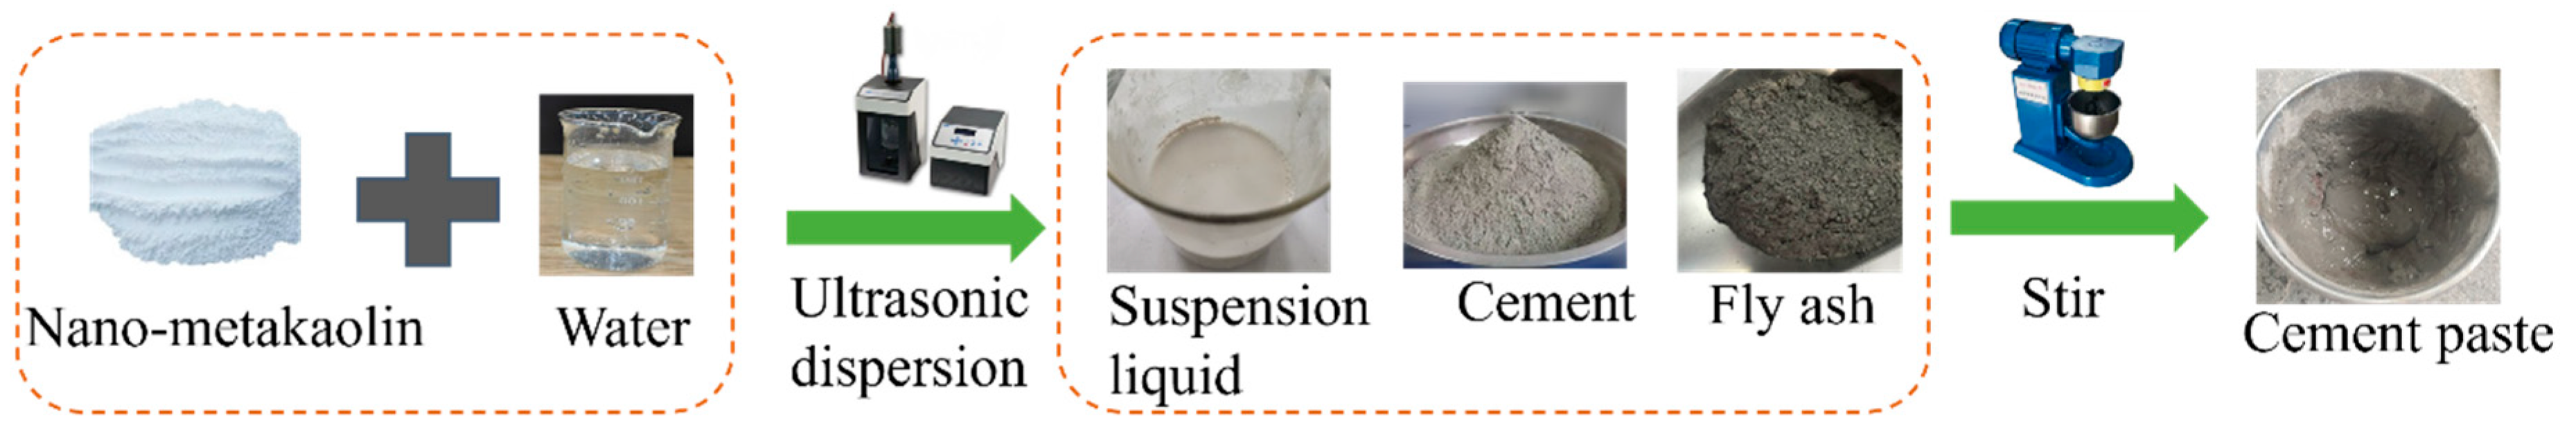
2.1. Raw Materials

The cement used in the experiments was P·O42.5 ordinary Portland cement produced by Shandong ShanshuiDongyue (Sunnsy Group, Zibo, China) (specific surface area ≥ 300 m2/kg). Nano-metakaolin (NMK) was supplied by Wuhan JunchengYongxing Technology Co., Ltd. (JunchengYongxing Technology Co., Ltd., Wuhan, China) (specific surface area ≥ 15,000 m2/kg), and Class I fly ash (FA) was used (specific surface area ≥ 400 m2/kg). The chemical compositions of the raw materials are presented in Table 1, while their microscopic morphologies and particle size distributions are shown in Figure 1 and Figure 2, respectively. Laboratory tap water was used for all mixing processes.

2.2. Experimental Design and Methods

2.2.1. Mix Proportions

This study investigated the effects of varying nano-metakaolin (NMK) and fly ash (FA) contents, as well as water-to-binder ratios (w/b), on the autogenous shrinkage of cement pastes. To examine the effect of w/b, three ratios (0.25, 0.30, and 0.35) were adopted. The detailed mix proportions are presented in Table 2.

2.2.2. Specimen Preparation

Nano-metakaolin was dispersed using an FS-600N ultrasonic disperser (Sxsonic, Shanghai, China) for 15 min to prepare a uniformly dispersed nano-metakaolin suspension. The suspension was then mixed with cement and fly ash in a blender to obtain a homogeneous cement paste mixture. The preparation process is illustrated in Figure 3.

2.3. Test Methods

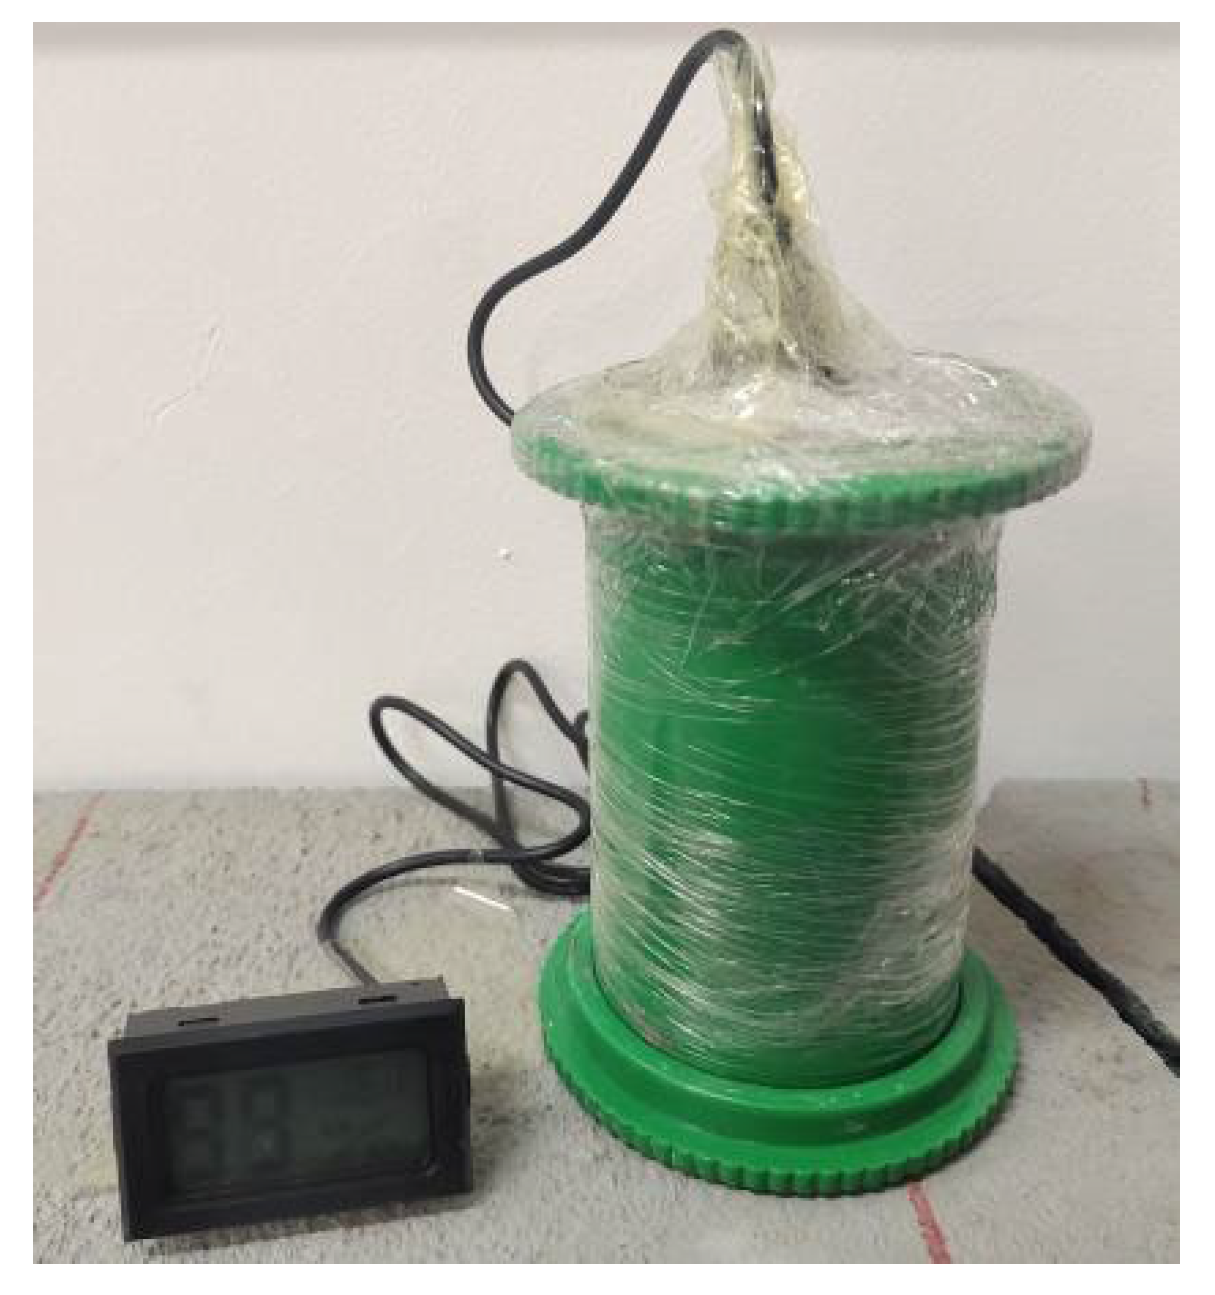
2.3.1. Internal Relative Humidity (IRH)

The cement paste mixture was poured into plastic containers with a 50 mm inner diameter and 10 mm height, with a pre-drilled central hole. After final setting, a humidity sensor was inserted into the hole, and the specimen was sealed with plastic film, as shown in Figure 4. Prior to measurements, sensors were calibrated using saturated salt solutions. To investigate the effects of the NMK/FA content, w/b ratio, and mixing solution on IRH, sensors and specimens were placed in a standard curing room (curing temperature is 20 °C; humidity > 95%). The measurement duration matched that of autogenous shrinkage testing. Three replicate specimens per mix proportion were tested, with three measurements recorded for each.

2.3.2. Autogenous Shrinkage Test

Autogenous shrinkage was measured using the length method. PVC tubes with a 50 mm inner diameter and 250 mm length were lined with polyethylene plastic film and coated with lubricating oil. Cement paste mixtures were uniformly compacted into the tubes, with end studs at both ends. Specimens were sealed with double-layered plastic wrap at the ends. During the experiment, care was taken to ensure that the specimens and dial gauges did not move. To investigate the effects of the NMK/FA content, w/b ratio, and mixing solution on autogenous shrinkage, dial gauges and specimens were placed in a standard curing room (curing temperature is 20 °C; humidity > 95%). The testing setup is shown in Figure 5.
The “zero time point” for autogenous shrinkage was determined based on the final setting time via Vicat needle testing [26]. After final setting, readings were taken every 4 h for the first day, transitioning to every 8 h after 1 day, every 12 h after 3 days, and every 24 h after 7 days until 28 days.
For each mix proportion, three autogenous shrinkage specimens were cast. After eliminating data with significant discreteness, the average of the remaining test data was taken as the final autogenous shrinkage result. The autogenous shrinkage of the cement paste was calculated according to Formula (1).
ε s t = L l 0 L l t + ( L r 0 L r t ) L 0
  • ε s t : Autogenous shrinkage value at time t (με), commencing from the final setting time;
  • L l 0 , L l 0 : Initial readings of the left and right dial gauges (mm);
  • L l t , L r t : Readings of the left and right dial gauges at time t (mm);
  • L0: Initial length of the autogenous shrinkage specimen at test start (mm).

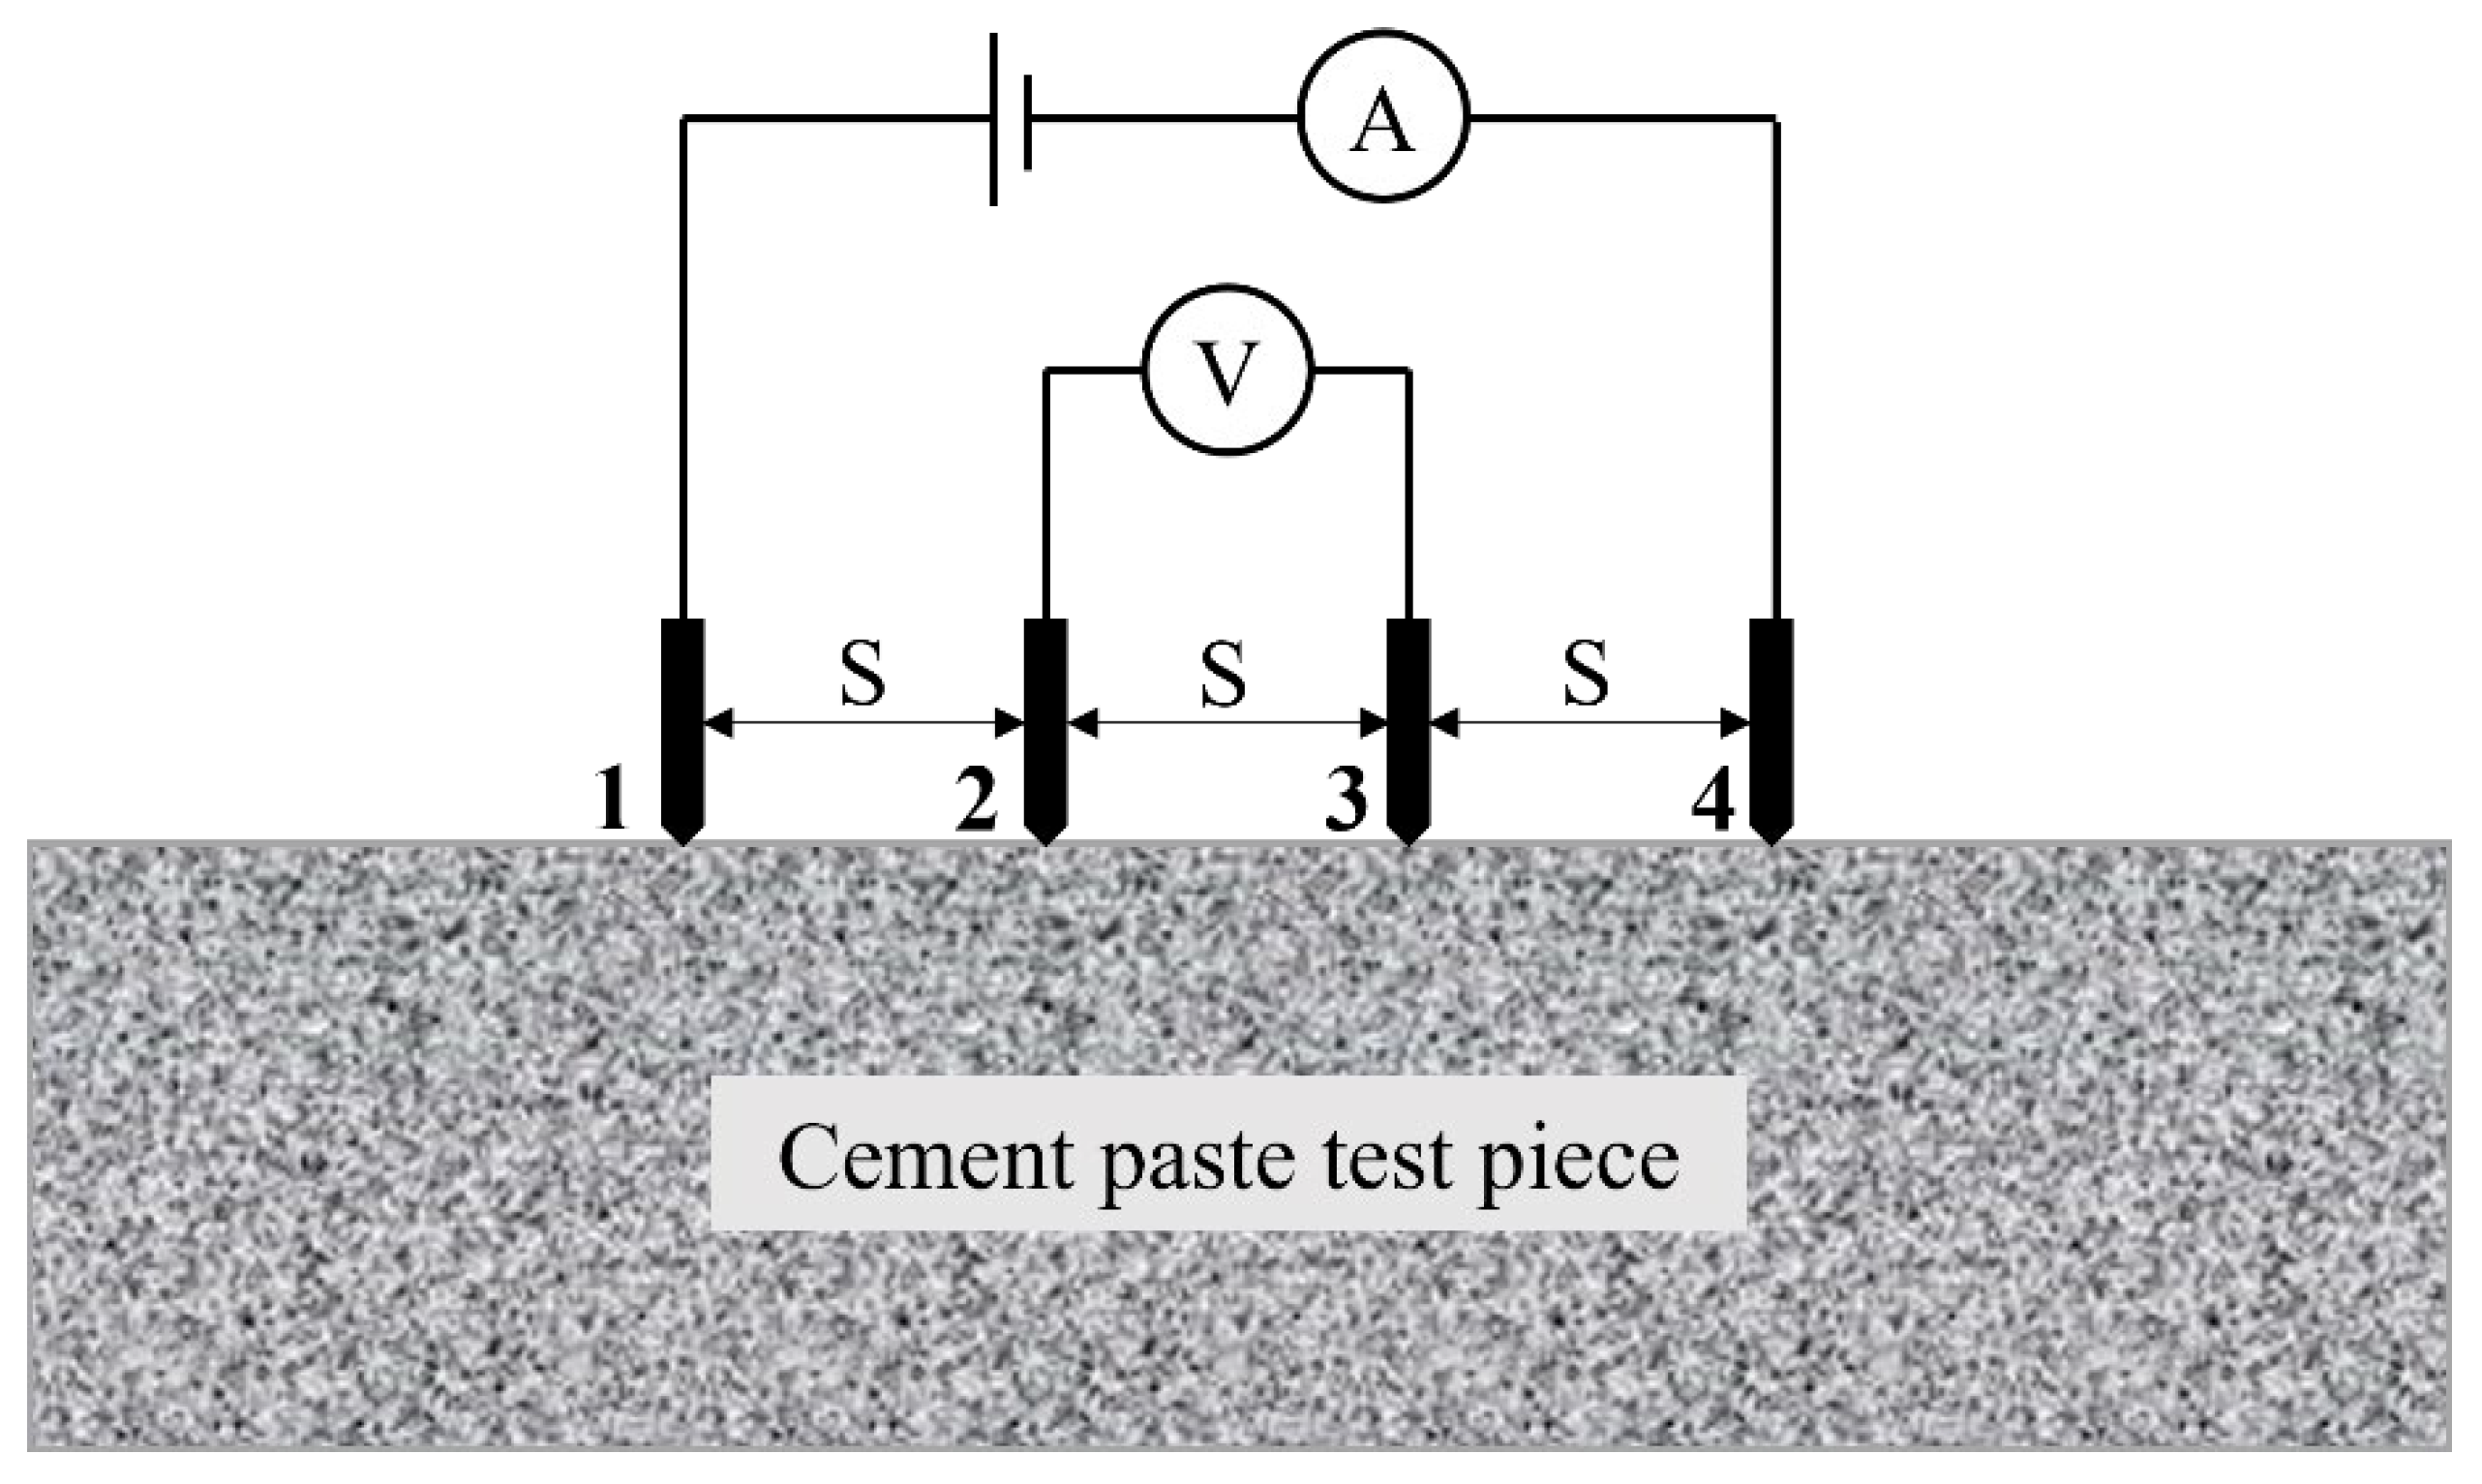
2.3.3. Resistivity Test

This study employed the four-probe resistivity method to measure the resistivity of cementitious materials. In this method, four equally spaced linear metal probes are vertically pressed onto the surface of a semiconductor sample of any shape. Current passes through the two outer probes, and the potential difference between the two inner probes is measured. The resistivity of the semiconductor is calculated according to Formula (2). The testing principle of the four-probe resistivity method is shown in Figure 6.
ρ = 2 π S V 23 I
  • ρ: Resistivity of the cementitious material (Ω · m);
  • S: Probe spacing of the resistivity tester, set to 1.2 mm;
  • V: Potential difference between Probes 2 and 3 (V);
  • I: Measured current (A).
Figure 6. Schematic of four-probe resistivity method.
Buildings 15 01444 g006
The cement paste was poured into 40 mm × 40 mm × 160 mm molds, vibrated for 60 s, and wrapped with double-layered plastic wrap. After final setting, resistivity was measured using a four-probe sheet resistance resistivity tester (Xinyangdianzi, Changzhou, China), as shown in Figure 7. To investigate the effects of the NMK/FA content, w/b ratio, and mixing solution on resistivity, specimens were placed in a standard curing room (curing temperature is 20 °C; humidity > 95%). The measurement duration matched that of autogenous shrinkage testing. Three replicate specimens per mix proportion were tested, with three measurements recorded for each.

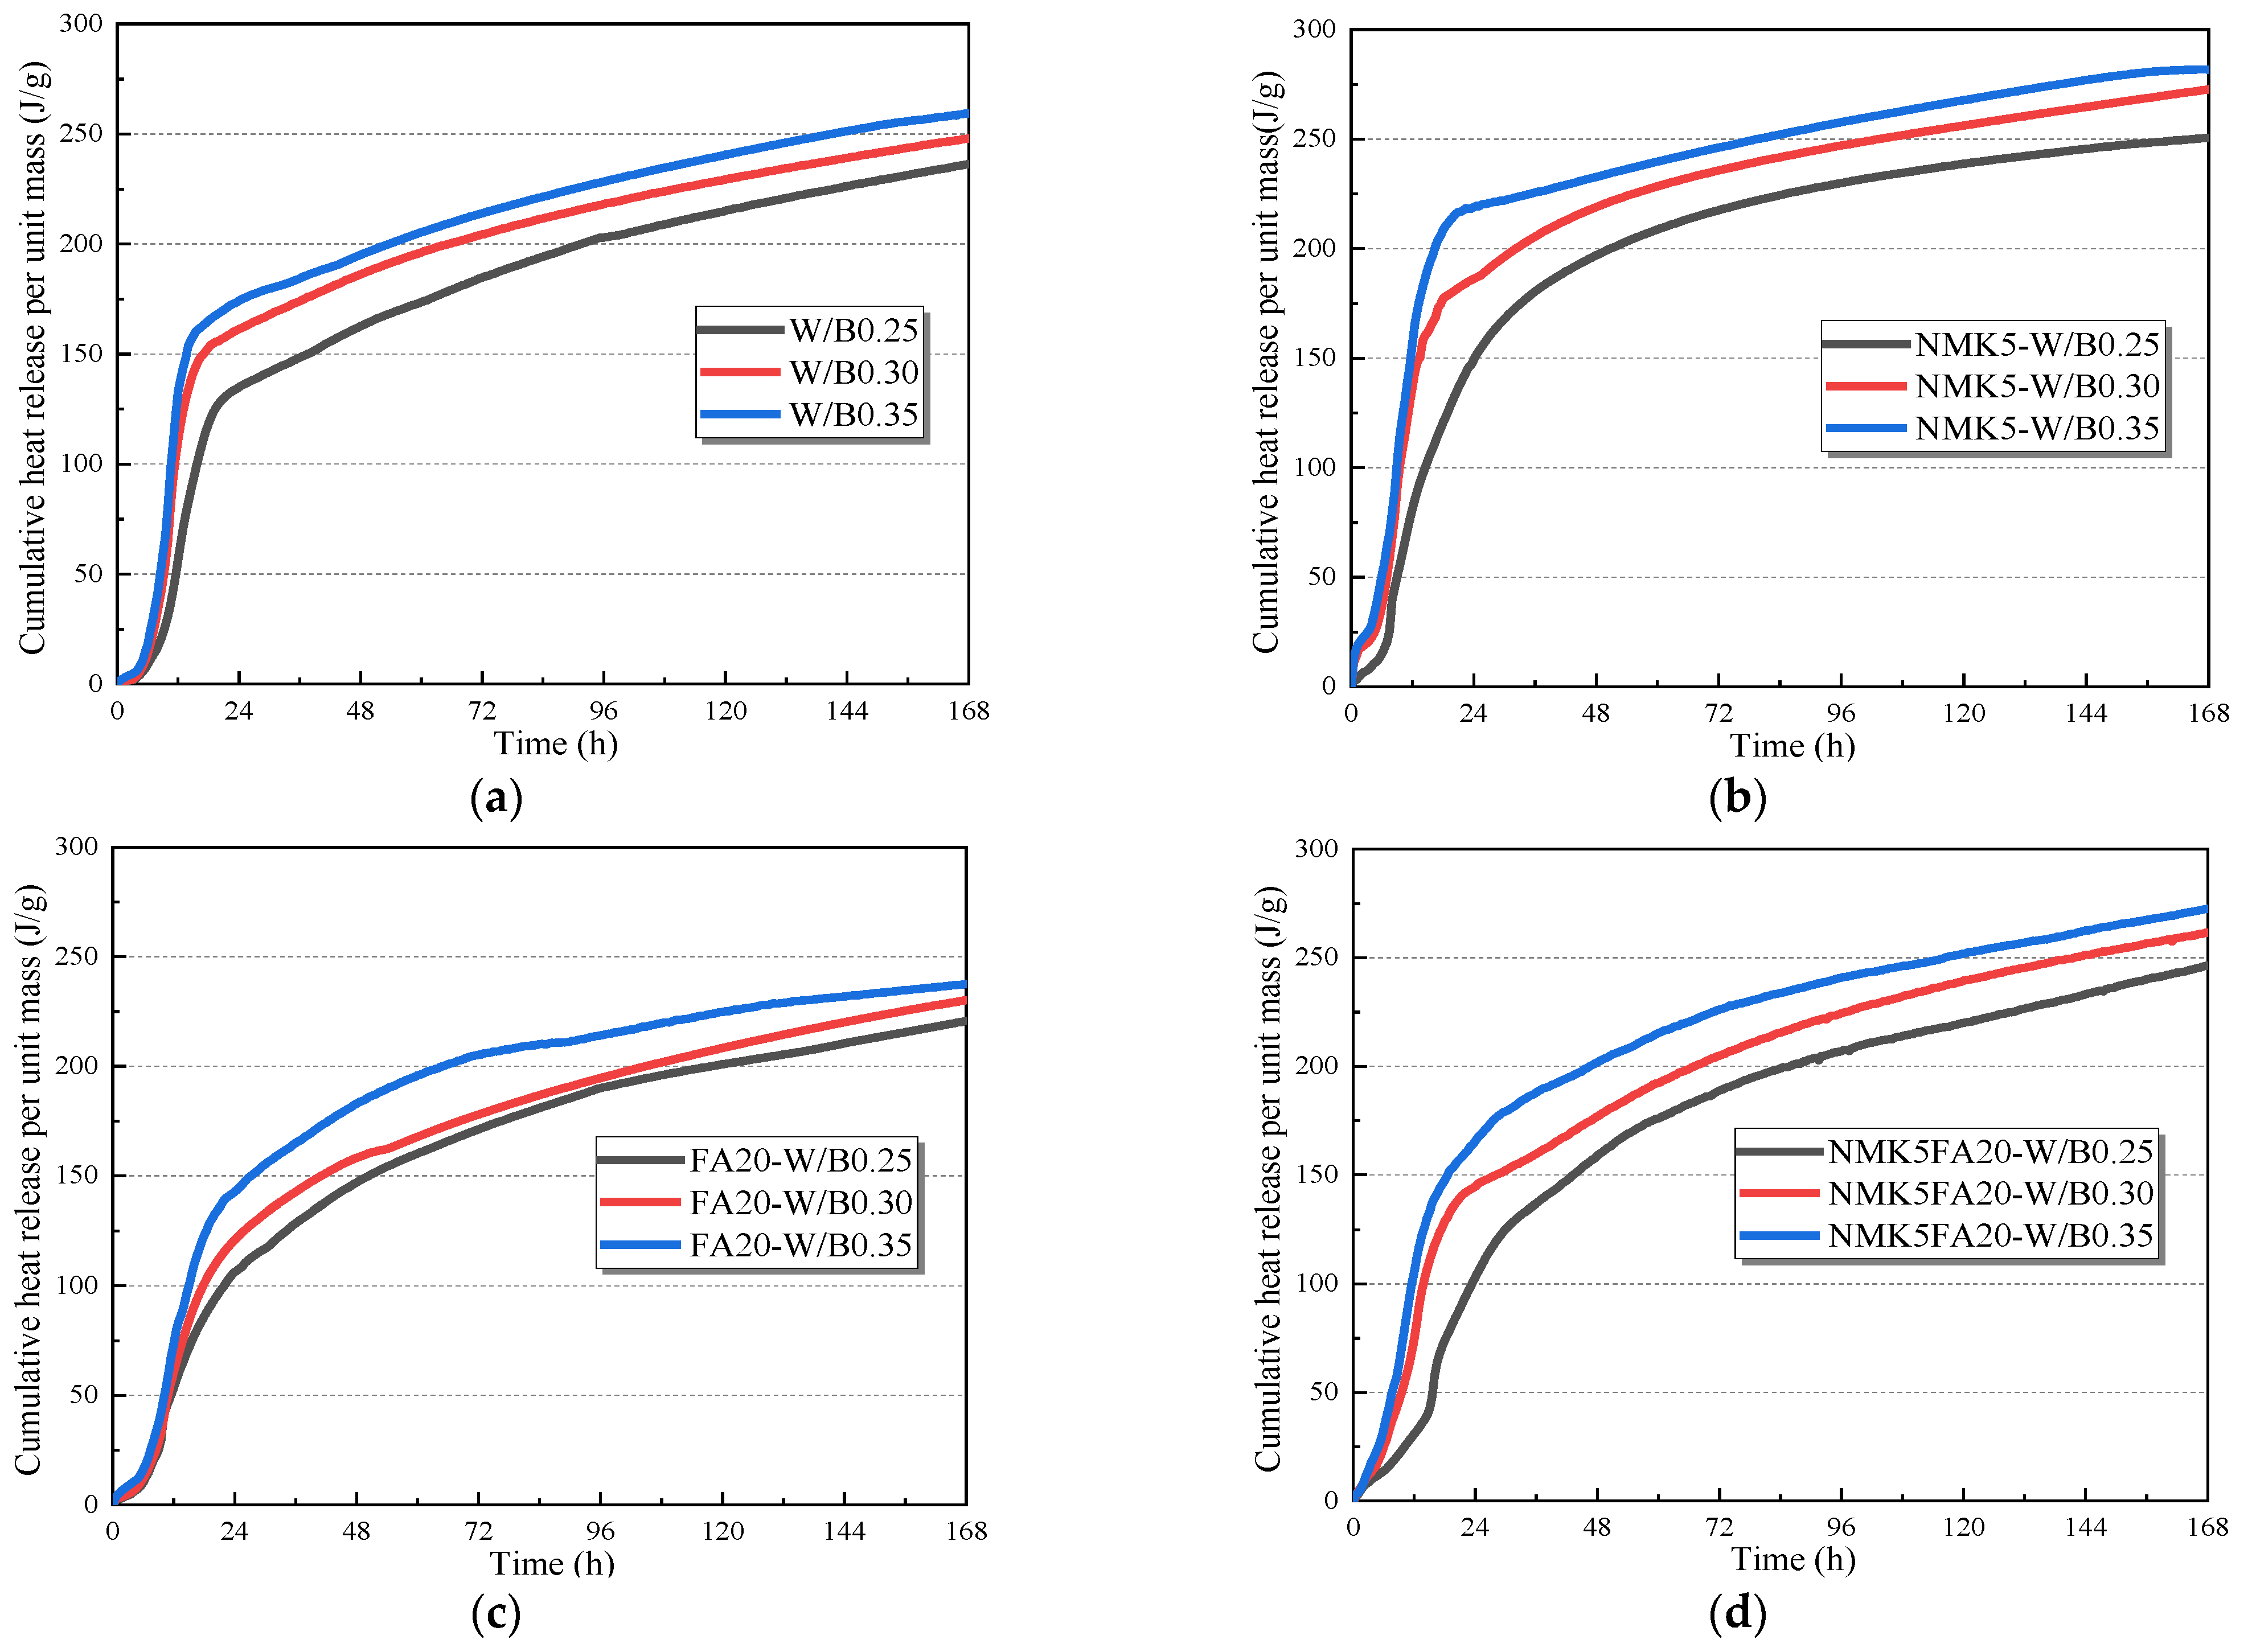
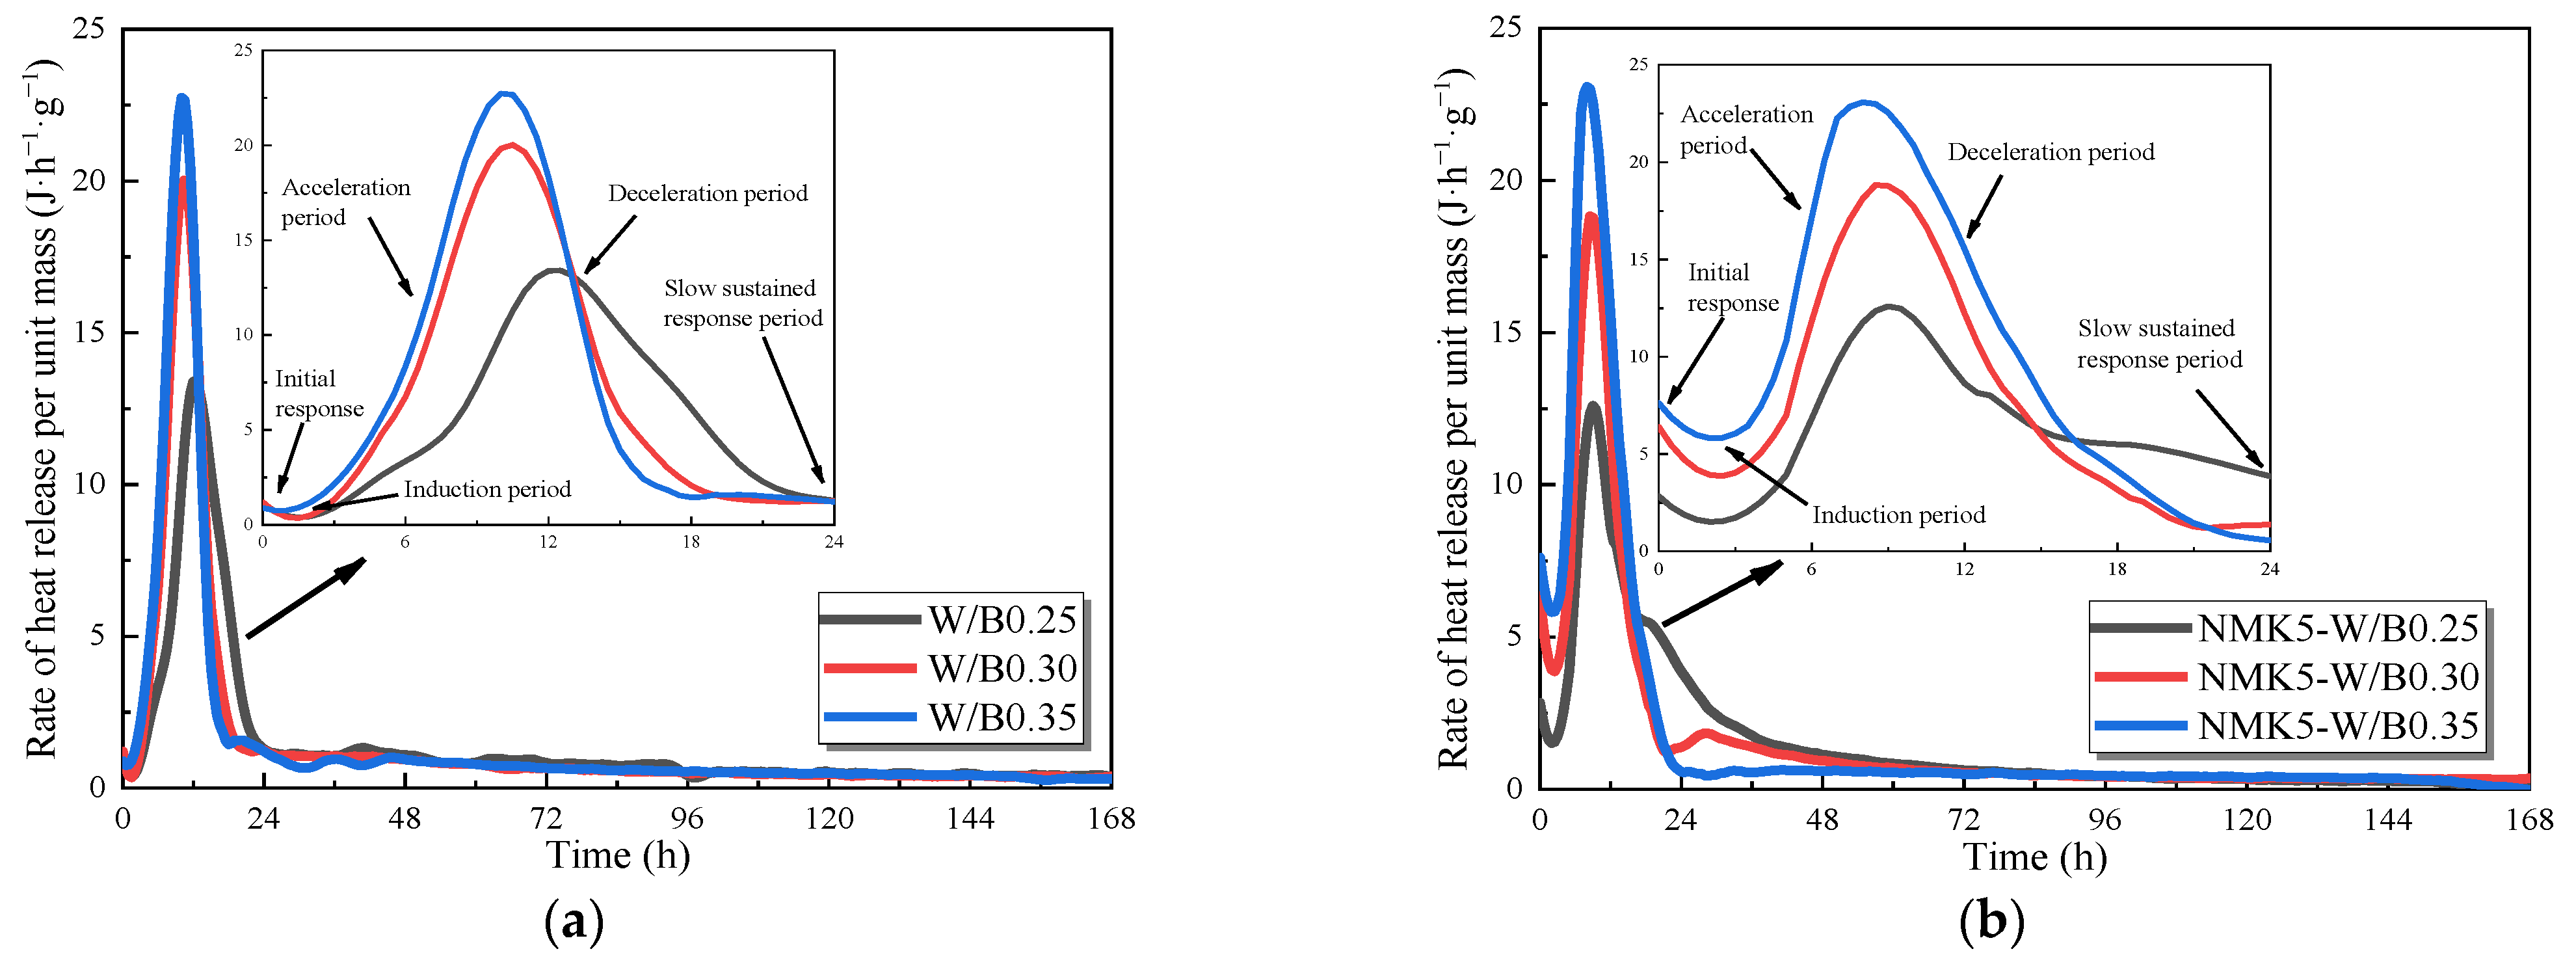
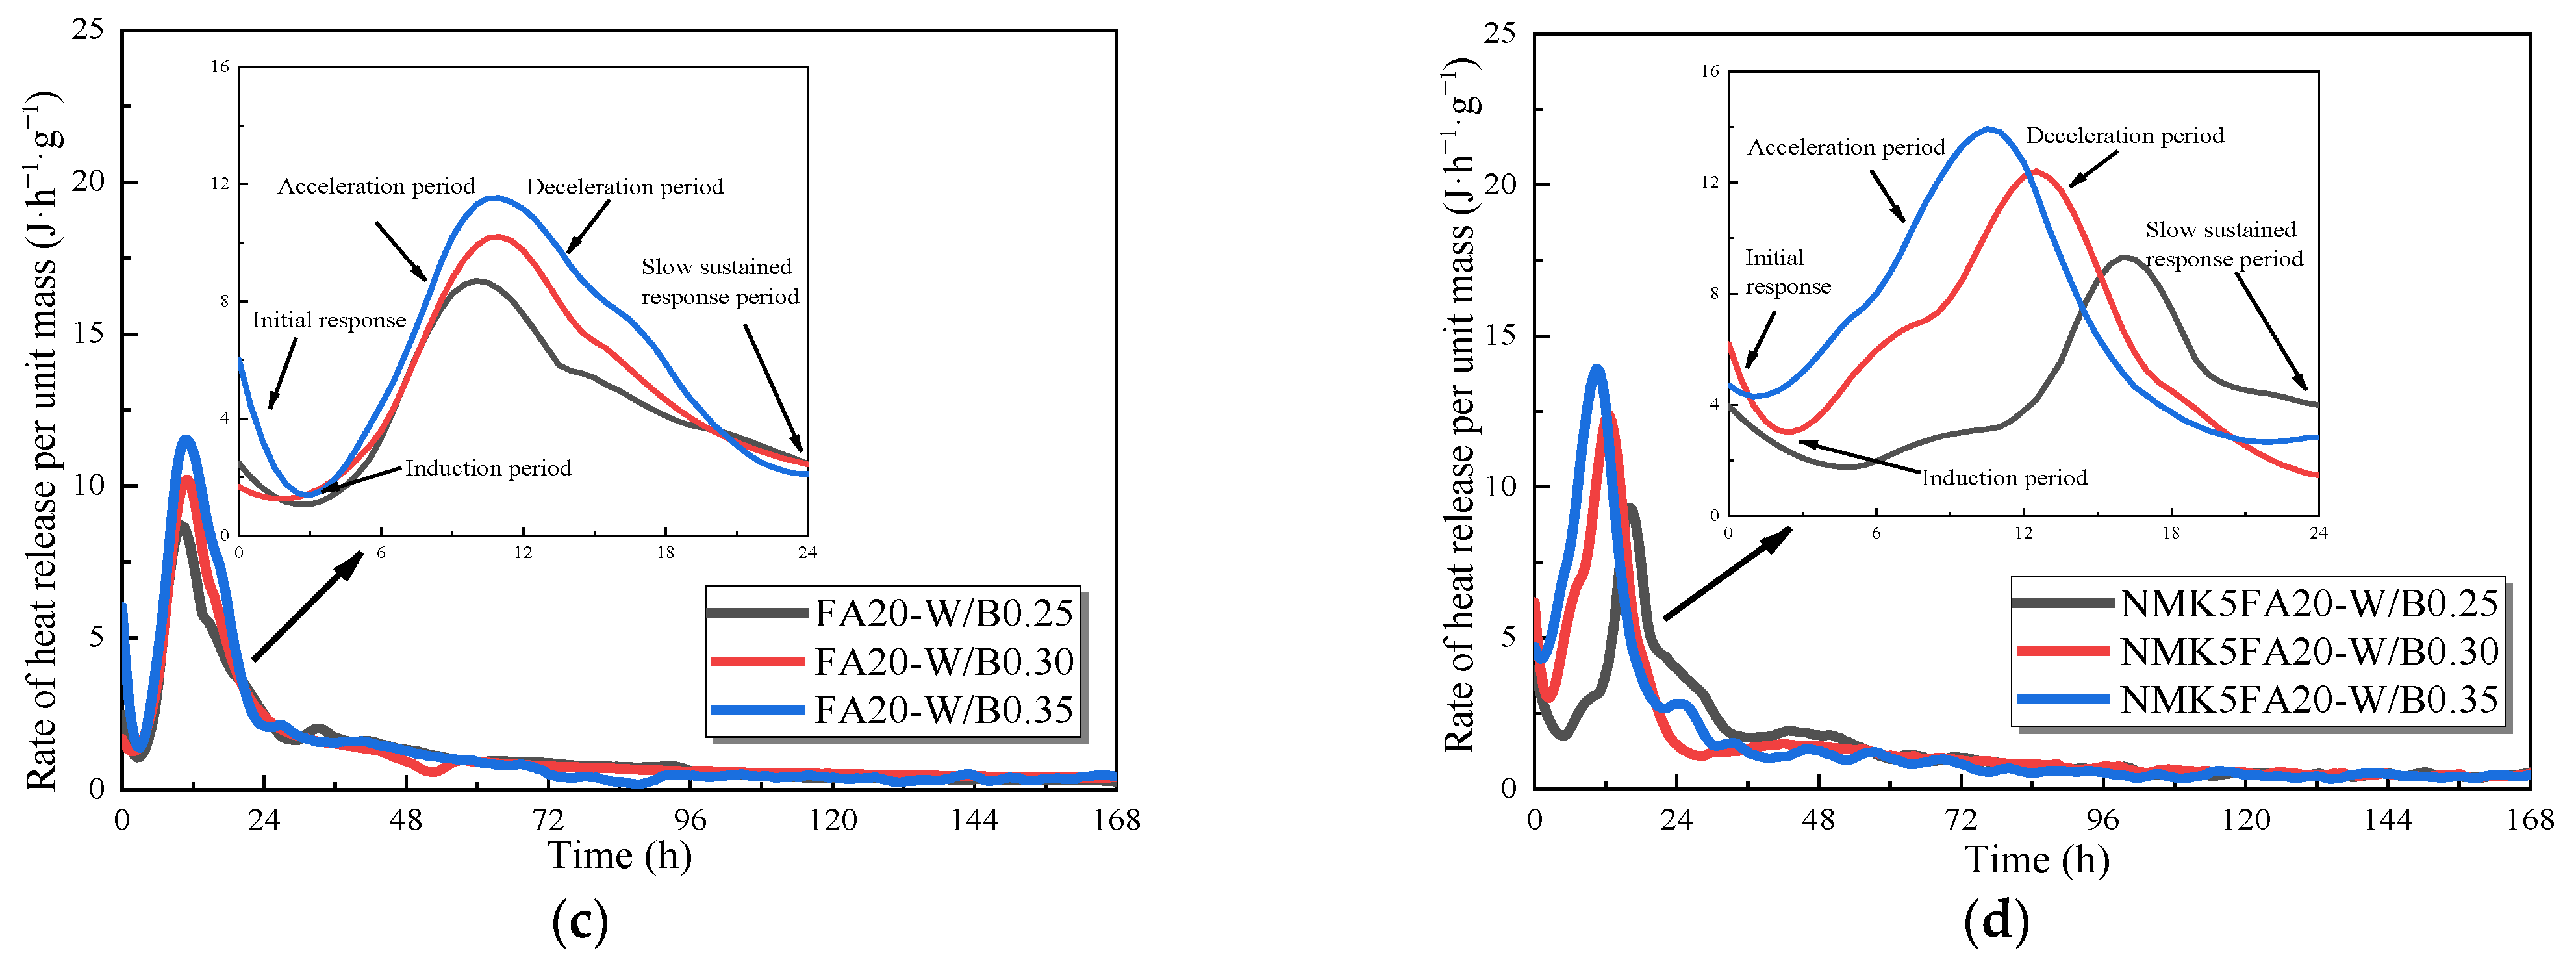
2.3.4. Hydration Heat Test

The hydration heat release behavior of cement paste was measured by an 8-channel cement hydration heat collecting instrument (Jingqiang Co., Ltd., Tianjin, China). The principle is the direct method prescribed by the test methods for heat of hydration of cement (GB/T 12959-2008) [27]. Three sets of parallel experiments were conducted for each mixing ratio of cement paste, and three measurements were made. The test temperature is 20 °C.

2.3.5. X-Ray Diffraction Test

The middle of the cement specimen was sampled and made into a thin slice, which was soaked in anhydrous ethanol for more than 24 h to terminate hydration. The wafer was dried under vacuum at 40 °C for 48 h, and the crystal phase change was analyzed by X-ray diffraction technique. The X-ray diffraction was analyzed by the Panako sharp XRD (Malvern Panalytical, London, UK) tester. The scanning range is 5–65°, and the speed is set to 0.02 per step.

2.3.6. Thermal Analyzer Test

After grinding the cement samples with mortar, sifting them through 80 μm fine screen, and preparing the analytical test samples of the cement-based composite materials, the prepared powder samples were analyzed using a comprehensive thermal analyzer made by TA Instruments (TA Instruments, Shanghai, China). The temperature range was from room temperature to 600 °C and the heating rate was 10 °C/min.

2.3.7. Scanning Electron Microscope Test

In this experiment, using the TFiSThermo Scientific Apreo S HiVac (Thermo Fisher Scientific, Shanghai, China) field emission scanning electron microscope, the test voltage was 20 kV. In order to reduce the test error, the central part of the broken specimen was selected to make thin slices. First, the sample is glued to the sample table with conductive adhesive, and it is sprayed with gold to make it conductive, and then the machine is turned on for observation.

2.3.8. Mercury Intrusion Porosimetry Test

The MicroActive-AutoPore V9600 (Micromeritics, Shanghai, China) mercury injection porosimetry instrument was used to determine the pore structure in cement paste. When preparing the mercury injection porosimetry test sample, select the middle of the cement specimen for sampling, and cut the sample into small pieces of 3 mm~4 mm with scissors.
Fractal dimension quantifies the roughness and complexity of internal pore structures. According to fractal theory, fractal dimensions range between 2 and 3; values outside this range indicate non-fractal pore characteristics. Compared to other pore structure parameters, fractal dimension more accurately characterizes the pore structure of cement paste [28]. Thus, this study employed the Zhang model [29], where the surface energy increase of mercury on material pore surfaces equals the work performed by mercury injection porosimetry during mercury intrusion porosimetry, as described in Equations (3) and (4).
W n = i = 1 n P i ¯ V i
Q n = V n 1 / 3 r n
  • W n and Q n : Calculated from mercury intrusion data;
  • n: Number of applied mercury pressure intervals;
  • P i ¯ : Average pressure;
  • V i : Mercury intrusion volume at pressure interval n;
  • V n : Total mercury intrusion volume;
  • r n : Pore diameter corresponding to the n-th mercury intrusion.
ln ( W n r n 2 ) = D ln Q n + ln C
D is the fractal dimension; C is the constant. Fractal dimension D is obtained as the slope of the linear fit using Equation (5).

3. Results and Discussion

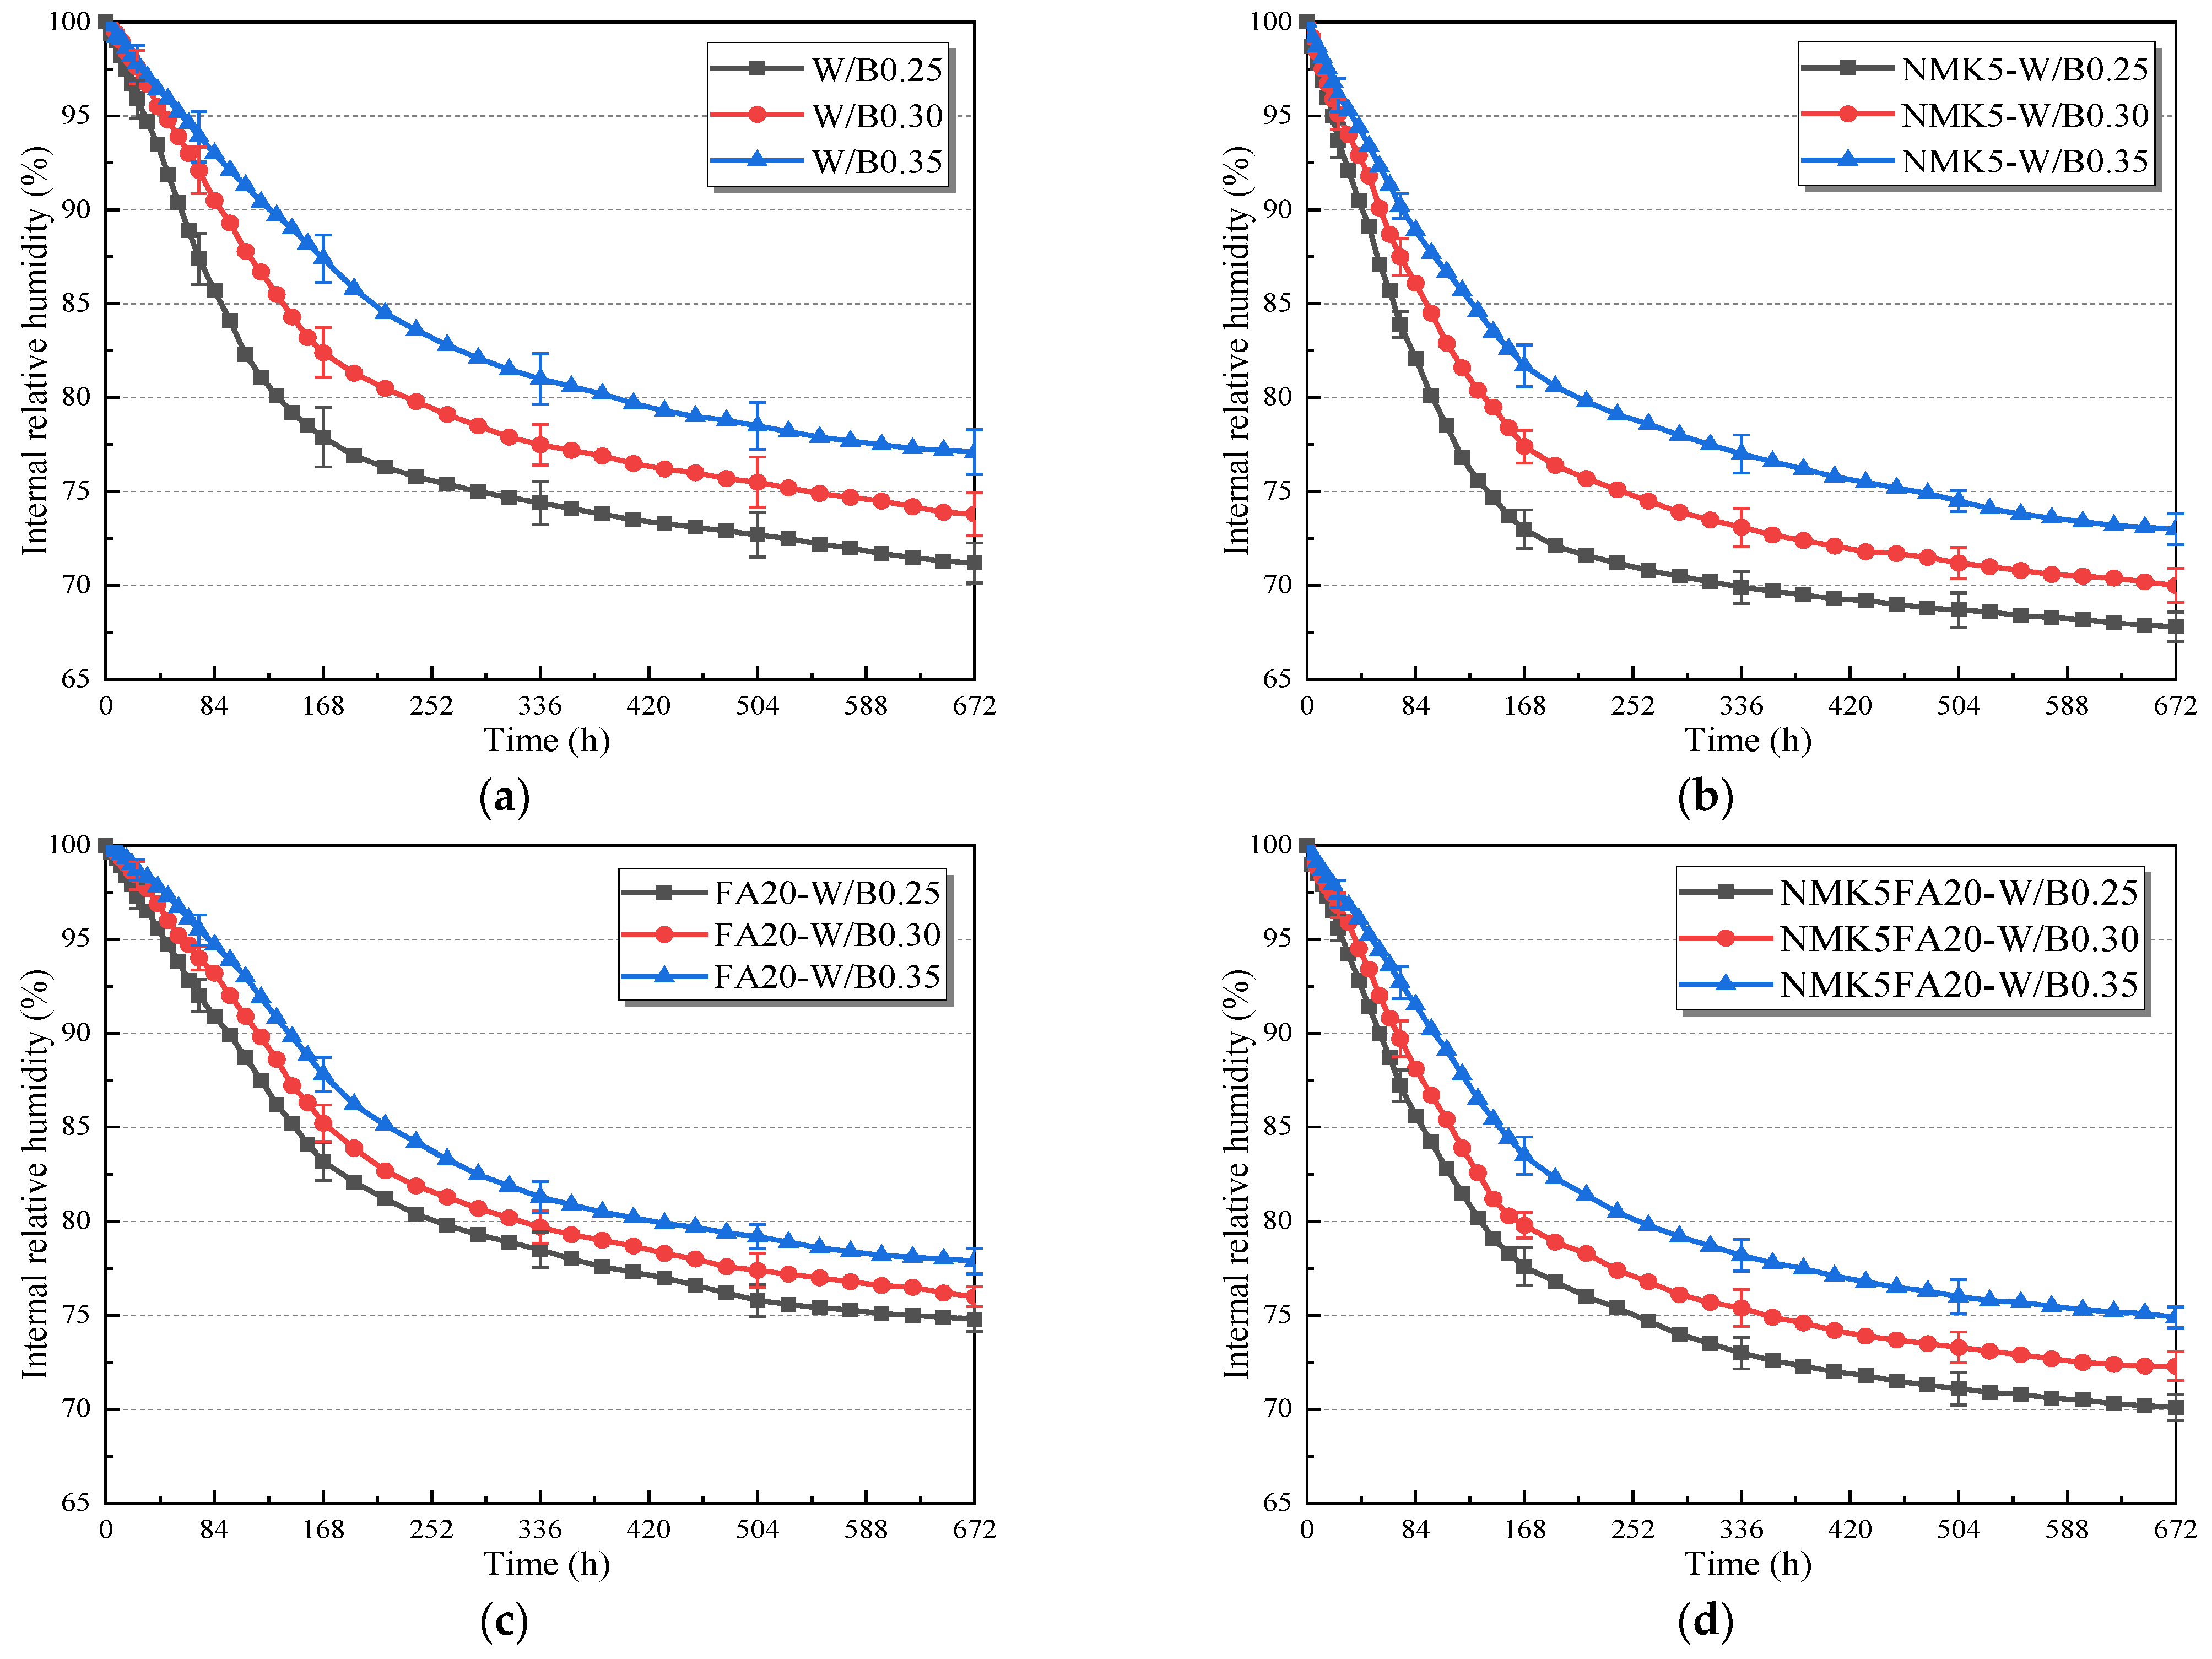
3.1. Internal Relative Humidity Changes in Cement Paste

Figure 8 presents the internal relative humidity (IRH) curves of cement pastes with different water-to-binder ratios (w/b). A continuous decrease in internal RH was observed in all cement pastes as hydration progressed, with a more rapid decline during the early hydration stage. At 28 days, the following was observed, compared to the 0.35 w/b reference: in the blank control group, IRH reductions for 0.25 and 0.30 w/b increased by 25.76% and 14.41%, respectively; in the nano-metakaolin (NMK)-blended group, they increased by 19.26% and 11.11%, respectively; in the fly ash (FA)-blended group, they increased by 14.03% and 8.59%, respectively; and in the NMK-FA composite group, they increased by 19.12% and 10.35%, respectively.
Lower w/b ratios accelerated the rate and magnitude of internal IRH decline due to reduced available water for hydration and increased water adsorption by cement particles. Compared to the blank group, the w/b ratio had a smaller impact on internal IRH in the FA-blended pastes. This is attributed to FA’s lower water adsorption capacity [28] and reduced water consumption from its low early reactivity. Thus, FA mitigated the severe self-desiccation caused by NMK under low w/b ratios when the two were combined.

3.2. Autogenous Shrinkage Changes in Cement Paste

Figure 9 shows the autogenous shrinkage curves of cement pastes with different water-to-binder ratios (w/b). Autogenous shrinkage primarily occurred within the first 7 days with rapid rates, slowing progressively with increasing age. Among all mix proportions, 0.25 w/b pastes consistently demonstrated the highest autogenous shrinkage. At 28 days, relative to the 0.35 w/b reference, the following occurred: In the blank control group, autogenous shrinkage for 0.25 and 0.30 w/b pastes increased by 41.09% and 17.28%, respectively. In the nano-metakaolin (NMK)-blended group, shrinkage for 0.25 and 0.30 w/b pastes increased by 49.23% and 22.99%, respectively. In the fly ash (FA)-blended group, shrinkage for 0.25 and 0.30 w/b pastes increased by 29.77% and 12.67%, respectively. In the NMK-FA composite group, shrinkage for 0.25 and 0.30 w/b pastes increased by 34.39% and 20.56%, respectively.
Lower w/b ratios increased autogenous shrinkage due to capillary tension-induced strain, with w/b being the dominant factor governing shrinkage magnitude and trends. Lower w/b systems contained less water per unit volume, which was progressively consumed during hydration, reducing pore solution volume and increasing capillary stress via smaller concave meniscus radii [30]. Compared to the blank group, the w/b ratio had a more pronounced effect on autogenous shrinkage in NMK-blended pastes but a lower impact on FA-blended pastes. As shown earlier, reduced w/b exacerbated internal IRH decline in NMK pastes, leading to higher capillary stresses under the capillary theory. In contrast, the w/b ratio minimally affected FA paste hydration and IRH, resulting in stable capillary stresses and limited shrinkage variation. When combined, FA significantly mitigated the excessive autogenous shrinkage caused by NMK under low w/b ratios.

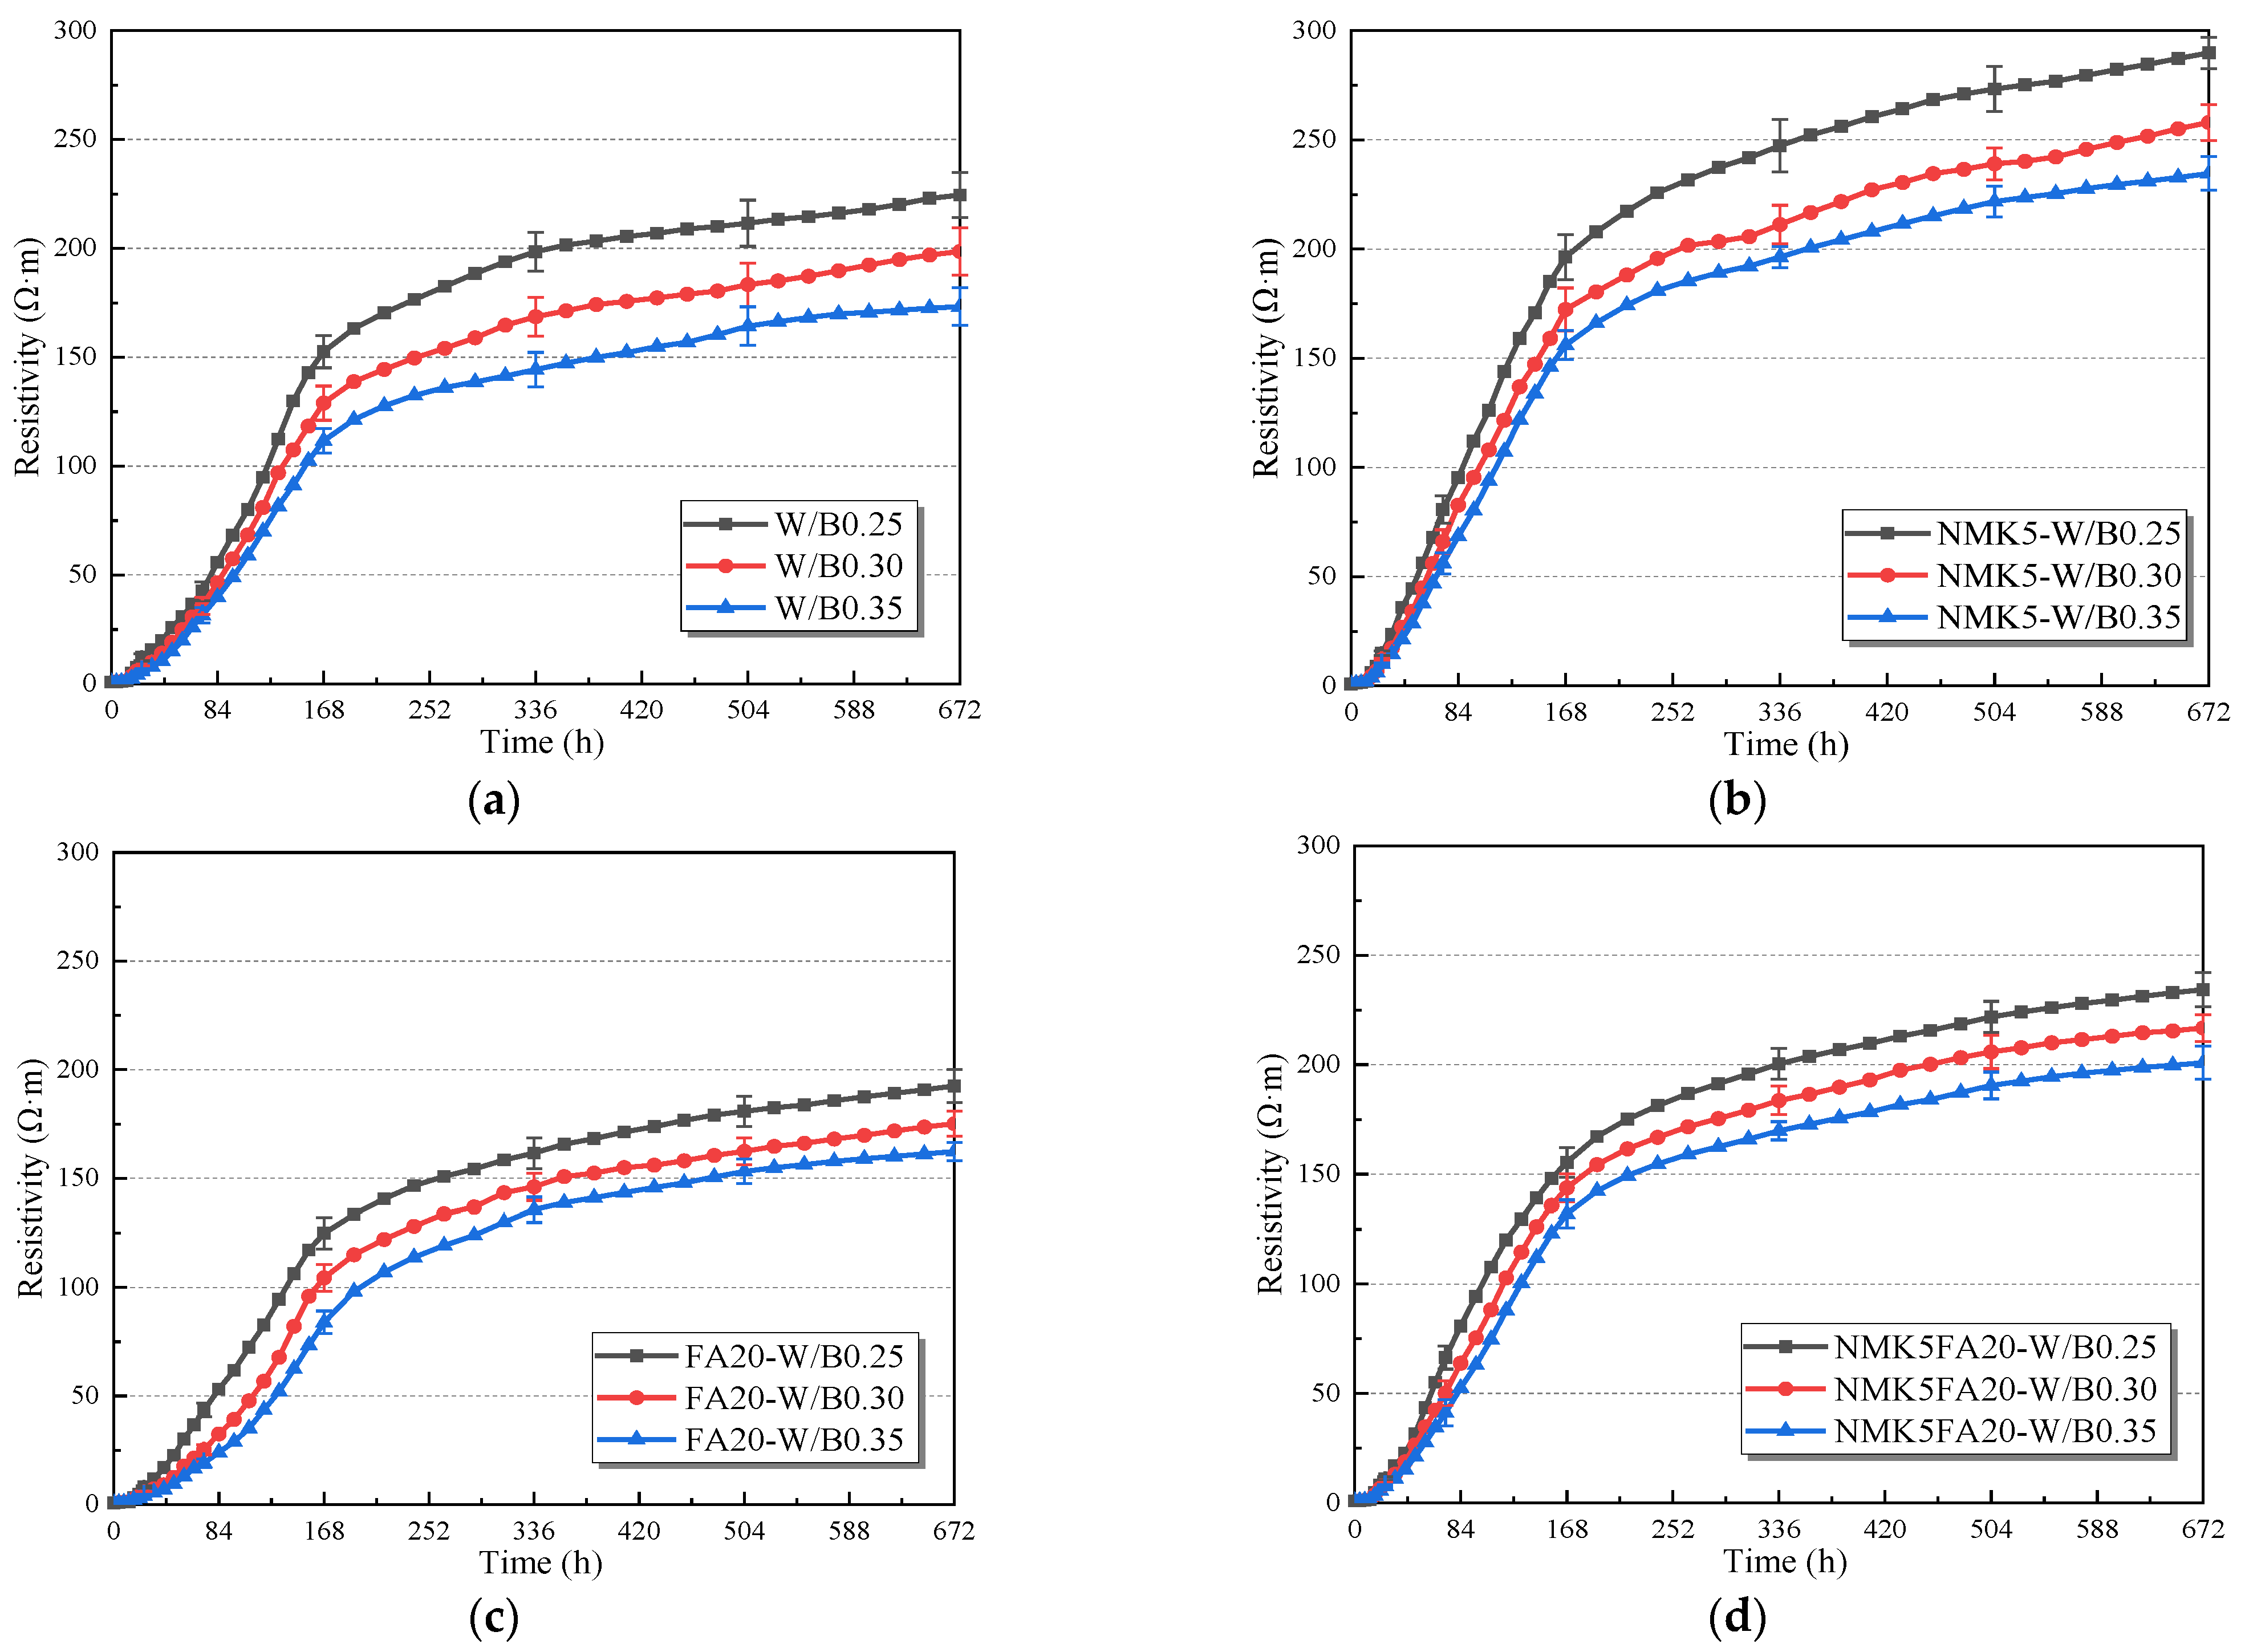
3.3. Resistivity Changes in Cement Paste

Figure 10 shows the resistivity curves of nano-metakaolin–fly ash cement pastes with a different water-to-binder ratio to explore its influence on their resistivity. As can be seen from Figure 10, the resistivity increased slowly before 1 day and then increased rapidly until 7 days with the increase in age. Among various mix proportions, the cement paste with a water-to-binder (w/b) ratio of 0.25 consistently exhibited the highest resistivity. At 28 days, compared to the paste with a w/b ratio of 0.35, the resistivity of pastes with w/b ratios of 0.25 and 0.30 increased as follows: in the blank control group, by 13.07% and 12.74%, respectively; in the nano-metakaolin-blended group, by 12.32% and 9.09%, respectively; in the fly ash-blended group, by 9.91% and 7.35%, respectively; and in the group with both nano-metakaolin and fly ash, by 8.08% and 7.33%, respectively.
It can be seen that the resistivity gradually increases as the water-to-binder ratio decreases. This is because the resistivity of cement paste mainly depends on the pore solution and porosity. In the cement paste with a low water-to-binder ratio, the internal relative humidity decreases significantly, resulting in a reduction in the pore solution. Moreover, the porosity of the cement paste system with a low water-to-binder ratio is relatively low, so the resistivity is relatively high. Compared with the blank group, the water-to-binder ratio has a smaller influence on fly ash cement, and as shown in the previous experiments, the water-to-binder ratio has a smaller influence on the hydration process and internal relative humidity of fly ash cement, leading to smaller changes in resistivity. Meanwhile, when nano-metakaolin and fly ash are used in combination, nano-metakaolin significantly promotes the increase in the resistivity of fly ash cement paste.

3.4. Influence of Water-to-Binder Ratio on Hydration Processes of Nano-Metakaolin and Fly Ash Cement

Figure 11 and Figure 12 present the cumulative heat release curves and heat release rate curves of cement pastes with different water-to-binder ratios (w/b), respectively. As hydration proceeded, the cumulative heat release increased gradually. Within the first 24 h, rapid hydration reactions led to a sharp rise in cumulative heat release. At 168 h, the following was observed, compared to the 0.30 w/b reference: in the blank control group, cumulative heat release for 0.35 and 0.40 w/b increased by 4.91% and 9.72%, respectively; in the nano-metakaolin (NMK)-blended group, it increased by 8.84% and 12.42%, respectively; in the fly ash (FA)-blended group, cumulative heat release for 0.35 and 0.40 w/b increased by 4.33% and 7.67%, respectively; and in the NMK-FA composite group, it increased by 5.96% and 10.38%, respectively. Figure 12 shows the hydration heat release rate curves of cement pastes with different w/b ratios. Five typical hydration stages were observed in all groups, with higher w/b ratios accelerating heat release rates and advancing the acceleration period [31,32]. Compared to 0.40 w/b, 0.30 and 0.35 w/b extended both the induction period and the time to the second heat release peak.
Increasing w/b ratios augmented cumulative heat release in all cement pastes due to enhanced water availability for hydration [33]. In low w/b systems, NMK’s strong water adsorption [34] reduced free water, limiting the hydration of both NMK and cement particles and decreasing cumulative heat release. Spherical FA’s lower specific surface area and water adsorption capacity [35], combined with its low early reactivity, maintained sufficient water for hydration even at low w/b, resulting in smaller heat release reductions. When combined, FA reduced the water demand of NMK-blended cement hydration while NMK promoted early FA hydration, thereby enhancing hydration efficiency and mitigating w/b effects.
Autogenous shrinkage increased with decreasing w/b ratios. Lower w/b pastes experienced faster internal IRH decline during hydration, augmenting capillary negative pressure and exacerbating autogenous shrinkage.

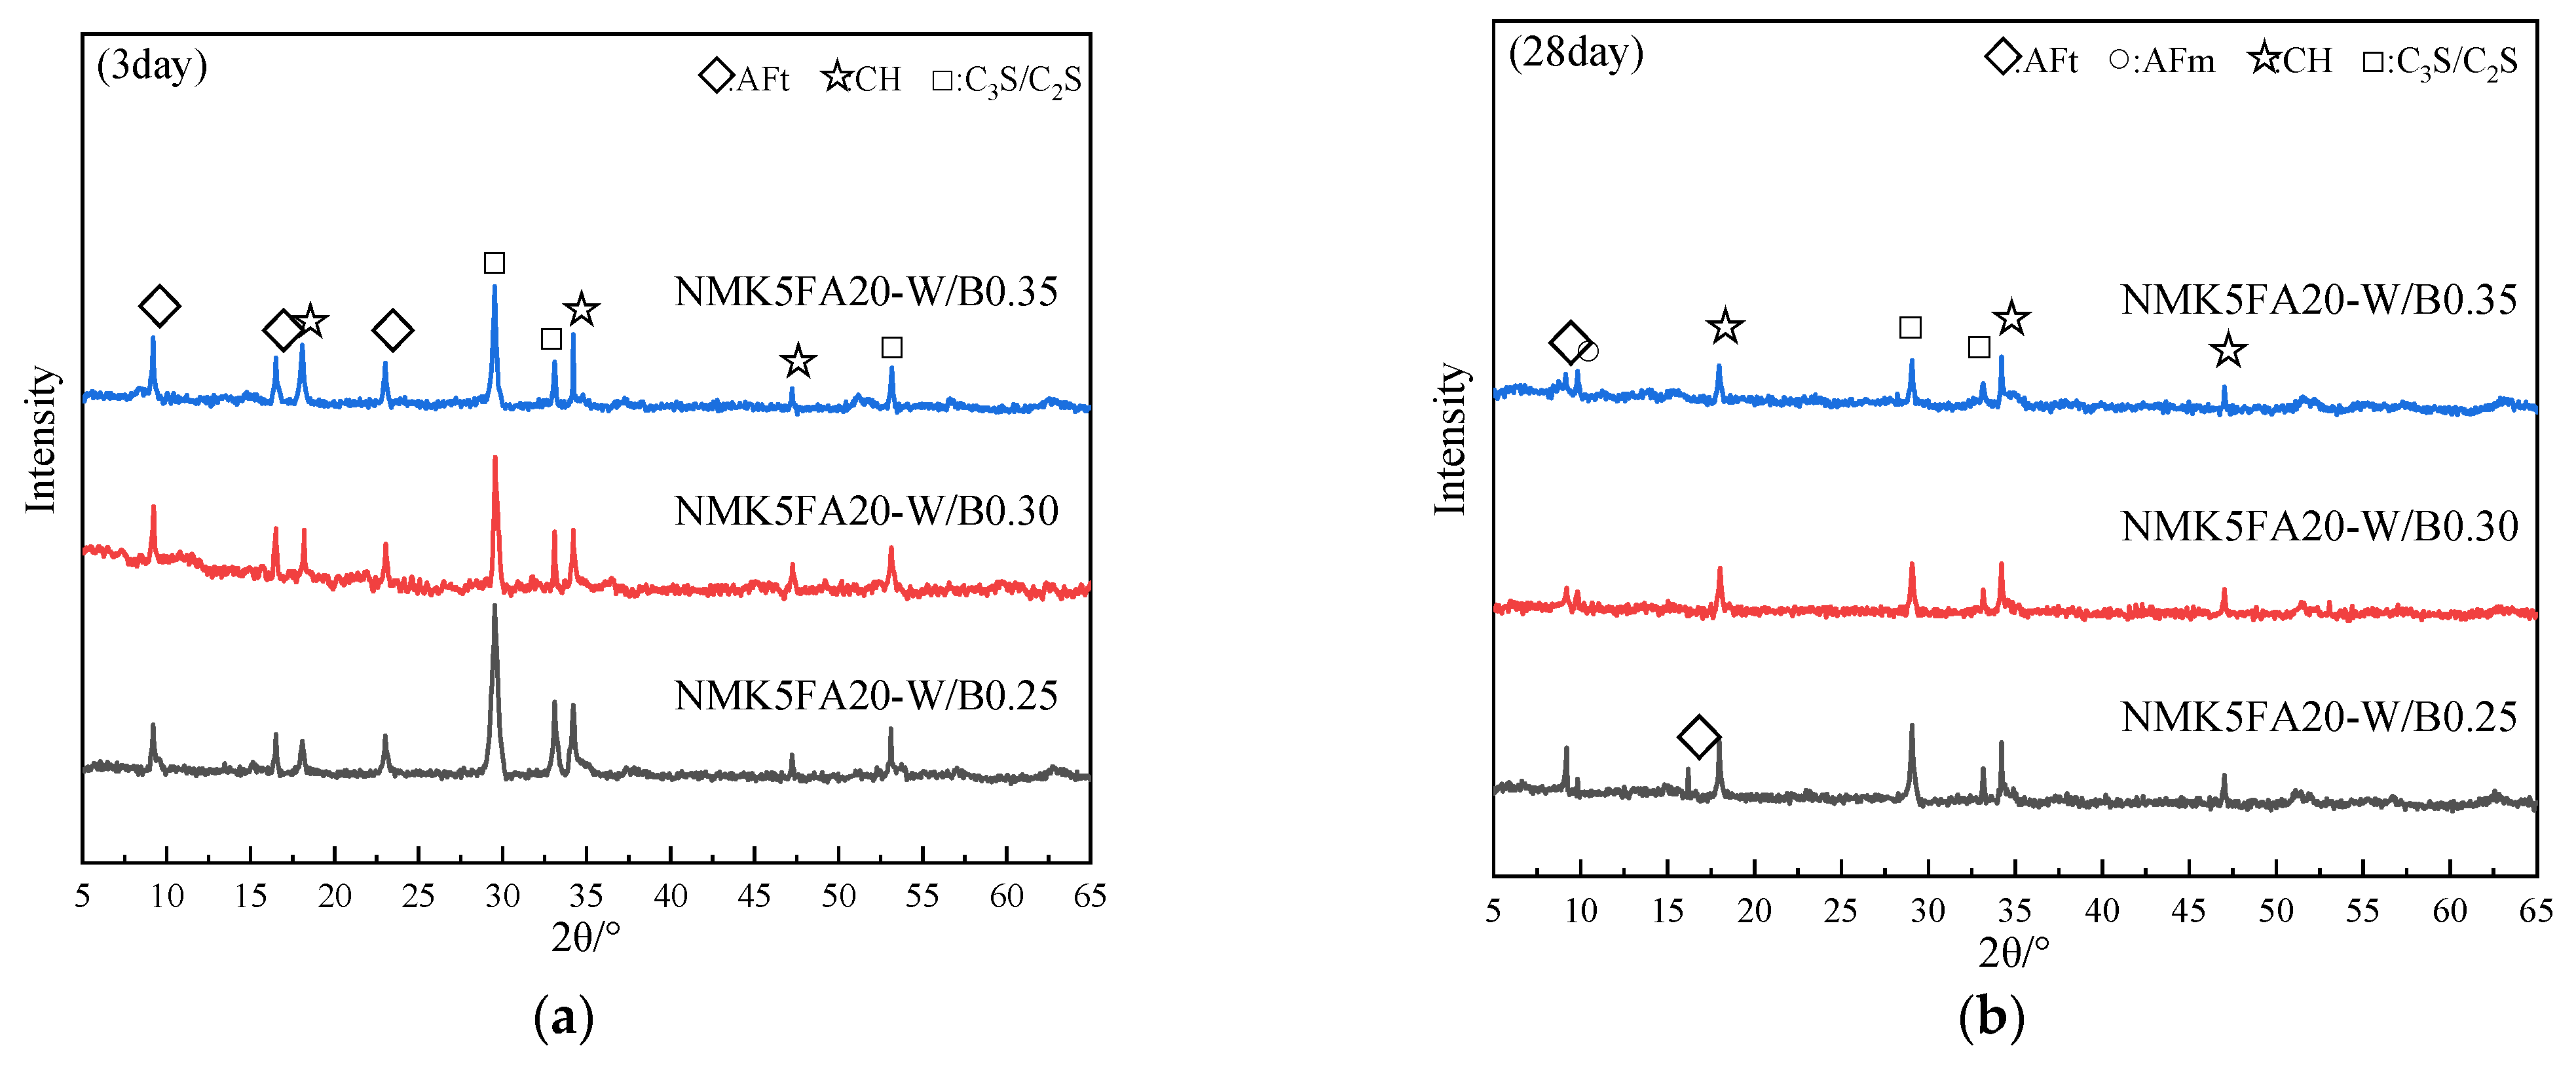
3.5. Influence of Water-to-Binder Ratio on Phase Composition of Nano-Metakaolin and Fly Ash Cement

The evolution of XRD patterns for nano-metakaolin–fly ash cement pastes with different water-to-binder ratios (w/b) over 28 days is shown in Figure 13. The hydration product systems remained relatively stable across w/b ratios, with dominant phases consistently including ettringite, calcium hydroxide, and unhydrated cement minerals—no new hydration phases were detected. With an increasing w/b ratio, diffraction peaks of ettringite and calcium hydroxide increased at 3 days, while those of unhydrated cement clinker decreased. As curing age increased to 28 days, ettringite, calcium hydroxide, and hydrated cement clinker peaks diminished, and monosulfate calcium sulfoaluminate peaks emerged. This phase transformation revealed a microstructure reorganization mechanism in late hydration: early-formed ettringite gradually transformed into more stable monosulfate products under reduced sulfate ion concentration in alkaline environments. In 0.30 and 0.35 w/b pastes, ettringite peaks nearly disappeared, and unhydrated cement particles were scarce, indicating hydration progression with sustained sufficient water supply. Higher w/b ratios promoted cement particle dispersion, dissolution, and hydration through increased free water availability.
Figure 14 shows the thermogravimetric analysis (TGA) weight loss curves of cement pastes with different water-to-binder ratios (w/b) at 28 days. With the increasing w/b ratio, the magnitude of weight loss gradually increased. The endothermic/exothermic decomposition patterns of hydration products in all groups mirrored the trends observed in their weight loss curves. At 28 days of curing, calcium hydroxide crystals in NMK5FA20-W/B0.30 and NMK5FA20-W/B0.35 decreased by 10.89% and 17.59% compared to NMK5FA20-W/B0.25, indicating reduced calcium hydroxide content in higher w/b pastes. This aligns with the XRD results, confirming that increased w/b ratios promoted hydration progression.
Based on previous findings, the autogenous shrinkage of cement paste increases with a decreasing water-to-binder ratio (w/b). Lower w/b ratios accelerate internal relative humidity (IRH) decline during hydration, augmenting capillary negative pressure and exacerbating autogenous shrinkage. Thus, the w/b ratio—not hydration behavior—is the dominant factor governing autogenous shrinkage in cementitious materials.
Figure 15 shows the microstructure of nano-metakaolin–fly ash cement pastes with different w/b ratios at 28 days of curing. At w/b = 0.25, unhydrated cement particles were abundant, and fly ash surfaces exhibited limited hydration products, indicating a low hydration degree. As w/b increased, cement hydration progressed, and hydration product coverage on fly ash surfaces expanded, which is consistent with the XRD results. Meanwhile, matrix densification decreased with increasing w/b. Collectively, low w/b ratios enhance matrix compactness, elevating capillary tension and promoting autogenous shrinkage development.

3.6. Influence of Water-to-Binder Ratio on Pore Structure of Nano-Metakaolin and Fly Ash Cement

The porosity, average aperture and median aperture obtained from the mercury injection porosimetry test are plotted in Table 3. As shown in Table 3, at w/b = 0.25, the nano-metakaolin–fly ash cement pastes exhibited porosity values of 26.29% and 14.43% at 3 days and 28 days, respectively, with corresponding average pore diameters of 20.02 nm and 14.92 nm, and median pore diameters of 31.81 nm and 15.59 nm. Compared to w/b = 0.25, increasing w/b to 0.30 increased the porosity, average pore diameter, and median pore diameter by 37.01%, 13.74%, and 43.36%, respectively, at 28 days. Further increasing w/b to 0.35 led to larger increases: 50.31%, 24.33%, and 54.84%, respectively. Excess water added during mixing forms capillary pores and voids after cement hardening. Lower w/b ratios reduce porosity by minimizing initial water content.
In order to further explore the distribution characteristics of pore structure, according to the test results, pores smaller than 10 nm are considered as gel pores, pores between 10 and 1000 nm are considered as capillary pores, and pores larger than 1000 nm are considered as macropores. The pore size distribution of nano-metakaolin–fly ash cement pastes with different water-to-binder ratios (w/b) is shown in Figure 16. The volume of capillary and macropores in cement pastes decreased with increasing age, while gel pore volume increased, indicating that hydration products progressively filled larger pores and refined the pore structure over time. Additionally, reducing w/b ratios led to pore distribution refinement. At lower w/b ratios, limited water availability during hydration resulted in smaller, uniformly distributed pores, optimizing the pore structure.
In summary, decreasing the water-to-binder ratio (w/b) reduces porosity and refines pore distribution. Low w/b cement pastes exhibit not only lower porosity but also smaller, uniformly distributed pores, leading to reduced internal relative humidity (RH) and higher capillary tension, thereby inducing greater autogenous shrinkage.
Calculated pore fractal dimensions of nano-metakaolin–fly ash cement pastes with different water-to-binder ratios (w/b) are presented in Table 4. The fractal dimension increased with curing age, indicating progressive pore structure coarsening and complexity. Lower w/b ratios also elevated the fractal dimension, reflecting rougher, more irregular pore structures under limited water conditions. At low w/b, insufficient hydration due to restricted water availability produced fewer, unevenly distributed hydration products. These products failed to form continuous, dense matrices during pore filling, resulting in scattered, random pore configurations—manifested as increased fractal dimension in fractal theory. Higher fractal dimensions signify greater pore structural complexity and irregularity.

4. Conclusions

(1)
Lower water-to-binder ratios (w/b) accelerated the rate and magnitude of internal relative humidity (RH) decline in cement pastes. Autogenous shrinkage increased with decreasing w/b, with the 28-day shrinkage of NMK-FA composite pastes increasing by 20.56% and 34.39% when w/b decreased from 0.40 to 0.35 and 0.30, respectively. Reduced w/b ratios had a more pronounced effect on autogenous shrinkage in NMK-blended pastes compared to FA-blended pastes. When combined, FA mitigated the excessive autogenous shrinkage caused by NMK under low w/b ratios.
(2)
Cement paste resistivity increased more rapidly at lower w/b ratios. When w/b decreased from 0.35 to 0.30 and 0.25, the 28-day resistivity of NMK-FA pastes increased by 8.08% and 7.33%, respectively. The w/b ratio had minimal impact on autogenous shrinkage and resistivity in FA-blended pastes.
(3)
Higher w/b ratios accelerated hydration rates and increased porosity. Pore structure coarsened with increasing w/b, with the 28-day porosity increasing by 50.31% when w/b increased from 0.25 to 0.35.
(4)
In low w/b hydration systems, rapid internal RH decline and pore refinement increased capillary stress, exacerbating autogenous shrinkage.

Author Contributions

Formal analysis and writing—review and editing, Y.L.; writing—original draft preparation, writing—review and editing and funding acquisition, S.Z.; formal analysis, Z.F.; formal analysis, M.S.; resources, formal analysis and investigation, Y.F.; methodology, S.P.S. All authors have read and agreed to the published version of the manuscript.

Funding

This research was financially supported by the National Natural Science Foundation of China (Grant No. 51908342), and by the Natural Science Foundation of Shandong Province (Grant No. ZR2018PEE021).

Data Availability Statement

The original contributions presented in this study are included in the article. Further inquiries can be directed to the corresponding author.

Acknowledgments

The authors gratefully acknowledge the support received from the National Natural Science Foundation of China and the Natural Science Foundation of Shandong Province.

Conflicts of Interest

The authors declare no conflicts of interest.

References

  1. Yu, R.; Zhang, J.; Liu, K.; Liao, M.; Shui, Z.; Zeng, M.; Hu, F.; Hou, D.; Wang, X. Evaluation and regulation of ultra-high performance concrete (UHPC) crack resistance based on physicochemical multi-factor coupling approach. Constr. Build. Mater. 2021, 301, 124100. [Google Scholar] [CrossRef]
  2. Shen, D.; Liu, C.; Kang, J.; Yang, Q.; Li, M.; Li, C.; Zeng, X. Early-age autogenous shrinkage and tensile creep of hooked-end steel fiber reinforced concrete with different thermal treatment temperatures. Cem. Concr. Compos. 2022, 131, 104550. [Google Scholar] [CrossRef]
  3. Klausen, A.E.; Kanstad, T.; Bjøntegaard, Ø. The cracking risk of hardening concrete exposed to realistic curing temperature regimes and restraint conditions experimental investigations of important parameters. Constr. Build. Mater. 2022, 338, 127662. [Google Scholar] [CrossRef]
  4. Wu, L.; Farzadnia, N.; Shi, C.; Zhang, Z.; Wang, H. Autogenous shrinkage of high performance concrete: A review. Constr. Build. Mater. 2017, 149, 62–75. [Google Scholar] [CrossRef]
  5. Wu, Y.; Yi, G.; Liu, Q.; Li, F.; Zhao, L.; Ma, M. Current Status of Comprehensive Utilization of Fly Ash. Clean Coal Technol. 2013, 6, 107–111. [Google Scholar]
  6. Shaikhf, U.A.; Dobson, J. Effect of fly ash on compressive strength and chloride binding of seawater-mixed mortars. J. Sustain. Cem.-Based Mater. 2019, 8, 275–289. [Google Scholar]
  7. Rukzon, S.; Chindaprasirt, P. Strength, porosity, and chloride resistance of mortar using the combination of two kinds of pozzolanic materials. Int. J. Miner. Metall. Mater. 2013, 20, 808–814. [Google Scholar] [CrossRef]
  8. Liao, Y.; Wei, X.; Zuo, Y. Effect of Fly Ash Content on Resistivity and Autogenous Shrinkage of Cement Paste. J. Build. Mater. 2014, 17, 517–520. [Google Scholar]
  9. Hao, C.; Deng, M.; Mo, L.; Liu, K. Influence of Fly Ash on Autogenous Shrinkage and Compressive Strength of Cement Paste. J. Build. Mater. 2011, 14, 746–751. [Google Scholar]
  10. Klemczak, B.; Golaszewski, J.; Smolana, A. Shrinkage behaviour of self-compacting concrete with a high volume of fly ash and slag experimental tests and analytical assessment. Constr. Build. Mater. 2023, 400, 132608. [Google Scholar] [CrossRef]
  11. Jiao, D.; Lesage, K.; Yardimci, M.Y.; Shi, C.; De Schutter, G. Possibilities of fly ash as responsive additive in magneto-rheology control of cementitious materials. Constr. Build. Mater. 2021, 296, 123656. [Google Scholar] [CrossRef]
  12. Fang, Z.; Luo, Y.; Chen, H.; Gao, Y.; Yang, W.; Wang, C. Research on mechanical properties and hydration characteristics of ultra-high performance concrete with high-volume fly ash microsphere. J. Build. Eng. 2023, 78, 107738. [Google Scholar] [CrossRef]
  13. Meng, J.; Zhong, J.; Xiao, H.; Ou, J. Interfacial design of nano-TiO2 modified fly ash-cement based low carbon composites. Constr. Build. Mater. 2021, 270, 121470. [Google Scholar] [CrossRef]
  14. Park, B.; Choi, Y.C. Hydration and pore-structure characteristics of high-volume fly ash cement pastes. Constr. Build. Mater. 2021, 278, 122390. [Google Scholar] [CrossRef]
  15. Garg, R.; Garg, R.; Eddy, N.O.; Khan, M.A.; Khan, A.H.; Alomayri, T.; Berwal, P. Mechanical strength and durability analysis of mortars prepared with fly ash and nano-metakaolin. Case Stud. Constr. Mater. 2023, 18, e01796. [Google Scholar] [CrossRef]
  16. Weng, J.; Liao, W. Microstructure and shrinkage behavior of high-performance concrete containing supplementary cementitious materials. Constr. Build. Mater. 2021, 308, 125045. [Google Scholar] [CrossRef]
  17. Gao, X.; Kawashima, S.; Liu, X.; Shah, S.P. Influence of clays on the shrinkage and cracking tendency of SCC. Cem. Concr. Compos. 2012, 34, 478–485. [Google Scholar] [CrossRef]
  18. Bentz, D.P. A review of early-age properties of cement-based materials. Cem. Concr. Res. 2008, 38, 196–204. [Google Scholar] [CrossRef]
  19. Luo, Y. Study on Autogenous Shrinkage Properties of Cement-Based Materials. Master’s Thesis, Huazhong University of Science and Technology, Wuhan, China, 2020. [Google Scholar]
  20. Li, Z.; Liang, X.; Chen, Y.; Ye, G. Effect of metakaolin on the autogenous shrinkage of alkali-activated slag-fly ash paste. Constr. Build. Mater. 2021, 278, 122397. [Google Scholar] [CrossRef]
  21. Luo, D.; Wei, J. Early-age shrinkage behavior of cement mixtures regulated with metakaolin-based internal conditioning. Appl. Clay Sci. 2024, 261, 107583. [Google Scholar] [CrossRef]
  22. Qian, T. Study on Shrinkage and Mechanism of Cement-Based Materials with Low Water-Binder Ratio and High Volume Mineral Admixtures. Ph.D. Thesis, Southeast University, Nanjing, China, 2006. [Google Scholar]
  23. Wyrzykowski, M.; Assmann, A.; Hesse, C.; Lura, P. Microstructure development and autogenous shrinkage of mortars with C-S-H seeding and internal curing. Cem. Concr. Res. 2020, 129, 105967. [Google Scholar] [CrossRef]
  24. He, J.; Long, G.; Ma, K.; Xie, Y. Comprehensive study on the hydration kinetics, mechanical properties and autogenous shrinkage of cement pastes during steam curing. Cem. Concr. Res. 2023, 174, 107310. [Google Scholar] [CrossRef]
  25. Dong, E.; Chen, Z.; Wu, C. New insights into determining the “time zero” of autogenous shrinkage in low water/binder cement-based composites (LW/B-CC) system based on relaxation theory. J. Build. Eng. 2023, 66, 105852. [Google Scholar] [CrossRef]
  26. Wyrzykowski, M.; Hu, Z.; Ghourchian, S.; Scrivener, K.; Lura, P. Corrugated tube protocol for autogenous shrinkage measurements: Review and statistical assessment. Mater. Struct. 2017, 50, 57. [Google Scholar] [CrossRef]
  27. GB/T 12959-2008; Test Methods for Heat of Hydration of Cement. China Standards Press: Beijing, China, 2008; pp. 4–6.
  28. Shukla, B.K.; Gupta, A.; Gowda, S.; Srivastav, Y. Constructing a greener future: A comprehensive review on the sustainable use of fly ash in the construction industry and beyond. Mater. Today Proc. 2023, 93, 257–264. [Google Scholar] [CrossRef]
  29. Zhang, B.; Li, S. Determination of the surface fractal dimension for porous media by mercury porosimetry. Ind. Eng. Chem. Res. 1995, 34, 1383–1386. [Google Scholar] [CrossRef]
  30. Kassai, Y.; Vokoyama, K.; Matsui, I. Tensile properties of early-age concrete. Conf. Mech. Behav. Mater. 1972, 4, 288–299. [Google Scholar]
  31. Kong, X.; Lu, Z.; Zhang, Z. Research Progress on Cement Hydration Mechanism and Effects of Polymer Admixtures on Cement Hydration. J. Chin. Ceram. Soc. 2017, 45, 274–281. [Google Scholar]
  32. Nalet, C.; Nonat, A. Effects of functionality and stereochemistry of small organic molecules on the hydration of tricalcium silicate. Cem. Concr. Res. 2016, 87, 97–104. [Google Scholar] [CrossRef]
  33. Luo, D.; Niu, D. Effects of Different Water-Binder Ratios and Curing Conditions on Water Absorption Properties of Internal Curing Concrete. J. Build. Struct. 2019, 40, 165–173. [Google Scholar]
  34. Li, Q.; Fan, Y.; Li, X. Effects of Environmental Temperature and Hydration Time on Rheological Properties of Nano-Metakaolin Cement Paste. J. Basic Sci. Eng. 2023, 31, 509–521. [Google Scholar]
  35. Jin, S.; Zheng, G.; Yu, J. A micro freeze-thaw damage model of concrete with fractal dimension. Constr. Build. Mater. 2020, 257, 119434. [Google Scholar] [CrossRef]
Figure 1. Micromorphologies of cement, nano-metakaolin, and fly ash. (a) Cement; (b) nano-metakaolin; (c) fly ash.
Buildings 15 01444 g001
Figure 2. Particle size distribution of cement, nano-metakaolin, and fly ash.
Buildings 15 01444 g002
Figure 3. Schematic of cement paste preparation.
Buildings 15 01444 g003
Figure 4. Internal relative humidity test diagram.
Buildings 15 01444 g004
Figure 5. Dial indicator and autogenous shrinkage test diagram.
Buildings 15 01444 g005
Figure 7. Four-probe square resistance resistivity tester and four-probe test head.
Buildings 15 01444 g007
Figure 8. Internal relative humidity of cement pastes with different W/B ratios. (a) Control cement; (b) nano-metakaolin cement; (c) fly ash cement; (d) nano-metakaolin–fly ash cement.
Buildings 15 01444 g008
Figure 9. Autogenous shrinkage of cement pastes with different W/B ratios. (a) Control cement; (b) nano-metakaolin cement; (c) fly ash cement; (d) nano-metakaolin–fly ash cement.
Buildings 15 01444 g009
Figure 10. Electrical resistivity of cement pastes with different W/B ratios. (a) Control cement; (b) nano-metakaolin cement; (c) fly ash cement; (d) nano-metakaolin–fly ash cement.
Buildings 15 01444 g010
Figure 11. Cumulative heat release curves of cement pastes with different W/B ratios. (a) Control cement; (b) nano-metakaolin cement; (c) fly ash cement; (d) nano-metakaolin–fly ash cement.
Buildings 15 01444 g011
Figure 12. Heat release rate curves of cement pastes with different W/B ratios. (a) Control cement; (b) nano-metakaolin cement; (c) fly ash cement; (d) nano-metakaolin–fly ash cement.
Buildings 15 01444 g012aBuildings 15 01444 g012b
Figure 13. XRD patterns of cement pastes with different W/B ratios: (a) 3 days; (b) 28 days.
Buildings 15 01444 g013
Figure 14. TG curves of cement pastes with different W/B ratios 28 days.
Buildings 15 01444 g014
Figure 15. Microstructures of cement pastes with different W/B ratios over for 28 days. (a) NMK5FA20-W/B0.25; (b) NMK5FA20-W/B0.30; (c) NMK5FA20-W/B0.35.
Buildings 15 01444 g015
Figure 16. Pore size distribution of cement pastes with different W/C ratios.
Buildings 15 01444 g016
Table 1. Chemical composition of cement, nano-metakaolin, and fly ash (wt.%).
Chemical MakeupCaOSiO2Al2O3Fe2O3MgOK2OSO3Other
cement59.3121.906.263.791.630.942.413.76
nano-metakaolin0.1046.8250.460.440.130.581.47
fly ash3.1653.8024.609.321.520.821.965.64
Table 2. Mix ratio of different W/C ratio samples.
Specimen NumberCement (%)Nano Metakaolin (%)Coal Fly Ash (%)W/B Ratio
W/B0.251000.25
NMK5-W/B0.259550.25
FA20-W/B0.2580200.25
NMK5FA20-W/B0.25755200.25
W/B0.251000.30
NMK5-W/B0.309550.30
FA20-W/B0.3080200.30
NMK5FA20-W/B0.30755200.30
W/B0.351000.35
NMK5-W/B0.359550.35
FA20-W/B0.3580200.35
NMK5FA20-W/B0.35755200.35
Table 3. Pore characteristics of cement pastes with different W/C ratios.
NumberAgePorosity/%Average Pore Size/nmMedian Pore Size/nm
NMK5FA20-W/B0.253d26.2920.0231.81
28d14.4314.9215.59
NMK5FA20-W/B0.303d27.0721.6339.97
28d19.7716.9722.35
NMK5FA20-W/B0.353d28.0323.0541.51
28d21.6918.5524.17
Table 4. Fractal dimension of cement pastes with different W/C ratios.
NumberAgeGel PoreCapillary PoreMacropore
Fractal DimensionCorrelationFractal DimensionCorrelationFractal DimensionCorrelation
NMK5FA20-W/B0.253d2.660.9842.770.9942.800.978
28d2.700.9622.960.9812.850.985
NMK5FA20-W/B0.303d2.630.9652.740.9872.790.996
28d2.670.9962.910.9852.830.993
NMK5FA20-W/B0.353d2.610.9652.710.9782.790.969
28d2.650.9862.860.9862.820.992
Disclaimer/Publisher’s Note: The statements, opinions and data contained in all publications are solely those of the individual author(s) and contributor(s) and not of MDPI and/or the editor(s). MDPI and/or the editor(s) disclaim responsibility for any injury to people or property resulting from any ideas, methods, instructions or products referred to in the content.

