
Comparative Analysis of TAG (Three-Dimensional Architectural Greening) Scenic Beauty Quantitative Techniques Based on Visual Perception
Abstract
1. Introduction
2. Methods
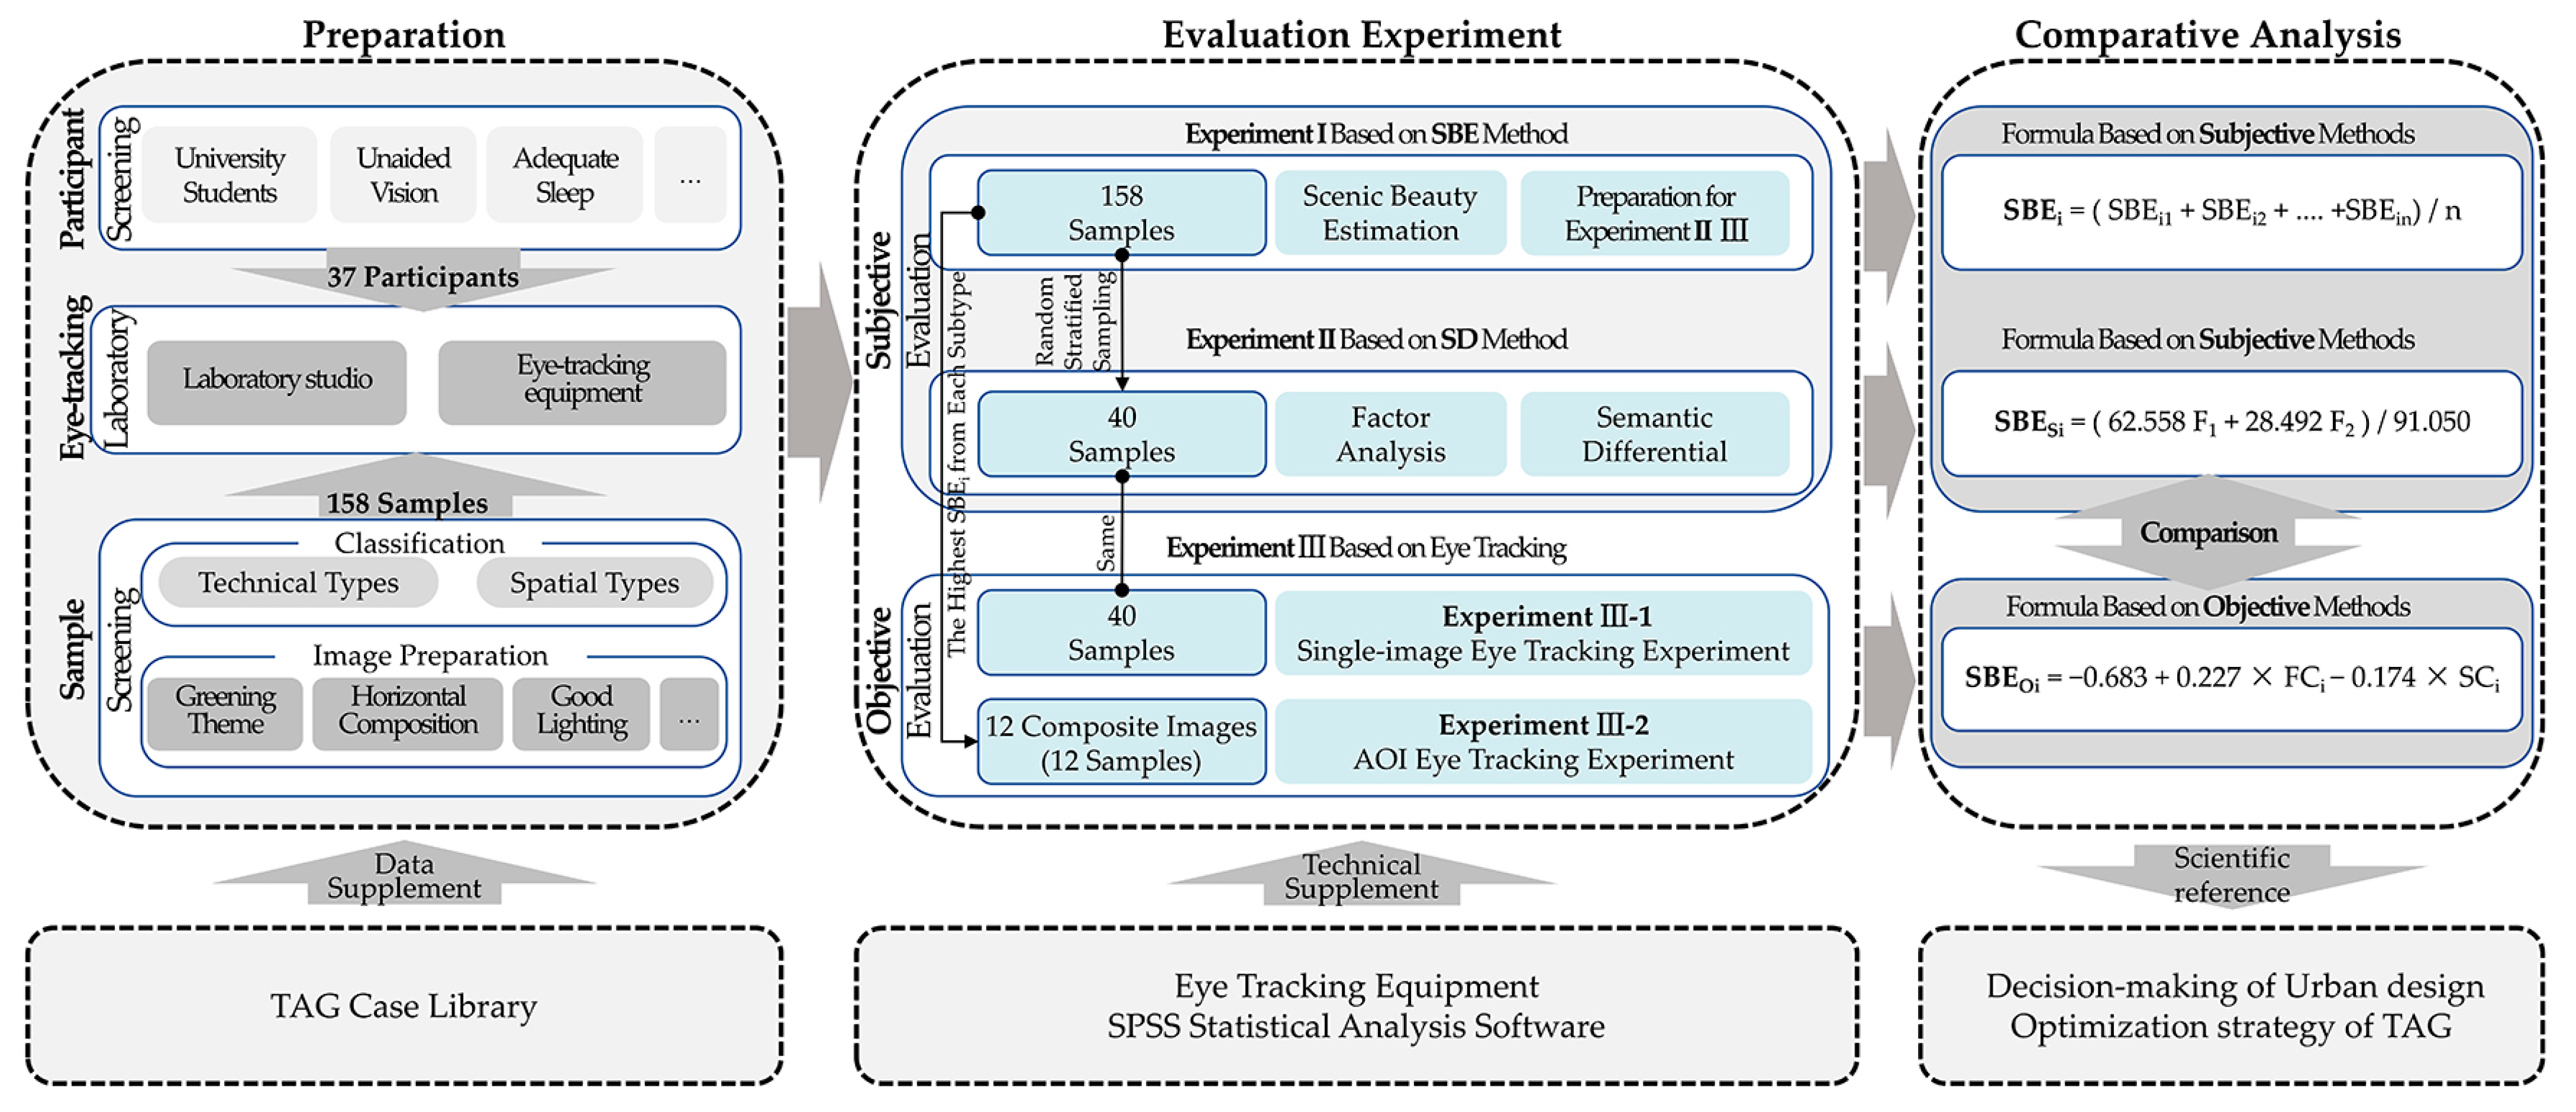
- Experimental preparation: To provide representative examples for the visual perception-based scenic beauty study, a TAG sample case library was first created. The experimental preparation arrangement includes sample screening (158 samples), participant screening (37 people), and venue and equipment (eye-tracking laboratory).
- Evaluation experiment: Three experiments were performed to assess the scenic beauty of typical samples, using the SBE approach, SD method, and eye-tracking method. Experiment Ⅰ and Experiment Ⅱ were subjective, while Experiment Ⅲ was objective.
- Comparative analysis: The correlation between subjective and objective evaluations was studied using comparison analysis, which not only compares the three assessing formulas of scenic beauty proposed in this study but also verifies their scientific validity.
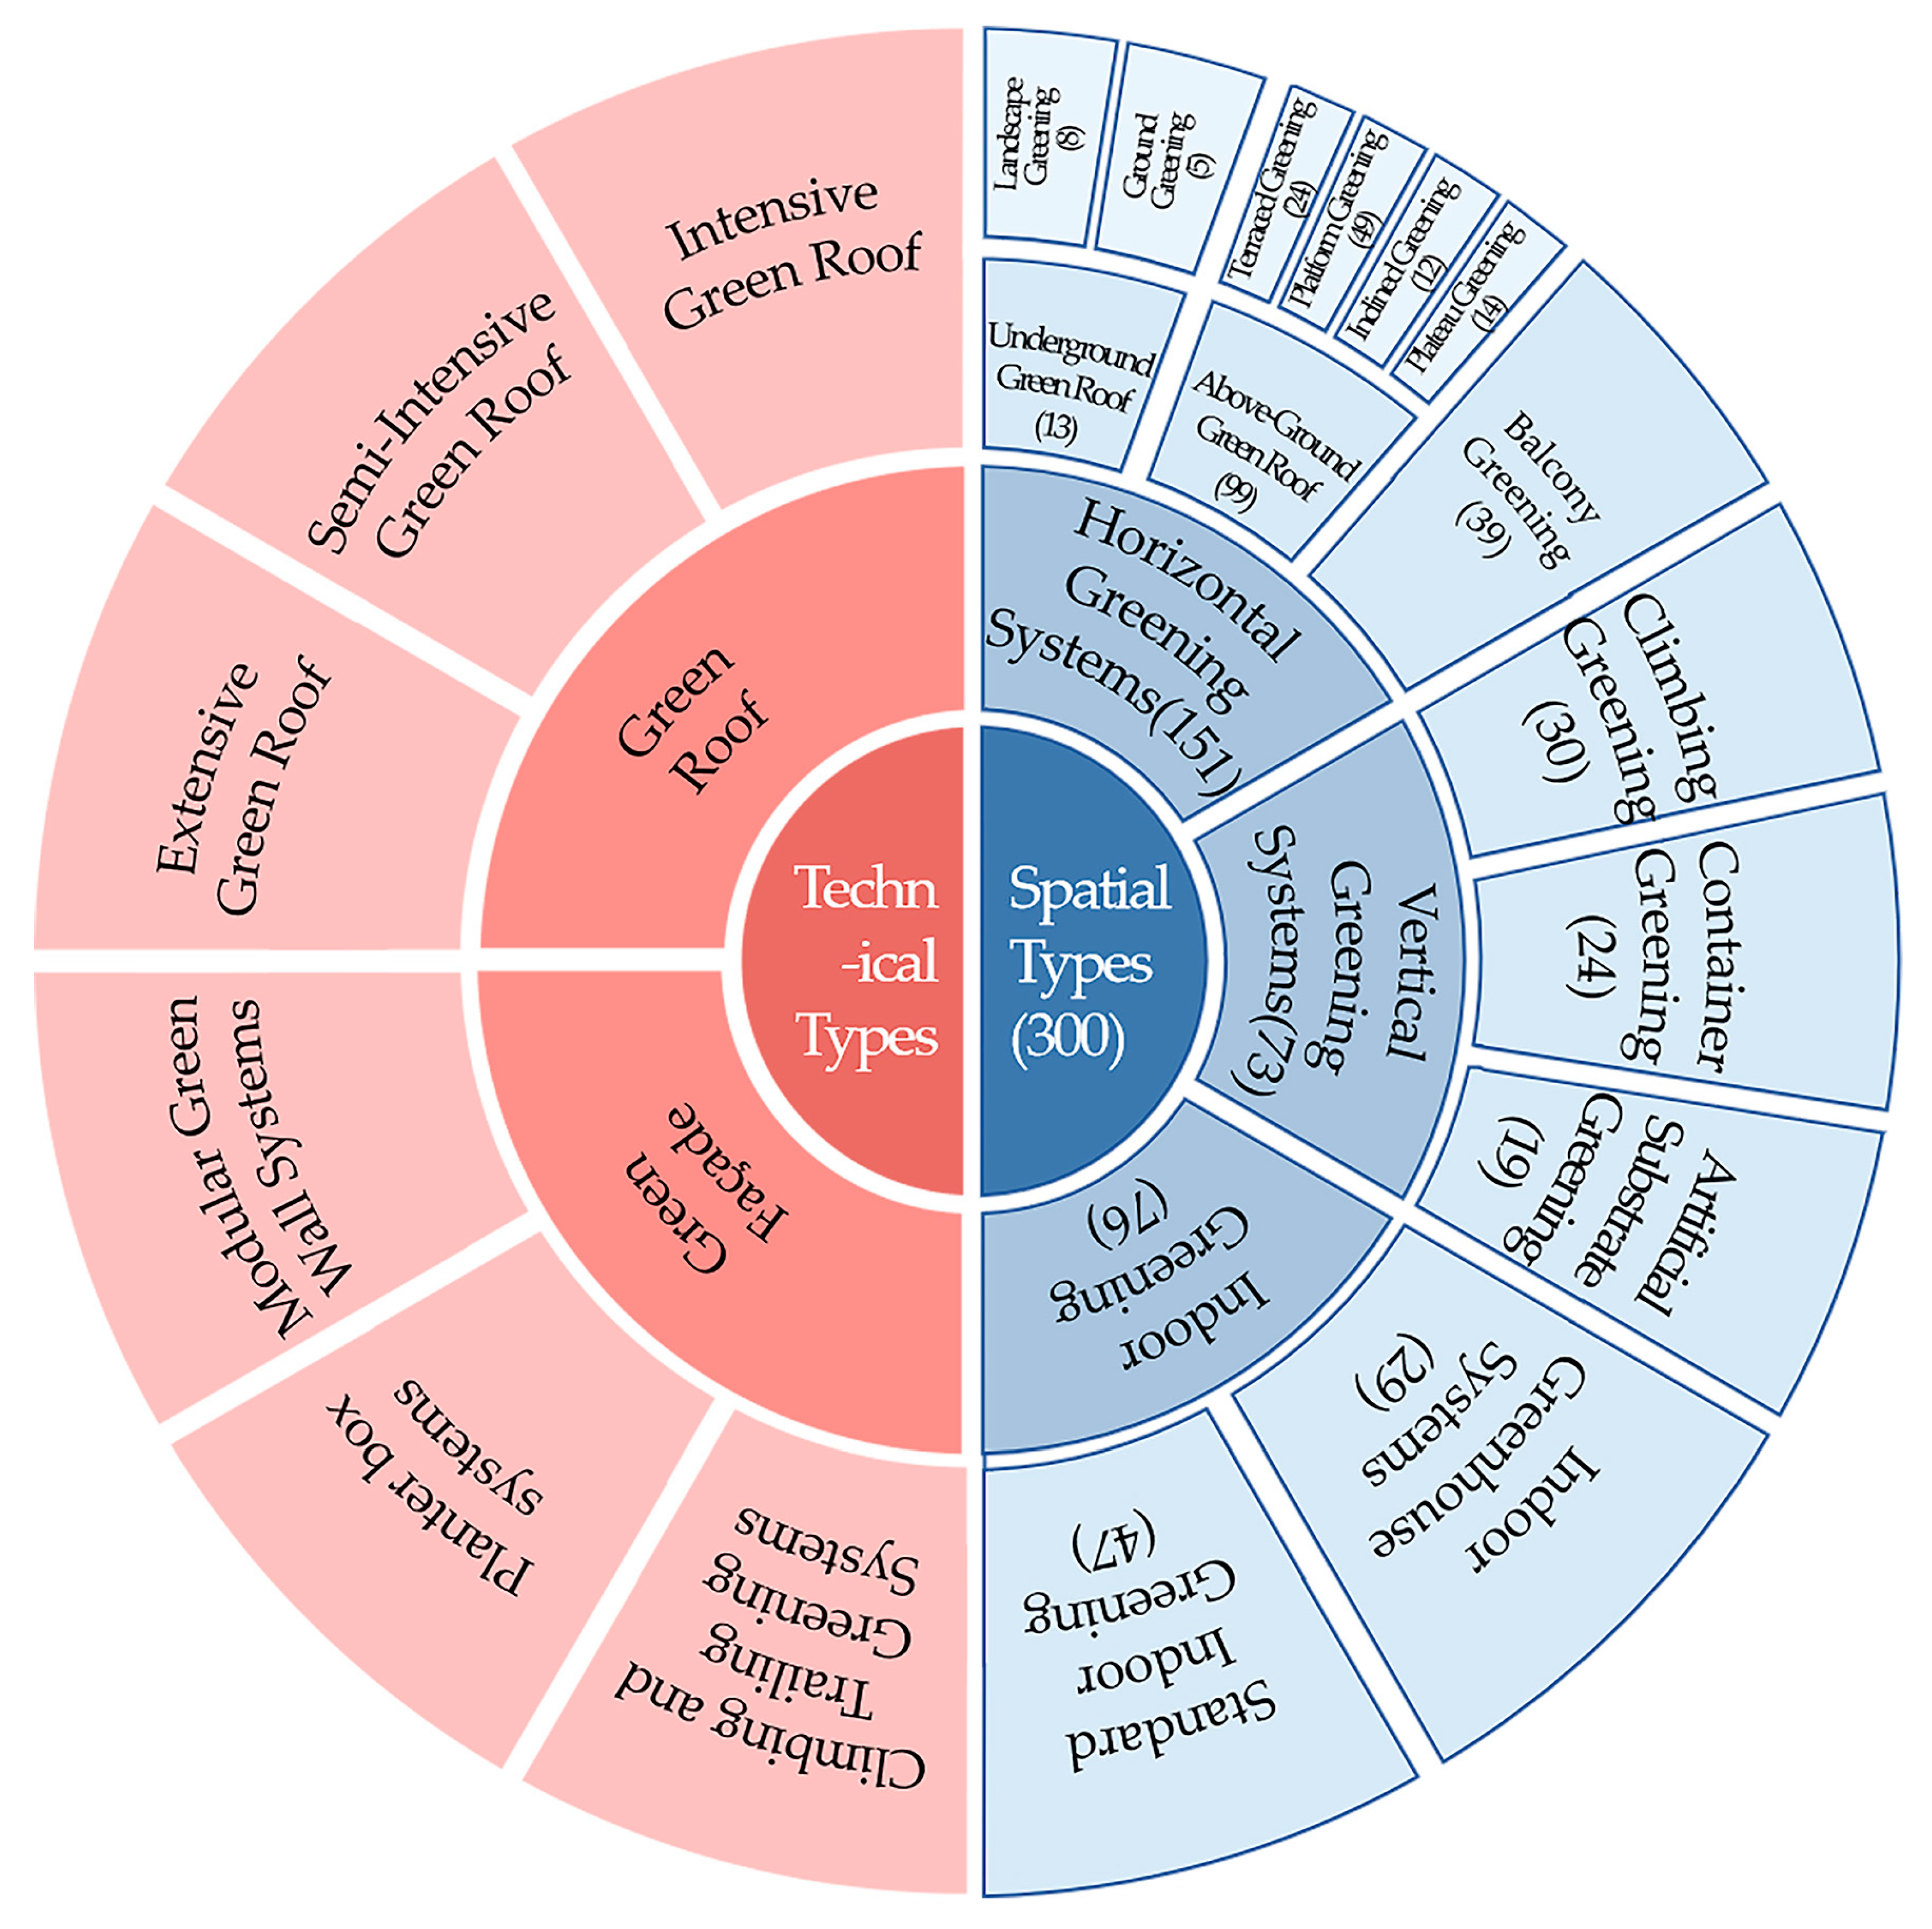
2.1. TAG Case Library
2.1.1. Technical Types
2.1.2. Spatial Types
2.2. Experimental Preparation
2.2.1. Sample Screening
2.2.2. Participant Screening
- Uncorrected visual acuity of 4.8 or higher without the use of glasses or contact lenses.
- No makeup (mascara) or colored contact lenses.
- Enough sleep and a sound mental condition.
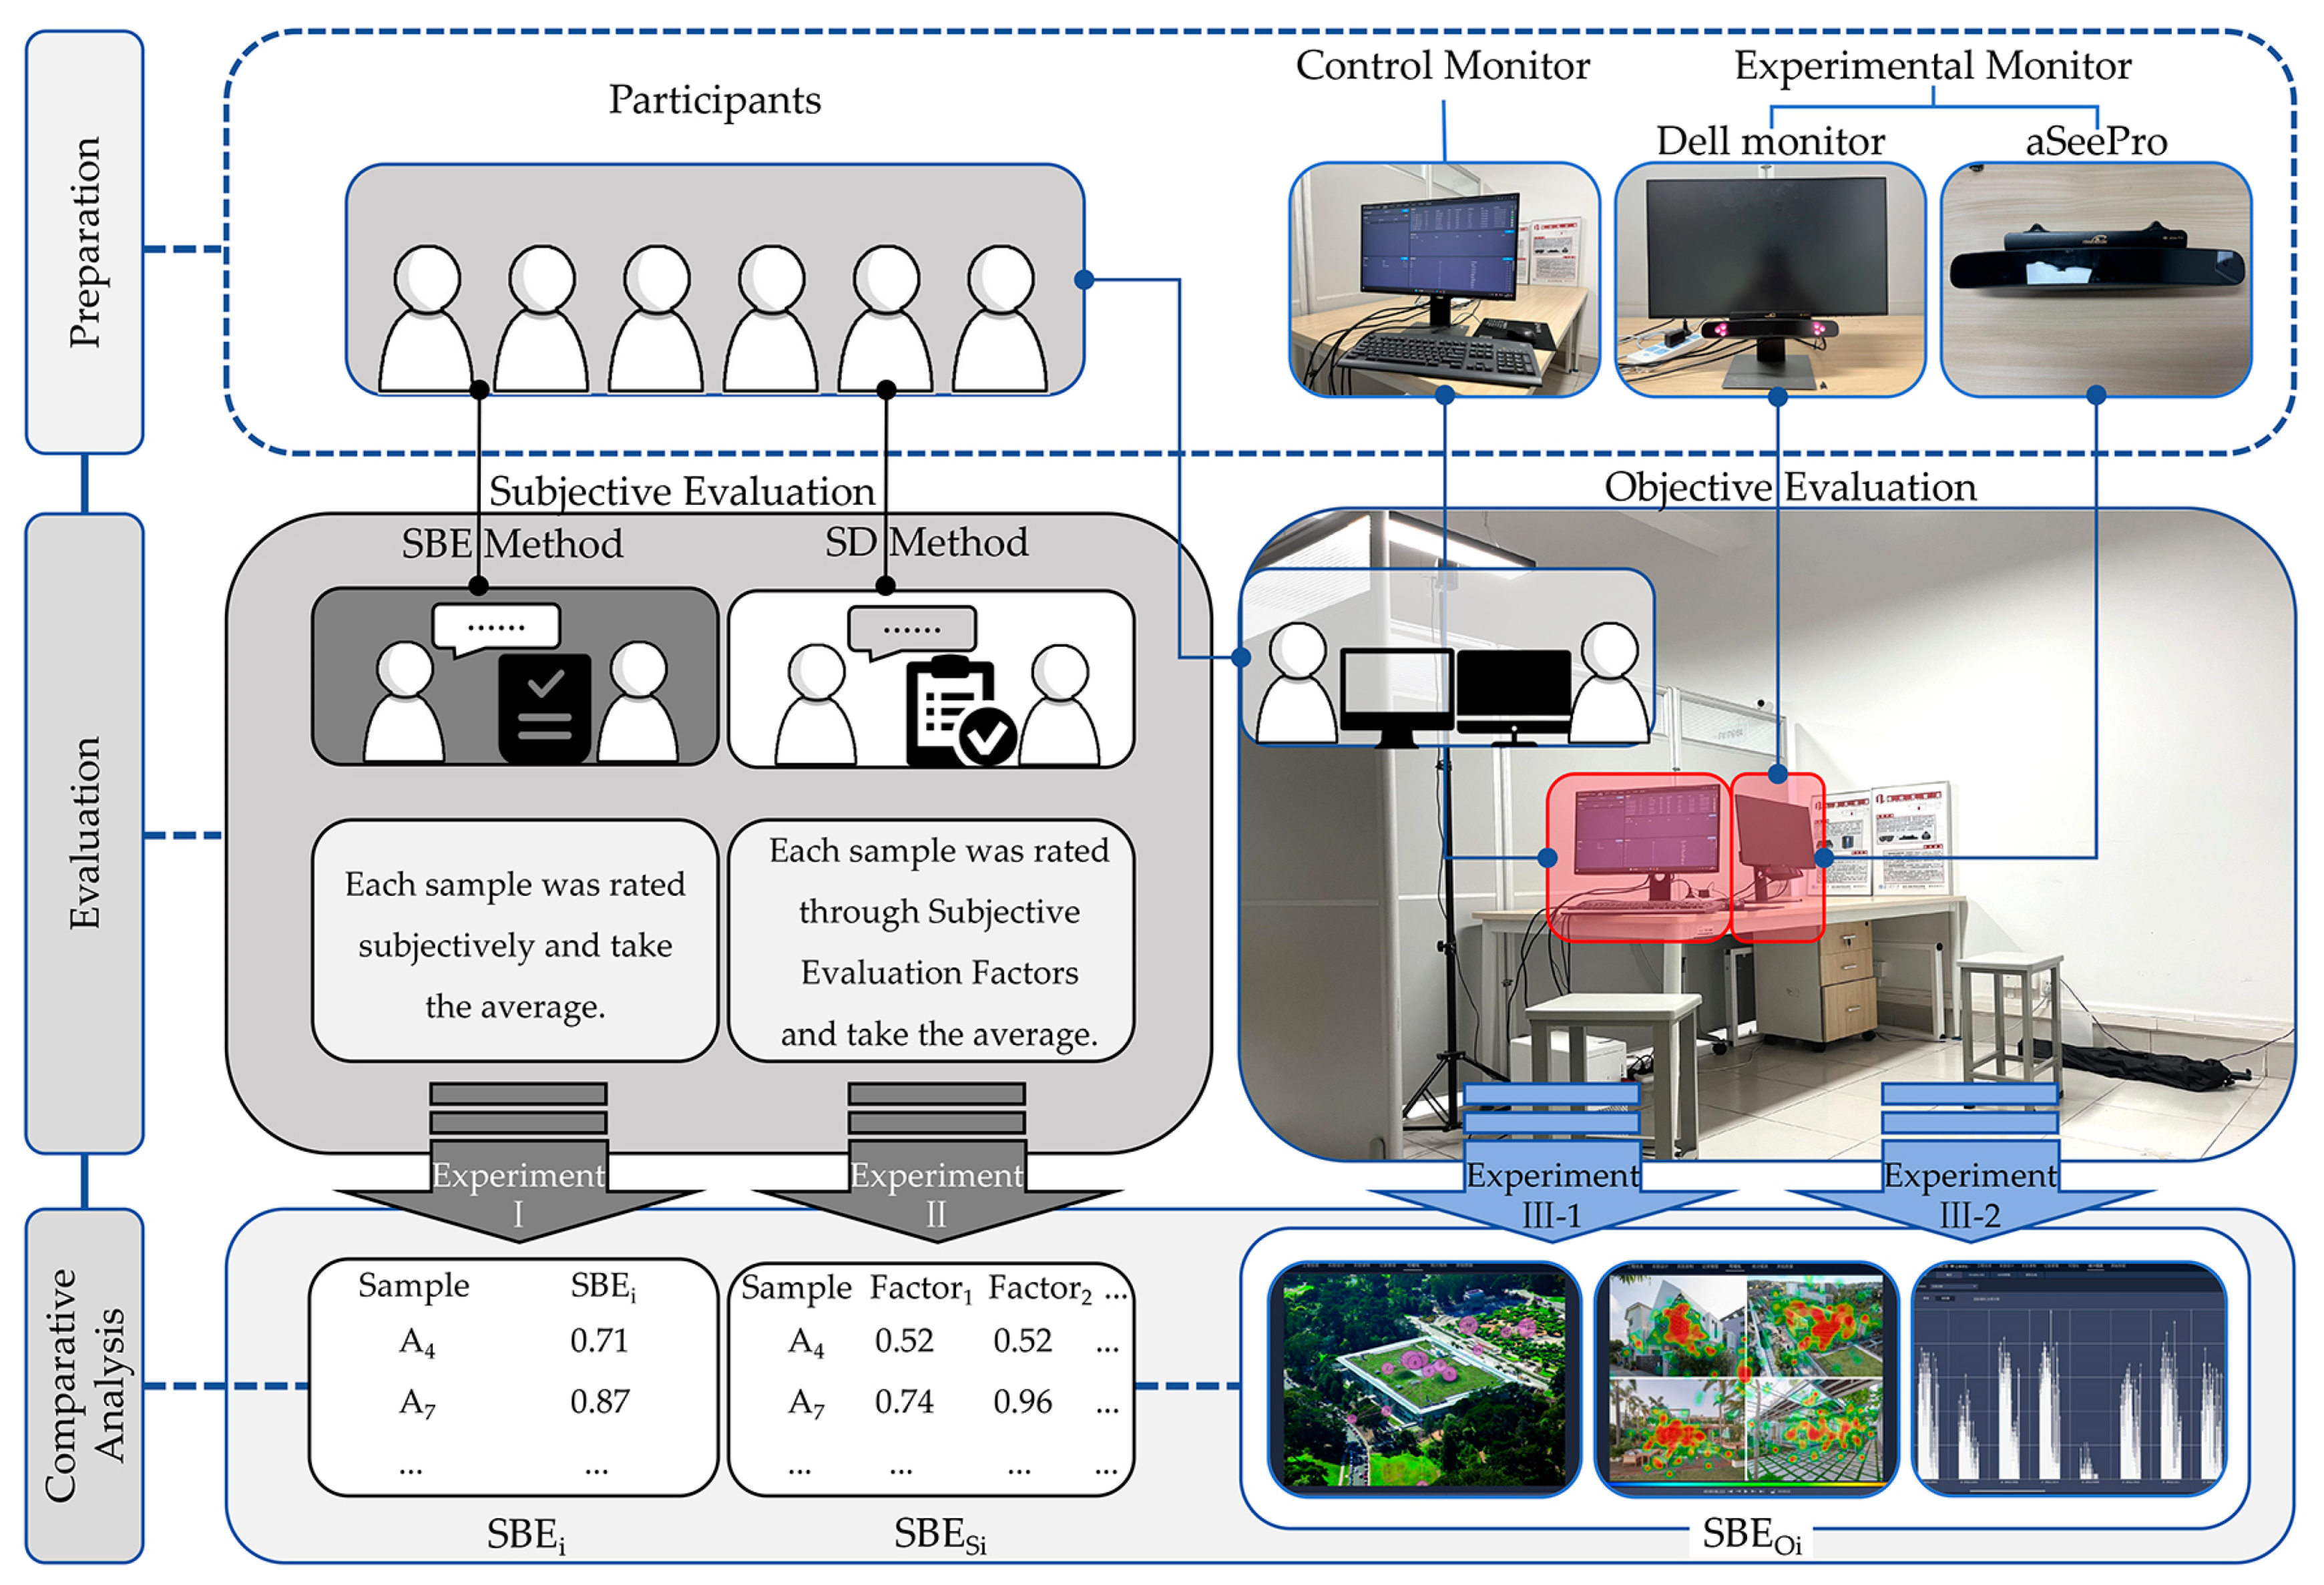
2.2.3. Venue and Equipment
2.3. Evaluation Experiment
2.3.1. Experiment Ⅰ
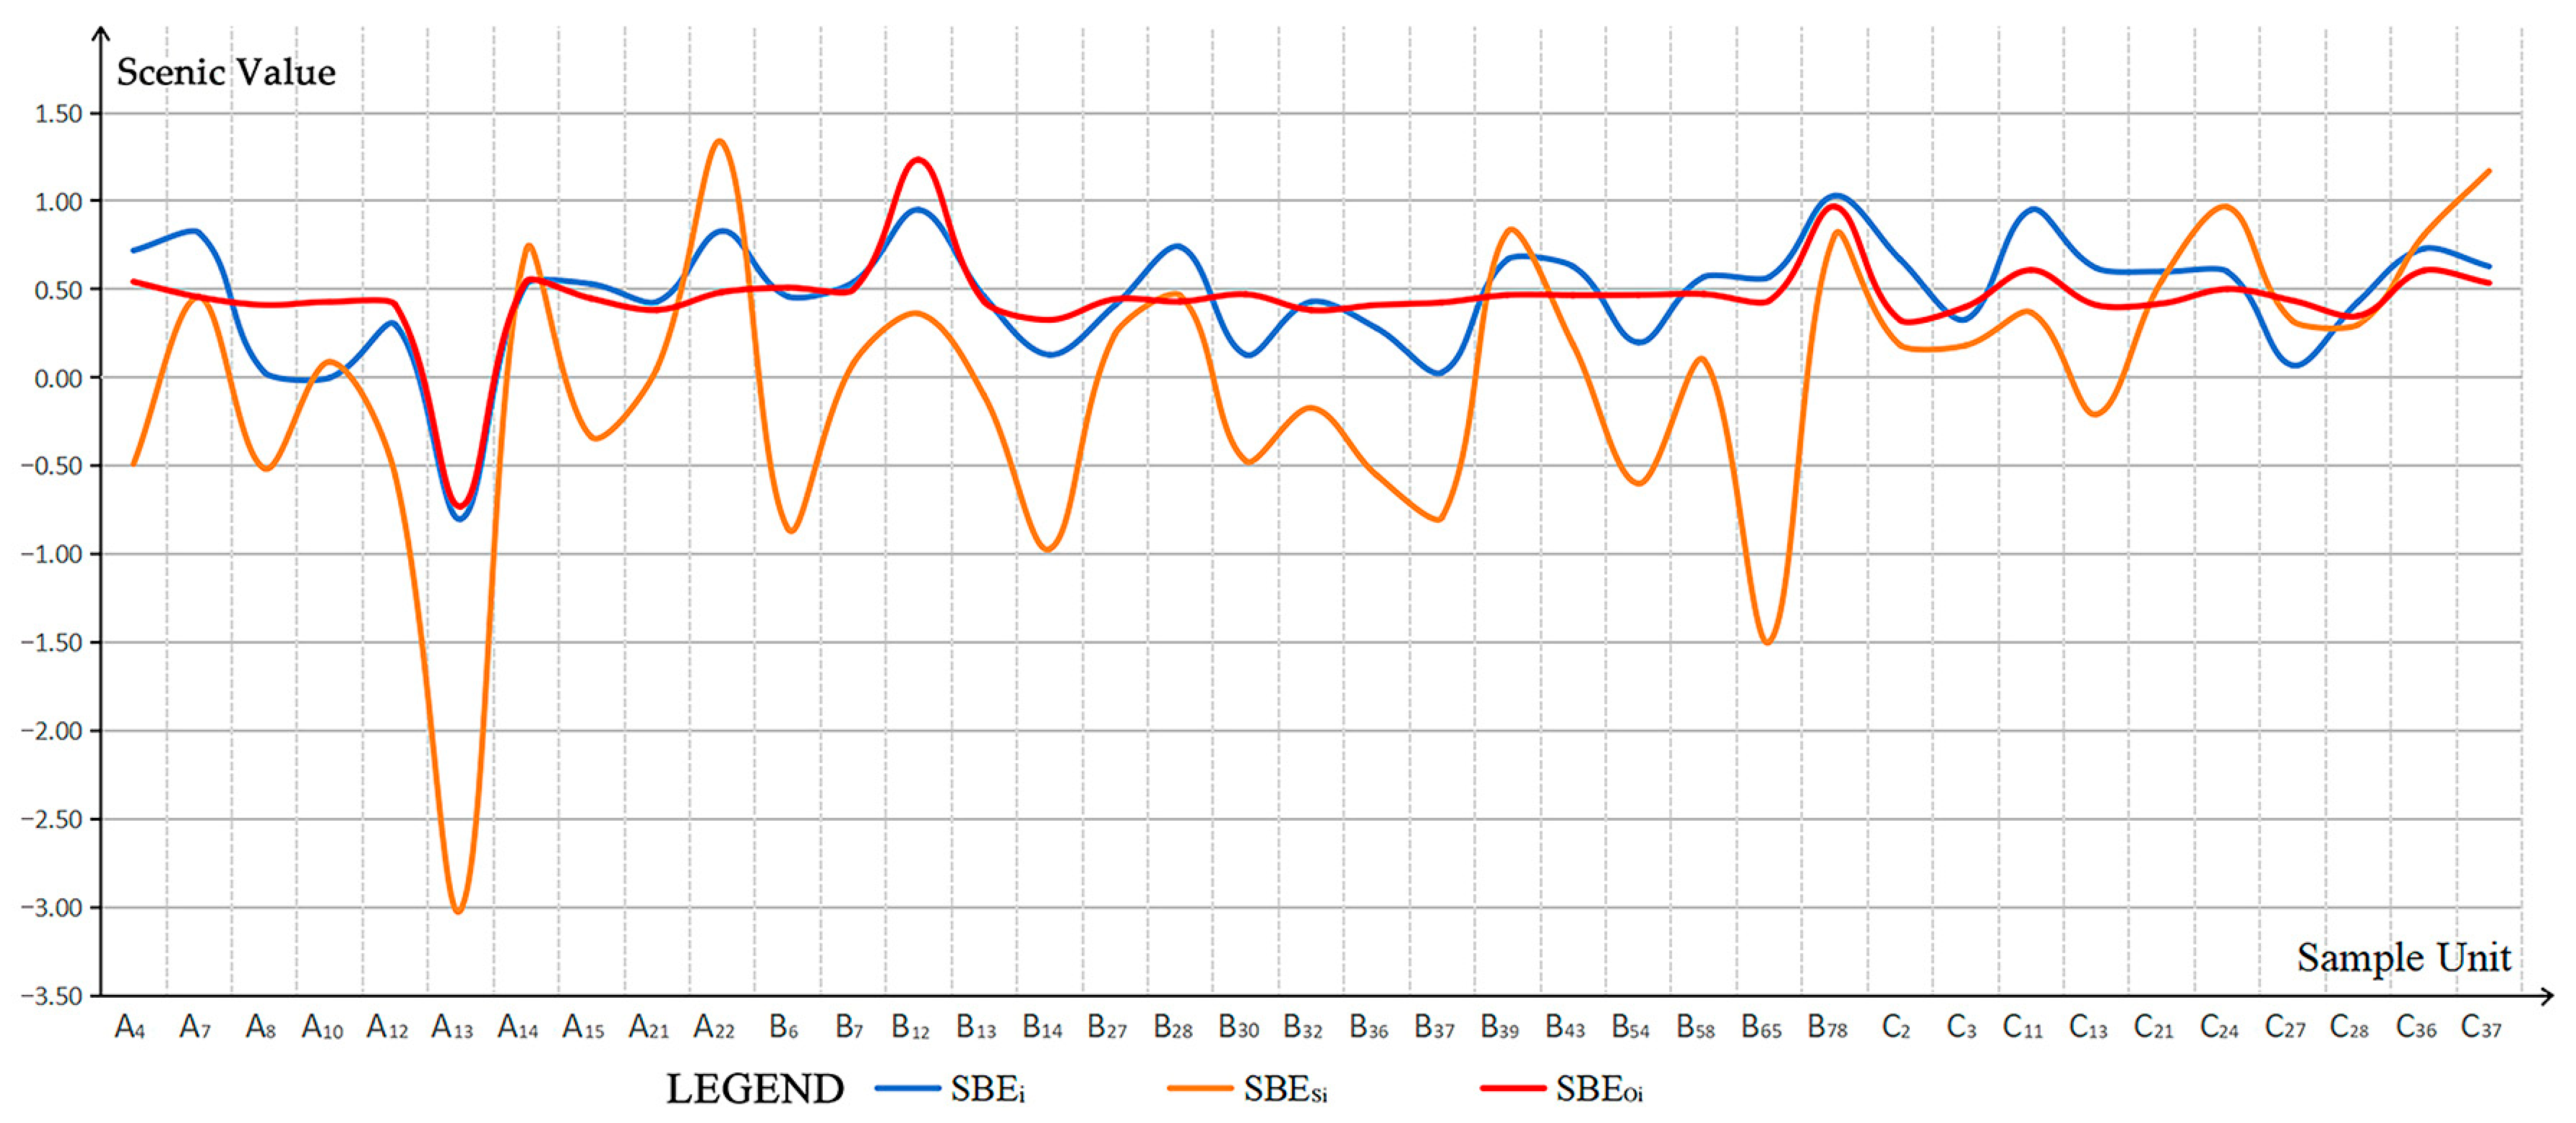
- Subjective evaluation: From 158 cases, one representative image was selected from each case for the scenic beauty perception experiment (158 images were selected in total), and 37 participants were invited to evaluate the scenic beauty value of each image. A Likert five-point scale was used to ask 37 people to rate the scenic beauty value of each sample, and the average of their assessments was used to determine the scenic beauty of each sample. As indicated in Formula (1), SBEi denotes the scenic beauty value of the i-th sample, whereas n represents the number of participants (in Experiment Ⅰ, n = 37).
- Classification and sorting: Experiment Ⅱ and Experiment Ⅲ were prepared in part by this experiment. The μ − σ and μ + σ were used as border points to classify each sample type into low, medium, and high interest levels in accordance with the statistical “σ principle”. At least one case was chosen from each subcategory using random stratified sampling, which was carried out in SPSS based on the percentage of the three TAG categories in the case collection. A total of 40 case samples were obtained to participate in the further experiment (Experiment Ⅱ).
- The scenic beauty values of each sample, which represent its overall visual aesthetics, was recorded and compared to the outcomes of Experiment Ⅱ and Experiment Ⅲ.
2.3.2. Experiment Ⅱ
- Evaluation system: The SD method requires the selection of evaluation factors, which should be based on mature evaluation systems. However, current special research on TAG evaluation systems remains limited. It cannot provide sufficient support for selecting factors. Therefore, this study focuses on TAG as a composite of architecture and landscapes, referring to a mature landscape evaluation system. This study particularly emphasizes the factors related to architecture and spatial design, making the evaluation system more applicable to architectural design. It investigated academic articles on landscape appraisal from the last five years on the platforms of Web of Science and China National Knowledge Infrastructure (CNKI), eliminating articles from the same author or team. A total of 46 high-impact publications were obtained, and initial landscape evaluation variables were identified. The landscape evaluation factors were then filtered further using a frequency-based selection approach. To create the subjective evaluation system for Experiment Ⅱ, seven evaluation variables were discovered by rating, merging related items, and removing low-impact factors. The subjective evaluation system for Experiment Ⅱ covers three major landscape elements based on urban spatial components: Spatial Elements, Natural Elements, and Architectural Elements. It is further subdivided into seven subjective evaluation factors: Landscape Subjectivity, Scene Balance, Vegetation Layering, Landscape Coordination, Architectural Coordination, Functional Integration, and Color Coordination (Table 3).
- Random stratified sampling: According to the statistical classification results of Experiment Ⅰ, this study employed SPSS random stratified sampling to recruit 40 samples for Experiment Ⅱ, guaranteeing full coverage and balance of the three types during random sampling.
- Subjective evaluation: For the 40 selected samples, 37 participants were invited to rate the scenic beauty value of each sample. The evaluation was conducted using a Likert five-point scale. Factor analysis was used to examine the evaluation influencing factors, extract principal components, and derive subjective evaluation formulas. The subjective evaluation of scenic beauty (SBESi) of each sample was calculated.
- Comparation: The scenic beauty values of each sample were recorded and compared to the outcomes of Experiment Ⅰ and Experiment Ⅲ.
2.3.3. Experiment Ⅲ
- (1)
- Experiment Ⅲ-1
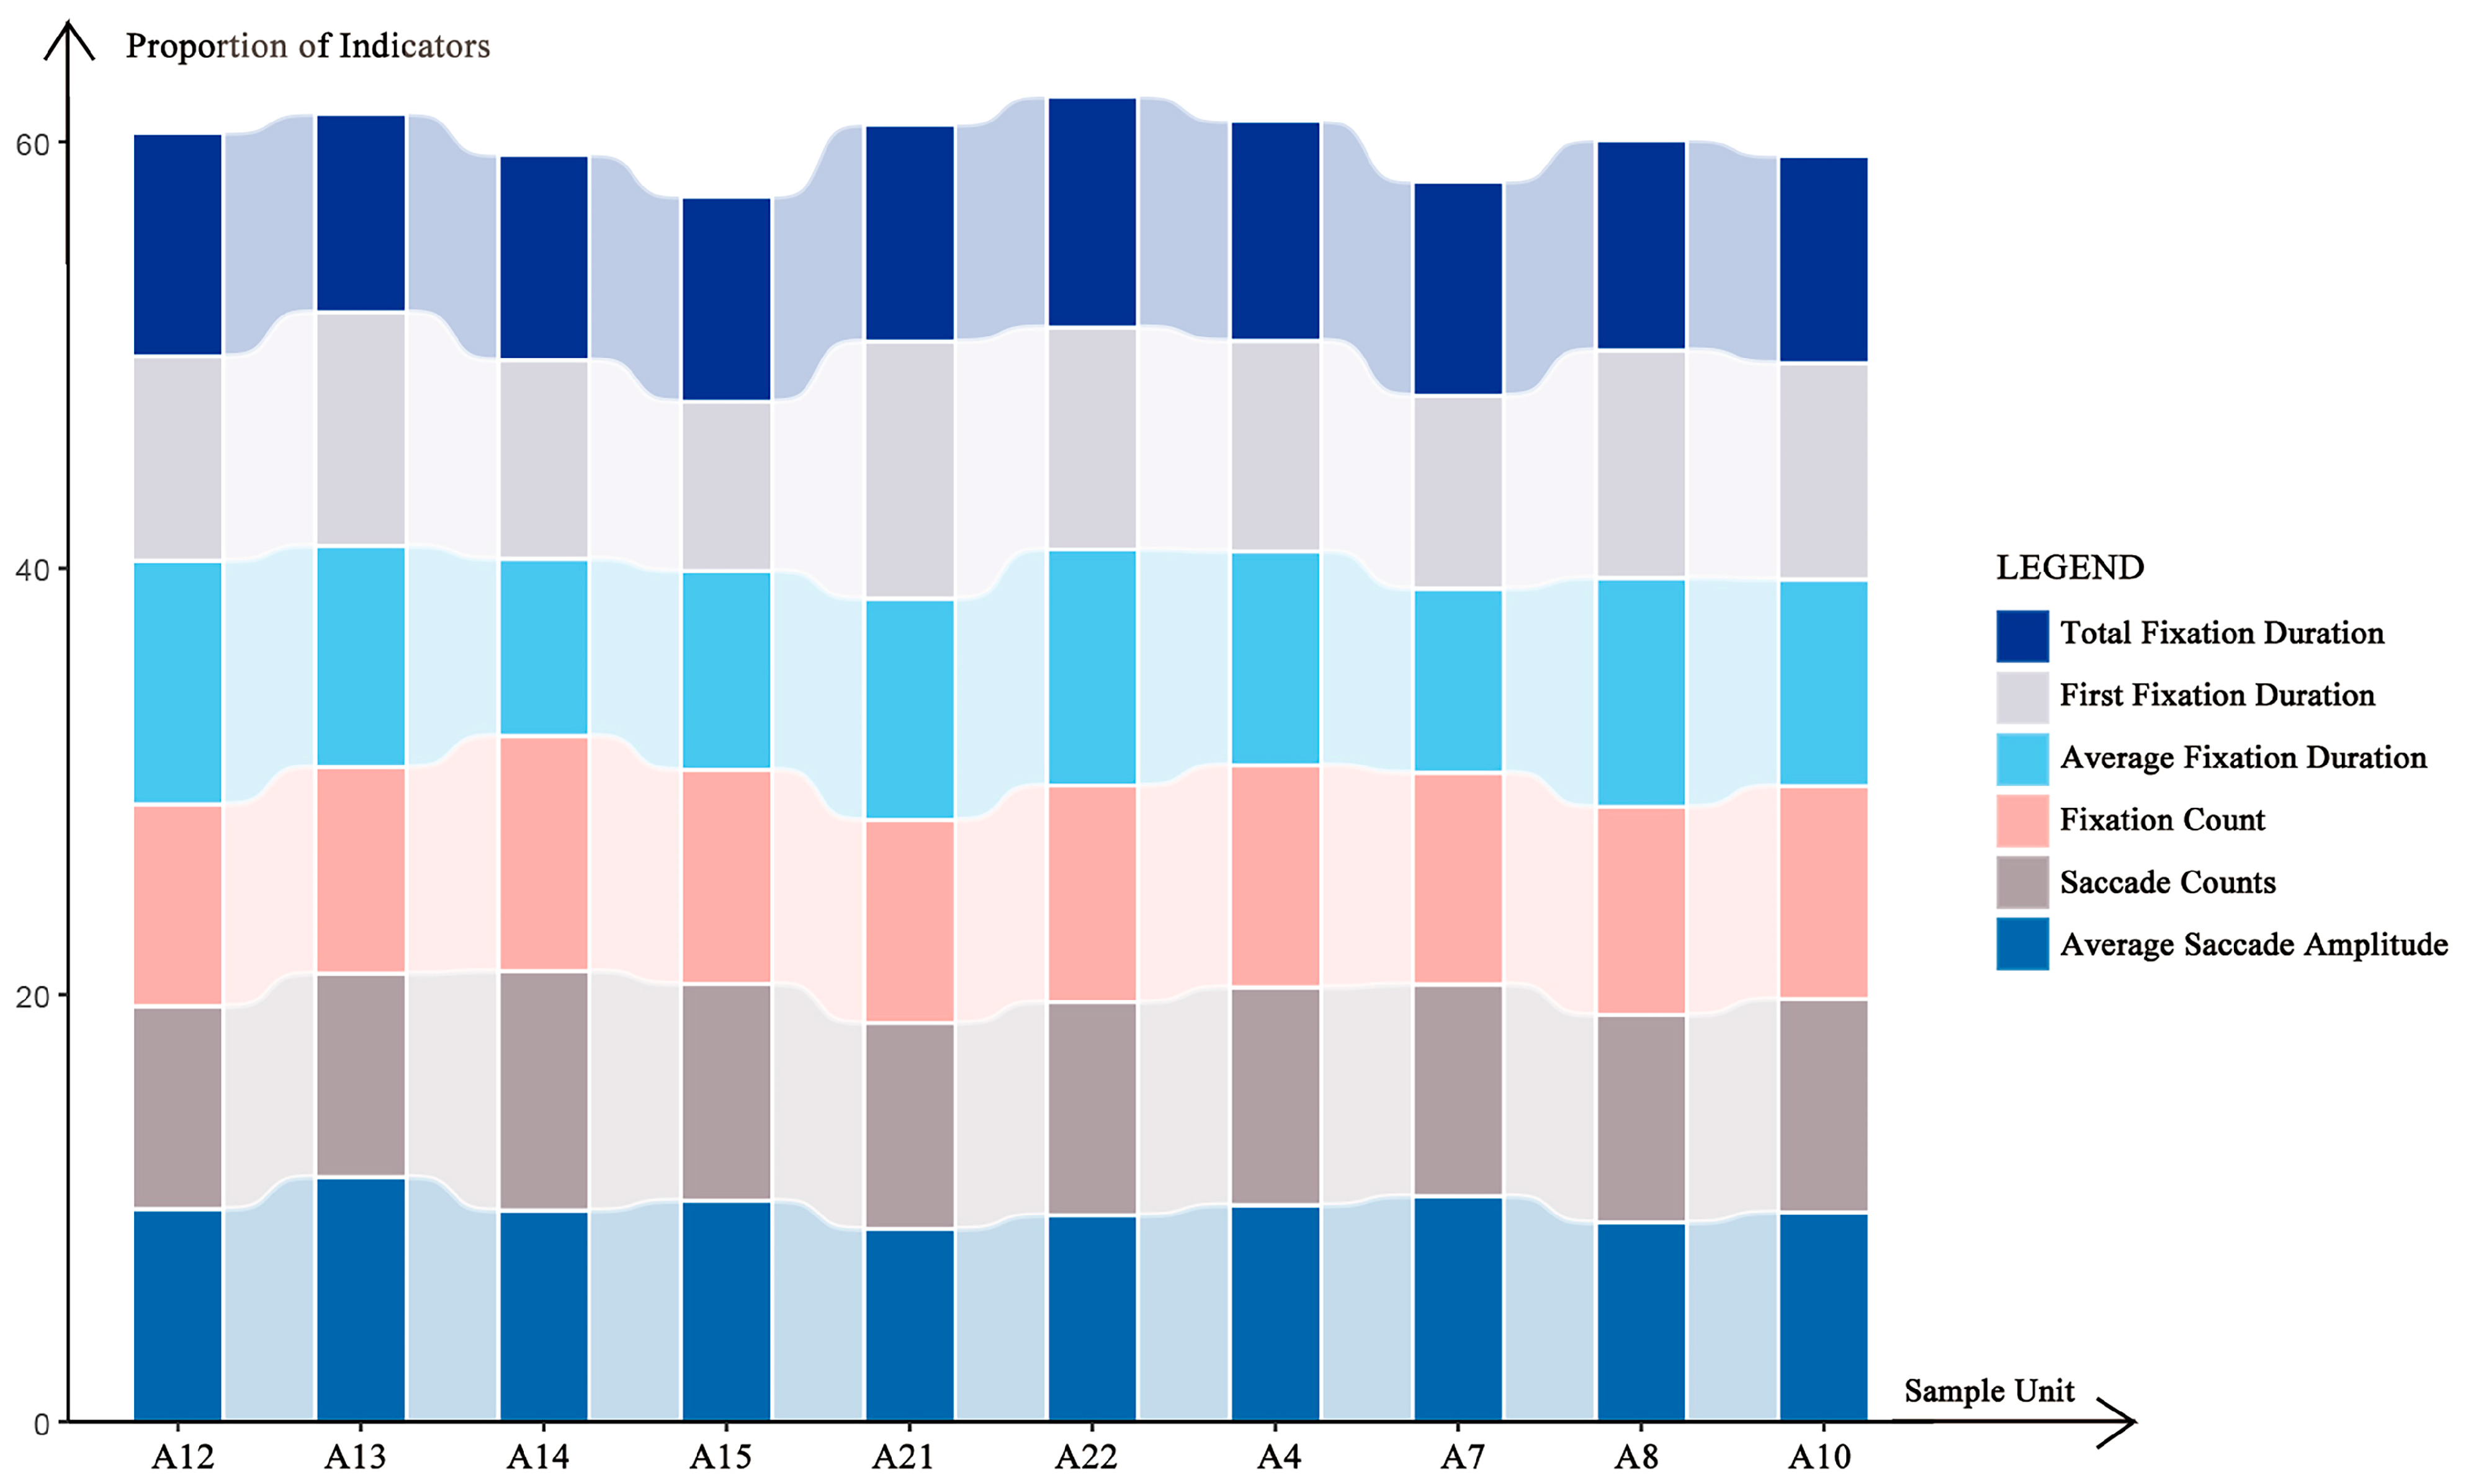
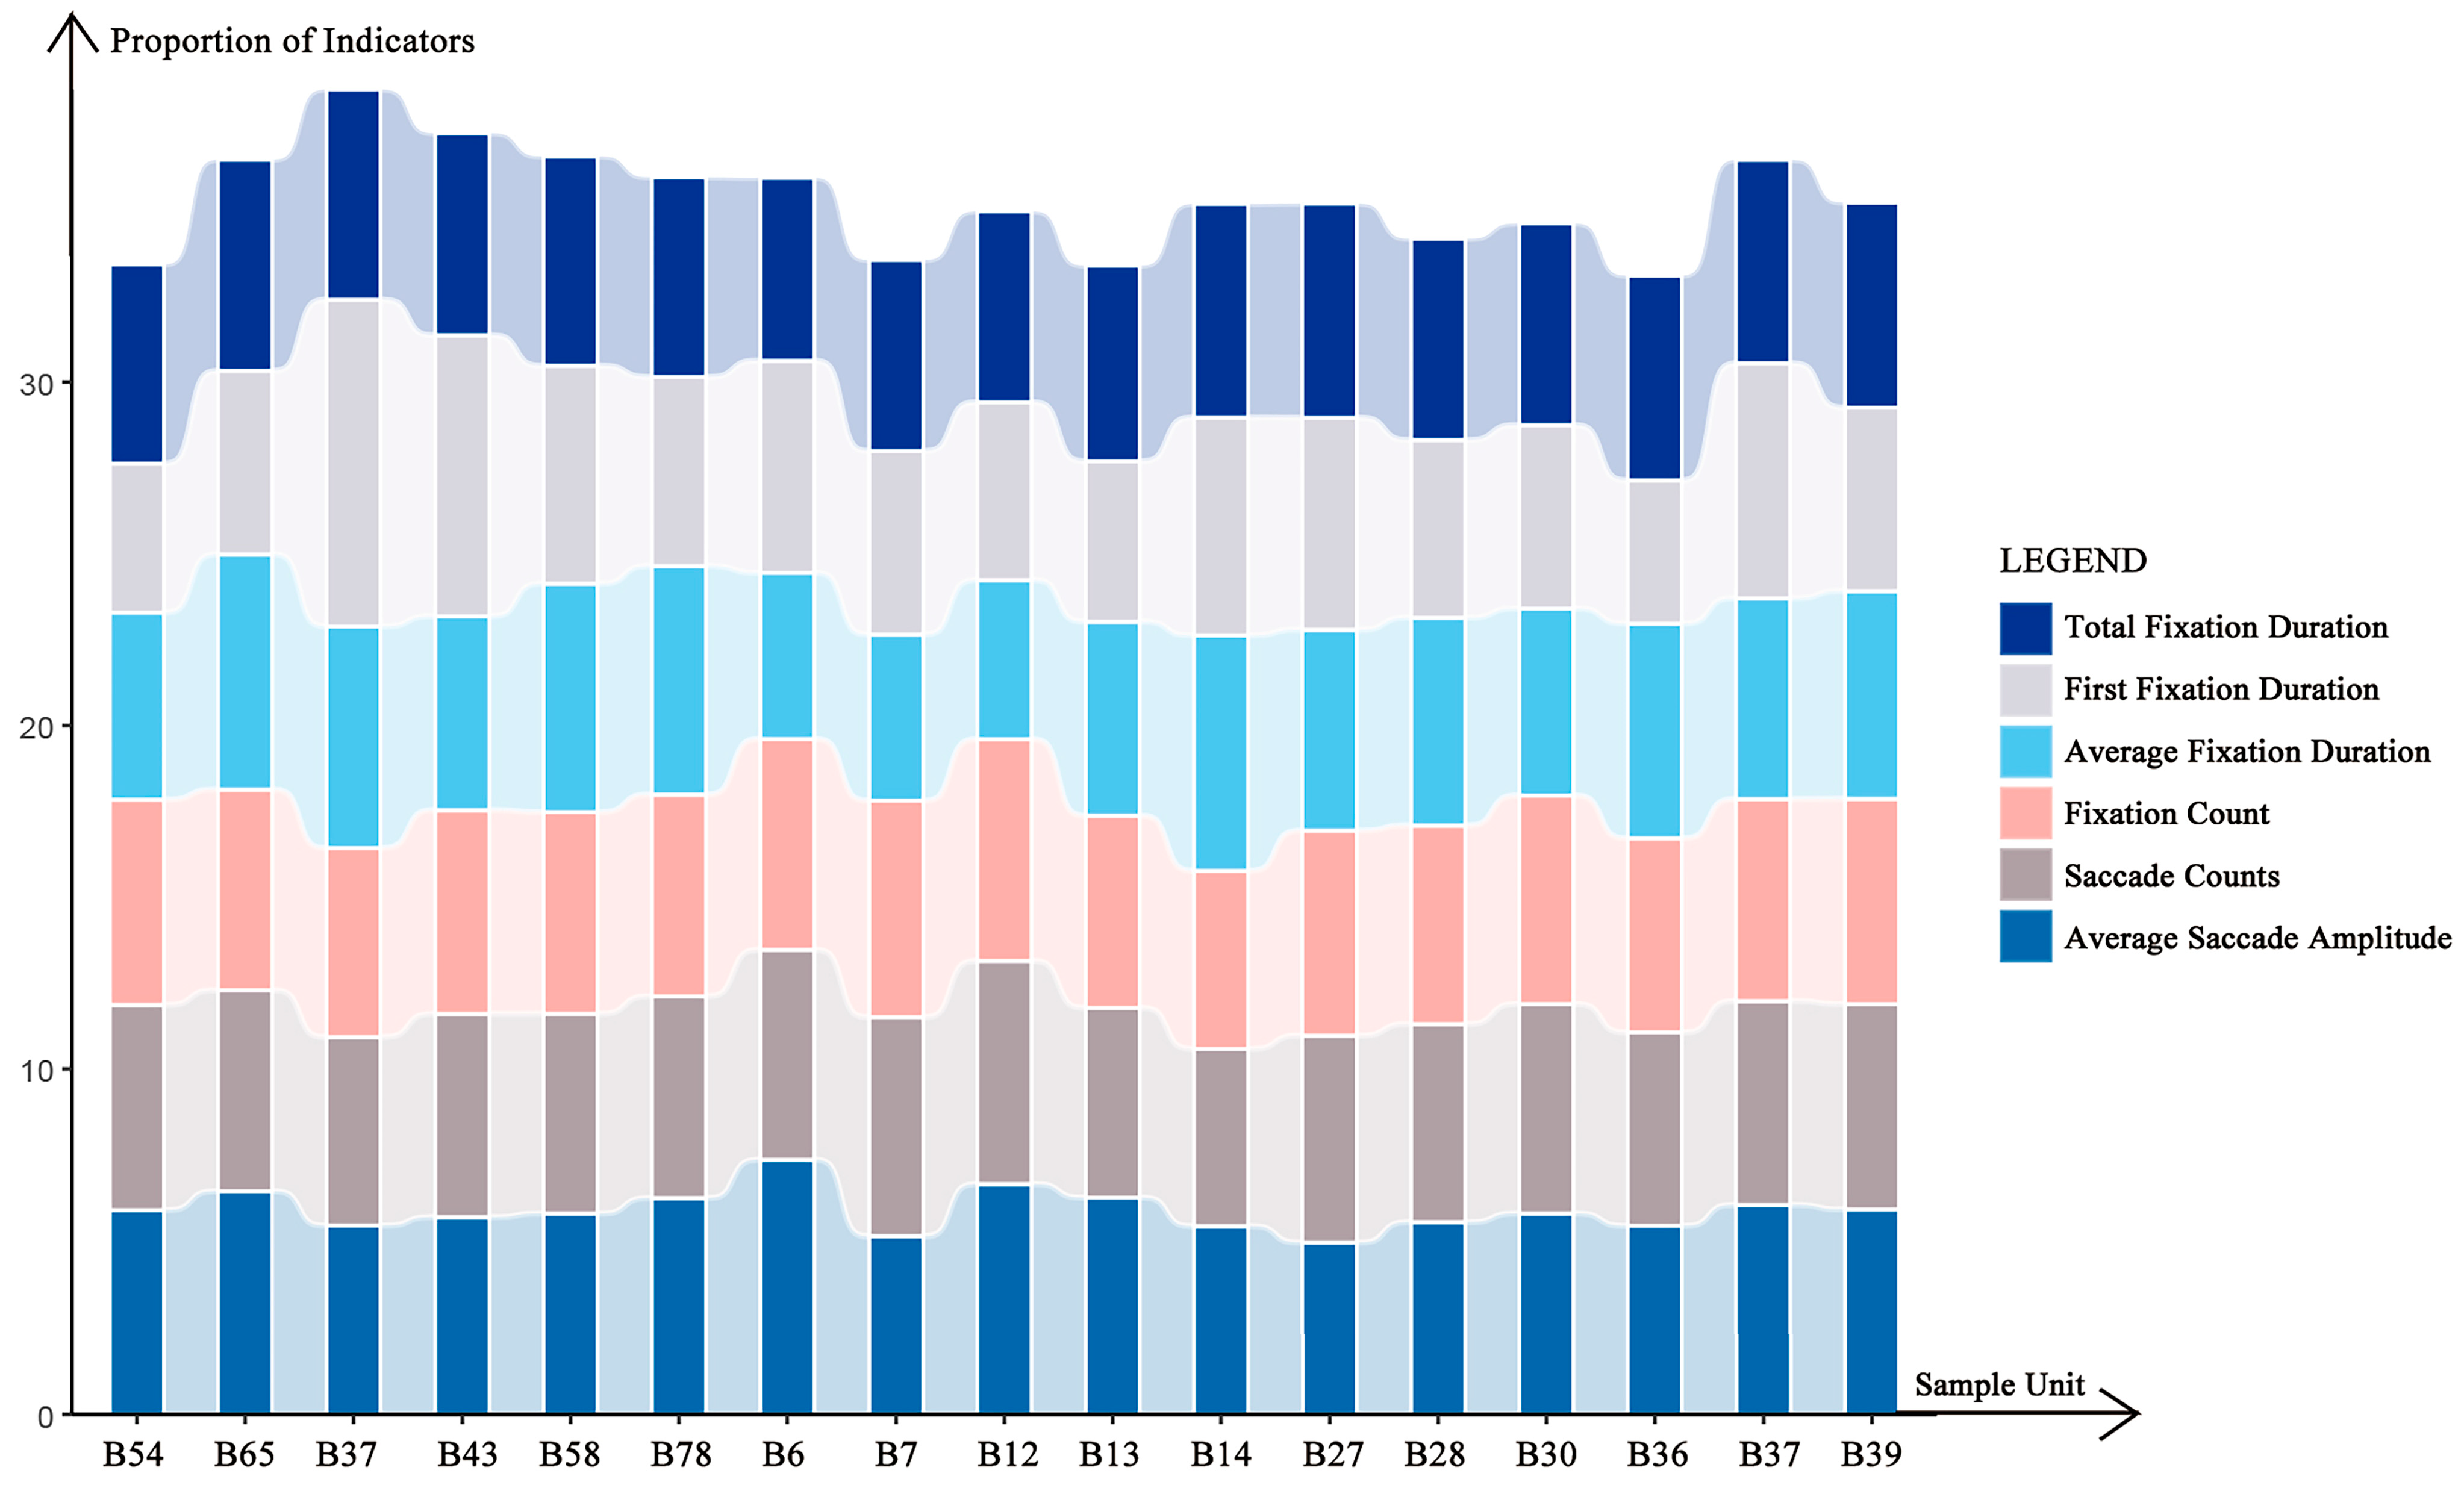
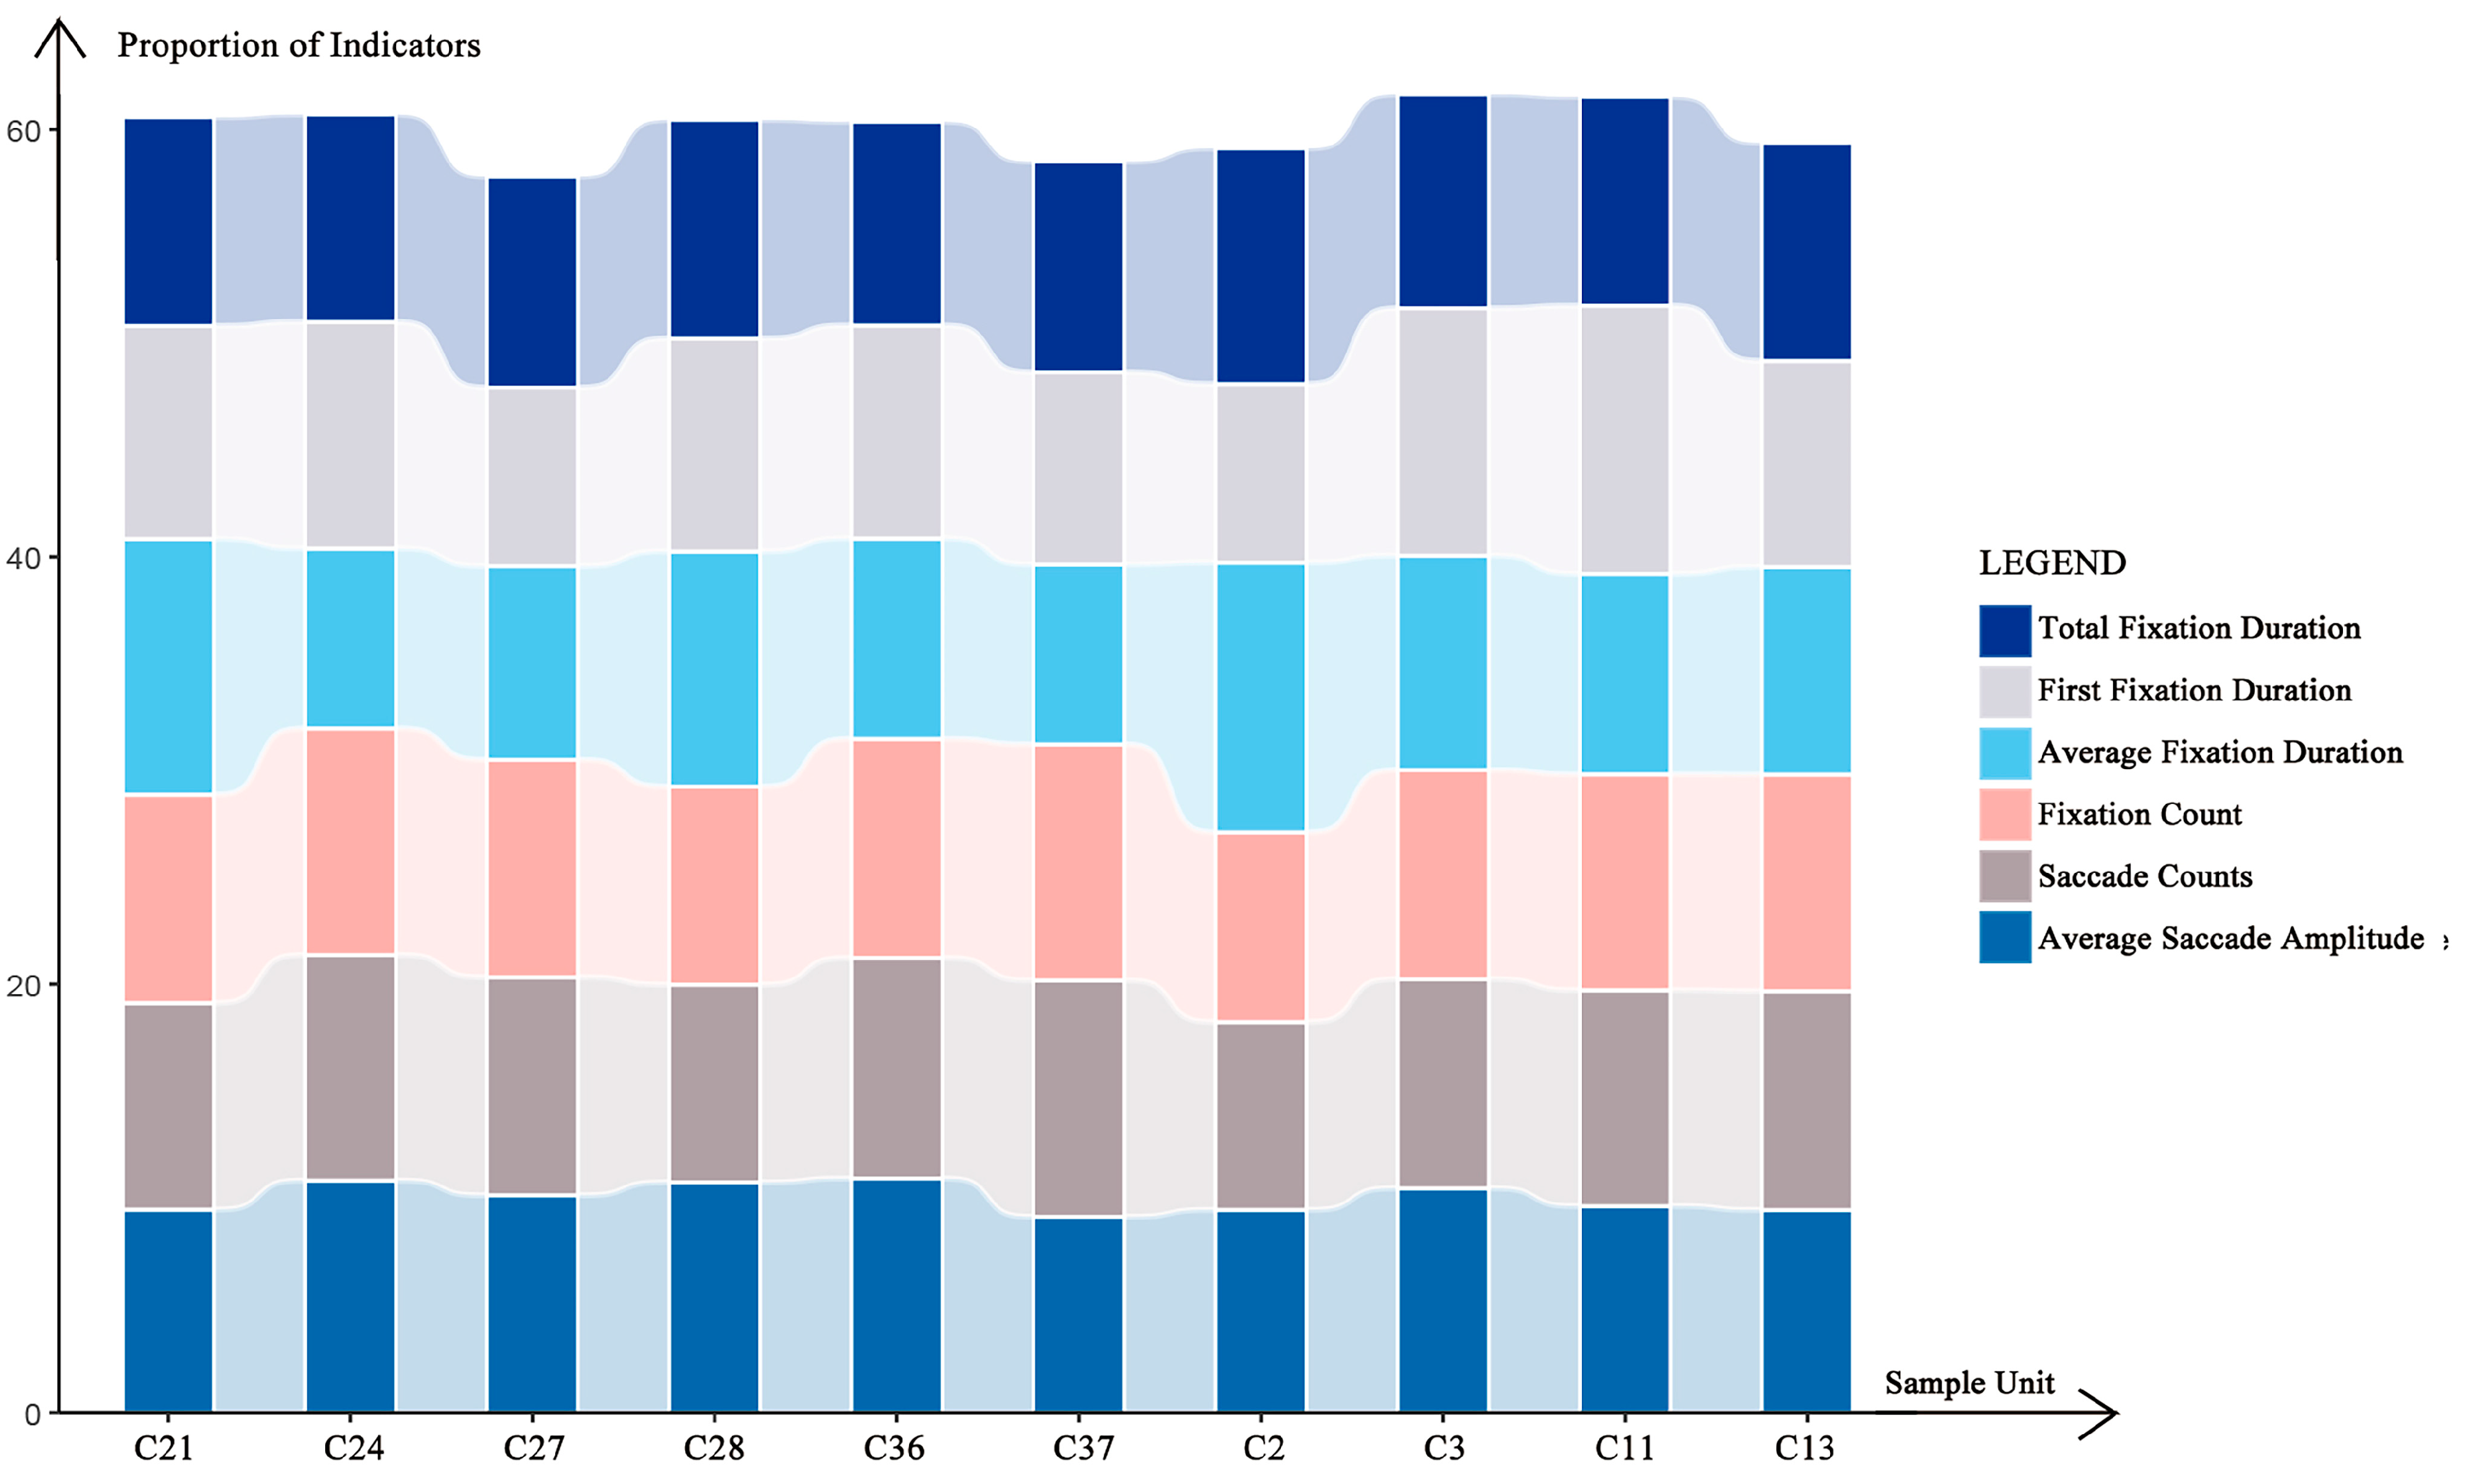
- Total Fixation Duration displays the Total Fixation Duration of all fixation points in the area. Longer Total Fixation Duration indicates a higher level of attention to the image, suggesting that the image contains more information.
- Average Fixation Duration is related to scene analysis, understanding, perception, and cognition, reflecting the degree of comprehension of the image.
- First Fixation Duration reflects the initial recognition of the image. The shorter the first fixation time, the higher the initial recognition.
- Fixation Count reflects how much attention the participants paid to each area, indicating their interest in the image.
- Saccade Count reflects the search activities of the participants’ eyes, showing how many times they searched for details in the image.
- Average Saccade Amplitude is the average value of all saccadic movement amplitudes. Saccade amplitude is the spatial range of eye movement from the original fixation point to the goal fixation point. A higher Average Saccade Amplitude, which is typically impacted by semantic information, implies a lower interest in the material between fixation sites.
- (2)
- Experiment Ⅲ-2
2.4. Comparative Analysis
3. Results
3.1. Scenic Beauty Perception Based on SBE and SD Methods (Subjective Evaluation)
3.1.1. Scenic Beauty Perception Based on the SBE Method (Experiment Ⅰ)
3.1.2. Scenic Beauty Perception Based on the SD Method (Experiment Ⅱ)
3.1.3. Scenic Beauty Perception Evaluation Based on Subjective Experiment
3.2. Scenic Beauty Perception Based on Eye-Tracking Experiment (Objective Evaluation)
3.2.1. Single-Image Eye-Tracking Experiment (Experiment Ⅲ-1)
- (1)
- Classification Comparative Analysis
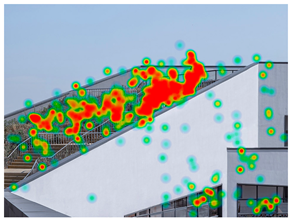
- Total Fixation Duration: Types A and B had significantly shorter Fixation Duration than Type C, indicating that Indoor Greening’s integration with building functionality helped participants relate to daily life scenarios, resulting in stronger attention paid during observation. On the other hand, there were fewer cases in horizontal and vertical surface greening where greening was integrated with building functionality, and participants had less life experience in this regard.
- Average Fixation Duration: Average Fixation Duration for Type C was significantly higher than for the other types, indicating that participants paid more attention to the design details of Indoor Greening and had a stronger interest in it. In the Vertical Greening System and the Horizontal Greening System, the participants primarily understood the design through an overall scene perception, with less attention paid to specific design details during limited observation time.
- First Fixation Duration: First Fixation Duration for Type B and Type C showed significant differences, suggesting that the public required the longest initial information processing time for the Horizontal Greening System, possibly because this type of landscape was relatively complex. A longer First Fixation Duration generally indicates that the image had a stronger appeal.
- Fixation Count: There is no significant difference between Types A, B, and C in Fixation Count (p > 0.05).
- Saccade Count: Type C had the lowest Saccade Count, indicating that the information complexity in Indoor Greening images was lower and easier to understand. In contrast, images of vertical and horizontal greening, with a greater amount of information, required more saccades for participants to gather the necessary data.
- Average Saccade Amplitude: There is no significant difference between Types A, B, and C in Average Saccade Amplitude (p > 0.05).
- (2)
- Within-Group Comparison Analysis
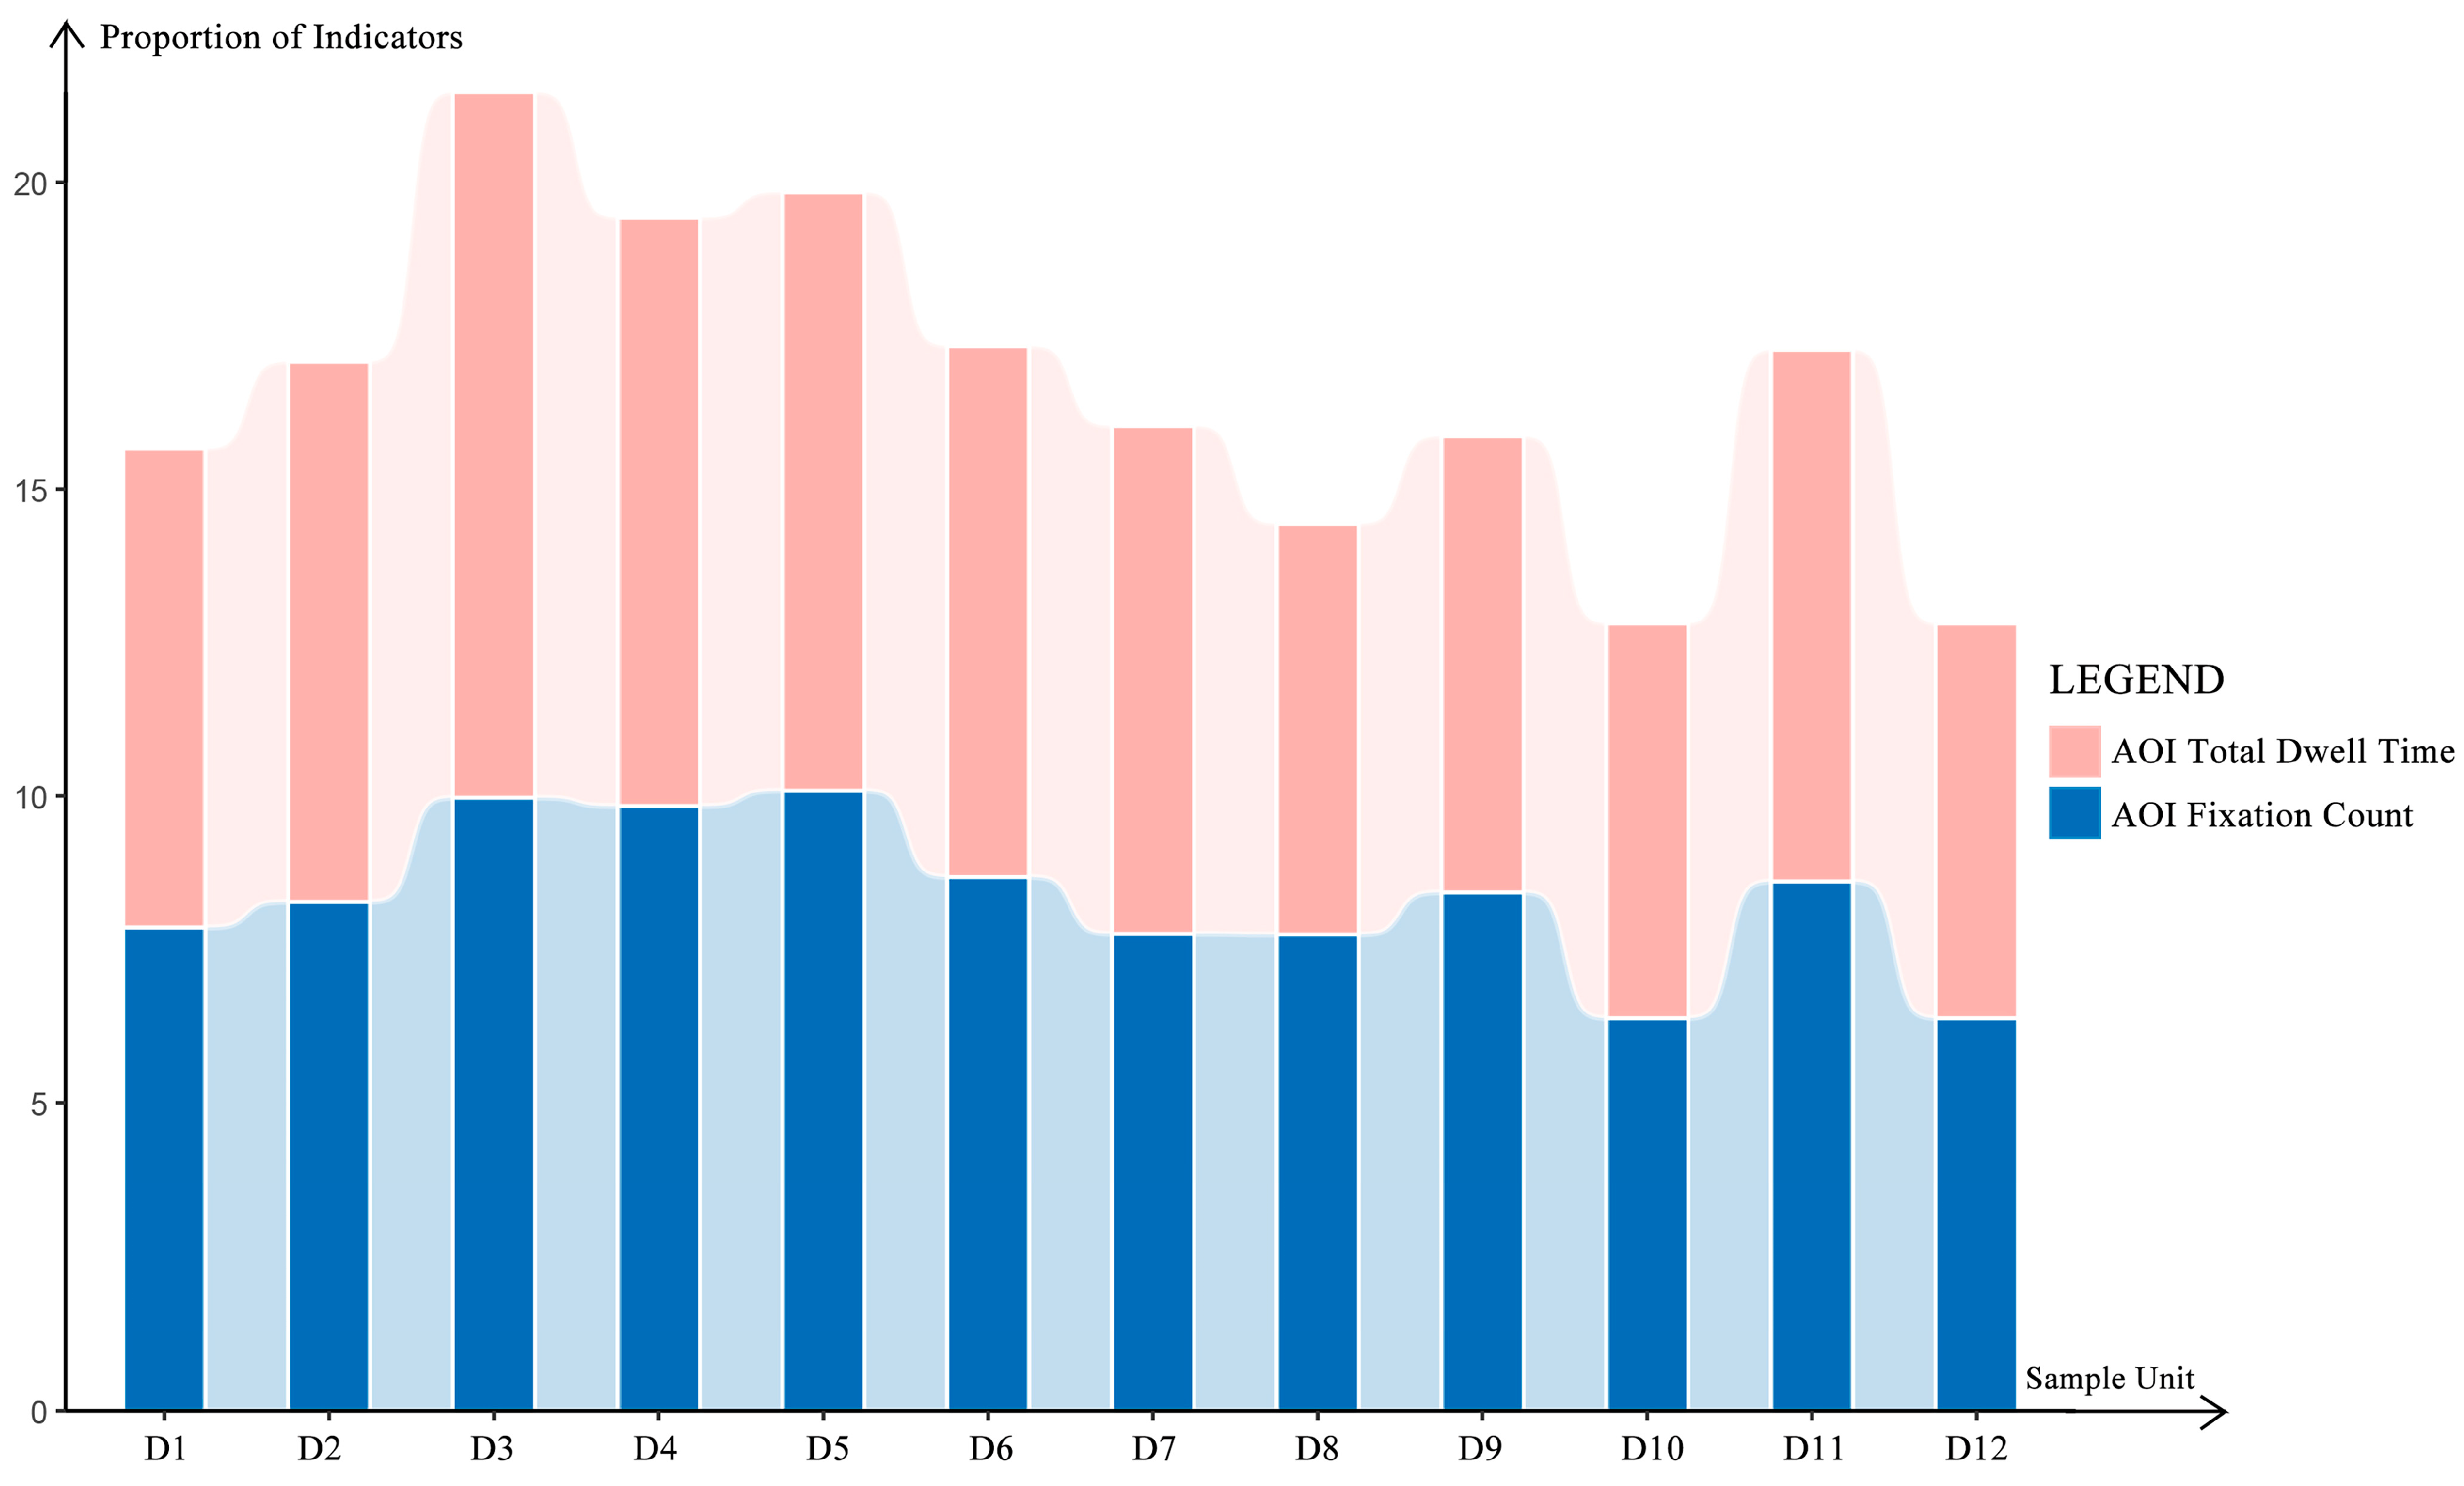
3.2.2. AOI Eye-Tracking Experiment (Experiment Ⅲ-2)
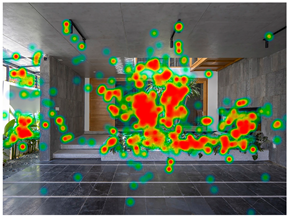
- AOI Total Dwell Time: The AOI Total Dwell Time is determined by an individual’s level of interest, attention to the area of interest’s content, and communicative context-specific demands. In situations requiring intense focus or interest, an individual’s overall fixation time in the area of interest increases. After analyzing the AOI Total Dwell Time data and conducting post-experiment interviews, it was discovered that unique design forms quickly attract participants, but traditional greening approaches frequently fail to capture their interest. In the experiment, the inclined and terraced greening are uncommon in daily life, and their designs are rather unusual for participants, with a variety of design styles, making them more likely to pique people’s curiosity. Artificial Substrate Greening, on the contrary, is quite simple in design, often consisting of a ring of planting that surrounds the building. This repetitive design makes it harder to attract people’s attention.
- AOI Fixation Count: Based on the AOI Fixation Count data combined with post-experiment interviews, it was found that the participants showed a higher level of interest in Terraced Greening, Platform Greening, and Inclined Greening. This is because these examples show a greater connection of greening and architectural functionality. The public tends to focus more on images that depict specific functional purposes, as they can link to real-life experiences and better understand the space.
3.2.3. Scenic Beauty Perception Evaluation Based on Eye-Tracking Experiment
3.3. Comparative Analysis
3.3.1. Mutual Validation of Subjective and Objective Evaluation Systems
3.3.2. Correlation Analysis Between Subjective Evaluation Indicators and Eye Movement Indicators
- Four eye movement indicators (Total Fixation Duration, Fixation Count, First Fixation Duration, and Average Saccade Amplitude) had a significant correlation with Spatial Coordination. However, Ecological Stratification had a significant correlation with only one eye movement indicator (Average Saccade Amplitude).
- Both Ecological Stratification and Spatial Coordination showed a significant negative correlation with Average Saccade Amplitude. However, the significance of the correlation between Ecological Stratification and Average Saccade Amplitude was stronger than that between Spatial Coordination and Average Saccade Amplitude.
- Total Fixation Duration, Fixation Count, and First Fixation Duration all showed a significant positive correlation with Spatial Coordination.
- A further analysis of the highly correlated indicators at the 0.01 significance level reveals that Total Fixation Duration and Fixation Count both showed a significant positive correlation with Spatial Coordination, while Average Saccade Amplitude only showed a significant negative correlation with Ecological Stratification.
4. Discussion
4.1. Systematic Scenic Beauty Perception Evaluation of TAG
4.2. Subjective and Objective Evaluation Methods
4.3. The Interaction Between Landscape Elements and Scenic Beauty Perception of TAG
4.4. Limitations of the Study
5. Conclusions
- To explore the perception of the beauty of three-dimensional greening in buildings, this study gathered 300 cases and created a case library. Typical samples were chosen at random to participate in the study, ensuring that all types of cases were represented in the experiments. Three experiments were set up in stages to assess perceptions of scenic beauty. Multiple methodologies, including questionnaire surveys, factor analysis, and data analysis, were employed in systematic research, and a systematic evaluation model was developed. This study suggests two evaluation paths—subjective and objective—to gauge how the general public perceives TAG using factor analysis and stepwise regression. This study will verify the subjective evaluation system with the objective evaluation system to ensure the evaluation’s efficacy and rationality. Additionally, correlation analysis between subjective evaluation indicators and eye-tracking indicators will be conducted to investigate the primary factors influencing the public’s perception of the beauty of TAG, providing scientific reference for the construction of urban landscapes.
- With the technological revolution of lightweight devices and open source algorithms, physiological data collection will increasingly be used to evaluate urban spaces. Future research may focus on the collaborative mechanism between landscape aesthetic value and ecological function, and promote the transformation of the evaluation system from “spatial efficiency priority” to “human-oriented perception driven”. The study conducted a “landscape-element” analysis based on subjective and objective experimental data and built a linkage of “evaluation experiment–data feedback–design guidance”. The evaluation approaches proposed in this study demonstrate the benefits of high efficiency and convenience in evaluating the creation of landscape atmosphere through images, leading the way for a new path for perception, evaluation, and optimization of TAG designs.
- Through the comparison of subjective and objective assessments, this study determined the interaction between spatial elements and public perception of beauty, offering a scientific basis for the three-dimensional greening of urban systems: In TAG design, the importance of Spatial Coordination is significantly greater than that of Ecological Stratification. Focusing on Spatial Coordination design can enhance the overall aesthetic appeal to a greater extent, while emphasizing Ecological Stratification can invigorate the details of the design to a greater degree.
Author Contributions
Funding
Institutional Review Board Statement
Informed Consent Statement
Data Availability Statement
Acknowledgments
Conflicts of Interest
Abbreviations
| TAG | Three-dimensional architectural greening |
| SBE | Scenic beauty estimation |
| SD | Semantic differential |
| SPSS | Statistical Product and Service Solutions |
| ANOVA | Analysis of variance |
| KMO | Kaiser–Meyer–Olkin |
| PCA | Principal components analysis |
| AOI | Area of interest |
| CNKI | China National Knowledge Infrastructure |
| μ | Population mean |
| σ | Population standard deviation |
| p | p-value |
| R2 | R-squared |
| FC | Fixation count |
| SC | Saccade count |
Appendix A

| Source | Website Link | |
| Part of the case data | ArchDaily | https://www.archdaily.com/ (accessed on 11 March 2024) |
| Zhulong Xue She | https://www.zhulong.com/ (accessed on 11 March 2024) | |
| Evaluation questionnaire data for Experiment Ⅰ | Wenjuanxing | https://www.wjx.cn/ (accessed on 13 May 2024) |
| Evaluation questionnaire data for Experiment Ⅱ | Offline and Face-to-Face (accessed on 17 June 2024) | |
| Software and algorithms | aSeeStudio | https://www.7invensun.com/sy (accessed on 17 June 2024) |
| SPSS | https://spss.mairuan.com/ (accessed on 13 May 2024) | |
| Adobe Photoshop | https://www.adobe.com/cn/ (accessed on 11 March 2024) | |
| Excel | https://www.microsoft.com/zh-cn/microsoft-365/excel (accessed on 13 May 2024) | |
| Serial Number of Samples (ExperimentⅡand ExperimentⅢ-1) | ||||
| CSWADI Lakeside Design Headquarters | Urban Development Exhibition Hall of Liuzhou | Shanghai Jiajie International Plaza | Plug-in City 75 House, Paris | I-House, Thailand |
| B5(Pre-test) | B11(Pre-test) | B19(Pre-test) | A4 | A7 |
| MIA Design Studio, Vietnam | Jakob Factory, Vietnam | Herstal City Hall, Belgium | Brussels wooden house | Slide office building, Chengdu |
| A8 | A10 | A12 | A13 | A14 |
| Architectural Lighting Works, Basalite Concrete Products | LOOM Ferreteria, Barcelona | Naman Hot Spring Club, Vietnam | Paris Primary School of Diversity, France | Botanical Garden of the Jiaxing Seed Art Center |
| A15 | A21 | A22 | B6 | B7 |
| Greenland Center, Shanghai, China | Longhu Ultra Low Energy Building Theme Hall, China | Expansion of the New Site of Nanxun Town Central Kindergarten, Huzhou, China | ZIEL Residential Building, Uruguay | Roomstyle Atelier Alice Trepp |
| B12 | B13 | B14 | B27 | B28 |
| Houses in Ribera, Spain | Sunoo Temple Residence, India | Nagomi Suites Hotel, Indonesia | Tonyfruit Green City Office Building, Vietnam | Sao Paulo Girasol Building |
| B30 | B36 | B37 | B39 | B43 |
| Julesverne School, France | Research Artistic Design + architecture | Groenmarkt Apartment Building, The Netherlands | California Academy of Sciences, America | Vietnam Clay Saigon Cafe |
| B54 | B58 | B65 | B73 | B78 |
| Nakagawa Century Memorial Hall, Japan | Flower Wood Company Office Renovation, Beijing, China | TT House, Vietnam | Vietnam Demen House, Vietnam | Moutvenlo Coffee Shop, The Netherlands |
| C2 | C3 | C11 | C13 | C21 |
| Cedar ING Office, The Netherlands | Guadalupe Market, Mexico | Yucatan Peninsula Progress Geological Museum, Mexico | Green House, Indonesia | Eco-cycle Pavillion Restaurant, Vietnam |
| C24 | C27 | C28 | C36 | C37 |
| Participants Serial Number | Education Background | Age | Gender | Uncorrected Visual Acuity | SBEC37 | SBESC37 | SBEOC37 |
| 1 | Postgraduate | 25 | Male | 4.8 | 2 | 1.89 | 0.87 |
| 2 | Postgraduate | 25 | Female | 4.9 | 1 | 1.57 | 0.75 |
| 3 | Postgraduate | 25 | Female | 5.1 | 1 | 1.35 | 0.71 |
| 4 | Undergraduate | 22 | Female | 4.9 | 1 | 1.23 | 0.69 |
| 5 | Postgraduate | 26 | Male | 4.9 | 1 | 0.99 | 0.51 |
| 6 | Undergraduate | 21 | Female | 4.9 | 0 | 0.78 | 0.45 |
| 7 | Postgraduate | 25 | Male | 4.9 | 0 | 0.43 | 0.39 |
| 8 | Postgraduate | 24 | Female | 4.9 | 1 | 1.41 | 0.71 |
| 9 | Postgraduate | 25 | Male | 4.9 | 1 | 1.23 | 0.7 |
| 10 | Postgraduate | 24 | Male | 5.0 | 0 | 0.88 | 0.5 |
| 11 | Undergraduate | 22 | Female | 4.9 | 0 | 0.65 | 0.45 |
| 12 | Postgraduate | 26 | Female | 5.0 | 0 | 0.36 | 0.39 |
| 13 | Postgraduate | 26 | Female | 5.1 | −2 | 0.1 | −0.46 |
| 14 | Postgraduate | 25 | Female | 5.1 | 2 | 1.82 | 0.76 |
| 15 | Undergraduate | 20 | Male | 5.0 | 1 | 1.79 | 0.76 |
| 16 | Undergraduate | 24 | Female | 5.0 | 1 | 1.46 | 0.73 |
| 17 | Undergraduate | 22 | Female | 5.1 | 1 | 1.38 | 0.71 |
| 18 | Postgraduate | 25 | Male | 5.1 | 1 | 1.35 | 0.71 |
| 19 | Postgraduate | 24 | Male | 4.8 | 1 | 1.3 | 0.71 |
| 20 | Postgraduate | 25 | Male | 4.8 | 1 | 1.16 | 0.66 |
| 21 | Postgraduate | 25 | Male | 5.1 | 1 | 1.01 | 0.55 |
| 22 | Postgraduate | 26 | Male | 4.8 | 1 | 0.99 | 0.5 |
| 23 | Undergraduate | 22 | Male | 4.8 | 0 | 0.88 | 0.48 |
| 24 | Postgraduate | 24 | Female | 4.8 | 0 | 0.77 | 0.45 |
| 25 | Postgraduate | 25 | Female | 5.0 | 0 | 0.57 | 0.45 |
| 26 | Postgraduate | 26 | Female | 5.1 | 0 | 0.43 | 0.39 |
| 27 | Undergraduate | 21 | Female | 5.0 | 0 | 0.32 | 0.39 |
| 28 | Postgraduate | 26 | Male | 5.0 | 1 | 1.68 | 0.76 |
| 29 | Postgraduate | 25 | Male | 4.8 | 1 | 1.12 | 0.66 |
| 30 | Postgraduate | 25 | Female | 4.9 | 1 | 1.06 | 0.6 |
| 31 | Undergraduate | 22 | Male | 4.9 | 1 | 0.91 | 0.5 |
| 32 | Postgraduate | 24 | Female | 4.9 | 0 | 0.54 | 0.39 |
| 33 | Postgraduate | 25 | Male | 5.0 | 0 | 0.11 | 0.07 |
| 34 | Postgraduate | 26 | Male | 5.0 | 2 | 1.9 | 1.23 |
| 35 | Postgraduate | 25 | Female | 4.9 | 1 | 1.12 | 0.6 |
| 36 | Undergraduate | 22 | Male | 4.9 | 1 | 1.01 | 0.55 |
| 37 | Undergraduate | 21 | Female | 4.8 | 0 | 0.21 | 0.34 |
References
- Gößner, D.; Kunle, M.; Mohri, M. Green roof performance monitoring: Insights on physical properties of 4 extensive green roof types after 2 years of microclimatic measurements. Build. Environ. 2025, 269, 112356. [Google Scholar] [CrossRef]
- Long, G.; Liu, Y. Architecture and Greening; WW Norton & Company: New York, NY, USA, 2003. [Google Scholar]
- De Groeve, M.; Kale, E.; Godts, S.; Orr, S.A.; De Kock, T. Impact of vertical greening on urban microclimate and historic building materials: A meta-analysis. Build. Environ. 2024, 253, 111365. [Google Scholar] [CrossRef]
- Wang, X.; Lin, Q. The New Landscape in Europe; Southeast University Press: Nanjing, China, 2003. [Google Scholar]
- Lee, J.; Kwon, E.E. Biochar in green roofs. J. Build. Eng. 2024, 89, 109272. [Google Scholar] [CrossRef]
- Tafahomi, R.; Nkurunziza, D.; Benineza, G.G.; Nadi, R.; Dusingizumuremyi, R. The Assessment of Residents’ Perception of Possible Benefits and Challenges of Home Vertical Gardens in Kigali, Rwanda. Sustainability 2024, 16, 3849. [Google Scholar] [CrossRef]
- Zhao, J.; Rao, Q.; Sun, C.; Ikram, R.M.A.; Fan, C.; Li, J.; Wang, M.; Zhang, D. A Systematic Review of the Vertical Green System for Balancing Ecology and Urbanity. Water 2024, 16, 1472. [Google Scholar] [CrossRef]
- Manouchehri, M.; Santiago López, J.; Valiente López, M. Sustainable Design of Vertical Greenery Systems: A Comprehensive Framework. Sustainability 2024, 16, 3249. [Google Scholar] [CrossRef]
- Mao, B.; Gong, L.; Xu, C. Evaluating the Scenic Beauty of Individual Trees: A Case Study Using a Nonlinear Model for a Pinus Tabulaeformis Scenic Forest in Beijing, China. Forests 2015, 6, 1933–1948. [Google Scholar] [CrossRef]
- Pérez-Hernández, E.; Peña-Alonso, C.; Fernández-Cabrera, E.; Hernández-Calvento, L. Assessing the scenic quality of transgressive dune systems on volcanic islands. The case of Corralejo (Fuerteventura island, Spain). Sci. Total Environ. 2021, 784, 147050. [Google Scholar] [CrossRef]
- Li, L.; Cheng, J.; Liu, Z.; Li, Q.; Yu, L.; Zhou, X.; Pang, Y. The Impact of Coverage Forms of Exterior Vertical Greening Walls on the Thermal Environmental Benefits of Buildings in Hot and Humid Regions. Buildings 2024, 14, 3840. [Google Scholar] [CrossRef]
- Zhang, F.; Liu, Q.; Zhou, X. Vitality Evaluation of Public Spaces in Historical and Cultural Blocks Based on Multi-Source Data, a Case Study of Suzhou Changmen. Sustainability 2022, 14, 14040. [Google Scholar] [CrossRef]
- Zhang, F.; Zhou, X. Structural renovation of blocks in build-up area of Jiangnan cities, taking Suzhou new district as an example. iScience 2023, 26, 108553. [Google Scholar] [CrossRef] [PubMed]
- Daniel, T.C.; Vining, J. Methodological issues in the assessment of landscape quality. In Behavior and the Natural Environment; Springer: Boston, MA, USA, 1983. [Google Scholar]
- Osmundson, T. Roof Gardens: History Design and Construction; WW Norton & Company: New York, NY, USA, 1999. [Google Scholar]
- Nevzati, F.; Veldi, M.; Külvik, M.; Bell, S. Analysis of Landscape Character Assessment and Cultural Ecosystem Services Evaluation Frameworks for Peri-Urban Landscape Planning: A Case Study of Harku Municipality, Estonia. Land 2023, 12, 1825. [Google Scholar] [CrossRef]
- Alharbi, O.A.; Rangel-Buitrago, N. Scenery evaluation as a tool for the determination of visual pollution in coastal environments: The Rabigh coastline, Kingdom of Saudi Arabia as a study case. Mar. Pollut. Bull. 2022, 181, 113861. [Google Scholar] [CrossRef] [PubMed]
- Luo, Y.; Shen, S.; Zhan, W. Research on Experience Evaluation of Cultural Landscape of Zhang Guying Village Based on SD and Eye Movement Analysis. Chin. Landsc. Archit. 2022, 38, 98. [Google Scholar] [CrossRef]
- Pettenati, G. Cultural Landscape: A New Paradigm for Landscape Architecture; Routledge: London, UK, 2022. [Google Scholar]
- Cheng, Y. Evaluating Method for Landscape. Inter. Des. Constr. 2005, 3, 12–15. [Google Scholar]
- Ma, R.; Lyu, Y.; Chen, T.; Zhang, Q. Preliminary Risk Assessment of Geological Disasters in Qinglong Gorge Scenic Area of Taihang Mountain with GIS Based on Analytic Hierarchy Process and Logistic Regression Model. Sustainability 2023, 15, 15752. [Google Scholar] [CrossRef]
- Luo, X.; Li, X.; Liu, W.; Wang, M.; Liu, C. Comprehensive evaluation of natural landscapes before and after earthquake based on GST-FAHP-GIS analytical method: A case study of Jiuzhaigou Nature Reserve, China. Ecol. Indic. 2023, 154, 110850. [Google Scholar] [CrossRef]
- Li, S.; Zhang, X.; Kim, F.J.; da Silva, R.D.; Gustafson, D.; Molina, W.R. Attention-aware robotic laparoscope based on fuzzy interpretation of eye-gaze patterns. J. Med. Devices 2015, 9, 041007. [Google Scholar] [CrossRef]
- Tinker, M.A. Experimental Studies on the Legibility of Print: An Annotated Bibliography. Read. Res. Q. 1966, 1, 67–118. [Google Scholar]
- Fang, X.U. Impacts of Wind Energy Development on Landscape Planning in the Context of Carbon Neutrality. Landsc. Archit. 2022, 29, 52–58. [Google Scholar]
- Zhang, R.; Yan, X.; Wang, C. Research on Emotional Interaction Between People and Built Environment Driven by Multi-Modal Data: Take Wudaokou Jingzhang Railway Park as an Example. Urban Dev. Stud. 2022, 29, 55–66. [Google Scholar]
- Zhao, Y.; Lin, J.; Liu, Y. Research on visual evaluation of tourism scenery based on eye movement experiment: A case of Tangjia ancient town in Zhuhai. Hum. Geogr. 2020, 35, 130–140. [Google Scholar]
- Cheng, S.; Zhang, X.; Cheng, Y. Prospect of the application of digital landscape technology in the field of landscape architecture in China. Landsc. Archit. 2021, 28, 46–52. [Google Scholar]
- Li, X.; Li, Y.; Ren, Y.; Lusk, A. Research on the urban spatial visual quality based on subjective evaluation method and eye tracking analysis. Archit. J. 2020, S2, 190–196. [Google Scholar]
- Wei, F.; Chen, L.; Zan, P. Between Industrial Remains and the Green—Research on Public Perception of Rewilded Postindustrial Landscape. Chin. Landsc. Archit. 2022, 38, 36–41. [Google Scholar] [CrossRef]
- Wu, Y.; Dong, W.; Zhang, W. Research on influencing factors of built environment perception in neighborhoods: Evidence from behavioral experiment. City Plan. Rev. 2022, 46, 99–109. [Google Scholar]
- Amati, M.; Ghanbari Parmehr, E.; McCarthy, C.; Sita, J. How eye-catching are natural features when walking through a park? Eye-tracking responses to videos of walks. Urban For. Urban Green. 2018, 31, 67–78. [Google Scholar] [CrossRef]
- PPółrolniczak, M.; Potocka, I.; Kolendowicz, L.; Rogowski, M.; Kupiński, S.; Bykowski, A.; Młynarczyk, Z. The Impact of Biometeorological Conditions on the Perception of Landscape. Atmosphere 2019, 10, 264. [Google Scholar] [CrossRef]
- Misthos, L.M.; Pavlidis, A.; Karabassakis, E.; Menegaki, M.; Krassanakis, V.; Nakos, B. Exploring the visual impact from open pit mines applying eye movement analyses on mining landscape photographs. Int. J. Min. Reclam. Environ. 2019, 34, 609–624. [Google Scholar] [CrossRef]
- Zhang, F.; Wang, D.; Zhou, X.; Ye, F. Community Resilience Evaluation and Construction Strategies in the Perspective of Public Health Emergencies: A Case Study of Six Communities in Nanjing. Sustainability 2024, 16, 6992. [Google Scholar] [CrossRef]
- Zhou, X.; Ye, F.; Zhang, F.; Wang, D. Analysis and Optimization of Residential Elements from the Perspective of Multi-Child Families in the Yangtze River Delta Region. Buildings 2024, 14, 1649. [Google Scholar] [CrossRef]
- Zhao, Q.; Zhou, Y.; Zhai, J. Bridging beauty and biodiversity: Coupling diversity and aesthetics through optimized plant communities in urban riverfront landscapes. Sci. Total Environ. 2024, 950, 175278. [Google Scholar] [CrossRef]
- Wang, L.; Sun, C.; Wang, M. Optimization Strategies for Waterfront Plant Landscapes in Traditional Villages: A Scenic Beauty Estimation–Entropy Weighting Method Analysis. Sustainability 2024, 16, 7140. [Google Scholar] [CrossRef]
- Li, Z.; Sun, X.; Zhao, S.; Zuo, H. Integrating eye-movement analysis and the semantic differential method to analyze the visual effect of a traditional commercial block in Hefei, China. Front. Archit. Res. 2021, 10, 317–331. [Google Scholar] [CrossRef]
- Zhang, N.; Zheng, X.; Wang, X. Assessment of Aesthetic Quality of Urban Landscapes by Integrating Objective and Subjective Factors: A Case Study for Riparian Landscapes. Front. Ecol. Evol. 2022, 9, 735905. [Google Scholar] [CrossRef]
- Meyer, J.; Use of End Otrophic Mycorrhiza and Soil Microorganisms in Vegetation Establishment on Mingeral Green Roof Substrates. Canada; 2004. Available online: https://www.osti.gov/etdeweb/biblio/20861877 (accessed on 12 April 2025).
- Blanc, P. The Vertical Garden: From Nature to the City; WW Norton & Company: New York, NY, USA, 2008. [Google Scholar]
- Zhou, X. New Approach of Enlargement of Urban Green Space; Southeast University Press: Nanjing, China, 2015. [Google Scholar]
- Zhang, J. The Diagnosis Methods in Planning and Design (16)—SD Method. Chin. Landsc. Archit. 2004, 20, 54–58. [Google Scholar]
- Shang, G.; Shi, Z.; Peng, C.; Wang, Z. Evaluation and Prediction of Health of BUCK Circuit Based on Weighted Mahalanobis Distance. J. China Railw. Soc. 2023, 12, 103–111. [Google Scholar] [CrossRef]
- Cai, J.; He, S.; Jiang, Z.; Liu, Q.; Zhang, Y. Investigation on Stability Analysis Method of Single Layer Latticed Shells. Eng. Mech. 2015, 7, 103–110. [Google Scholar] [CrossRef]
- He, X. Modern Quality Management and 6σ Process Control. J. Appl. Stat. Manag. 2003, 5, 10–14. [Google Scholar] [CrossRef]
- He, B.; Zhang, Y.; Bai, Y. A Method for Sensor Signal De-noising Based on ICA-CEEMD Wavelet Threshold. J. Vib. Shock 2017, 4, 226–231+242. [Google Scholar] [CrossRef]
- Xu, Y.; Chen, X.; Cao, D. Compatibility Test Method in Minimal Samples Situation with Two Samples. Acta Aeronaut. Astronaut. Sin. 2018, 5, 144–151. [Google Scholar] [CrossRef]
- Hong, C. Research on Landscape Preference of Public Space in Traditional Villages—Take Fuzhou Minan Village as an Example; Fujian Agriculture and Forestry University: Fuzhou, China, 2020. [Google Scholar] [CrossRef]
- Daniel, T.C. Measuring Landscape Esthetics: The Scenic Beauty Estimation Method; Department of Agriculture, Forest Service, Rocky Mountain Forest and Range Experiment Station: Fort Collins, CO, USA, 1976; Volume 167. [Google Scholar]

| Technical Type | Representative Photographs | |
|---|---|---|
| Green Roofs Project | 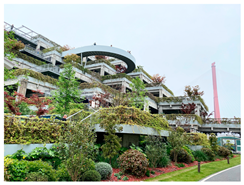 |  |
| Green Hill, Shanghai Building Complex (Original Tobacco Company Machine Repair Warehouse) | Nanjing Tech University, Nanjing, Educational Buildings | |
| Green Facades Name |  | 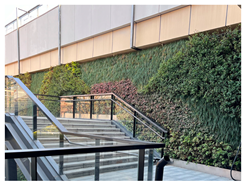 |
| Tongji University, Shanghai, Educational Buildings | Cangjie Commercial Plaza, Suzhou, Open Business Center (Original Jiangsu Third Prison) | |
| Spatial Type | Representative Photographs | |
|---|---|---|
| Horizontal Greening Systems | 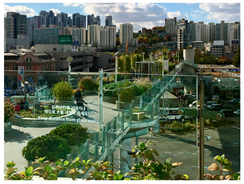 |  |
| Name | SEOULLO 7017, South Korea, Pedestrian Street | Green Hill, Shanghai, Building Complex (Original Tobacco Company Machine Repair Warehouse) |
| Vertical Greening Systems | 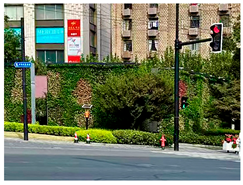 | 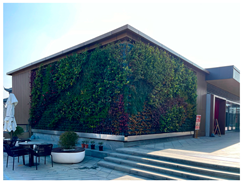 |
| Name | HKRI Taikoo Hui, Shanghai, Commercial Complex | Sanke Yinghua of Cangjie Commercial Plaza, Suzhou, Open Business Center (Original Jiangsu Third Prison) |
| Indoor Greening | 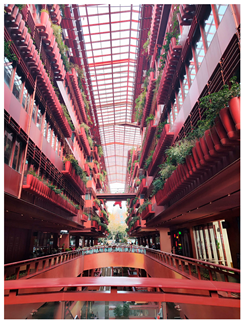 | 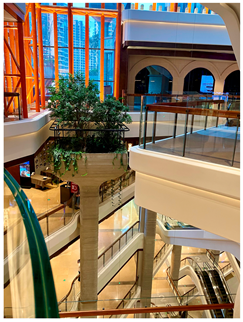 |
| Name | The Roof, Shanghai, Commercial Complex | 1000 TREES, Shanghai, Commercial, Hotel, and Office Buildings |
| Landscape Elements | Subjective Evaluation Factors | Inspection Content |
|---|---|---|
| Spatial Elements | Landscape Subjectivity | Whether the three-dimensional landscape scene highlights the target presented in the picture. |
| Scene Balance | The compositional structure and balance of the elements in the picture. | |
| Natural Elements | Vegetation Layering | The layering of vegetation in the landscape, such as trees, shrubs, and grass. |
| Landscape Coordination | The coordination between the three-dimensional greening in the picture and the surrounding landscape. | |
| Architectural Elements | Architectural Coordination | The integration of the greening in the picture with the building and the surrounding architecture. |
| Functional Integration | The degree of integration between the three-dimensional greening and the functional aspects of the building. | |
| Color Coordination | The degree of harmony between the greening and the building’s color scheme. |
| TGA Type | Statistical Interval | Scenic Beauty Value | Number of Cases | Normal Distribution, Boxplot, and Scatter Plot | ||
|---|---|---|---|---|---|---|
| Low | Medium | High | ||||
| Vertical Greening Systems | Value Range | <−0.1560 | −0.1560~0.7512 | >0.7512 | - | 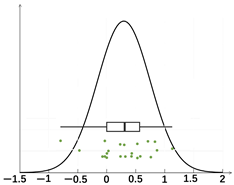 |
| Total Quantity | 9 | 24 | 5 | 38 | ||
| Extracted Quantity | 1 | 7 | 2 | 10 | ||
| Horizontal Greening Systems | Value Range | <0.2301 | 0.2301~0.7893 | >0.7893 | - | 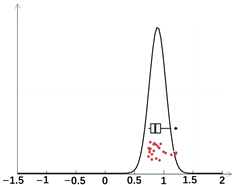 |
| Total Quantity | 24 | 60 | 14 | 81 | ||
| Extracted Quantity | 3 | 12 | 5 | 20 | ||
| Indoor Greening | Value Range | <0.3749 | 0.3749~0.8029 | >0.8029 | - | 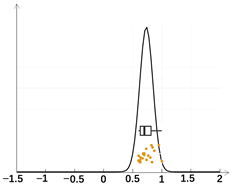 |
| Total Quantity | 6 | 25 | 8 | 39 | ||
| Extracted Quantity | 2 | 7 | 1 | 10 | ||
| Common Factor | Initial Eigenvalues | Extracted Sums of Squared Loadings | Rotated Sums of Squared Loadings | ||||||
|---|---|---|---|---|---|---|---|---|---|
| Total | Percentage of Variance | Cumulative Percentage (%) | Total | Percentage of Variance | Cumulative Percentage (%) | Total | Percentage of Variance | Cumulative Percentage (%) | |
| 1 | 4.769 | 68.131 | 68.131 | 4.769 | 68.131 | 68.131 | 4.379 | 62.558 | 62.558 |
| 2 | 1.604 | 22.919 | 91.050 | 1.604 | 22.919 | 91.050 | 1.994 | 28.492 | 91.050 |
| 3 | 0.226 | 3.223 | 94.273 | ||||||
| 4 | 0.163 | 2.327 | 96.600 | ||||||
| 5 | 0.095 | 1.355 | 97.955 | ||||||
| 6 | 0.079 | 1.135 | 99.089 | ||||||
| 7 | 0.064 | 0.911 | 100.000 | ||||||
| Common Factor | Landscape Subjectivity | Scene Balance | Vegetation Layering | Landscape Coordination | Architectural Coordination | Functional Integration | Color Coordination |
|---|---|---|---|---|---|---|---|
| F1 | −0.112 | 0.235 | −0.067 | 0.192 | 0.247 | 0.217 | 0.209 |
| F2 | 0.542 | −0.082 | 0.502 | 0.062 | −0.120 | −0.038 | 0.019 |
| Representative Vertical Greening System Samples Fixation Heatmap | ||
|---|---|---|
 | 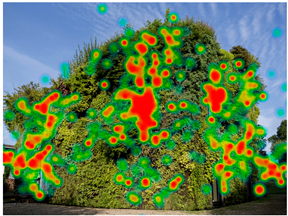 |  |
| A12 | A13 | A14 |
| Legend |  | |
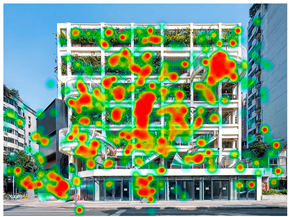
| Representative Horizontal Greening System Samples Fixation Heatmap | ||
|---|---|---|
 |  | 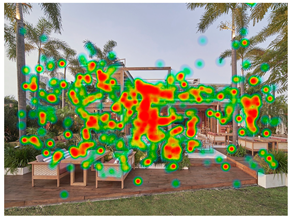 |
| B73 | B14 | B78 |
| Legend |  | |
| Representative Indoor Greening Samples Fixation Heatmap | ||
|---|---|---|
 | 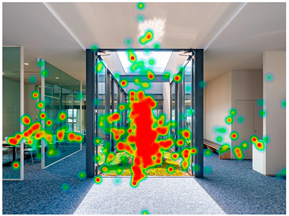 |  |
| C37 | C2 | C11 |
| Legend |  | |
| Dependent Variable | Sum of Squares | Mean Square | F | p |
|---|---|---|---|---|
| AOI Total Dwell Time | 6.865 | 0.624 | 9.095 | <0.001 |
| AOI First Fixation Duration | 0.033 | 0.003 | 1.097 | 0.391 |
| AOI Fixation Count | 49.438 | 4.494 | 3.971 | <0.001 |
| AOI First Fixation Time Score | 1562.500 | 142.045 | 0.142 | 0.999 |
| Phase | Analysis | D6 | D12 | … |
|---|---|---|---|---|
| TAG AOI Experiment | Fixation Heatmap |  | 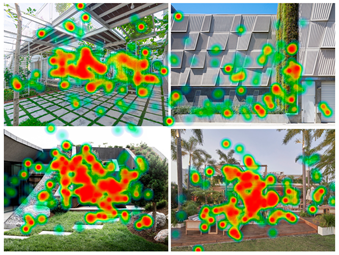 | … |
| Legend |  | |||
| Fixation Trajectory Map | 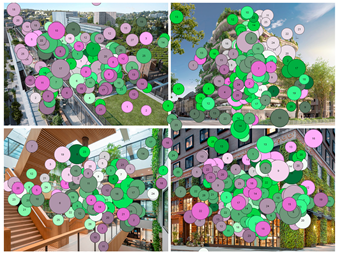 | 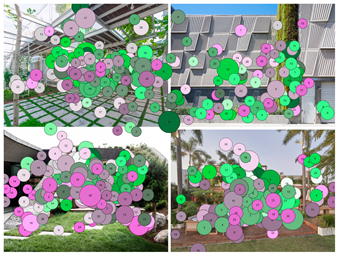 | … | |
| Legend |  |  |  | |
| Maximum Fixation Duration Map | 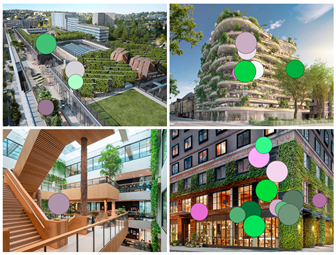 |  | … | |
| Legend |  |  | ||
| Variable Name | Unstandardized Coefficients | Standardized Coefficients | |||
|---|---|---|---|---|---|
| B | Standard Error | Beta | t | p | |
| Constant | −0.683 | 0.677 | −1.009 | 0.320 | |
| Fixation Count | 0.227 | 0.037 | 0.744 | 6.145 | <0.001 |
| Saccade Count | −0.174 | 0.036 | −0.588 | −4.858 | <0.001 |
| Indicator Name | Total Fixation Duration | Average Fixation Duration | Fixation Count | First Fixation Duration | Average Saccade Amplitude | Saccade Count |
|---|---|---|---|---|---|---|
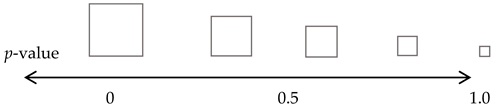
| Ecological Stratification Score |  |  |  |  |  |  |
| Spatial Harmony Score |  |  |  |  |  |  |
| Legend |  | |||||
 | ||||||
Disclaimer/Publisher’s Note: The statements, opinions and data contained in all publications are solely those of the individual author(s) and contributor(s) and not of MDPI and/or the editor(s). MDPI and/or the editor(s) disclaim responsibility for any injury to people or property resulting from any ideas, methods, instructions or products referred to in the content. |
© 2025 by the authors. Licensee MDPI, Basel, Switzerland. This article is an open access article distributed under the terms and conditions of the Creative Commons Attribution (CC BY) license (https://creativecommons.org/licenses/by/4.0/).
Share and Cite
Zhou, X.; Dong, Z.; Zhang, F. Comparative Analysis of TAG (Three-Dimensional Architectural Greening) Scenic Beauty Quantitative Techniques Based on Visual Perception. Buildings 2025, 15, 1450. https://doi.org/10.3390/buildings15091450
Zhou X, Dong Z, Zhang F. Comparative Analysis of TAG (Three-Dimensional Architectural Greening) Scenic Beauty Quantitative Techniques Based on Visual Perception. Buildings. 2025; 15(9):1450. https://doi.org/10.3390/buildings15091450
Chicago/Turabian StyleZhou, Xi, Ziyang Dong, and Fang Zhang. 2025. "Comparative Analysis of TAG (Three-Dimensional Architectural Greening) Scenic Beauty Quantitative Techniques Based on Visual Perception" Buildings 15, no. 9: 1450. https://doi.org/10.3390/buildings15091450
APA StyleZhou, X., Dong, Z., & Zhang, F. (2025). Comparative Analysis of TAG (Three-Dimensional Architectural Greening) Scenic Beauty Quantitative Techniques Based on Visual Perception. Buildings, 15(9), 1450. https://doi.org/10.3390/buildings15091450