Article

Research on the Coupling Relationship Between Street Built Environment and Thermal Comfort Based on Deep Learning of Street View Images: A Case Study of Chaowai Block in Beijing

College of Architecture and Art, North China University of Technology, Beijing 100144, China
*
Author to whom correspondence should be addressed.
Buildings 2025, 15(9), 1449; https://doi.org/10.3390/buildings15091449
Submission received: 26 March 2025 / Revised: 17 April 2025 / Accepted: 21 April 2025 / Published: 24 April 2025
(This article belongs to the Section Building Energy, Physics, Environment, and Systems)

Abstract

:
Against the background of global climate change receiving widespread attention, local microclimate environments have become a key focus of climate change research, which is of great significance for improving the quality of urban living environments. This study explored the quantitative coupling relationship between the built environment and the thermal comfort of complex streets. Outward blocks in Beijing were used as an example. By applying deep learning to street view images of an arterial road, we built three levels of road environmental elements for a quantitative analysis, simulated the block thermal comfort, numerically extracted the built environment factor, and derived a regression equation of the thermal comfort. The research results show that the UTCI value range of the Chaowai Block is between 28.15 °C and 47.11 °C, corresponding to human thermal sensations from slightly warm to very hot. The green rate, expressways, road width, spacious surroundings, sky, traffic, and ancillary facilities significantly affected the thermal comfort. Through the regression equation results, it can be found that the thermal comfort of different levels of roads is affected by multiple street built environment factors, and these influencing factors show differences in various levels of roads. Based on the results of the regression equation, corresponding optimization strategies were proposed to improve the thermal environment of urban streets and enhance the thermal comfort of pedestrians.

1. Introduction

With the acceleration of global urbanization and climate change, the problem of urban microclimate environments has become increasingly prominent, especially in international metropolises such as Beijing. High-density buildings, a large population, and increasing traffic flow increase the temperature and heat island effect in cities, which affect the life and work of residents. Therefore, methods to improve the urban thermal environment and thermal comfort must urgently be examined in urban planning and construction.
In the early 20th century, foreign scholars began to study human thermal comfort and put forward the concept of thermal comfort. With the passage of time, people have started to pay attention to the advantages and disadvantages of the outdoor environment. The research team of Liu Binyi studied the thermal comfort of Shanghai urban plazas, residential areas, and other spaces in 2016 [1].
A study on the microclimate environment of public spaces in Italian cities was carried out by Finaeva in 2017 [2]. In the same year, Suminah et al. performed a field survey of the microclimates on the green spaces of surrounding apartments in Jakarta [3]. Yang Jiahao et al. studied the issue of improving thermal comfort for students and outdoor workers and proposed technical strategies such as reducing thermal risks and optimizing the outdoor spaces of buildings [4,5].
A large number of field studies have verified that urban spaces in different regions have local characterized thermal comfort thresholds [6]. However, as thermal comfort evaluation is based on human perception with plenty of complex influencing factors, generalization of evaluation standards appears unrealistic. This in turn affirms the complexity of thermal comfort research [7].
When researchers abroad examined the effect of city layouts and the built environment on the microclimate, they found that the spatial heterogeneity of the landscape pattern, street configuration (aspect ratio), sky view, and average radiation temperature were key factors [8,9,10] that affected the outdoor thermal comfort. Domestic researchers paid more attention to strategies to improve thermal comfort and focused on the macro scale of urban areas and micro scale of blocks. Examples of the macro scale in urban areas are urban parks and green spaces, where researchers optimized tree-planting strategies to improve the thermal comfort [11], simulated the urban microclimate, and calculated the thermal comfort index to guide urban renewal and landscape planning [12]. In the microscopic scale of blocks, researchers discussed the effects of street spaces, architectural layouts, greening, and other factors on the thermal comfort. The results showed that the temperature in the shaded areas of roads, water bodies, and buildings varied [13] at different periods, and the spatial factors significantly affected [14] the improvement of microclimates. In addition, residents have an urgent need [15] for the wind speed and shade to be improved.
The thermal comfort of urban streets is comprehensively affected by elements of the built environment, which show different characteristics under different road conditions. Previous studies have often been confined to single-parameter analyses of the changes, whereas urban roads between microclimate environments and built environments are complex in reality, and these two environments mutually depend on and interact with each other [16,17].
According to the relevant and current literature, our research is original because it deals with the subject of how to improve the microclimate environment of streets from the perspectives of street thermal comfort and the built environment, investigates it with street view images as the data basis to identify and analyze various street built environment elements, and then investigates the quantitative coupling relationship between them and the thermal comfort of streets at different levels. As a result, the research has concluded that the thermal comfort of streets at different levels is quantitatively influenced by multiple street built environment elements, and these influencing factors show differences.
The research aims to gain a deeper understanding of the complexity of the microclimate of city streets, identify key factors that affect thermal comfort to provide a scientific basis for urban road planning and design, help optimize the urban layout, improve the street environment, and enhance the overall livability of the city.

2. Research Methods

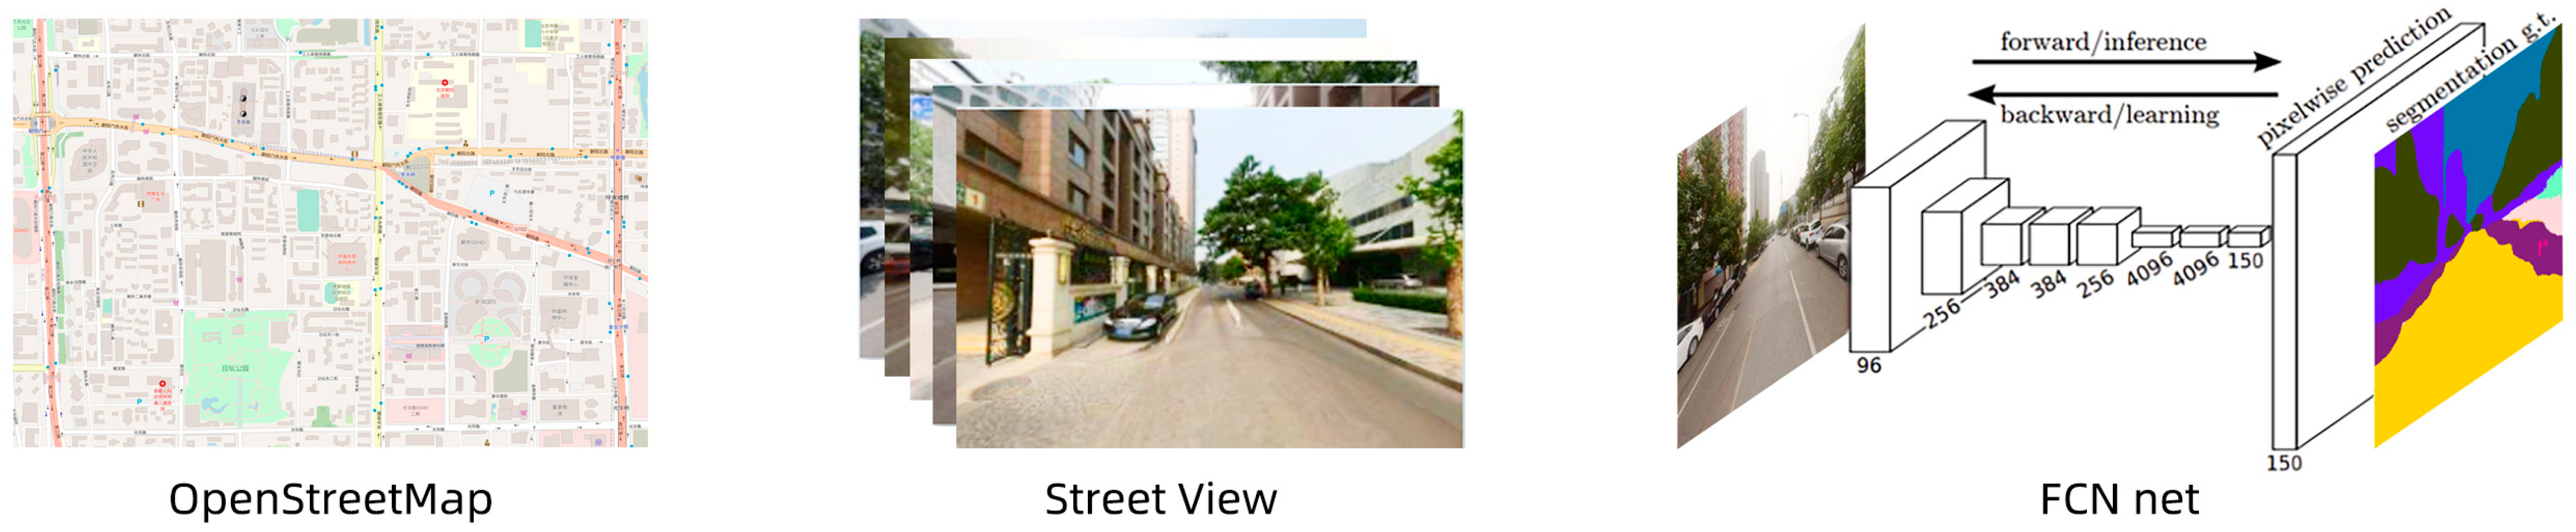
2.1. Street View Image Deep Learning and Quantitative Analysis of the Built Environment

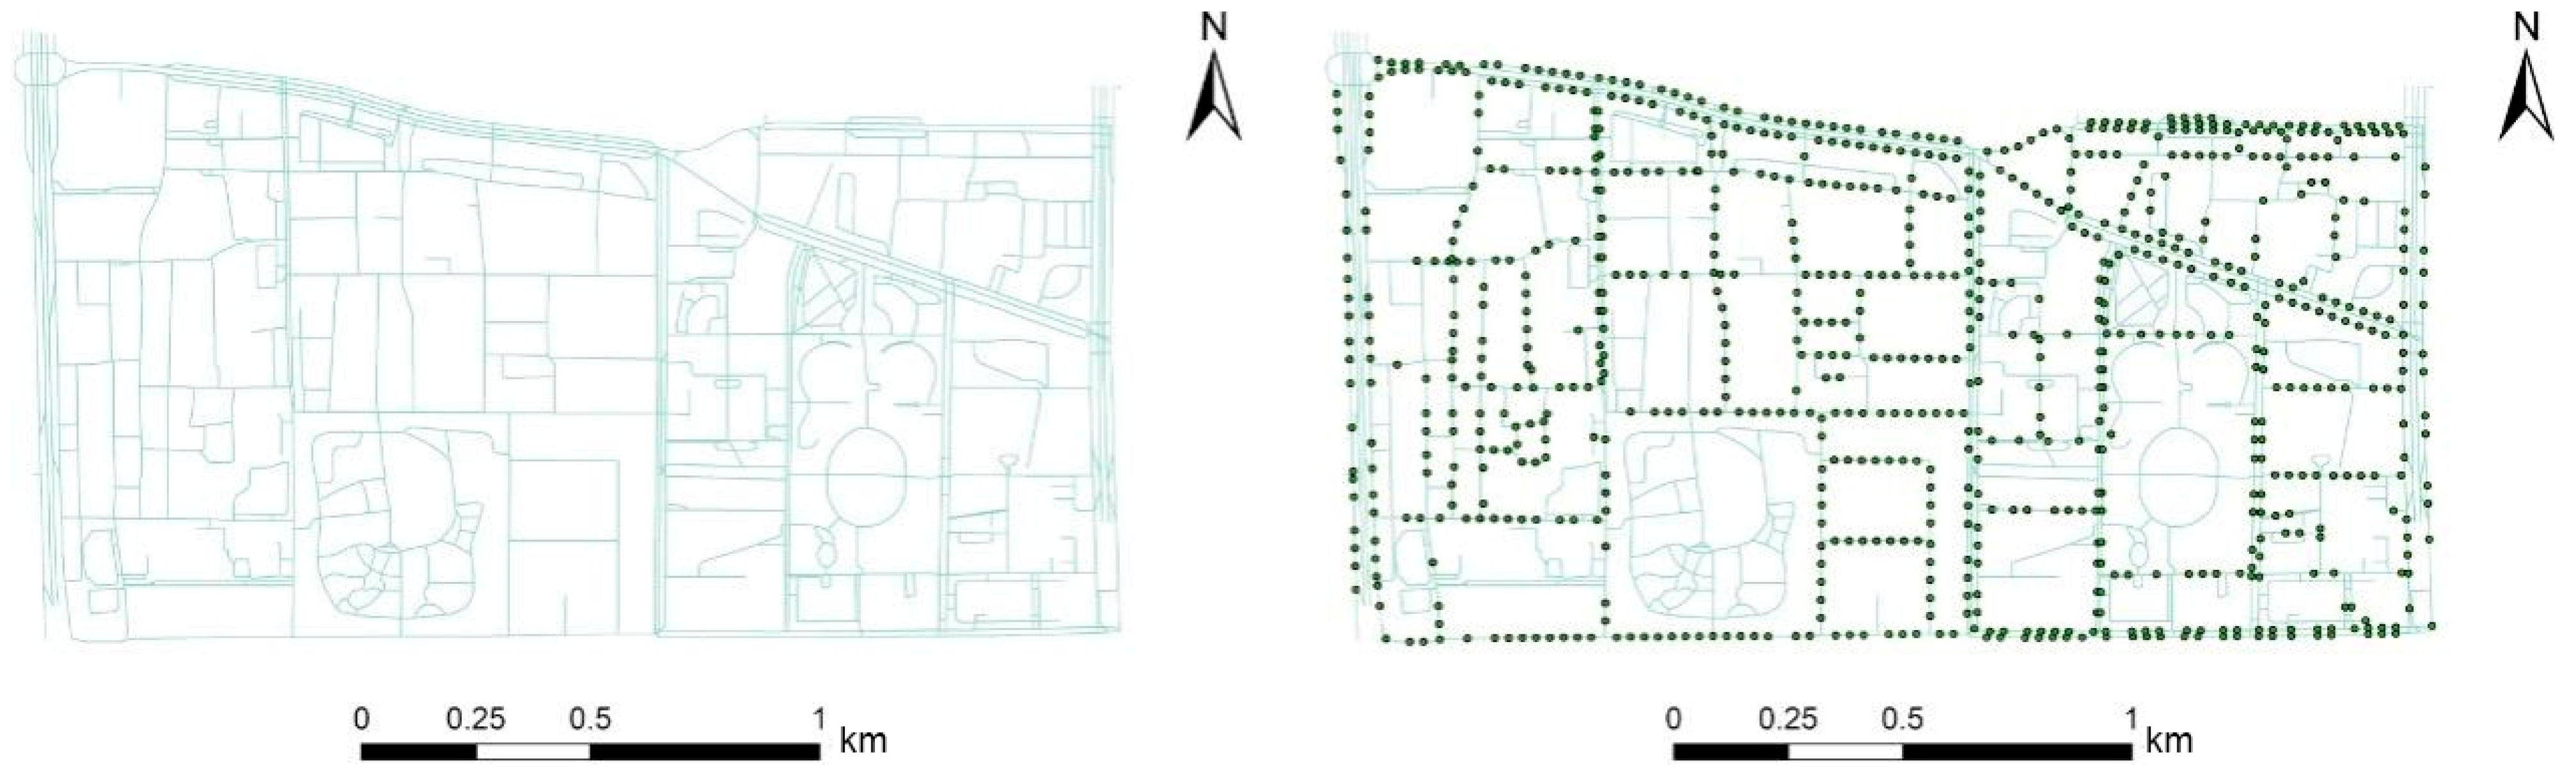
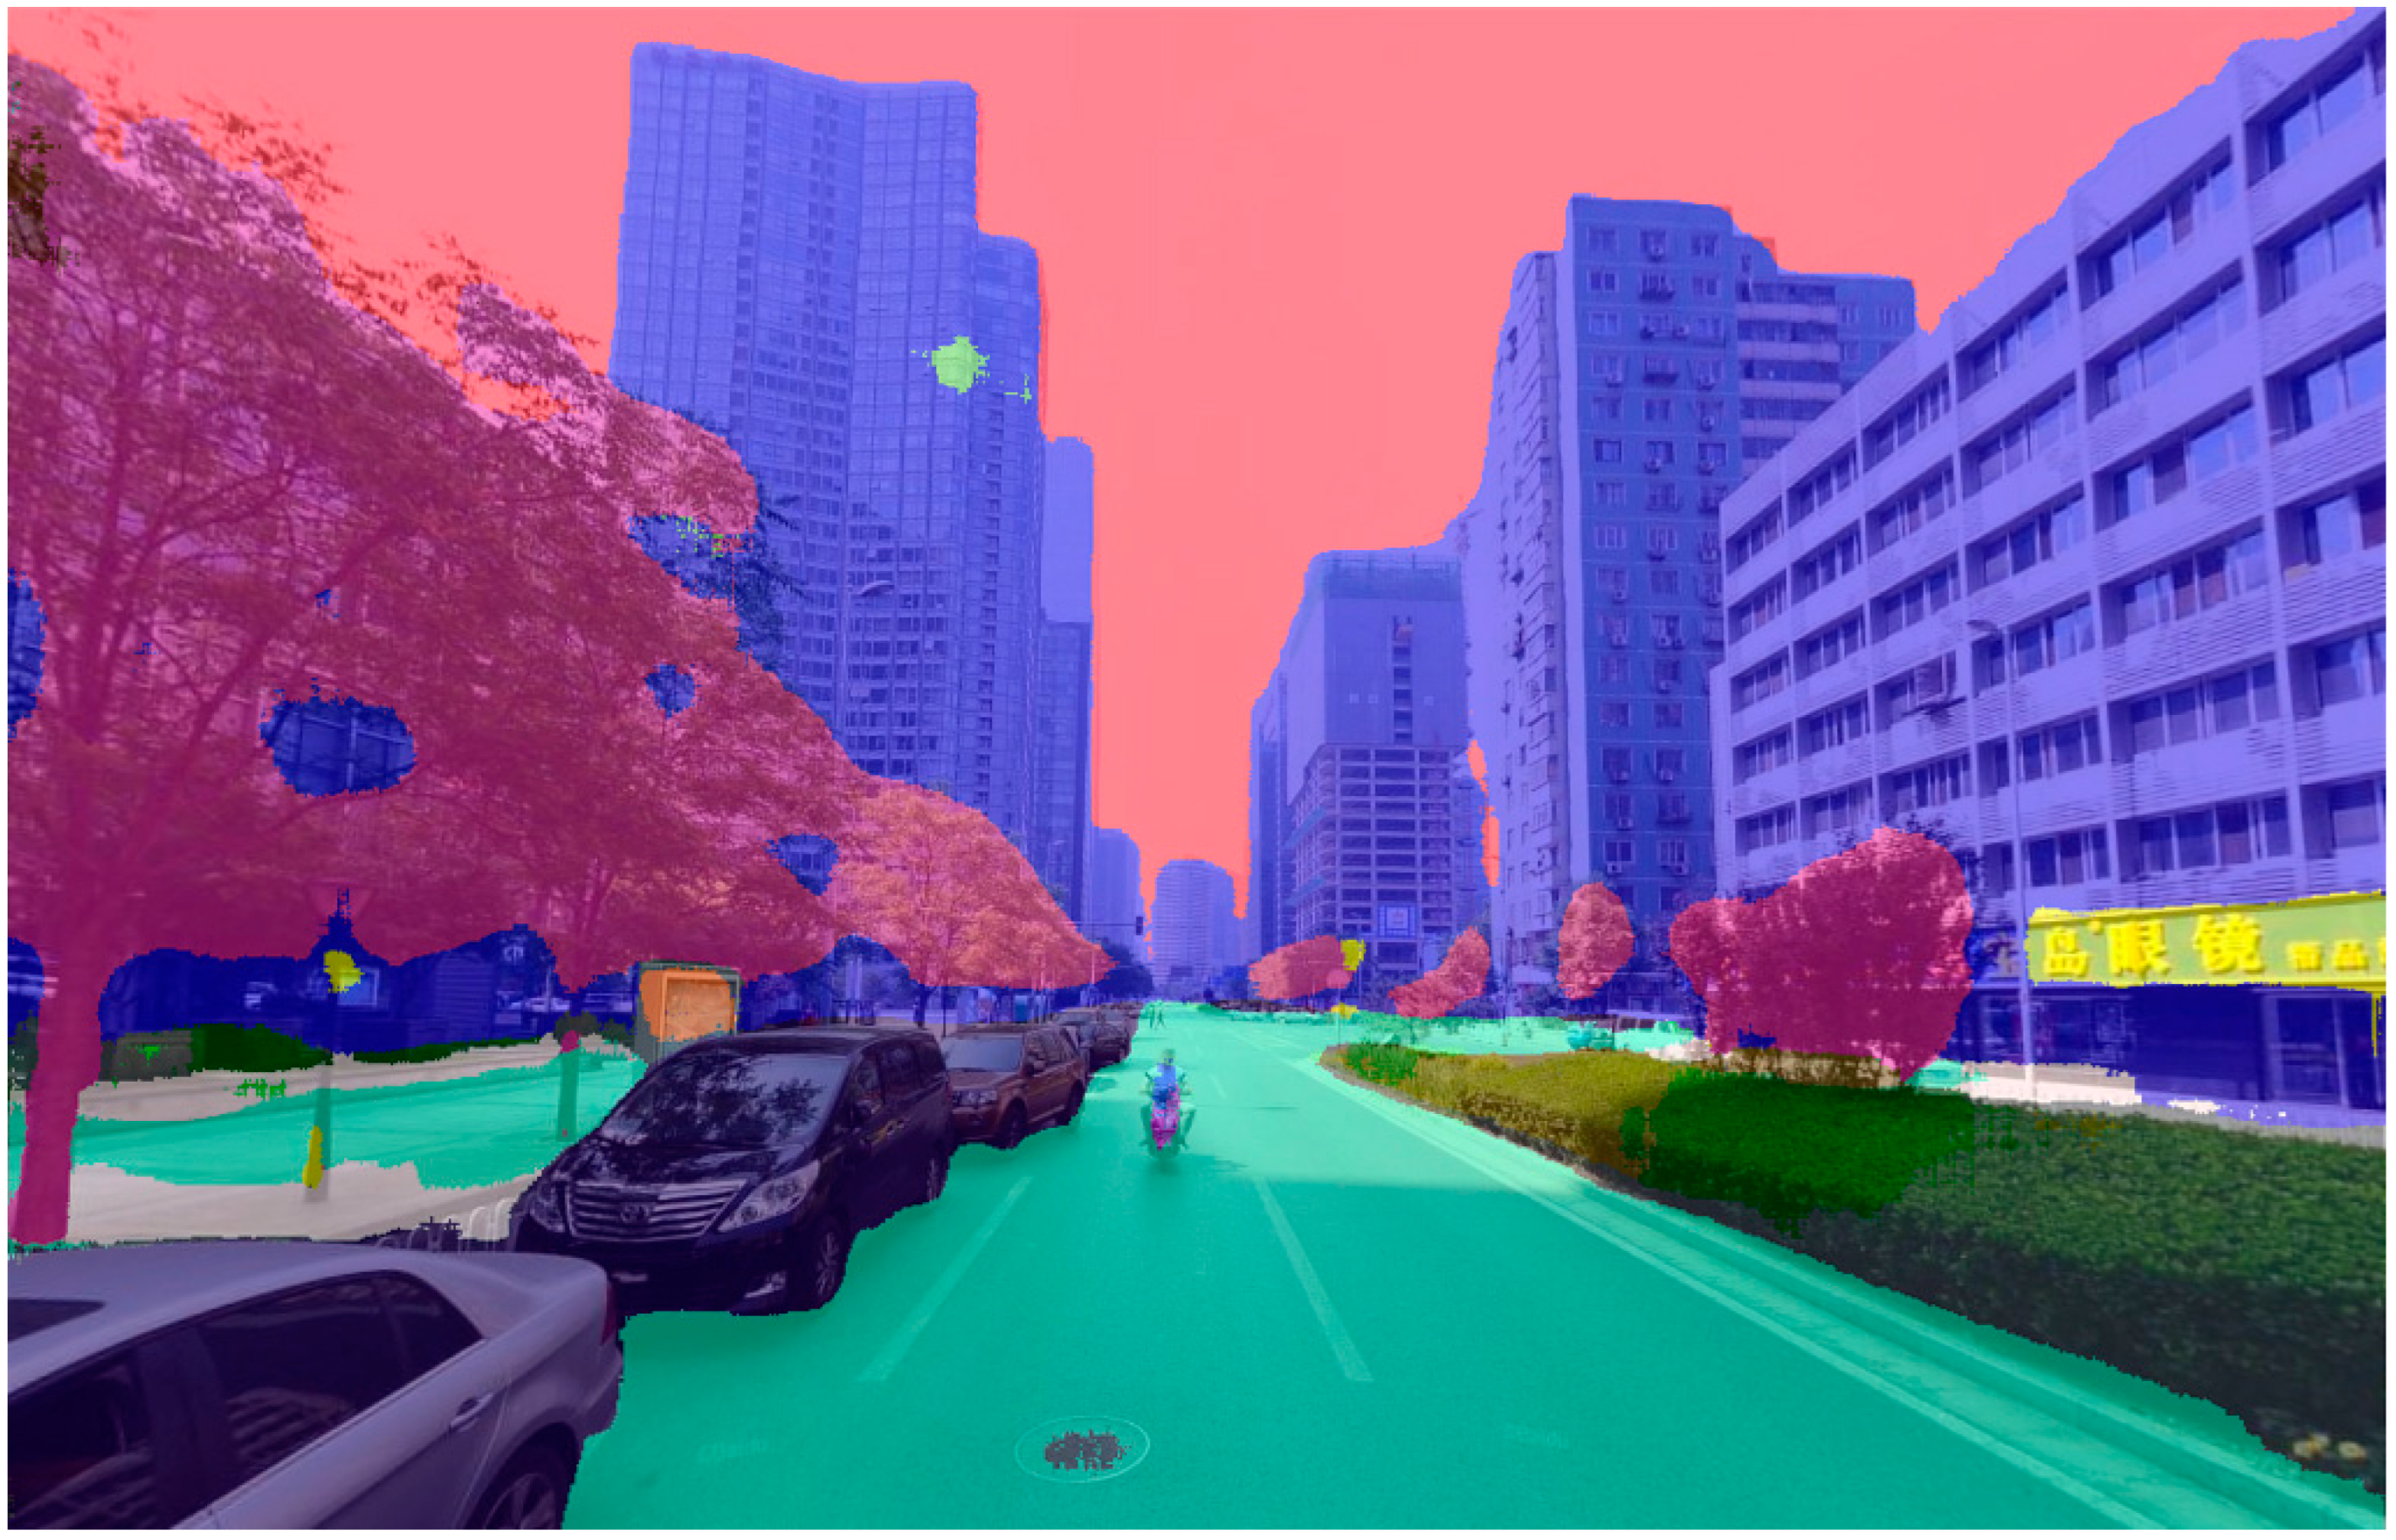
2.1.1. Street View Image Acquisition and Processing

Beijing is located on the North China Plain. Its characteristics are a warm temperate subhumid continental monsoon climate, high temperature, and rain in the summer. Due to construction in the city center, the early part of the road lacks greenery, and obsolete infrastructures are common problems in urban development. Thus, the heat island effect in the city center is remarkable. This study focused on Beijing’s Chaoyang District, of which outward blocks were the core research area. The area covers an area of approximately 358 hectares. As a typical block in the central urban area of Beijing, Chaowai Block is characterized by a dense road network, a high building density, diverse spatial functions, and rich street forms. Therefore, the coupling relationship between the built environment and the thermal comfort of this block was explored in detail.
Different levels of the street have different environmental effects on thermal comfort. Thus, this study focused on three road levels (the main roads, the arterial roads, and the branches) to examine the correlations between environmental factors and thermal comfort [18,19]. Built environment data based on the Baidu street view platform and network data from OpenStreetMap were downloaded, organized, and simplified to 30 m intervals; the sampling points were isometrically set. Data were obtained from street view images acquired from May to October in 2023 (Figure 1).
In this study, we used the neural network developed by Professor Guan Qing Feng’s team from the Information Engineering College of the China University of Geosciences (Wuhan) [20], which was based on deep learning with a convolutional neural network (FCN) visual image semantic segmentation model and an ADE20K FCN network training dataset released by MIT [21,22]. Recognition results were sorted out. Experiments showed that the accuracy of the neural network on the training set was 81.44% and that the accuracy on the test set was 66.83% [20]. The neural network can handle the more complex urban road environment in China (Figure 2).
According to the results of street view image recognition precision tools, street view image recognition can accurately identify the sky in the built environment, built roads, vehicles, buildings, other important environmental factors, and statistical proportions of various elements in the image. In this study, we selected 29 built environment factors as the microclimate and thermal comfort evaluation factors for classification (Figure 3).
The street interface is the spatial basis to form a built environment of the street. In the integration of elements of the built environment of the street, the evaluation factors of the microclimate thermal comfort of the street were summarized into the horizontal interface and vertical interface according to the spatial characteristics. The sky, ground, motor vehicles, and non-motor vehicles were attached to the road of the horizontal interface factors. The vertical interface factors were buildings and plants. In addition, street facilities such as commercial facilities, living facilities, and transportation facilities might affect the street thermal comfort (Table 1).

2.1.2. Quantification of the Built Environment

The outdoor thermal comfort is affected by climatic, physiological, psychological, social, and cultural factors. Physical climatic factors are important but not the only determinant. Various factors [23] should be considered to create a comfortable microclimate environment. Quantitative models commonly use climate factors such as the air temperature, relative humidity, wind speed, and solar radiation [24] but do not consider the built environment elements. The green visibility, space, space enclosure, and thermal comfort have relevance; therefore, in this study, we explored their relationship with the thermal comfort for different road grades and effective elements. Furthermore, we investigated their correlations with thermal comfort by calculating the quantitative indices of seven built environments.
(1)
Green visibility
The “green visibility” concept was proposed by Japanese scholar Aoki Yang based on visual psychology in 1987, which refers to the proportion of green in people’s visual field. According to this theory, when the green visibility is 25%, the vision is most comfortable. The importance of green visibility to the physical and mental health of urban residents has been successively confirmed by experimental psychology, environmental psychology, and human engineering and has been applied [25] in landscape planning and design.
(2)
Sky visibility
The sky visibility index is the proportion of the sky that is not occluded in the visual field [26]. The sky visibility index is related to spatial elements of the built environment and solar radiation; thus, it is a physical factor that affects thermal comfort. The sky visibility index is calculated as the number of sky pixels divided by the total number of pixels in the street view image.
(3)
Spatial enclosure
The enclosed space of a building is an important element in the built environment. A building can provide a comfortable environment and affect the microclimate environment [27] around the building. It is calculated by dividing the number of pixels of the buildings and walls by the total number of pixels in the street view images.
(4)
Road patency
The road patency is the degree to which road users smoothly and conveniently run on urban roads. A large road patency indicates that there are fewer vehicles on the road, a good driving state, and high emotional pleasure. Conversely, a small patency indicates a high degree of road congestion and easily causes irritation [26]. The calculation formula is 1 minus the number of motor vehicle pixels and divided by the number of motor vehicle lane pixels.
(5)
Ancillary facilities
The proportion of auxiliary facilities in the built environment, i.e., auxiliary facilities, can effectively improve the comfort of environmental users. We calculated a formula for the fence, signs, bridges, poles, screens, street lamps, and booth-like structures.
(6)
Slow traffic rate
The proportion of non-motor vehicles, people, and sidewalk images in the built environment is an important element of the built environment. Slow traffic can effectively improve the comfort of pedestrian traffic. It was calculated as the sum of the pixels of non-motor vehicles, people, and sidewalks divided by the total number of pixels of the street view image.
(7)
Road width
The road width can describe the geometric space of the driving road. When other environmental factors remain unchanged, a wider road offers more space comfort. The relative width of an urban road can be described by the proportion of road pixels in street view images. The calculation formula is the sum of the road and sidewalk pixels divided by the total number of pixels in the street view image.

2.2. ENVI-met 5.0 Thermal Comfort Simulation and Numerical Extraction

Thermal comfort simulation analysis was conducted using the urban three-dimensional microclimate dynamic simulation software ENVI-met 5.0. CFD analysis grids were established based on various information of the street space, and the model was built according to the actual conditions of the street space’s underlying surface. The thermal properties of buildings were set in accordance with national standards; the initial wind environment was set based on the dominant wind directions and high-frequency wind speeds in Beijing during winter and summer; the UTCI calculation parameters were set according to the general situation in Beijing, with a pedestrian speed of 3 km/h and clothing insulation coefficients of 0.3 clo in summer and 2.0 clo in winter [28].
Based on the meteorological data of Beijing in the summer of 2023, it was found that all districts reached their temperature peaks on July 8th. Therefore, the temperature data of this day were selected as a representative sample for subsequent research. The meteorological setting method of simple force was chosen for the study, and the complete 24 h hourly meteorological data of each district in the central urban area of Beijing on that day were manually entered. These datasets covered key meteorological parameters: temperature, relative humidity, wind speed, wind direction, and initial soil thermal and moisture conditions, ensuring the high precision and comprehensiveness of the simulation input. The simulation period was set from 6:00 a.m. to 8:00 p.m., totaling 14 h, which covered the peak period of daily urban activities and was also the most significant period for the urban heat island effect.
In this study, we applied the QGIS-platform-based geodata to the ENVI-met 5.0 plug-in to handle large-scale block modeling. In the model construction stage, the plug-in can convert geographic data into the format required by the ENVI-met 5.0 software and assign the corresponding materials. This plug-in greatly simplifies the tedious process of traditional manual modeling and reduces human errors. Meteorological data for 8 July 2023 were selected for simulation study (Figure 4).
To extract the universal thermal comfort index (UTCI) that corresponded to sampling points after simulation, we used the NetCDF file to process with the QGIS platform. Simulation results of the import of BIO-met were obtained after setting the related parameters, exporting the NetCDF file, applying QGIS in Geodata to the ENVI-met 5.0 NetCDF file plug-in processing, using the grid analysis tool for grid value sampling, and sampling the input layer to the corresponding sampling points. The corresponding UTCI value was obtained.

3. Analysis of the Coupling Relationship Between the Street Built Environment and Thermal Comfort

3.1. Thermal Comfort Simulation Analysis Results

The Chaowai Block in Beijing has a temperate continental monsoon climate, and its Köppen climate classification is Dwa. The thermal comfort simulation results of Chaowai Block showed that the overall UTCI value was 28.15–47.11 °C and that the corresponding human thermal sensation ranged from slightly warm to very hot. Specifically, the northeast side of large buildings had the lowest UTCI values (30.05–33.84 °C), and the human thermal perception was slightly warm. Areas with dense buildings or a lack of vegetation had the highest UTCI values (41.43–45.22 °C), and the human thermal perception was very hot. The central area of the main road had a higher UTCI value of 39.53–43.32 °C because of the wide road. The pedestrian areas on both sides benefited from space separation, and their UTCI values were slightly lower (35.74–41.43 °C). Due to the shade of the road trees, the UTCI value of the secondary trunk road was 33.84–39.53 °C, and the human thermal perception was warm to hot. The UTCI value of the branch road was affected by the direction and width of the street and was generally 31.94–37.63 °C. The human thermal perception was slightly warm to warm, which was a relatively comfortable environment for the summer (Figure 5).

3.2. Correlation Analysis Between Built Environment Elements and Thermal Comfort

There were 246 sampling points on the main roads. The correlation coefficients of the green visibility and road patency with the UTCI were −0.476 and −0.453, respectively, which indicates moderate correlations between them and the UTCI. The sky visibility index, spatial enclosure degree, and road width were positively correlated with the UTCI at the 0.01 level with extreme significance and correlation coefficients of 0.349, 0.436, and 0.397, respectively, i.e., medium correlation. The affiliated facilities and slow traffic rate had significance values greater than 0.05, so they had no statistically significant correlation with the UTCI (Table 2).
There were 283 sampling points on the secondary arterial roads. The green visibility, spatial enclosure degree, road patency, and slow traffic rate were negatively correlated with the UTCI: the correlations were significant at the 0.01 level, and the correlation coefficients for the green visibility, spatial enclosure degree, and slow-traffic rate were −0.366, −0.257, and −0.330, respectively. The correlation among the green visibility, slow-traffic rate, and UTCI was moderate, and the correlation between spatial enclosure and the UTCI was weak. The correlation between road patency and the UTCI was significant at the 0.05 level, the correlation coefficient was −0.146, and the correlation grade was weak. There was a positive correlation between sky visibility and the UTCI, the correlation coefficient was 0.307 at the 0.01 level, and the correlation grade was moderate. The significance values of the road width and ancillary facilities were greater than 0.05, so there was no statistically significant correlation between the road width and UTCI (Table 3).
There were 355 branch sampling points. The green visibility, road patency, road width, auxiliary facilities, and slow traffic rate were negatively correlated with the UTCI. The green visibility, road patency, road width, and auxiliary facilities showed highly significant correlations at the 0.01 level with correlation coefficients of −0.397, 0.301, −0.334, and −0.251, respectively. The correlation among the green visibility, road patency, road width, and UTCI was moderate, the correlation between auxiliary facilities and the UTCI was weak, and the slow traffic rate had a significant correlation at the 0.05 level with a correlation coefficient of −0.044, i.e., a weak correlation. There was a positive correlation between sky visibility and the UTCI: the correlation coefficient was 0.307 at the 0.01 level, i.e., a moderate correlation. The significance of the spatial enclosure was greater than 0.05, so there was no statistically significant correlation between spatial enclosure and the UTCI (Table 4).

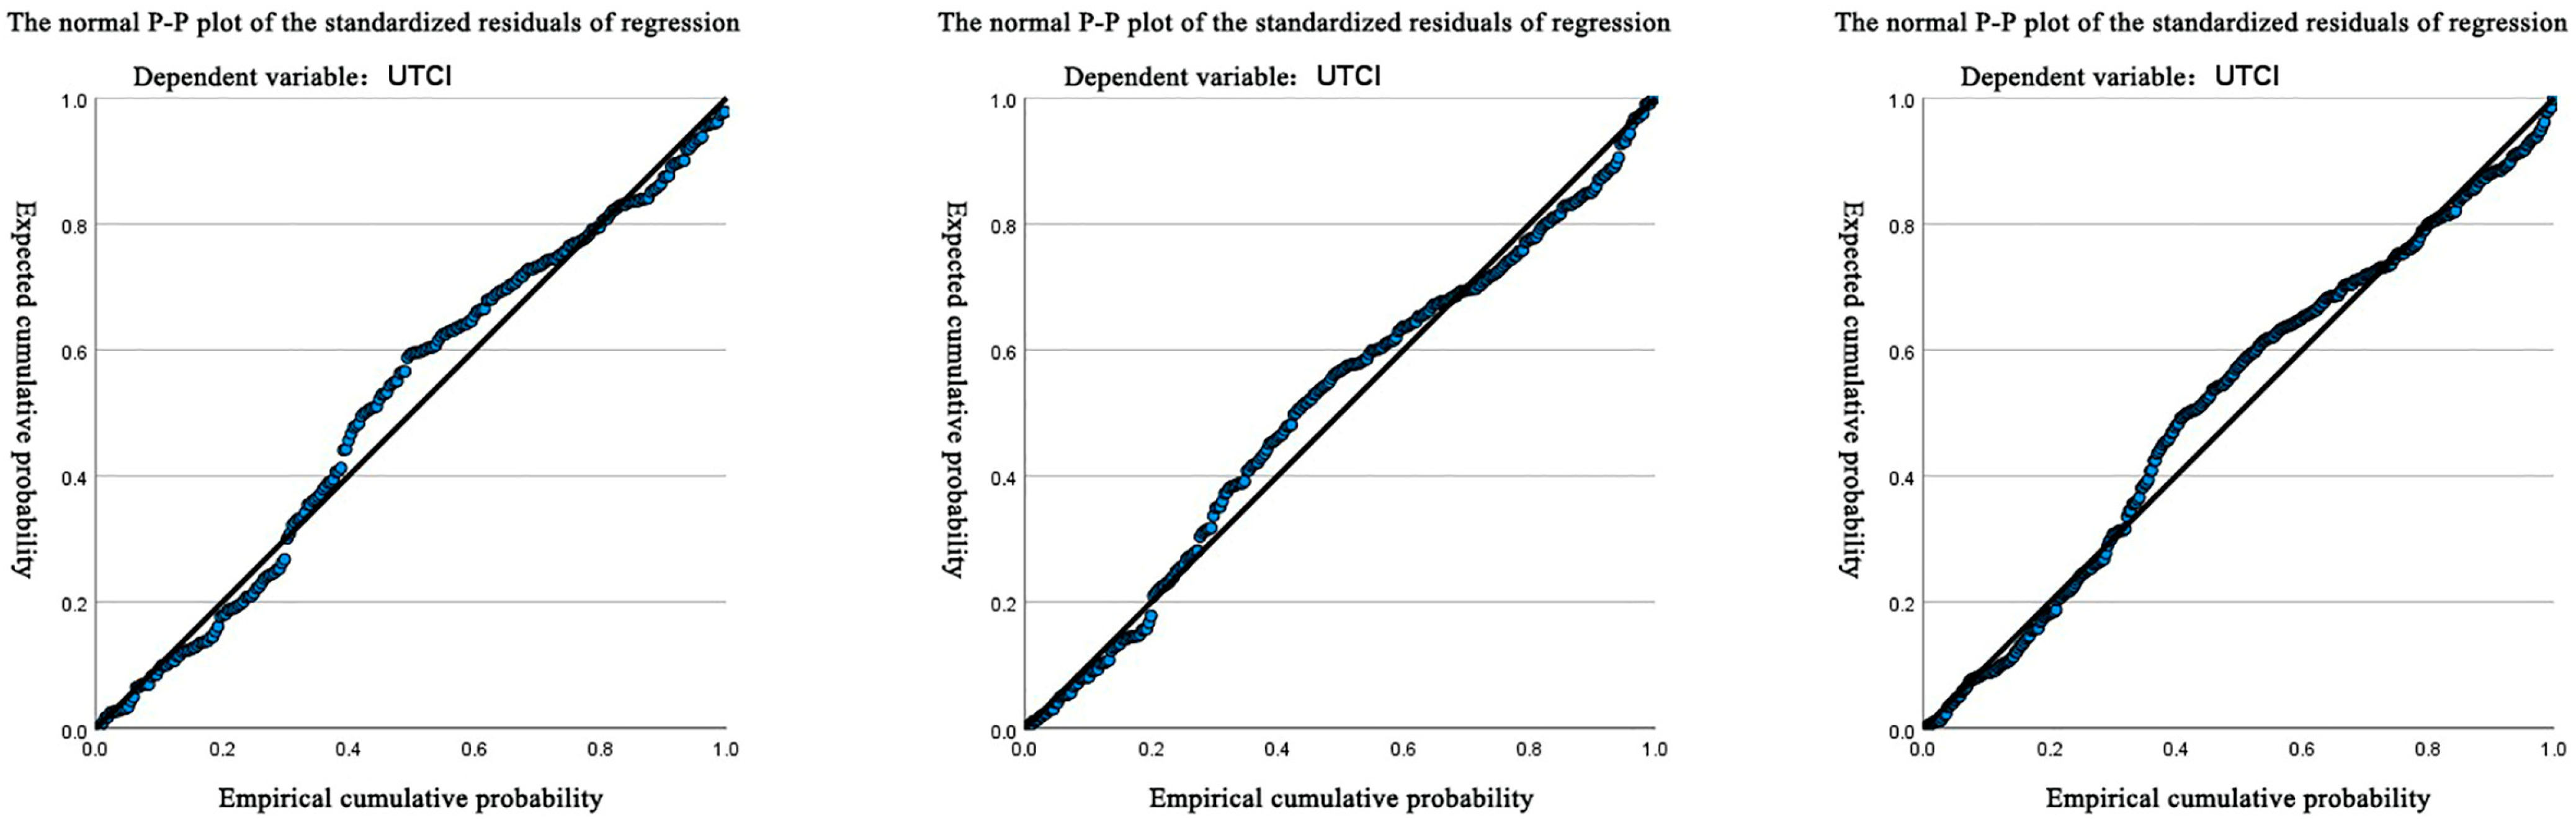
3.3. Regression Analysis of the Built Environment Elements and Thermal Comfort

The results of the stepwise regression analysis of the main roads showed that the green visibility, road patency, road width, spatial enclosure, and sky visibility significantly affected the UTCI. The green visibility and road patency were negatively correlated with the UTCI. The road width, spatial enclosure, and sky visibility were positively correlated with the UTCI. The standardized coefficients (Beta) of the variables showed that the road width significantly contributed to the explanation of the UTCI in the model (Table 5).
The stepwise regression results showed that the green visibility, sky visibility, slow traffic rate, and spatial enclosure had significant effects on the UTCI. The effects of the green visibility, slow traffic rate, and spatial enclosure degree were negatively correlated with the UTCI. There was a positive correlation between sky visibility and the UTCI. The standardized coefficients (Beta) of the respective variables showed that the green visibility had the greatest effect on the UTCI, and the spatial enclosure degree had a small but significant effect on the UTCI (Table 6).
The results of the stepwise regression of branches showed that the green visibility, road patency, road width, sky visibility, and ancillary facilities had significant effects on the UTCI. The green visibility, road patency, road width, and ancillary facilities were negatively correlated with the UTCI. The sky visibility index was positively correlated with the UTCI. In the regression model, the green visibility had the greatest effect on the UTCI, and the auxiliary facility rate had a small negative effect on the UTCI (Table 7).
The normal probability plots (P-P plots) of the standardized residuals for all levels of roads are approximately straight lines, indicating that they conform to a normal distribution and the regression model shows a linear relationship (Figure 6).
The goodness of fit, significance of the regression equation, significance of the regression coefficient, and residual value of road regression analysis results at all levels satisfied the standards. Table 3, Table 4, Table 5, Table 6 and Table 7 show the regression results obtained according to the regression analysis. Based on the above regression analysis, the regression equation between the built environment and thermal comfort of the street is obtained (Table 8).

3.4. Result Analysis

According to the results of the regression equation, the thermal comfort of different road levels is affected by various street built environment elements. Greening depends on the rate and degree of sky visibility in the distance and significantly affects the thermal comfort. With all other factors constant, for every 10% increase in greening, the UTCI value of all road levels decreased by 0.37 °C, 0.58 °C, and 0.59 °C; for every 10% increase in sky visibility, the UTCI values of all road levels increased by 0.45 °C, 0.92 °C, and 0.85 °C. The road patency and road width significantly affected the thermal comfort in the main roads and branches. When other factors remained unchanged, the UTCI values of main roads and branches decreased by 0.79 °C and 0.25 °C, respectively, for every 10% increase in road patency. However, the effect of the road width on the two grades of roads showed different trends. In the main road and branch roads, the UTCI value increased by 0.80 °C and decreased by 0.83 °C, respectively, when the road width increased by 10% and other factors were constant. The spatial enclosure degree significantly affected the thermal comfort on roads; on the main road and secondary road, the UTCI value increased by 0.54 °C and decreased by 3.3 °C, respectively, when the spatial enclosure degree increased by 10% and other factors were unchanged. The slow traffic rate significantly affected the thermal comfort in the secondary arterial road. When other factors were unchanged, the UTCI value decreased by 0.23 °C for every 1% increase in the slow traffic rate. The rate of auxiliary facilities also significantly affected the thermal comfort on the branch road. When other factors were unchanged, the UTCI value decreased by 0.57 °C for every 1% increase in the rate of auxiliary facilities.

4. Optimization Strategies for Street Built Environments to Improve Thermal Comfort

4.1. Promotion of Multi-Level Greening

Green visibility has a significant positive effect on street thermal comfort at all road levels. Plants convert energy by absorbing solar radiation and using photosynthesis and transpiration. The branches and leaves of trees can effectively block sunlight, significantly reduce the intensity of direct radiation and overall radiation on the street, and reduce the sky visibility index. Thus, they reduce the temperature of the surrounding environment and improve the thermal comfort of the street.
(1)
Enrichment of the level and collocation of greening
In the plant landscape configuration strategy of urban streets, trees have the main role in street greening because of their good shading effect and ecological function. Studies have shown that street tree species with a large canopy and dense leaves help cool the surrounding environment, and the optimal planting spacing is 6 m [29,30]. In some studies on pedestrian street spaces, the thermal acceptability and thermal comfort sensation votes are evaluated based on PET, and it is proposed that increasing tree coverage on streets with large height-to-width ratios, such as trunk roads, can reduce the physiological equivalent temperature (PET) by 0.5–8.7 °C [31].
In addition, to build a rich and ecologically balanced street greening system, scientific and reasonable collocation and combinations of trees, shrubs, and ground cover plants are recommended. For streets with abundant space resources, trees, shrubs, and grass overlay can be used to create a three-dimensional landscape in the greening separation zone. In areas with limited space such as Xiushuihe Hutong, Chaowai Market Street, and other side streets and secondary arterial roads, flower pools can be added, and shrubs and ground cover plants can be combined to improve the aesthetics and greening value of the streets.
(2)
Three-dimensional greening
Three-dimensional greening can achieve the most effective street greening effect using limited street space and improve the overall green rate of urban streets. Increasing three-dimensional greening can significantly reduce the land surface temperature. The cooling effect also [32] varies with the building scale, greening range, plant selection, and location. The scale of the special research on three-dimensional greening is relatively small, and most related studies use PET for numerical evaluation. Increasing the three-dimensional greening rate at the pedestrian level is a key factor in improving thermal comfort. Studies have shown that increasing the green surface can reduce the PET value by 0.17–1.4 °C [33]. The street three-dimensional greening strategy can start from three aspects: mining the greening potential of surrounding buildings, improving the greening of the facade of the enclosed space, and using the narrow spaces. For streets like Jinhui Road, Chaowai South Street, and Jinghua Street, which are dominated by commercial buildings and office buildings, plants with strong adaptability can be selected to build roof gardens, and plants can be planted on the outer walls for cooling. For Dongxiang Lane of Chaowai 2nd Street and Xiushuihe Hutong, which are mostly residential buildings, small vertical gardens with balconies can be built. In the secondary trunk road and branch road, the greening rate of the fences can be improved through the three-dimensional greening system, and in narrow road spaces, “flower walls”, “green walls”, or gallery greening can be used to extend the greening area.

4.2. Optimization of the Street Width and Space Configuration

According to the coupling relationship analysis of roads at all levels, the road width and road patency are directly related to the operation efficiency of traffic flow and affect the thermal comfort of the street. Some studies have found that increasing the proportion of streets by 80% and 90% increases the UTCI value by 6 °C and 12 °C [34], respectively, which is similar to the conclusions of this study.
For main roads with high traffic flow, for example, Chaoyangmenwai Street, Chaoyang North Road, Chaoyangmen South Street, Jianguomen North Street, the auxiliary road of the Middle Section of East Third Ring Road, etc., it is necessary to ensure the traffic efficiency of motor vehicles while reducing excessive spacious or unnecessary lanes. For the branch roads with high pedestrian flow and low traffic flow, for example, Nanyingfang Hutong, Shenlu Street, Fangcaodi North Lane, Xiushui East Street, etc., the space of “people–vehicle sharing” can be used to provide more activity space for pedestrians. By reasonably adjusting the width and number of lanes of motor vehicles, more street space can be used to construct pedestrian paths, green belts, and public spaces.

4.3. Optimization of the Street Layout to Ensure Slow Traffic

The regression equation shows that the slow traffic rate has important effects on the thermal comfort of the street on the secondary arterial road. As the main carrier that connects urban main roads and residential areas, slow traffic planning has become increasingly important in the design of urban secondary trunk roads. Reasonable extensions to urban main roads and branches are important guarantees to satisfy the travel needs of citizens. Studies have shown that the characteristics of the UTCI can explain the variation of pedestrian travel modes of up to 4% in densely populated cities. In high-density communities, when the thermal comfort is good, pedestrians are more inclined to take the initiative to travel by walking or cycling. When the thermal comfort is poor, pedestrians are more likely to select public transportation to replace active travel instead of vehicle travel [35]. Optimizing the street space to prioritize slow traffic can help alleviate traffic congestion, reduce exhaust emissions, and improve the thermal comfort of the streets.
(1)
Parking layout optimization
In urban streets, motor vehicle parking has important effects on pedestrian safety and slow traffic rates. The solutions include the following: setting parking spaces and green separation zones outside non-motor vehicle lanes to ensure the passage of non-motor vehicles (these measures can be implemented on secondary roads such as Chaowai Market Street and South Street of the Ministry of Foreign Affairs); reasonably planning bus stops according to the traffic flow and road width; prioritizing the main road to non-isolated stations; flexibly setting up secondary roads and branch roads; and using bays or compact stops when necessary to reduce the impact on the non-motor lane and ensure isolation spaces.
(2)
Slow-traffic connections
The addition of microclimate-oriented measures (increasing greenery and shading conditions) can effectively increase the proportion of pedestrians who choose slow-traffic travel to improve the overall thermal environment quality of the streets. The traditional red line should be abandoned, and the inner and outer spaces of the red line should be integrated. For Jitan Park and the surrounding roads, the possibility of moderate opening to the public should be considered, and parks should be closely connected with the urban slow traffic paths to form a wide-coverage, convenient, and comfortable slow traffic network.

4.4. Optimization of the Architectural Space Form

The regression analysis results showed that the spatial enclosure degree had a significant positive effect on the thermal comfort of the secondary road but a negative effect on the thermal comfort of the main road. This phenomenon indicates that, in a street canyon, although structures such as buildings and walls can effectively increase the shadow area and suppress the increase in ground temperature, these structures may hinder wind circulation and adversely affect thermal comfort if the street height-to-width ratio is large. Therefore, when planning and designing street spaces, it is necessary to weigh the balance between spatial enclosure and wind circulation.
(1)
Optimization of the architectural form
Wind speed exponentially changes with the increase in building height, so the thermal comfort of a specific area can be enhanced by optimizing the airflow. Studies have shown that the use of a horizontal building retreat (arcade design) on low-rise streets and a vertical building retreat (building walls that retract from the street) on high-rise streets can reduce the PET value by 2.1 °C and 0.7 °C on average, respectively, which effectively improves the street thermal comfort [36]. In architectural designs, by reasonably setting the openings or gaps in the horizontal or vertical dimensions and introducing building overhead layers, one can improve the building porosity, air permeability of the ground layer, and formation of air ducts to improve the ventilation conditions of the pedestrian activity area and directly reduce the temperature near the ground [37].
(2)
Optimization of the space boundary
Compared with the shadows cast by buildings, the shading effect of walls is relatively limited. Overreliance on walls for spatial enclosure often causes poor ventilation performance, which adversely affects the thermal comfort of the streets. Research shows that the urban structure in the surrounding areas of high-rise buildings has a significant impact on surface temperature in different cities [38]. To improve the space condition, enclosed space sheltered by walls such as Xiushui East Street and Ritán East Second Street can be broken, and the permeability can be improved. Receding walls, green belts, or transparent boundary elements such as hedges and hollow wall decorations can optimize the layout and promote air circulation.

4.5. Optimization of Ancillary Facilities

In the regression model of branch roads, the rate of road auxiliary facilities showed a significant positive effect, but the regression coefficient was relatively high, which indicates that the auxiliary facilities of branch roads are commonly in an imperfect state. Commercial facilities and transportation facilities are mainly managed and maintained by businesses and government agencies, which can be improved and integrated on the original basis. Considering the limitations of branch space resources, on side streets such as Xiushuihe Hutong and Chaowai Dadao, the design methods of “multi-box integration” and “multi-pole integration” should be adopted to optimize the layout of facilities. The disorderly distribution of infrastructure in the branch space should be reduced to avoid a chaotic layout and improve the overall use efficiency of road space. Potential spaces such as road corners, green belt edges, and community gardens should be used to arrange living facilities.

5. Conclusions

This study used deep learning with street view images to quantitatively analyze the elements of the built environment of Chaowai Block in Beijing. The built environment of the streets was analyzed from seven aspects: green visibility, sky visibility degree, spatial enclosure degree, road patency degree, auxiliary facility rate, slow traffic rate, and road width. The ENVI-met 5.0 simulation software and QGIS platform were used to simulate and extract the thermal comfort of the entire block. A regression model between the street built environment and thermal comfort was constructed to analyze their quantitative coupling relationship, based on which an optimization strategy was proposed. Specific optimization methods were proposed from the aspects of greening, street space form, slow traffic, building space form, and ancillary facilities.
By analyzing the relationship between built environment factors such as green view ratio and sky visibility and thermal comfort, and using Pearson correlation analysis and stepwise linear regression analysis, regression models of thermal comfort and built environment factors for different grades of roads (arterial roads, secondary arterial roads, and branch roads) were constructed. The results show that the thermal comfort of different grades of roads is affected by multiple built environment factors, and the influencing factors vary. For example, green view ratio and sky visibility have a significant impact on thermal comfort on all grades of roads, while road openness, road width, spatial enclosure, non-motorized traffic rate, and ancillary facility rate have different influences in different grades of roads.
However, there may be large differences in street thermal comfort in different regional environments. It is necessary to analyze different regions and types of blocks in the future. The validity of the conclusions was verified, and optimization measures for street built environments in different regional environments were proposed. In addition, dynamic research on the time scale needs to be strengthened. Currently, most studies are based on data from specific time periods for static analysis, making it difficult to comprehensively reflect the long-term change patterns of microclimate and thermal comfort, as well as the influence of factors such as seasons and day–night alternation. In the future, long-term and continuous tracking studies should be conducted on the microclimate environment of urban streets to capture the dynamic changes in microclimate parameters and thermal comfort, providing strong support for the dynamic management and refined transformation of cities.

Author Contributions

Conceptualization, X.Y.; Methodology, X.Y.; Software, H.L.; Validation, X.M.; Formal analysis, H.L.; Investigation, H.L. and B.Z.; Resources, X.M.; Data curation, B.Z.; Writing—original draft, X.Y.; Writing—review & editing, H.L.; Visualization, X.M.; Supervision, X.Y.; Project administration, X.M. and B.Z. All authors have read and agreed to the published version of the manuscript.

Funding

This research was funded by National Natural Science Foundation of China (42171337) and Beijing Natural Science Foundation (8232030).

Data Availability Statement

Data is contained within the article.

Conflicts of Interest

The authors declare no conflict of interest.

References

  1. Liu, B.Y.; Mei, Y.; Kuang, W. Experimental research on correlation between microclimate element and human behavior and perception of residential landscape space in Shanghai. Chin. Landsc. Archit. 2016, 32, 5–9. [Google Scholar]
  2. Finaeva, O. Role of green spaces in favorable microclimate creating in urban environment (exemplified by Italian cities). IOP Conf. Ser. Mater. Sci. Eng. 2017, 262, 012141. [Google Scholar] [CrossRef]
  3. Suminah, N.; Sulistyantara, B.; Budiarti, T. Analysis of green space characteristic effect to the comfort microclimate in the simple flats in Jakarta. IOP Conf. Ser. Earth Environ. Sci. 2017, 91, 012017. [Google Scholar] [CrossRef]
  4. Yang, J.; Li, H.; Fang, Z.; Li, Y.; Lu, F.; Guo, T.; Zhang, X.; Lin, C.; Lu, J. Study on thermal and physiological responses during summer while moving between academic buildings under different walking conditions. Case Stud. Therm. Eng. 2025, 66, 105809. [Google Scholar] [CrossRef]
  5. Yang, J.; Fan, Y.; Wu, Z.; Luo, X.; Gao, N.; Fang, Z.; Wu, P. Investigation of the outdoor workers’ thermal comfort and improving technology. Energy Build. 2025, 331, 115332. [Google Scholar] [CrossRef]
  6. Nouri, A.S.; Costa, J.; Santamouris, M.; Matzarakis, A. Approaches to outdoor thermal comfort thresholds through public space design: A review. Atmosphere 2018, 9, 108. [Google Scholar] [CrossRef]
  7. Yang, X.; Li, S.; Zhang, Q.; He, S. Thermal Comfort Assessment of the Beijing Historical Town Blocks: Analysis of Indices and Applications. Sci. Program. 2022, 2022, 2381584. [Google Scholar] [CrossRef]
  8. Kim, Y.; Yu, S.; Li, D.; Gatson, S.N.; Brown, R.D. Linking landscape spatial heterogeneity to urban heat island and outdoor human thermal comfort in Tokyo: Application of the outdoor thermal comfort index. Sustain. Cities Soc. 2022, 87, 104262. [Google Scholar] [CrossRef]
  9. Cárdenas-Jirón, L.A.; Graw, K.; Gangwisch, M.; Matzarakis, A. Influence of street configuration on human thermal comfort and benefits for climate-sensitive urban planning in Santiago de Chile. Urban Clim. 2023, 47, 101361. [Google Scholar] [CrossRef]
  10. Deevi, B.; Chundeli, F.A. Quantitative outdoor thermal comfort assessment of street: A case in a warm and humid climate of India. Urban Clim. 2020, 34, 100718. [Google Scholar] [CrossRef]
  11. Zhang, X.; Nie, Q.; Liu, J. Research on urban geothermal comfort improvement strategy based on ENVI-met. Ecol. Sci. 2021, 40, 144–155. [Google Scholar]
  12. Lu, X.; Yang, X. Research on Urban Renewal Methods Based on ENVI-met Software Microclimate Simulation and Thermal Comfort Experience: A Case Study of Bei Xin’an Area in Shijingshan in Beijing. Urban Dev. Stud. 2018, 25, 147–152. [Google Scholar]
  13. Zhu, S.; Gao, M.; Chen, T.; Zhang, G. Simulation and Analysis of Urban Near-Surface Air Temperature Based on ENVI-met Model: A Case Study in Some Areas of Nanjing. Clim. Environ. Res. 2017, 22, 499–507. [Google Scholar]
  14. Peng, X. study on microclimate adaptation of street space based on dynamic thermal comfort. Build. Sci. 2023, 39, 221–232. [Google Scholar]
  15. Xiao, H.; Bi, X.; Liu, Y.; Wang, M.; Wu, C.; Li, J. Summer Thermal Comfort and Visitor Thermal Preference of Urban Open Space in Shanghai. Landsc. Archit. Acad. J. 2023, 40, 123–131. [Google Scholar]
  16. Zheng, J.; Ou, Z.; Xiang, Y.; Li, J.; Zheng, B. How can street interface morphology effect pedestrian thermal comfort: A case study of the old town of Changsha, China. Urban Clim. 2025, 60, 102341. [Google Scholar] [CrossRef]
  17. Guo, F.; Luo, M.; Zhang, C.; Cai, J.; Zhang, X.; Zhang, H.; Dong, J. The Mechanism of Street Spatial Form on Thermal Comfort from Urban Morphology and Human-Centered Perspectives: A Study Based on Multi-Source Data. Buildings 2024, 14, 3253. [Google Scholar] [CrossRef]
  18. Harrou, F.; Zeroual, A.; Hittawe, M.M.; Sun, Y. Chapter 2—Road Traffic Modeling, Road Traffic Modeling and Management; Elsevier: Amsterdam, The Netherlands, 2022; pp. 15–63. [Google Scholar]
  19. Harrou, F.; Zeroual, A.; Hittawe, M.M.; Sun, Y. Chapter 5—Traffic Congestion Detection: Data-Based Techniques, Road Traffic Modeling and Management; Elsevier: Amsterdam, The Netherlands, 2022; pp. 141–195. [Google Scholar]
  20. Yao, Y.; Liang, Z.; Yuan, Z.; Liu, P.; Bie, Y.; Zhang, J.; Wang, R.; Wang, J.; Guan, Q. A human-machine adversarial scoring framework for urban perception assessment using street-view images. Int. J. Geogr. Inf. Sci. 2019, 33, 2363–2384. [Google Scholar] [CrossRef]
  21. Zhou, B.; Zhao, H.; Puig, X.; Fidler, S.; Barriuso, A.; Torralba, A. Scene Parsing through ADE20K Dataset. In Proceedings of the 30th IEEE Conference on Computer Vision and Pattern Recognition (CVPR 2017), Honolulu, HI, USA, 22–25 July 2017; pp. 5122–5130. [Google Scholar]
  22. Zhou, B.; Zhao, H.; Puig, X.; Xiao, T.; Fidler, S.; Barriuso, A.; Torralba, A. Semantic Understanding of Scenes Through the ADE20K Dataset. Int. J. Comput. Vis. 2019, 127, 302–321. [Google Scholar] [CrossRef]
  23. Hu, X.; Li, B.; Chen, H. Research Review and Evaluation Framework of Outdoor Thermal Comfort. Build. Sci. 2020, 36, 53–61. [Google Scholar]
  24. Li, J. Evaluation and Optimization of Thermal Comfort of Urban Greenways—A Case Study of Greenways in Three Hills and Five Parks in Beijing. Master’s Thesis, Beijing University of Civil Engineering and Architecture, Beijing, China, 2022. [Google Scholar]
  25. Tian, M. Research on the Relationship Between Green Model and Green Looking Ratio—Taking Chongqing as an Example. Master’s Thesis, Southwest University, Chongqing, China, 2011. [Google Scholar]
  26. Yang, C.; Xu, F.; Jiang, L.; Wang, R.; Yin, L.; Zhao, M.; Zhang, X. Approach to Quantify Spatial Comfort of Urban Roads based on Street View Images. J. Inf. Sci. 2021, 23, 785–801. [Google Scholar]
  27. Zhang, F. Research on the Green Space Design of Beijing Winter Park Based on the Analysis of Human Comfort—Take the Olympic Forest Park as an Example. Master’s Thesis, Beijing University of Civil Engineering and Architecture, Beijing, China, 2020. [Google Scholar]
  28. Lai, D. Research on Outdoor Thermal Comfort in Northern China. Master’s Thesis, Tianjin University, Tianjin, China, 2012. [Google Scholar]
  29. Chen, X.; Han, M.; He, J.; Ma, H.; Han, M.; Liu, Y.; Wu, X. Integrated effect of aspect ratio and tree spacing on pedestrian thermal comfort of street canyon. Int. J. Biometeorol. 2024, 68, 2115–2131. [Google Scholar] [CrossRef]
  30. Jayasinghe, S.; Jayasooriya, V.; Dassanayake, S.M.; Muthukumaran, S. Effects of street tree configuration and placement on roadside thermal environment within a tropical urban canyon. Int. J. Biometeorol. 2024, 68, 1133–1142. [Google Scholar] [CrossRef]
  31. Ma, X.; Fukuda, H.; Zhou, D.; Wang, M. Study on outdoor thermal comfort of the commercial pedestrian block in hot-summer and cold-winter region of southern China-a case study of The Taizhou Old Block. Tour. Manag. 2019, 75, 186–205. [Google Scholar] [CrossRef]
  32. Wong, N.H.; Tan, C.L.; Kolokotsa, D.D.; Takebayashi, H. Greenery as a mitigation and adaptation strategy to urban heat. Nat. Rev. Earth Environ. 2021, 2, 166–181. [Google Scholar] [CrossRef]
  33. Cui, D.; Zhang, Y.; Li, X.; Yuan, L.; Mak, C.M.; Kwok, K. Effects of different vertical façade greenery systems on pedestrian thermal comfort in deep street canyons. Urban For. Urban Green. 2022, 72, 127582. [Google Scholar] [CrossRef]
  34. Nice, K.A.; Nazarian, N.; Lipson, M.J.; Hart, M.A.; Seneviratne, S.; Thompson, J.; Naserikia, M.; Godic, B.; Stevenson, M. Isolating the impacts of urban form and fabric from geography on urban heat and human thermal comfort. Build. Environ. 2022, 224, 109502. [Google Scholar] [CrossRef]
  35. Yang, Y.; Wang, D.; Dogan, T. How the urban microclimate and outdoor thermal comfort can affect intra-city mobility patterns: Evidence from New York City. In Proceedings of the 2022 Annual Modeling and Simulation Conference (ANNSIM), San Diego, CA, USA, 18–20 July 2022; pp. 523–536. [Google Scholar]
  36. Li, Z.; Zhang, H.; Juan, Y.-H.; Wen, C.-Y.; Yang, A.-S. Effects of building setback on thermal comfort and air quality in the street canyon. Build. Environ. 2022, 208, 108627. [Google Scholar] [CrossRef]
  37. van der Velde, R.; de Wit, S.; Pouderoijen, M. Cool Tree Architecture: A Descriptive Framework for a Tree Architecture Typology to Temper Urban Microclimates. Landsc. Archit. Front. 2023, 11, 30–42. [Google Scholar] [CrossRef]
  38. Ünsal, Ö.; Aksak, P.; Kartum, Ş. Investigation of Surface Urban Heat Island by High-Rise Buildings: Istanbul Levent Region. Pap. Appl. Geogr. 2024, 10, 376–392. [Google Scholar] [CrossRef]
Figure 1. Sampling point map of the street view image (self-drawn).
Buildings 15 01449 g001
Figure 2. Street view image semantic segmentation process (self-drawn).
Buildings 15 01449 g002
Figure 3. Schematic of the street view image recognition results (self-drawn).
Buildings 15 01449 g003
Figure 4. Simulation model of Chaowai Block (self-drawn).
Buildings 15 01449 g004
Figure 5. UTCI distribution map of Chaowai Block at 2 p.m. on July 8 (self-drawn).
Buildings 15 01449 g005
Figure 6. P-P Plot for Normality Test of Roads at All Levels (Self-drawn).
Buildings 15 01449 g006
Table 1. Integrated table of built environment elements.
Evaluation Factors of the Built EnvironmentElements of the Built EnvironmentLabels
Horizontal interfaceSkySky
GroundRoad, ground, and sidewalk
Motor vehiclesCars, buses, trucks, vans, and small locomotives
Non-motor vehiclesPedestrians and bicycles
Vertical interfaceConstructionBuildings, houses, walls, and fences
PlantsTrees, grass, flowers, and other plants
Street furnitureCommercial amenitiesSigns, screens, and placards
AmenitiesPoles, seats, trash cans, and streetlights
Transportation facilitiesBridges, railings, and traffic lights
Table 2. Statistical results of the correlation analysis of the main roads.
UTCIPearson CorrelationSignificance (Two-Tailed)Number of Cases
Green visibility−476 **0.000246
Sky visibility349 **0.000246
Spatial closeness436 **0.000246
Road smoothness−453 **0.000246
Road width397 **0.000246
Ancillary facility rate0.0030.958246
Slow traffic rate−0.0660.306246
** The correlation is significant at the 0.01 level (two-tailed).
Table 3. Statistical results of the arterial roads correlation analysis.
UTCIPearson CorrelationSignificance (Two-Tailed)Number of Cases
Green rate of view−366 **0.000283
Sky visibility307 **0.000283
Spatial closeness−257 **0.000283
Road smoothness−146 *0.140283
Road width−0.0470.435283
Ancillary facility rate0.0160.789283
Slow traffic rate−330 **0.000283
** The correlation is significant at the 0.01 level (two-tailed). * The correlation is significant at the 0.05 level (two-tailed).
Table 4. Statistical result of the branches correlation analysis.
UTCIPearson CorrelationSignificance (Two-Tailed)Number of Cases
Green visibility−397 **0.000355
Sky visibility307 **0.000355
Spatial closeness−0.0590.266355
Road patency−301 **0.000355
Road width−334 **0.000355
Ancillary facility rate−251 **0.000355
Slow traffic rate−119 *0.025355
** The correlation is significant at the 0.01 level (two-tailed). * The correlation is significant at the 0.05 level (two-tailed).
Table 5. Statistical results of the regression analyses on trunk roads.
ModelUnstandardized CoefficientsStandardized CoefficientstSaliencyRelevanceCollinearity Statistics
BStandard ErrorBetaOrder ZeroPartialPartToleranceVIF
1(constant)41.2250.285 144.8190.000
Green visibility−9.9621.178−0.476−8.4610.000−0.476−0.476−0.4761.0001.000
2(constant)48.1691.003 48.0210.000
Green visibility−8.4391.093−0.403−7.7210.000−0.476−0.444−0.3960.9621.039
Road patency−8.4491.179−0.374−7.1660.000−0.453−0.418−0.3670.9621.039
3(constant)45.3901.158 39.2060.000
Green visibility−6.0981.182−0.292−5.1570.000−0.476−0.315−0.2550.7651.307
Road patency−8.6321.138−0.383−7.5840.000−0.453−0.438−0.3750.9611.041
Road width9.6522.2070.2434.3720.0000.3970.2710.2160.7931.262
4(constant)44.0081.262 34.8670.000
Green visibility−5.0581.236−0.242−4.0940.000−0.476−0.255−0.2000.6841.461
Road patency−7.9111.159−0.351−6.8280.000−0.453−0.403−0.3340.9061.104
Road width8.5632.2220.2153.8540.0000.3970.2410.1880.7641.308
Space closeness5.1461.9840.1492.5940.0100.4360.1650.1270.7221.385
5(constant)42.8701.357 31.5840.000
Green visibility−3.7381.368−0.179−2.7330.007−0.476−0.174−0.1330.5501.819
Road patency−7.8791.150−0.349−6.8520.000−0.453−0.404−0.3320.9051.104
Road width7.9962.2200.2013.6010.0000.3970.2260.1750.7541.327
Space closeness5.4491.9730.1582.7610.0060.4360.1750.1340.7181.392
Degree of sky presentation4.4532.0470.1252.1750.0310.3490.1390.1050.7111.406
Dependent variable: UTCI.
Table 6. Statistical results of the regression analysis of arterial roads.
ModelUnstandardized CoefficientsStandardized CoefficientstSaliencyRelevanceCollinearity Statistics
BStandard ErrorBetaOrder ZeroPartialPartToleranceVIF
1(constant)41.0930.274 149.9950.000
Green rate of view−7.0621.072−0.366−6.5850.000−0.366−0.366−0.3661.0001.000
2(constant)39.4530.395 99.8020.000
Green visibility−6.8141.021−0.353−6.6720.000−0.366−0.370−0.3520.9981.002
Sky visibility11.3152.0510.2925.5180.0000.3070.3130.2910.9981.002
3(constant)40.3420.423 95.3260.000
Green visibility−6.0420.996−0.313−6.0640.000−0.366−0.341−0.3080.9721.029
Sky visibility10.3301.9850.2665.2040.0000.3070.2970.2650.9871.013
Slow traffic rate−25.2545.258−0.249−4.8030.000−0.330−0.276−0.2440.9621.039
4(constant)41.1320.504 81.6440.000
Green visibility−5.8420.987−0.302−5.9210.000−0.366−0.335−0.2970.9671.034
Sky visibility9.1632.0040.2364.5720.0000.3070.2640.2300.9451.058
Slow traffic rate−23.8335.219−0.235−4.5670.000−0.330−0.264−0.2290.9531.049
Spatial enclosure−3.2821.167−0.146−2.8120.005−0.257−0.166−0.1410.9361.069
Dependent variable: UTCI.
Table 7. Statistical results of the branch regression analysis.
ModelUnstandardized CoefficientsStandardized CoefficientstSaliencyRelevanceCollinearity Statistics
BStandard ErrorBetaOrder ZeroPartialPartToleranceVIF
1(constant)40.6890.257 158.3980.000
Green rate of view−8.4561.041−0.397−8.1270.000−0.397−0.397−0.3971.0001.000
2(constant)43.4340.528 82.1980.000
Green visibility−8.0520.997−0.378−8.0770.000−0.397−0.395−0.3770.9951.005
Road patency−4.0360.688−0.275−5.8670.000−0.301−0.298−0.2740.9951.005
3(constant)44.2280.549 80.5520.000
Green visibility−7.4050.986−0.348−7.5130.000−0.397−0.372−0.3430.9711.030
Road patency−3.0680.710−0.209−4.3230.000−0.301−0.225−0.1970.8921.121
Road width−8.2681.951−0.207−4.2380.000−0.334−0.221−0.1930.8711.148
4(constant)42.8700.627 68.3510.000
Green visibility−5.9941.021−0.281−5.8730.000−0.397−0.300−0.2620.8651.156
Road patency−2.9460.694−0.200−4.2430.000−0.301−0.221−0.1890.8911.123
Road width−8.6171.908−0.216−4.5160.000−0.334−0.235−0.2010.8691.150
Sky visibility9.0612.1670.1984.1810.0000.3070.2180.1860.8881.126
5(constant)43.0400.624 68.9570.000
Green visibility−5.8601.012−0.275−5.7910.000−0.397−0.296−0.2560.8631.158
Road patency−2.5570.702−0.174−3.6450.000−0.301−0.192−0.1610.8561.169
Width of the road−8.2581.894−0.207−4.3600.000−0.334−0.227−0.1920.8651.156
Sky visibility8.5242.1550.1863.9560.0000.3070.2070.1750.8811.135
Ancillary amenity rate−57.23720.471−0.128−2.7960.005−0.251−0.148−0.1230.9251.081
Dependent variable: UTCI.
Table 8. Regression equations for the built environment and thermal comfort of the streets.
RoadsInfluencing FactorsRegression Equation
Main roadGreen visibility
Road patency
Road width
Space closeness
Degree of sky presentation
Y = 3.738 − 7.879 ** and green rate road unobstructed degree of road broad + 5.449 + 7.996 ** spatial enclosure degree + 4.453 + 42.870 * the sky
Secondary main roadGreen visibility
Sky visibility
Slow traffic rate
Spatial enclosure
Y = −5.842 * green visibility + 9.163 * sky visibility degree − 23.833 * slow traffic rate − 3.282 * spatial enclosure degree + 41.132
Branch roadGreen visibility
Road patency
Road width
Sky visibility
Ancillary amenity rate
Y = −5.860 * green visibility − 2.557 * road patency − 8.258 * road width + 8.524 * sky visibility − 57.237 * ancillary facility rate + 43.040
** The correlation is significant at the 0.01 level (two-tailed). * The correlation is significant at the 0.05 level (two-tailed).
Disclaimer/Publisher’s Note: The statements, opinions and data contained in all publications are solely those of the individual author(s) and contributor(s) and not of MDPI and/or the editor(s). MDPI and/or the editor(s) disclaim responsibility for any injury to people or property resulting from any ideas, methods, instructions or products referred to in the content.

