Abstract
The outdoor climate is expected to undergo significant and extreme changes. These changes may lead to increased building requirements depending on their location. This is critical, as human beings tend to spend a large part of their time inside buildings. Accordingly, it is crucial to take future conditions into account to ensure an adequate indoor climate, simultaneously meeting the current drive for decarbonization of the built environment. One avenue is opting for thermally efficient building products and technologies with a lower carbon footprint to guarantee a comfortable indoor climate while minimizing energy consumption. This study focuses on the Northeast region of Brazil, specifically its nine states, given the usage of specific passive thermal strategies in new buildings that have high compensatory energy consumption. This is achieved through developing computational thermal models of a housing unit in a multi-family building, commonly constructed in several cities in this region. This thermal model was employed to analyze indoor thermal comfort, energy consumption, and carbon footprint. To account for future climate projections, the analysis includes scenarios based on Representative Concentration Pathways 4.5 and 8.5. The efficiency of certain sustainable passive rehabilitation is demonstrated in this region, highlighting the importance of adopting passive and efficient thermal measures appropriate to the region’s climate.
1. Introduction
1.1. Background
The climate is expected to undergo significant changes, which will be more substantial at the end of the century and dependent on its location on the globe [1]. Eurostat’s data indicated that from 1979 to 2022, the cooling degree days have increased fourfold. However, the heating degree days decreased by 19% [2]. These changes will most probably impose location-dependent building design requirements. For instance, the expected increase in air temperature and frequency and magnitude of heat waves will result in an increase in overheating inside buildings [3]. This overheating increase will cause discomfort and harm to the occupants’ health or increased air conditioning energy consumption unless buildings are properly prepared to adapt to these future conditions. Consequently, greenhouse gas (GHG) emissions are emitted from the continuous power generation using fossil fuels for active cooling systems [4]. Silva et al. [5] indicated that the building age significantly influences the demand for cooling loads. This is due to not only the degrading building construction properties over time, including air tightness and thermal insulation [5], but also because the buildings were built complying with a lower level of requirements compared to current requirements.
Residential and commercial buildings’ energy consumption accounts for 20.1% of the global consumed energy [6]. This is a consequence of the significant amount of time spent by human beings inside buildings [7]. This forces an adequate indoor climate to be a critical factor that must account for the building’s location, as well as its potential future conditions. Additionally, it is vital to meet the current built environment decarbonization drive, opting for solutions with a lower carbon footprint [8]. The indoor environmental conditions are critical to enhance occupants’ comfort and well-being [4], highlighting the importance of the buildings’ energy efficiency. Subsequently, 16 to 50% of the energy is consumed from the adjustment of indoor climatic factors by the occupants [4]. Indoor comfort is compromised without the inclusion of future climatic changes because of the increased heat gains through the envelope. Accordingly, the implementation of passive strategies using future dynamic climatic conditions instead of the static conditions has become crucial [9].
Less than 10% of the European buildings are air-conditioned [10] with no consideration of future climate change projections. Consequently, significant pressure is exerted on natural resources to accommodate the hot–dry climates’ cooling needs for attaining the occupants’ comfort [11]. Despite the availability of variant passive cooling strategies (PCSs) to be employed on buildings in hot climates, active air-conditioning usage is prioritized [10]. Accordingly, for the achievement of adequate indoor comfort and optimum operating energy savings, more insulation products and mechanical technologies are employed, increasing the embodied carbon emissions [12]. For these emissions’ reductions, one of the adopted approaches is the use of bio-based insulation products. This can be achieved through, for example, the usage of recycled organic materials including coconut fiber, pine wood chips, shredded pine wood, pine bark, peat moss [13], and wood wool, in addition to bio-based acoustic insulating products like the ones based on Arundo donax [14].
1.2. Overview of Previous Studies
For limiting the effects of temperature increase in Brazil, mitigation strategies should be employed to ensure buildings’ energy efficiency [15]. Accordingly, passive strategies are implemented and assessed through energy simulations for energy efficiency and building performance evaluation [16]. For the PCS’s implementation, it involves the design approach, building envelope, and cooling/heating systems. Regarding the design approach, it includes orientation, roof shapes, courtyards, window-to-ground ratio, and height-to-depth ratio. For the building envelope, external and internal walls, including external wall coatings, and roof properties, shading devices, window-to-wall ratio, single- and double-glazing types, and cool roofs [10].
The cool roofs strategy is employed in hot–dry climates [10]. Dabaieh et al. [11] have studied the cool roofs approach for an Egyptian residential building for cooling energy consumption reduction. This is achieved through simulating 37 roof design solutions, incorporating the roof shape and materials as variables. The optimum roof shape is the vaulted roof, with indoor temperature reaching 31 °C, followed by the domed and the flat roofs. The materials included are thermal insulation, air gap, high albedo paint, and water pond [11]. Cool roofs are a cost-efficient passive approach for indoor thermal comfort enhancement and heat gain reduction. However, for example, in Egypt, it is not reinforced by policies to include insulation for initial construction and building retrofitting [11].
As per Hu et al. [10], several PCSs have been reviewed to examine their effectiveness on (1) thermal indoor comfort, (2) indoor temperature decrease, (3) cooling load reduction in hot climates, and (4) thermal comfort hours extension. Thermal inertia and thermal resistance are critical properties of the envelope’s external walls affecting the thermal indoor comfort. Thermal inertia represents the building components’ solar heat absorption ability without their indoor temperature increase, dependent on the material and insulation types. For thermal resistance, it depends on the outer paint or cladding reflectivity and the insulation type on resisting the heat flow [10].
Harkouss et al. [17] have simulated 25 different climates for the cooling and heating loads reduction, considering the occupants’ adaptive behavior through the inclusion of natural ventilation and internal shading. The researchers indicated that the passive strategies for hot climates should employ thermal transmittance reduction to 0.2 W/(m2·K) for walls, roofs, and ground. Regarding the glazing, the thermal transmittance should be as low as 1.26 W/(m2·K) [17]. The authors indicated that for regions of cooling loads, the usage of high levels of walls, roofs, and ground insulation confines the internal heat gains inside the envelope, leading to the cooling loads increasing [17]. This is referred to as the heat trap effect, which can also occur in cold climates [5]. For regions with cooling and heating loads, walls and roofs should be well insulated, with ground thermal transmittance of more than 0.3 W/(m2·K) for the heat to travel through it [17]. Consequently, passive design parameters and building materials and products optimization effectiveness depend on the climatic region [16]. It also depends on occupants’ use; when the doors and windows are left open for long periods, namely for cross natural ventilation, insulation of the building’s envelope is not as important.
Liu et al. [9] have developed a global sensitivity analysis indicating that the Solar Heat Gain Coefficient (SHGC) is the most significant passive design parameter, followed by the wall solar absorbance and overhangs projection factor [9]. Window glazing for regions of cooling loads is required to be double glazed with low emissivity to limit the heat transfer from the external environment. However, glazing for the region of cooling and heating loads should be well insulated to limit heat transfer from the external environment [17]. Mohammadi and Daraio [6] undertook a residential building case study in Iran, which has a hot and humid climate, employing a real-life occupancy schedule and hourly weather data using DesignBuilder v.6 [18]. The authors utilized two case studies, a baseline and a developed case study, using low-emissive glazing with lower SHGC and Direct Solar Transmittance (DST), insulation, and domestic hot water pre-heating [6]. Also, a study has been developed by Dalbem et al. [19] in Southern Brazil using EnergyPlus® [20] software for the thermal and energy performance assessment, to be evaluated by the Brazilian Energy Efficiency Regulation and Passive House standard using external envelope solutions.
Adapting buildings is crucial for reducing the future climatic changes implications [15]. To forecast these future climatic changes, Representative Concentration Pathways (RCPs) were issued in 2014 as future weather datasets [9]. To be prepared for these climatic changes, adaptable strategies that can be controlled by occupants should be adopted [2]. These strategies include indoor shading devices and cross ventilation, such as opening windows when outdoors is cooler than indoors. These RCPs constitute 2.6, 4.5, and 8.5 scenarios, which are projections of the carbon dioxide concentrations, temperature increase, and climate forcing [21]. Vázquez-Torres et al. [21] have employed the passive cooling strategies on a historic building in Mexico, employing the climate change future projections of 2050 and 2100 with the current data of 2022. The amount of 2 °C is reduced by the current scenario and the same value by the 2100 future projections employing natural and mechanical ventilation from a fan and double roof [21]. For passive cooling strategies, the usage of natural ventilation and shading devices can reduce the mechanical cooling needs up to 84% under the RCP 4.5-2040-2049 [5]. Residential units case studies have been employed in São Paulo, Brazil, for seven different climate scenarios using (1) Test Meteorological Year (TMY) of 1975–2014, (2) near future 2015–2044, (3) intermediate future 2045–2074, and (4) far future 2076–2096 employing the RCP 8.5 scenario [15]. Alves et al. [15] have used EDSL TAS [22] software for the thermal analysis for assessing adaptive comfort models.
Stephan et al. [23] indicated that the existing studies employing passive strategies, using, for instance, insulation products, exclude the quantification of the emitted carbon impacts from its production [23]. This is critical, as the construction industry is liable for 25–40% of the global carbon emissions. One of the tools employed for the life cycle emissions assessment and reductions quantification is the Life Cycle Assessment (LCA) [16]. Stephan et al. [23] have undertaken a Belgian passive house case study with insulated walls, ground floor, roofs, and triple-glazed windows with low emissivity. Transportation emissions per household are quantified, along with the initial and recurrent embodied and operational energy emissions. The authors have optimized the case study to assess the life cycle energy demand, indicating that the operating energy is about 40% of the total energy consumed [23].
Several studies have assessed the availability and the characteristics of agro-forestry industry wastes and byproducts that can be used as building materials to produce bio-based composites in several regions of the world, namely in the Mediterranean region [24]. Several researchers have tried to define test procedures for vegetal-based composites [25,26]. Bio-based boards, and namely vegetal waste-based ones, have been evaluated for thermal and acoustic insulation purposes. Cintura et al. [27] assessed the effect of different adhesives to produce vegetal-based insulation composites. Elmoudnia et al. [28] studied the use of doum palm fibers to produce insulation composites with citric acid and glycerol as binders. Cintura et al. [14,29] tested Arundo donax and hazelnut shells with sodium silicate composites to improve indoor comfort. A review developed by Bourbia et al. [30] was developed to compare different building walls. The authors have stated that the U-values for walls with bio-based insulation in different countries were reduced by 17 to 94% from un-insulated walls or the ones with polystyrene synthetic insulation [30]. In Algeria, a new bio-based product was developed from date palm trunks to be compared to the traditional insulation products, including glass wool and expanded polystyrene (EPS) insulation. This bio-based insulation had physical properties close to these commonly used insulations [31], ensuring that bio-based products can be used for a more circular approach. Several researchers have studied hemp-based composites. For instance, Kubiś et al. [32] assessed the thermal conductivity of a hemp–magnesium binder composite, and Gourlay et al. [33] assessed the effect of water content on the acoustic and thermal insulation of hemp concrete.
Falegari and Shirzadi Javid [16] have employed Building Information Modeling (BIM)-based LCA on a residential building, considering the climatic changes in three different regions and employing some passive strategies [16]. The used tools include (1) Autodesk Revit [34] for modeling, (2) Green Building Studio [35] for energy simulations, (3) Autodesk Insight [36] for the passive design parameters optimization, (4) OneClickLCA [37] for the environmental impacts quantification, and (5) Dynamo [38] for the building elements changes identification. The results indicated that the usage of EPS insulation increased the GHG emissions produced. However, it reduced the energy consumption by more than 20% of the base scenario [16]. Furthermore, Vettorazzi et al. [39] have developed three single-family houses as case studies for evolutionary algorithm employment to find the building envelope’s geometrical optimum solution for reducing energy consumption. These case studies’ energy simulations are performed in different climatic regions in southern Brazil, evaluating the critical relationship between windows-to-wall ratio and shading devices to prevent having unprotected glazing areas [39].
Mohammadi and Daraio [6] included both the produced energy consumption and carbon dioxide emissions. Employing the considered passive strategies in this study has reduced the energy consumed by 20% and carbon dioxide emissions by 18.7% [6]. Mazur et al. [40] developed an LCA study including the A1 to A3 stages for different wall types based on wood and brick for the employment of the passive standards through the U-value assessment.
1.3. Scope and Objectives
The Northeast region of Brazil, like many other regions of this country and other tropical countries, has mostly Aw, As, and BSh climates corresponding to the Köppen climate classification [41]. In this type of climate, the applied measures were often natural ventilation and adequate size of windows with specific exposure and shading devices, which contributed to improving the comfort conditions of residential buildings.
However, currently, many buildings are designed and built without employing passive technologies in this region of Brazil. These buildings often do not include thermal insulation materials in their envelope elements (exterior walls and roof) nor an appropriate glazing and shading system. Furthermore, not all building occupants can afford the highly priced air conditioning equipment and the associated energy consumption. Even more so since it is expected that the regions across Brazil will become warmer by an average of 1–6 °C by 2100, relative to 20th-century averages [15].
Therefore, this study focuses on the Northeast region of Brazil, given the lack of employment of passive energy efficiency and thermal reinforcement solutions, which lead to high compensatory energy consumption. Consequently, its main objective is to show how sustainable passive rehabilitation actions can be energy efficient in the region while having a lower CO2 footprint than more conventional solutions. In addition, climate change weather files that correspond to RCP 4.5 and RCP 8.5 for the mid- and end of 21st century are used to account for the expected variability of the outdoor climate.
This is achieved using a thermal model of a housing unit on the top floor of a typical residential building for eleven cities of different climate conditions in this region. The thermal comfort inside the building and its energy consumption are simultaneously analyzed to obtain the efficiency of the selected renovations. As Brazil’s residential sector consumes 21.5% of the total consumed electrical energy [19], a Life Cycle Assessment (LCA) analysis is carried out to show the minimizing potential, in terms of the energy emissions produced, associated with the use of bio-based insulation when compared to the more conventional solutions, like synthetic thermal insulation (e.g., EPS and XPS). This sort of bio-based insulation building product is especially important in Brazil given the need for new buildings [42], the lack of insulation on existing buildings, and the great potential in manufacturing bio-based products in this country [43].
2. Methodology
2.1. General Considerations
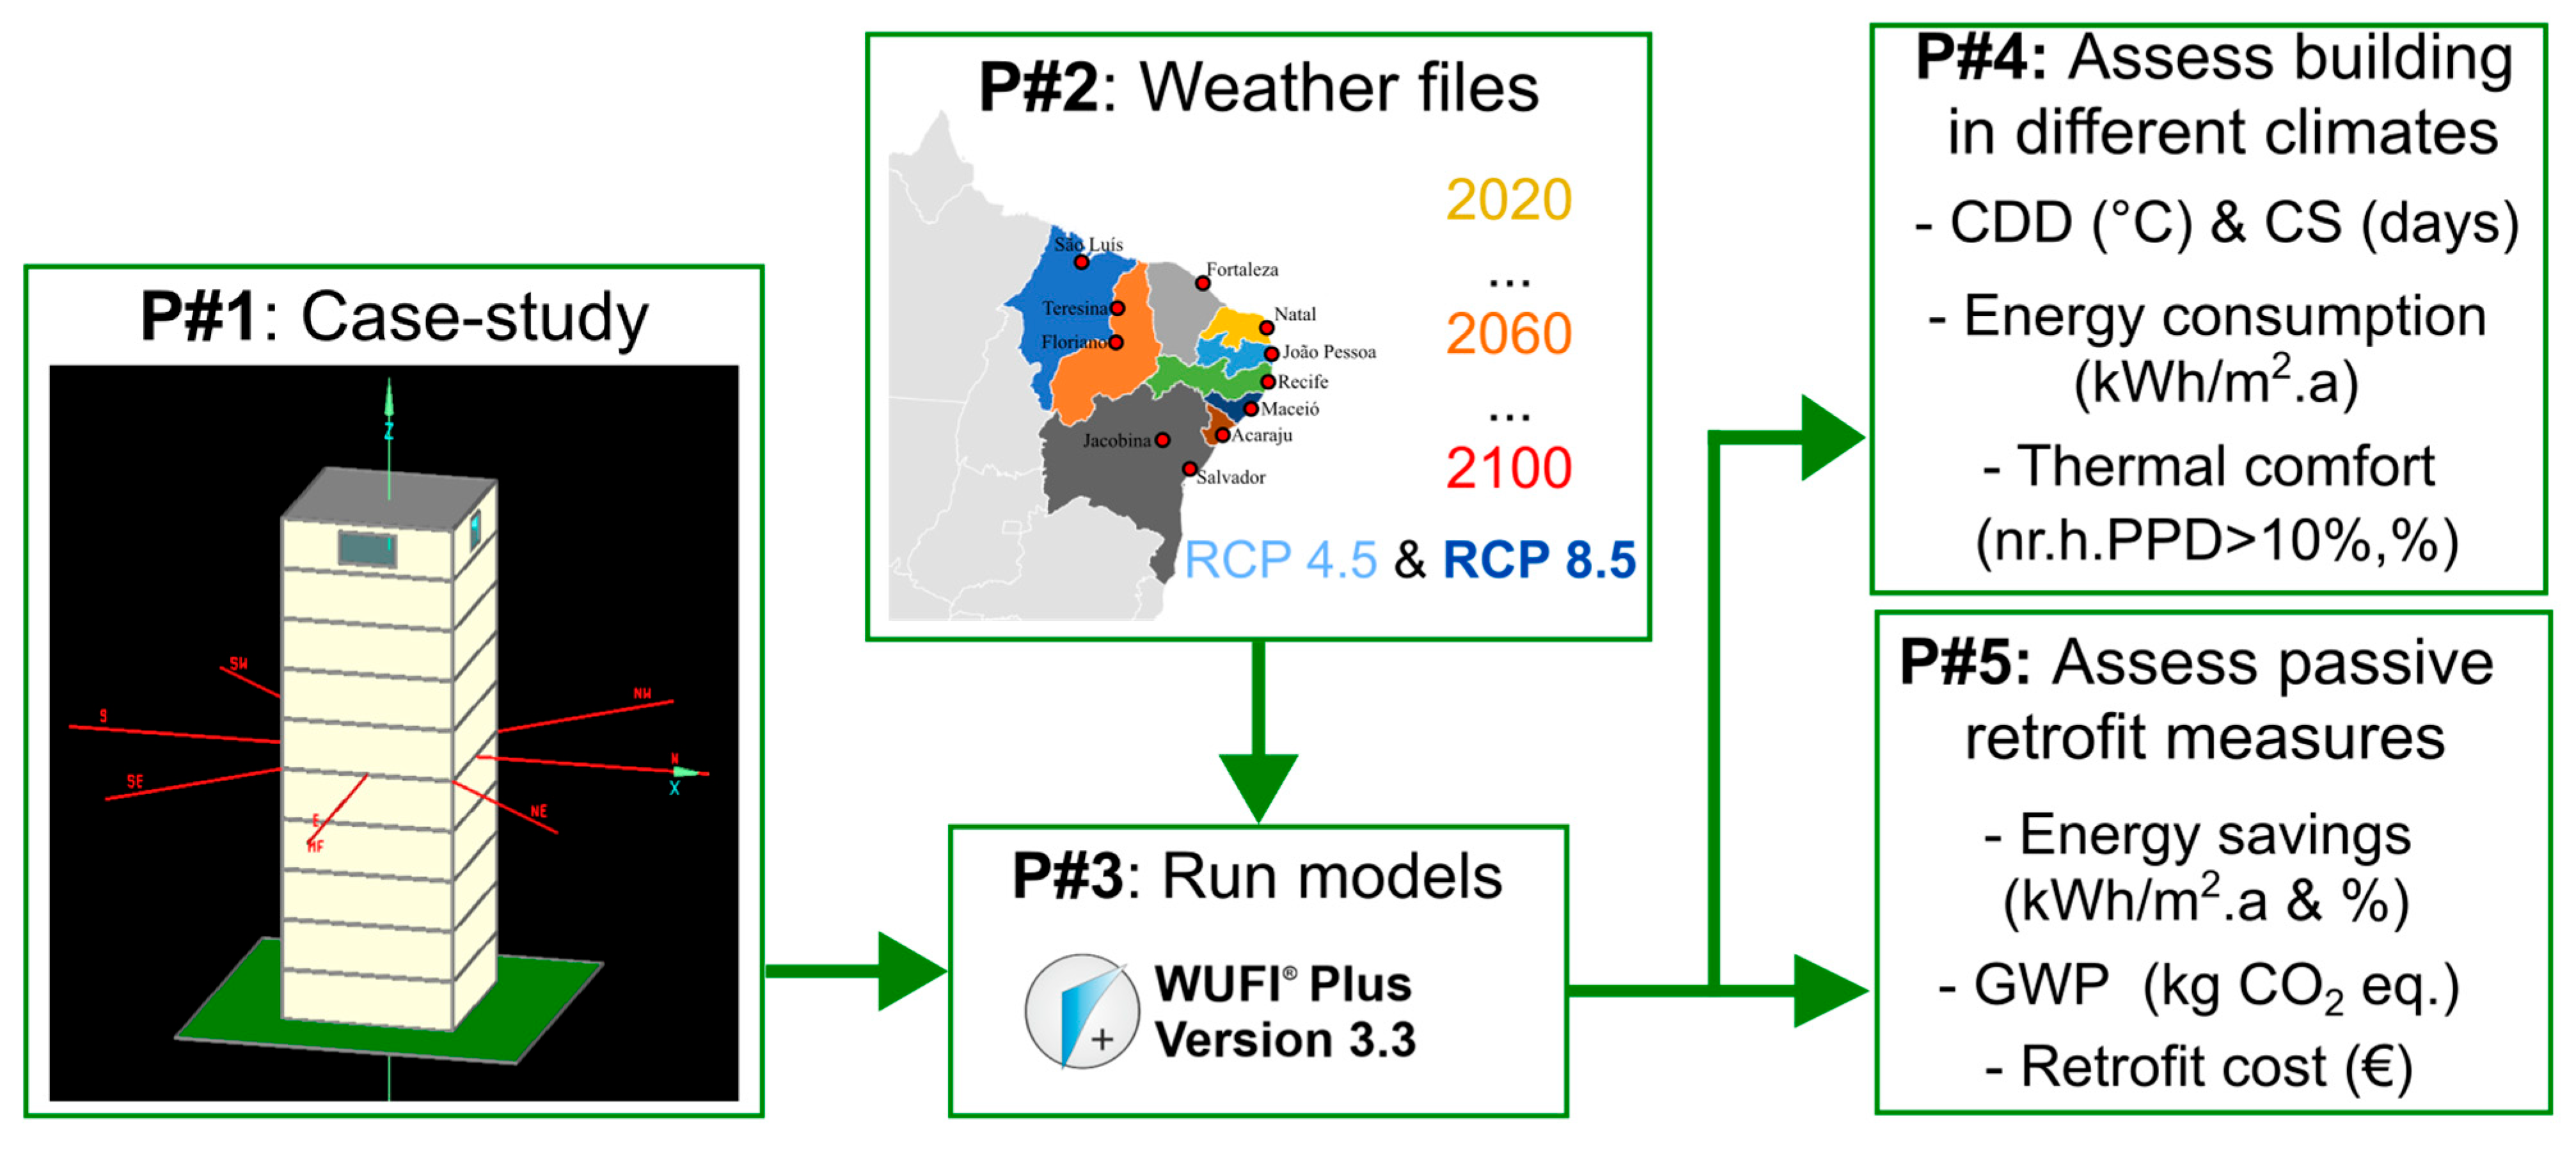
This study aims to assess the importance that passively and adequately rehabilitating buildings can have in the Northeast region of Brazil [44]. This is carried out in order to prevent discomfort and excessive energy consumption due to expected future climate changes. Accordingly, a multi-phase methodology (Figure 1) commences by developing a thermal computational model of a multi-family building using the WUFI®Plus version 3.1.1.0 [45]. This is performed by using both contemporary—2020—as well as future climate files—2060 and 2100—and for two climate change scenarios—RCP 4.5 and RCP 8.5.

Figure 1.
Overview of the employed methodology.
The conditions obtained are evaluated in terms of energy consumption (kWh/m2·year) and thermal comfort using the Predicted Percentage of Dissastified index (PPD, %). This is performed in order to identify simple rehabilitation measures with the potential to significantly contribute to reducing energy consumption and carbon dioxide emissions. These values are quantified using a simplified LCA analysis through OneClickLCA software (conducted previously, e.g., [46,47]). Only A1–A3 stages are included, which corresponds to the product stage. They constitute the raw materials extraction phase (A1), their transportation phase to the factory (A2), and the product manufacturing phase (A3).
To achieve the objectives of this study, 143 thermal simulations were run in WUFI®Plus. Additionally, MATLAB version R2024b [48] is used to efficiently evaluate the data obtained from the simulations.
2.2. Case Study and the Computational Model
In order to achieve the objectives of this study, a thermal computational model of a new 10-story building was developed. This building is representative of the existing multi-family buildings in cities of the Northeast region of Brazil, which is shown in Figure 1. To develop an efficient and robust case study, given the high number of simulations needed for the whole 10-story building, only a fraction of the housing on the top floor is considered for stimulation, considering that it has a floor area of 100 m2.
This model is generated on the WUFI®Plus software, which requires a huge amount of input data, including (1) building geometry, (2) outdoor climate, (3) building envelopes (thicknesses and basic and advanced properties), (4) surface coefficients, (5) internal gains, (6) ventilation, and (7) climate control systems, among others [49]. Regarding the internal gains—including heat, humidity, and CO2 generated from equipment, lighting systems, and occupants—the adopted daily profiles correspond to the typical residential buildings’ use, both during the week and on the weekend.
According to Hu et al. [10], external walls and roofs are the most studied passive strategies, and the glazing thermal transmittance evaluation is always coupled with other passive strategies. East (E) was selected as the main facade orientation for the top-floor residential unit for all the selected cities (see Section 2.3). This orientation is chosen as it receives the highest sum of incident solar radiation annually. Therefore, the residential unit’s glazing area is considered to correspond to 15% of the floor area. This percentage corresponds to 15 m2 and is distributed as follows: (1) 5 m2 for facades facing east and west, (2) 3 m2 for facades facing north, and (3) 2 m2 for facades facing south. These proportions of the glazed openings are selected based on the overall radiation incident on the four facades for the selected climates. The assumed properties for glazing are presented in Table 1, assuming that there are no shading devices.

Table 1.
Characteristics assumed for the glazing in the computational model.
The residential unit elements’ compositions assumed in the computational model are presented in Table 2. These construction compositions are selected as a representation of the real-life construction layers applied in buildings in the Brazilian Northeast region. A solar absorption coefficient of 0.3 is assumed, which corresponds to a light-colored painted plaster [50], typically used in the region under analysis. Nevertheless, it should be noted that for the exterior wall, the thermal conductivity of the brick is presented as a function of its thickness, which can be used for identifying the thermal resistance of the walls. In addition, Table 3 presents the material properties of the improvement measures tested in Section 3.4.
Table 2.
Construction elements assumed in the computational model and properties of the respective layers, thickness, thermal conductivity, and thermal resistance (values based on [45,51]).
Table 3.
Retrofit measures applied to the exterior envelope (walls and roof) and properties of the respective layers, namely, thermal conductivity and bulk density (values based on [45]).
2.3. Selected Climates
For developing the case study, eleven cities were selected as representative of the climate in Northeast Brazil, as shown in Figure 2. Each city is chosen as a representative of their state, as they have the highest population density in the state. Accordingly, they are subjected to the highest effects of temperature increases due to anthropogenic reasons, especially the Urban Heat Island (UHI) effect [52], which is intensified by climate change [4], raising the temperature near the surface [15]. The only exceptions are Floriano (state of Piaui) and Jacobina (state of Bahia), so there is great coverage of these two larger states, and, at the same time, more inland cities since only one inland city has the highest population density in a state (i.e., Teresina).
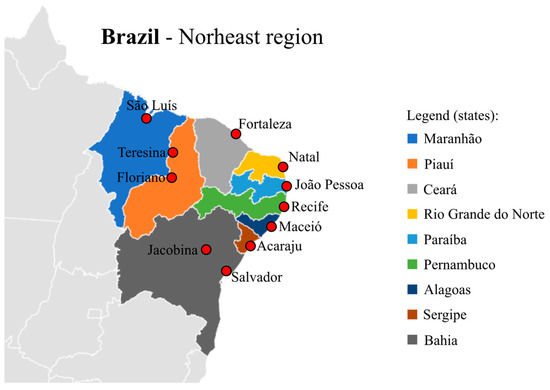
Figure 2.
The Northeast Brazil region and cities selected for analysis.
As depicted in Figure 2, most of the selected cities are located along the coast, except for Teresina, Floriano, and Jacobina, which are located inland within the states of Piauí and Bahia, respectively. It is expected that the climate change effect, in terms of temperature increase, will have a smaller effect on cities located along the coast than on cities located inland due to the buffering effect of great volumes of water, like oceans [53].
The average annual temperature (Taa), average annual relative humidity (RHaa), accumulated annual precipitation (P), and average annual global solar radiation (GRaa) of the selected cities’ climates are evaluated, as listed in Table 4. This table shows values for contemporary conditions (i.e., Ref. for 2020) and for future expected conditions—RCP 4.5 at 2100 and RCP 8.5 at 2100, respectively. The intensity of the colors in Table 4 is proportional to the values.
Table 4.
Characterization of selected climates in terms of temperature (°C), relative humidity (%), precipitation (mm), and global radiation (W/m2) for contemporary conditions (Ref.), and for expected conditions for scenarios RCP 4.5 and RCP 8.5, both at the end of the century. The intensity of the colors is proportional to the values.
It is found that the mean temperatures of the selected climates are all above 25 °C, with Floriano having the highest value. It is also visible that this average will increase due to climate change, with RCP 8.5 corresponding to the highest increase (e.g., 33.8 °C for Floriano). In terms of relative humidity, Maceió has the highest value of 83%, and Teresina and Floriano, both interior cities, have the lowest value of 68%. Climate change does not lead to significant differences in terms of relative humidity.
Regarding precipitation, the accumulated values are considerably variable. The maximum value reaches above 2200 mm in Salvador and 650 mm in Jacobina, being the minimum value for the contemporary conditions. Climate change effects on precipitation differ according to the assessed location. In some locations a small increase is expected, while for others a small decrease is expected in relation to the reference case. Finally, for the radiation, all the selected climates have mean annual values above 200 W/m2, with Floriana and Jacobina having the highest values. It is also visible that global radiation is expected to increase with climate change in most cases.
The climate files, which characterize the climate of the selected cities analyzed in this study, were obtained using Meteonorm version 8 [54], weather file generating software that can generate 10-year periods of future weather files for RCP 2.6, 4.5, and 8.5. The files with contemporary data (2020) are used as a reference, while the future climate files correspond to the near future (2060) and the far future (2100). Using these three different period files allows the assessment of the expected evolution of the climate over time and, consequently, its influence on the residential unit and its indoor climate. Finally, the following two climate change scenarios are used: (1) RCP 4.5, which corresponds to the average emissions scenario, and (2) RCP 8.5, which corresponds to the extreme emissions scenario [1].
2.4. Energy Consumption Indices
For the purpose of identifying energy consumption associated with the expected heating and cooling consumption, a prior analysis is carried out using the following indices: (1) Heating Degree Days (HDD, °C) and (2) Cooling Degree Days (CDD, °C). The following equations were used to calculate HDD Equation (1) and CDD Equation (2), respectively:
if Tm ≤ 15 °C then HDD = ∑i (18 °C − T im)
if Tm > 15 °C then HDD = 0
if Tm > 15 °C then HDD = 0
if Tm ≥ 24 °C then CDD = ∑i (T im − 21 °C)
if Tm < 24 °C then CDD = 0
if Tm < 24 °C then CDD = 0
In Equations (1) and (2), Tm corresponds to the average daily temperature, in °C. Additionally, the heating season duration (HS, in days) and the cooling season duration (CS, in days) are calculated. These durations consist of the days on which the conditions of the HDD and CDD are verified, respectively. The HDD is calculated for all cities according to Equation (1). However, since the average daily temperature is always above 15 °C, then the HDD and HS values are zero for all selected cities, so they are not presented.
2.5. Thermal Comfort Indices
The assessment of the indoor environmental quality (IEQ) is centered on four main connected fields [55], namely: (1) thermal comfort, (2) indoor air quality, (3) visual comfort, and (4) acoustic comfort. Here, thermal comfort was analyzed due to this paper’s goal to assess the expected discomfort inside buildings in the Northeast region of Brazil in the coming future. Thermal comfort was assessed using the Predicted Percentage of Dissastified (PPD, %), which is calculated based on the PMV [56] using Equation (3):
PPD gives the percentage of people that classify the assessed indoor climate as uncomfortable, i.e., either classify it as too cool (−2 or −3, in the seven-point thermal sensation scale [56]) or too warm (+2 or +3, in the seven-point thermal sensation scale [56]). This, evidently, means the bigger the PPD value, the worse classified is the indoor climate by the generality of its occupants. The minimum value for the PPD index is 5% [56].
The European standard EN 16798 [57] states that for buildings of type II, a typical category for residential buildings, the PPD should be lower than 10%. Here, the thermal comfort figure (Figure 6) presents the number of hours per year (in percentage) that this limit is surpassed during operating hours. This allows us to have a single value that represents the whole year per selected climate, easing the comparison.
2.6. Cost Calculations
For the cost quantification associated with the building elements’ direct costs, including material and installation purposes, the building elements’ areas and per-unit cost information are required. The elements’ areas of the retrofit scenarios, including external walls and roof, are calculated from the developed model. With the identification of the cost information per meter squared [58], the cost is calculated for the selected improvement measures, respectively—Equation (4):
TC = C × A
In Equation (4), TC corresponds to the total cost per building element of each retrofit scenario (EUR), C is the cost per square meter (EUR/m2) of each retrofit scenario, and A is the total area of the building element (m2). The windows were not included in the cost calculations, as their areas are much smaller in comparison to the wall and roof areas.
3. Results and Discussion
3.1. Future CDD and CS
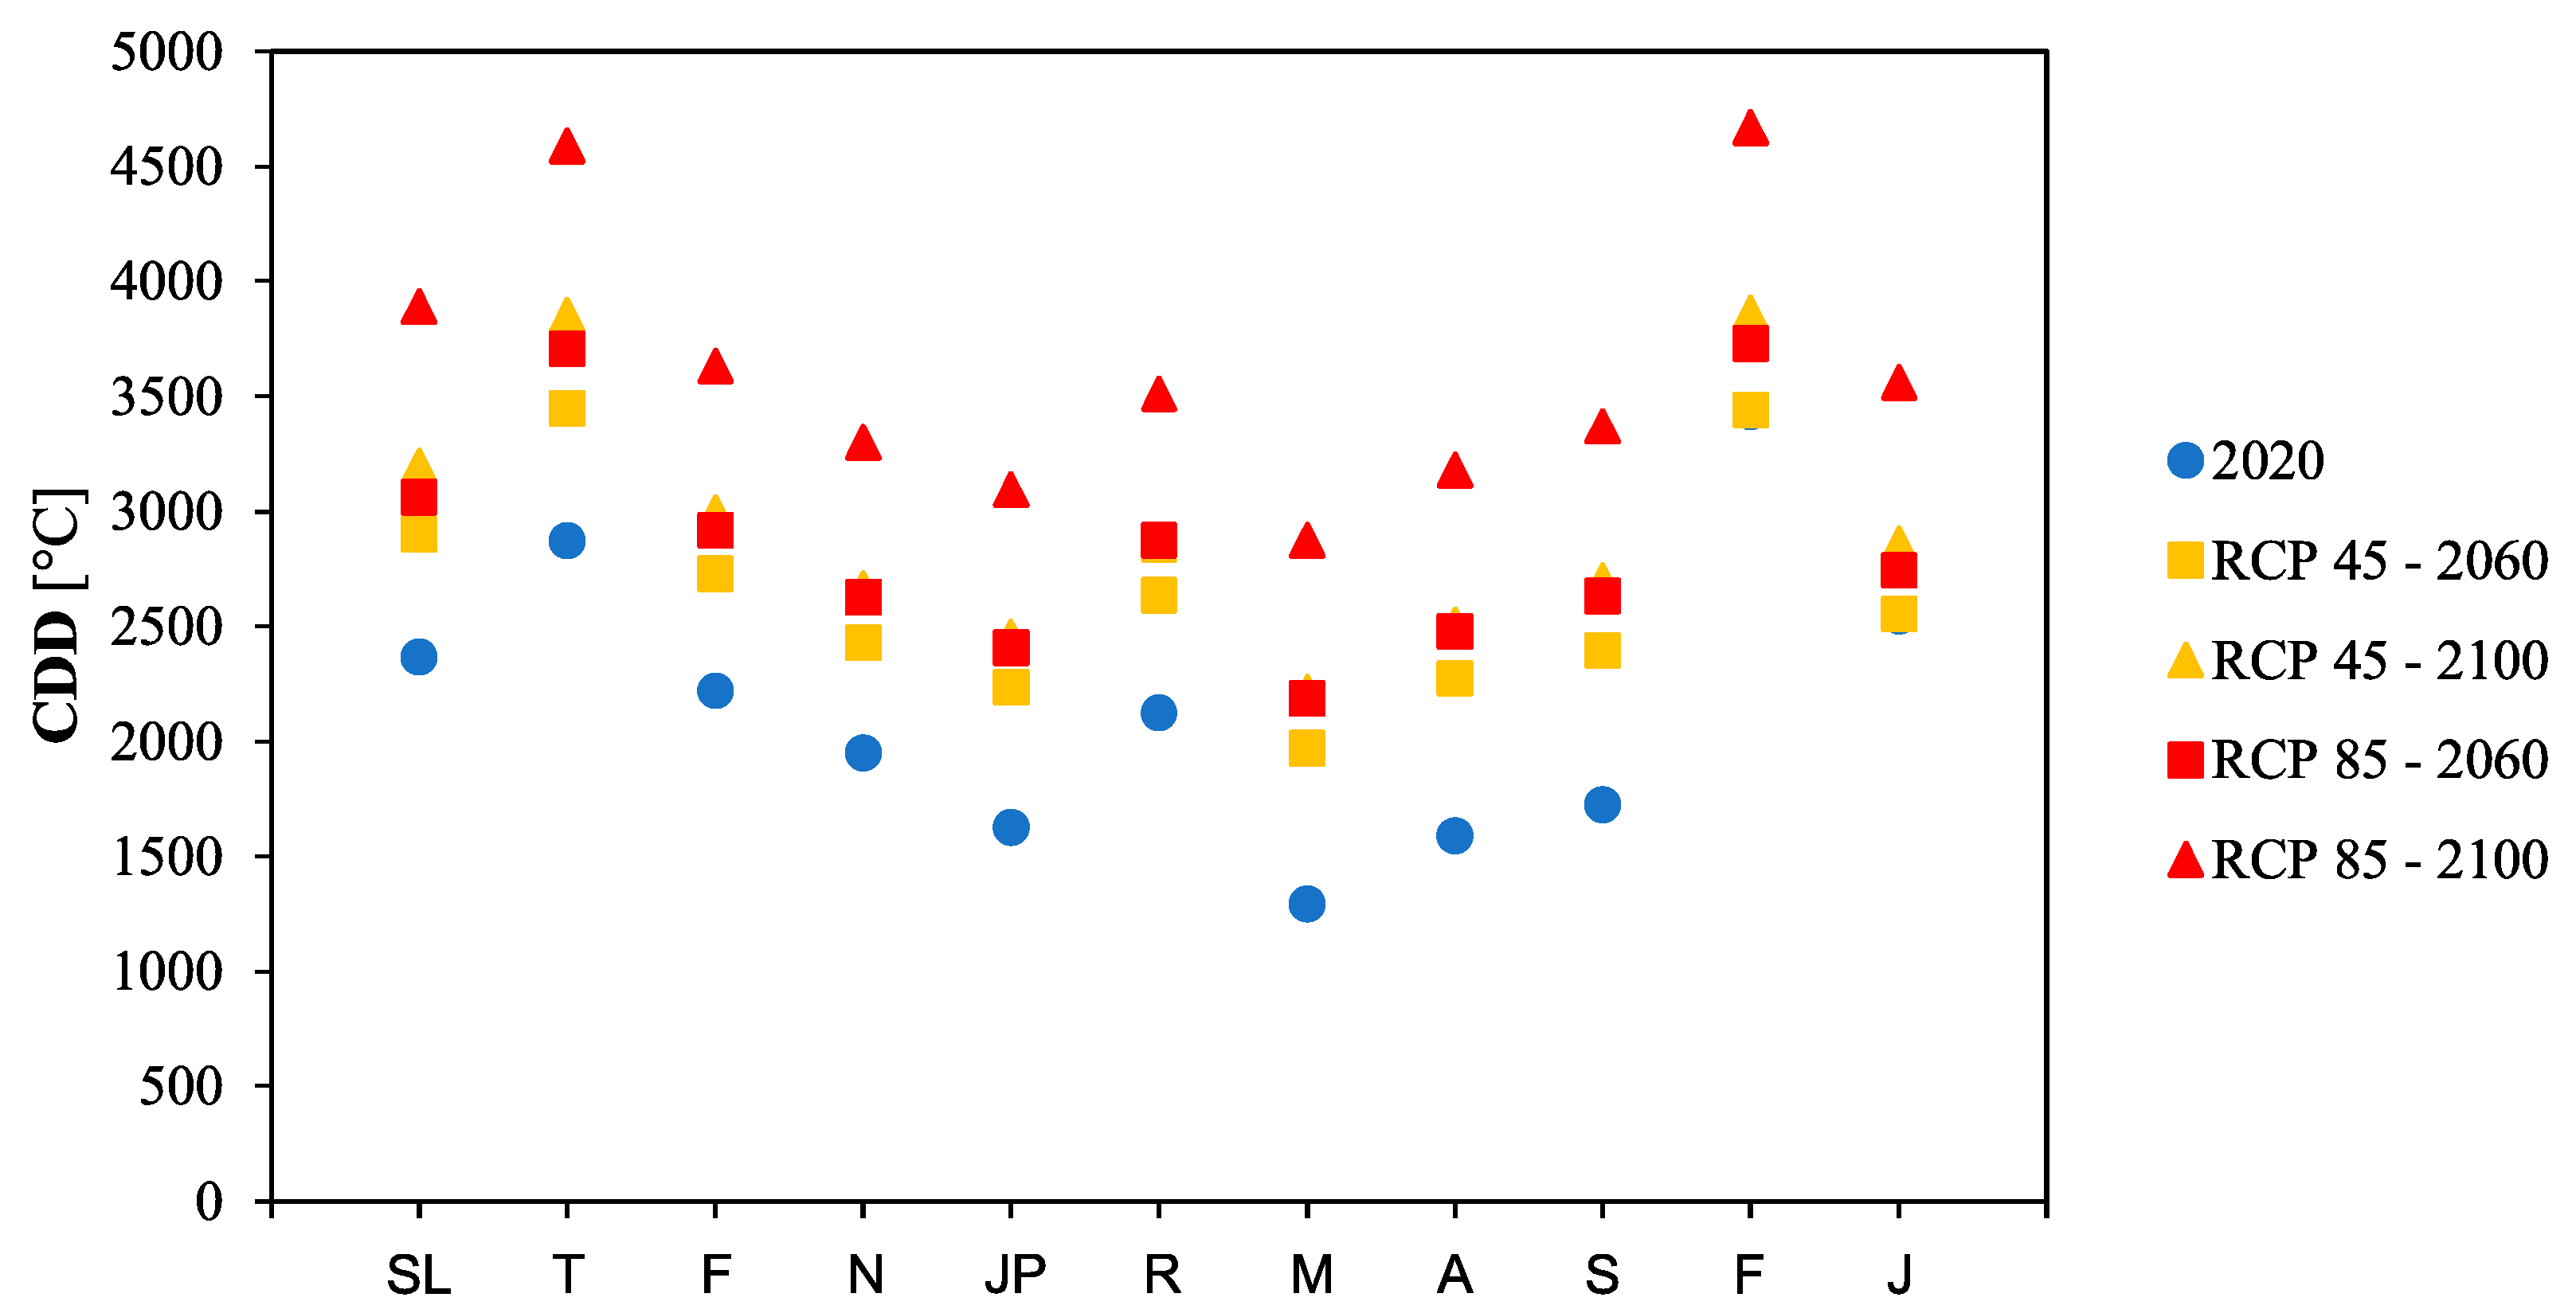
The CDD is an estimated parameter that allows determining, prior to energy calculations, the magnitude of cooling energy consumption. In addition, the CS index is also calculated to determine the cooling season duration. As shown in Figure 3, all the selected climates have high CDD values under the current conditions, which are higher than 1500 °C. Additionally, there is a progressive increase in CDD over time, with greater significance of the RCP 8.5 future climate scenario due to the expected increase in air temperature. The more severe situation is expected to occur in Floriano (4688 °C) and Teresina (4588 °C) both in Piaui state and interior cities (Figure 2).
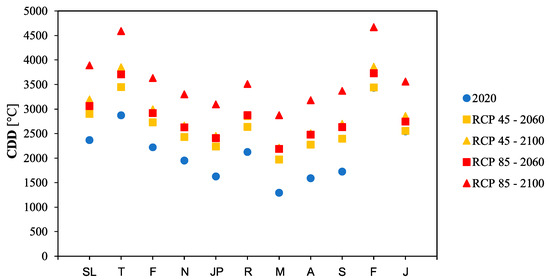
Figure 3.
Cooling degree days (CDD, °C) for the eleven selected climates (city abbreviations in Table 4) for contemporary (2020), near future (2060), and far future (2100) conditions for RCP 4.5 and 8.5 scenarios.
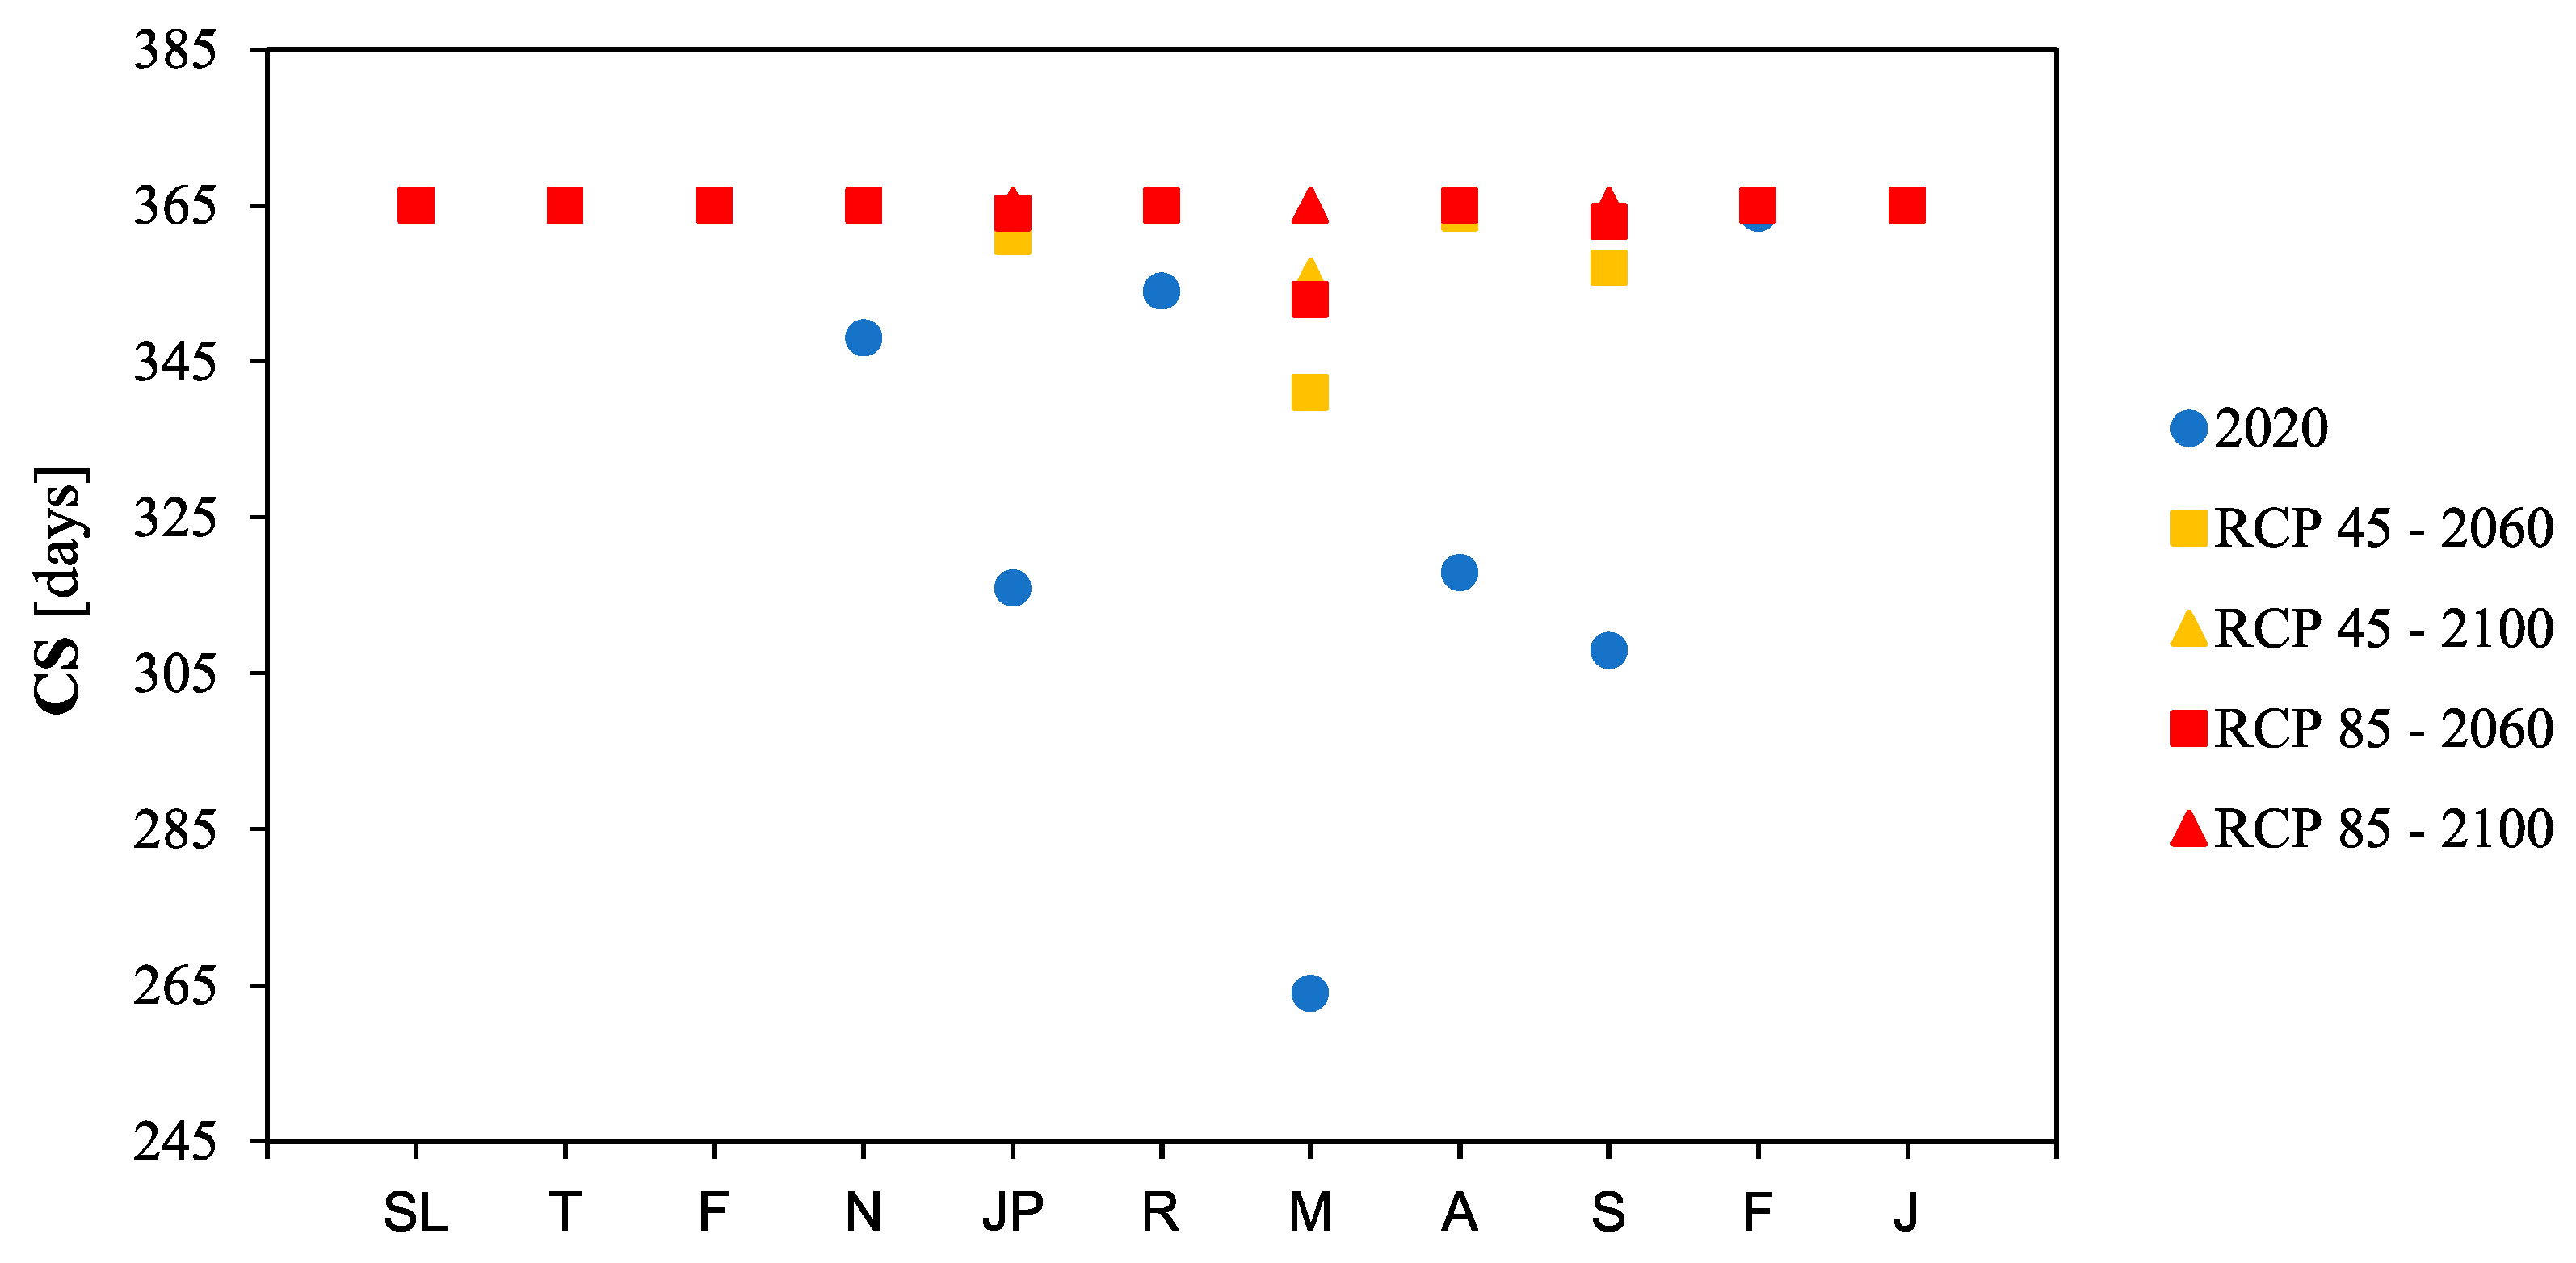
It is worth mentioning that, for some of the selected cities, e.g., Recife, the CDD value for 2060 in the RCP 8.5 scenario is higher than the value corresponding to the year 2100 in the RCP 4.5 scenario. The behaviors illustrated in Figure 3 are verified when compared to the CS values depicted in Figure 4. Consequently, climate change is expected to substantially increase the duration of the cooling season for Natal, João Pessoa, Recife, Maceió, Acaraju, and Salvador, with the most critical impact expected by the end of the century under the RCP 8.5 scenario. For the other remaining locations, the situation in contemporary conditions already reached the maximum of the cooling season (i.e., 365 days).
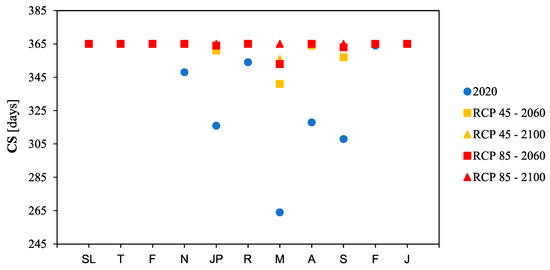
Figure 4.
Cooling season (CS, days) for the eleven selected climates (city abbreviations in Table 4) for contemporary (2020), near future (2060), and far future (2100) conditions for RCP 4.5 and RCP 8.5 scenarios.
3.2. Energy Consumption
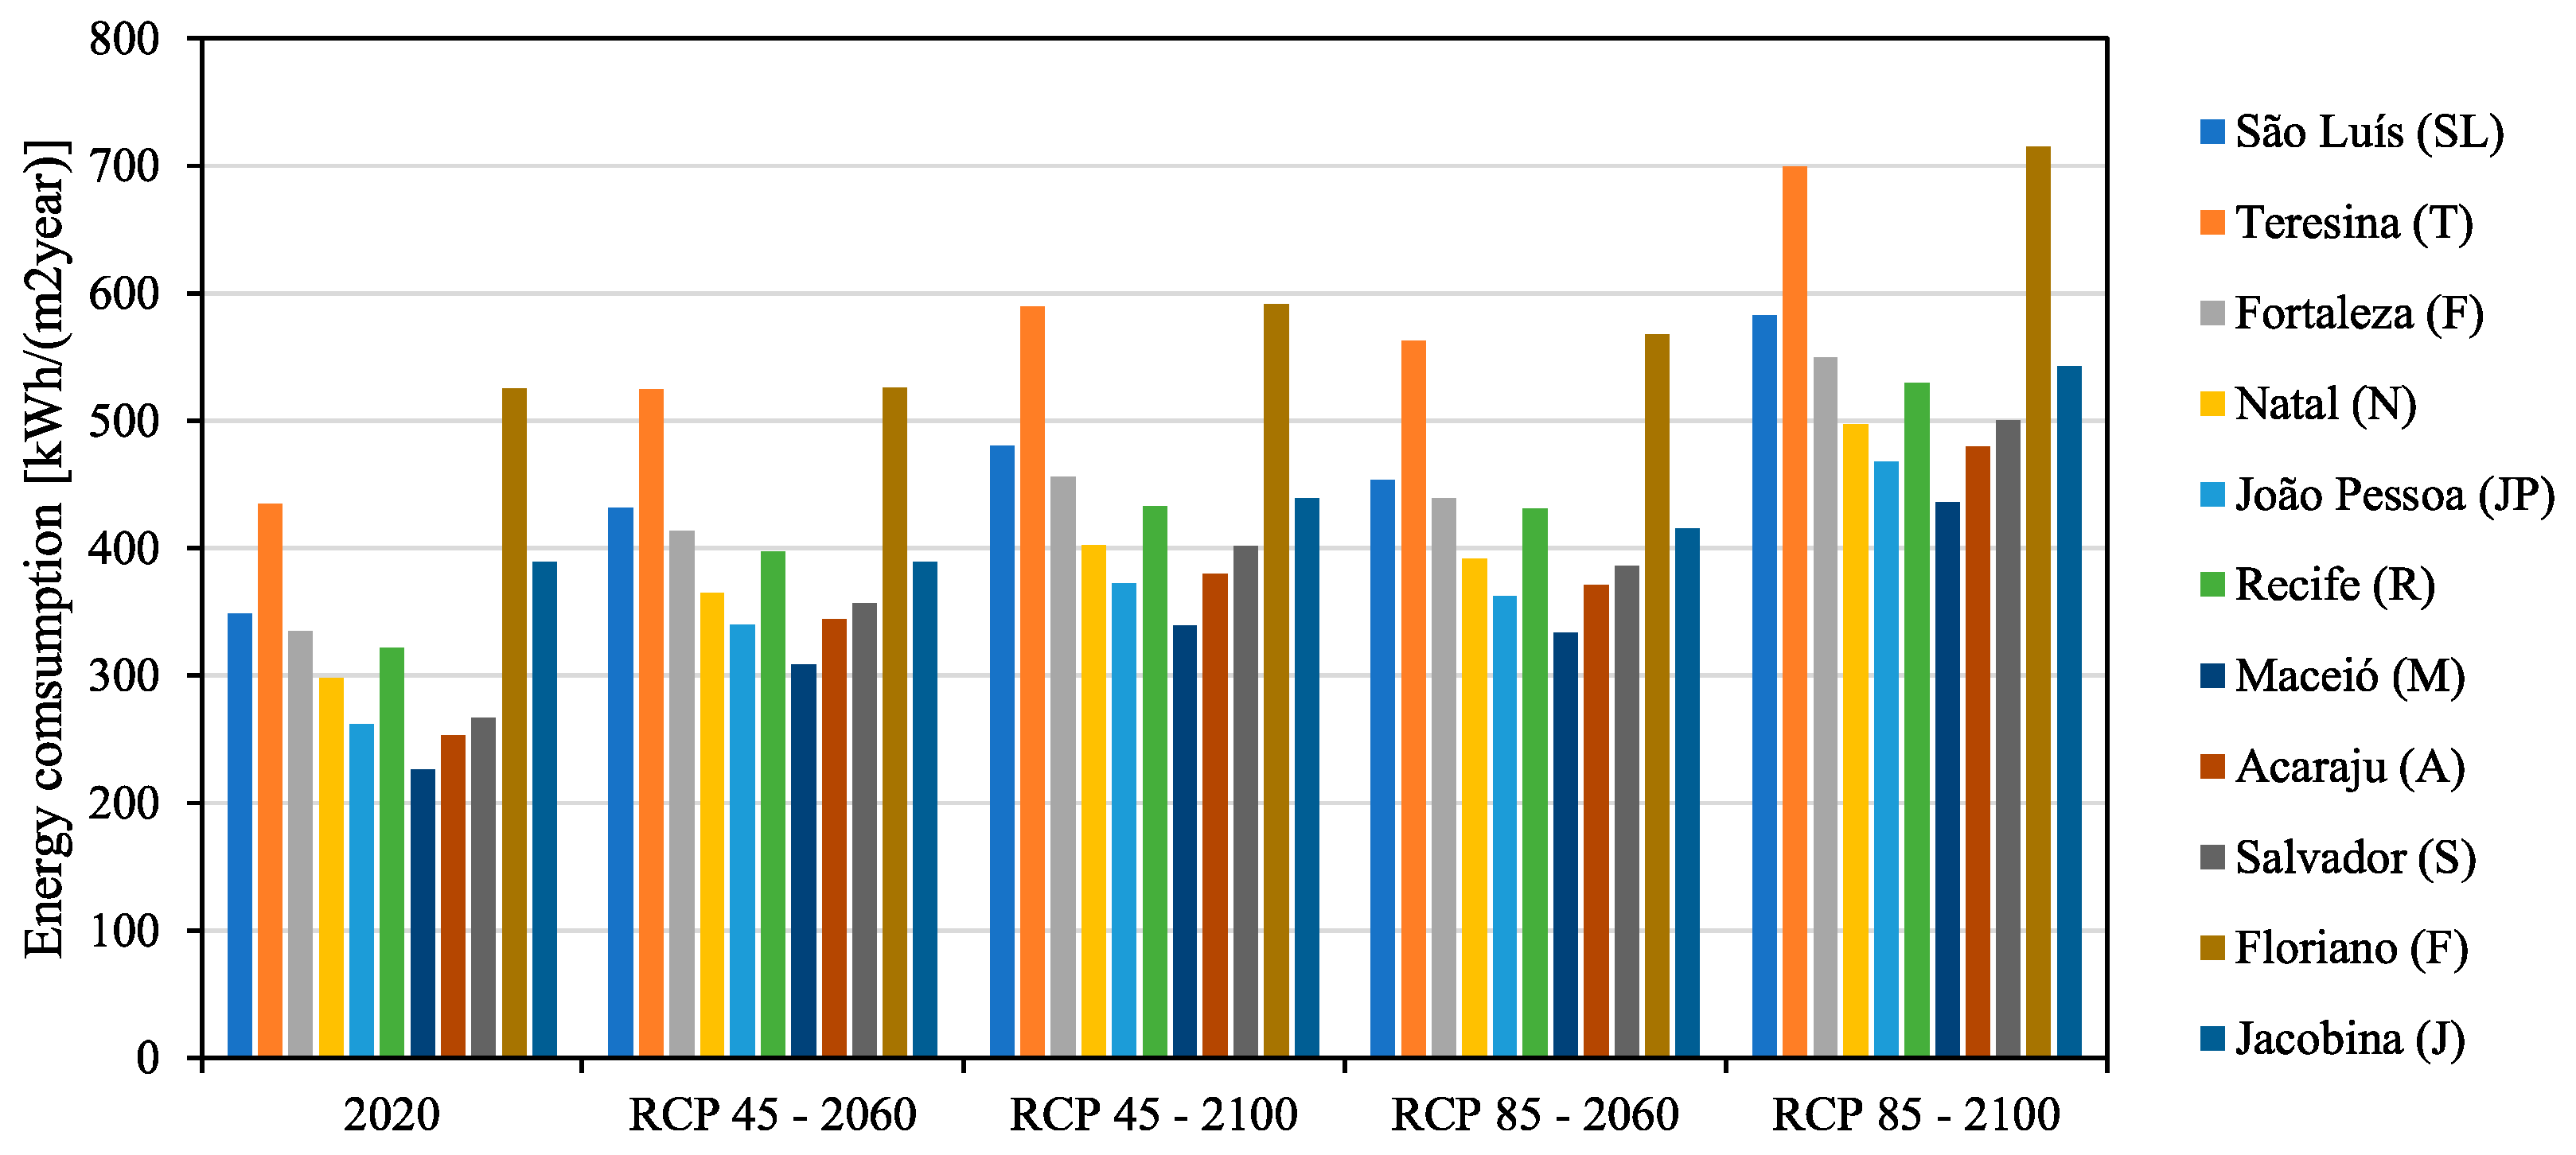
Based on the developed thermal simulations, it is found that current energy consumption is significant and moderately variable among the eleven selected cities. As shown in Figure 5, Floriano has the highest value, approximately 525 kWh/(m2·year), followed by Teresina and Jacobina with 435 and 389 kWh/(m2·year), respectively, as expected, and Maceió with the lowest value, approximately 226 kWh/(m2·year). Furthermore, the energy consumption values arrangement between the cities for the 2020’s current climate remains the same.
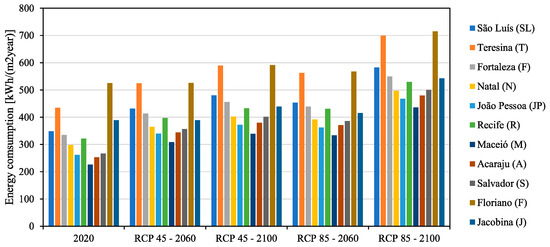
Figure 5.
Energy consumption for the eleven selected cities for contemporary conditions (2020) and future conditions (2060 and 2100) for two scenarios (RCP 4.5 and RCP 8.5).
The RCP 4.5 and RCP 8.5 scenarios’ values only increase in magnitude over time. However, the RCP 8.5 scenario values increase more significantly, as illustrated in Figure 5. Floriano and Teresina, both interior cities, reach values above 700 kWh/(m2·year) at the end of the century for the RCP 8.5 scenario. The energy consumption values, shown in Figure 5, consider solely the consumption due to heating and cooling. The shares due to the characteristics of the analyzed climates (Section 2.3) are considered zero both for contemporary conditions and for future conditions.
3.3. Thermal Comfort
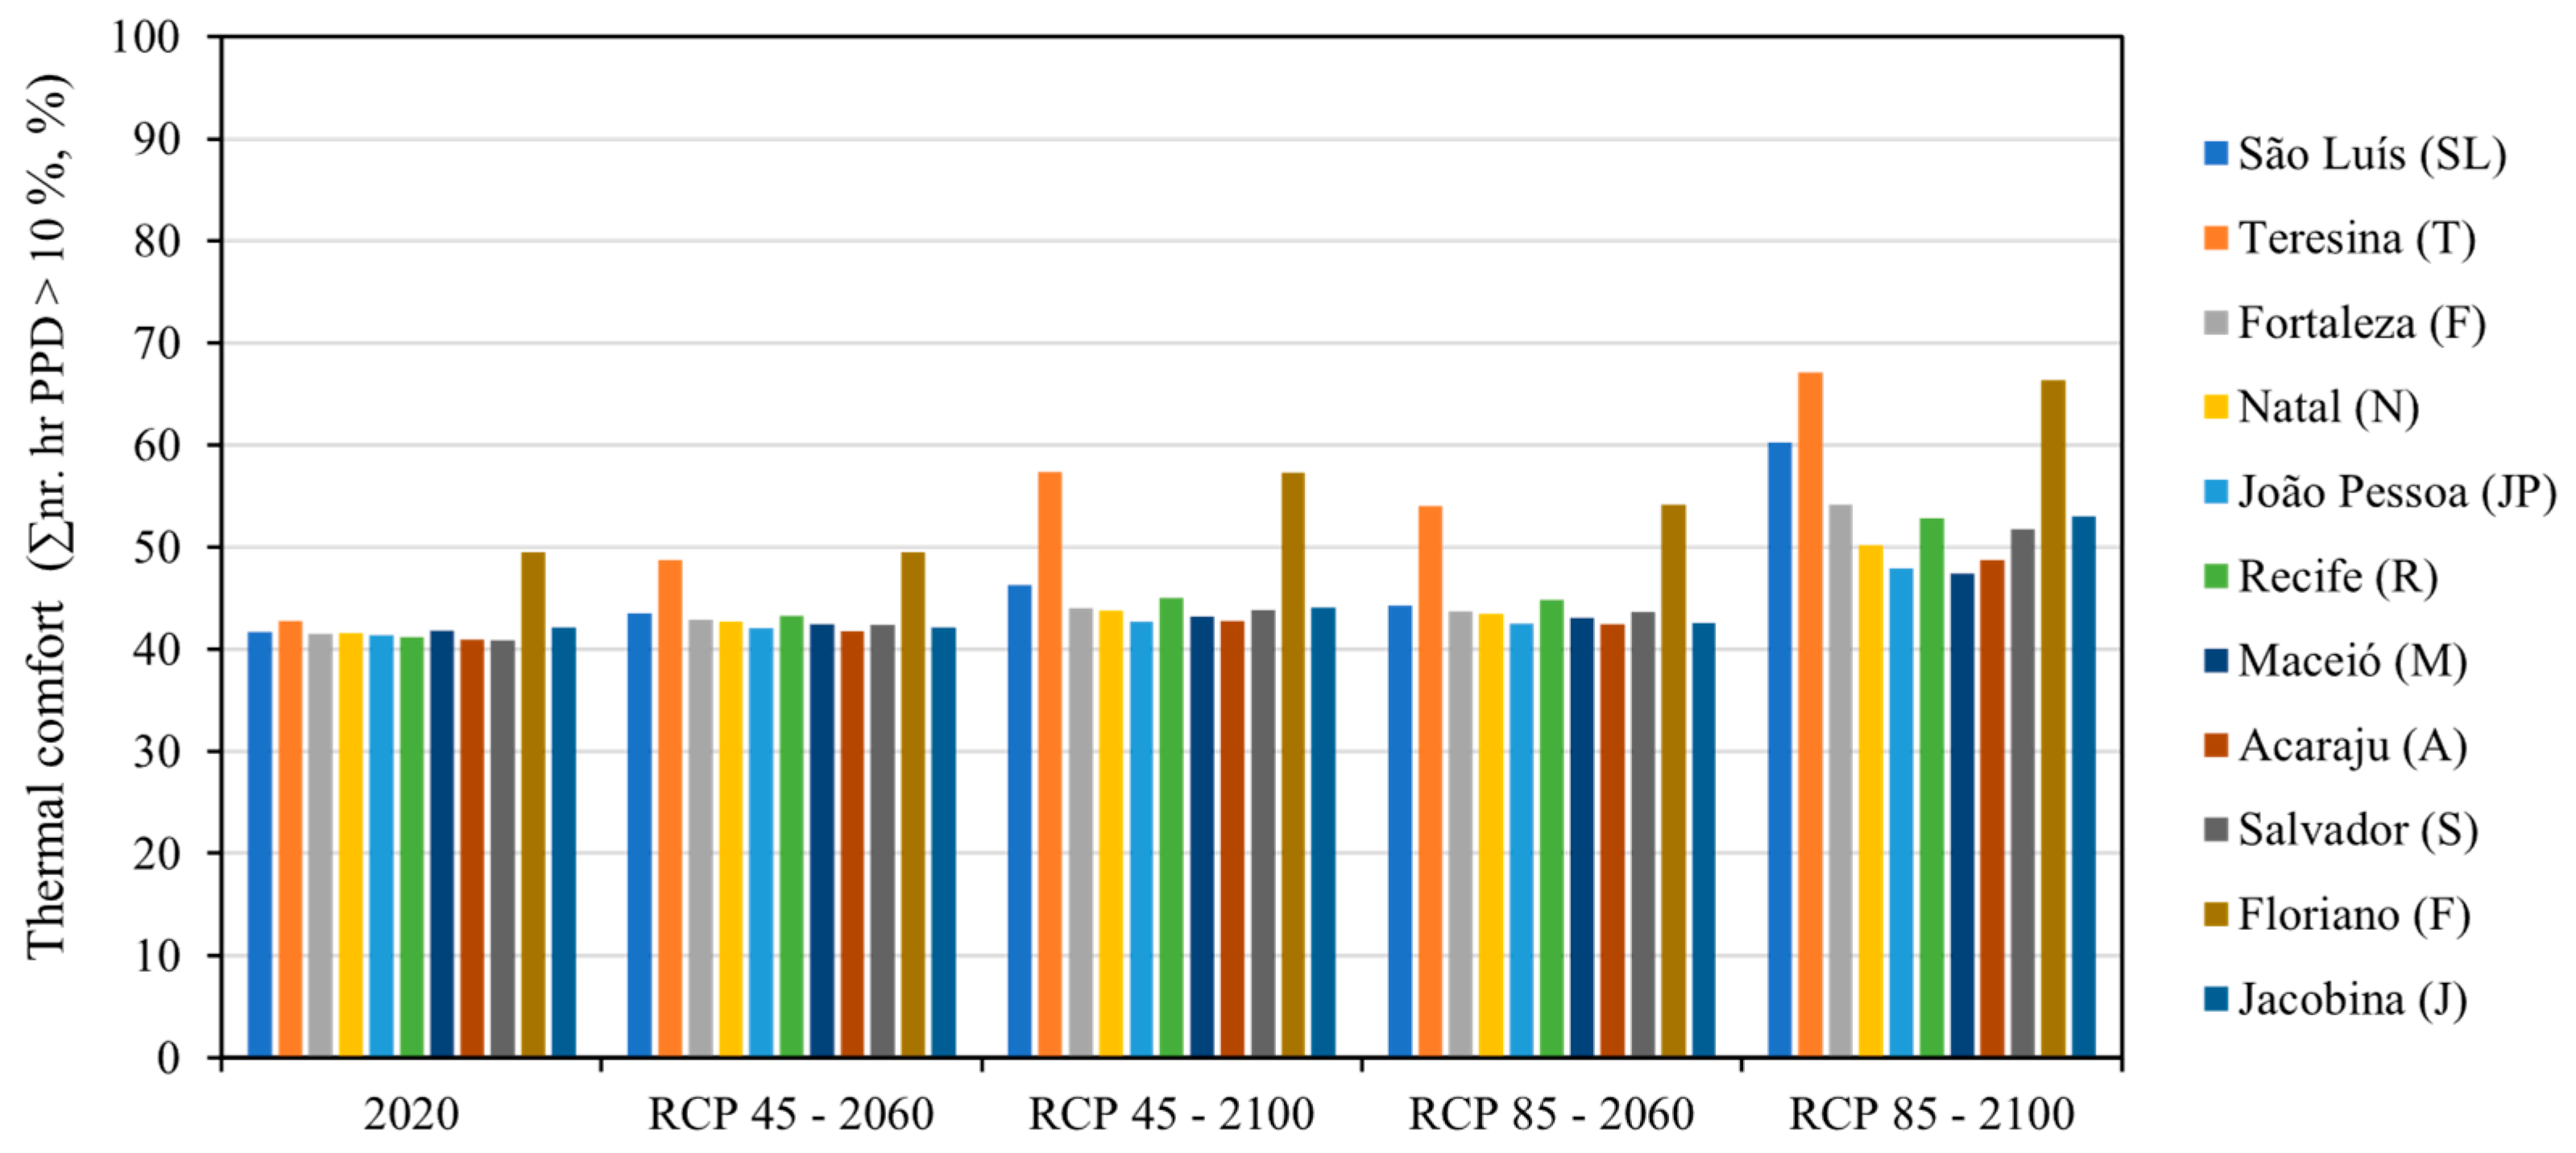
Figure 6 shows, in percentage, the number of hours throughout the year in which the Predicted Percentage of Dissatisfied (PPD) is higher than 10% during operating hours for contemporary conditions as well as future conditions for each selected city. It is depicted that, in all the analyzed cities, this limit is exceeded by at least 40% of the year for contemporary conditions. The worst case is Floriano (49.6%), while the least worst are Acaraju and Salvador (both with 40.9%).
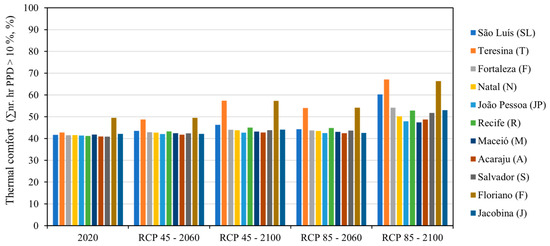
Figure 6.
Thermal comfort, in terms of the percentage of the number of hours that the Predicted Percentage of Dissatisfied (PPD) is higher than 10% during operating hours in a year, for the eleven selected cities under contemporary and future conditions.
However, it is also visible that there is a substantial increase in the number of users who consider the indoor climate uncomfortable, especially at the end of the century for RCP 8.5. Teresina and Floriano, both inland cities, are the worst cases. For example, in Teresina, 67.1% of the simulated building users would classify the indoor climate as uncomfortable, which corresponds to an increase of 24.4% when compared to contemporary conditions.
In sum, many users would classify the contemporary indoor climates as uncomfortable (at least 40%), but this trend is expected to increase substantially due to climate change, reaching even more than 65% of the building’s users in some cases.
3.4. Improvement Measures
According to Bourbia et al. [30], straw bale insulation is the optimum one for wall construction, followed by cellulose fiber reinforced concrete and then hemp concrete. The selected improvement measures (see material properties in Table 3), which can be applied in both new and rehabilitated buildings, are the following for each relevant building element, given the magnitude of the heat exchanges that occur through them:
- Roofing—Application of thermal insulation in panels of: (a) extruded expanded polystyrene (XPS), synthetic, to be applied over the existing sealing system, under heavy protection, and (b) lightweight hemp-based boards, to be applied under the waterproofing system, with the inclusion of an additional thermal insulation, which is considered to be a good example of bio-based thermal (and acoustic) insulation.
- Glazing—Replacement of single glazing with: (a) double glazing with thermal resistance of 2.6 W/(m2·K) and solar factor of 0.78, and (b) double glazing with equal thermal resistance of 2.6 W/(m2·K) and low solar factor of 0.09.
- External walls—Application, on the inside, of thermal insulation in plates consisting of (a) molded EPS, synthetic, to be covered with plasterboard plates, and (b) lightweight hemp-based boards, and acoustic insulation, which can be coated with plaster, although it could be left uncoated.
Table 5 shows the energy savings associated with the selected improvement measures for the walls, roof, and windows. In their respective columns (i.e., Roof, Windows, and Wall), the previously presented retrofits are assessed individually so that we can ascertain their respective influence on the performance of the case study. Whereas at the end of this table (i.e., combination section), two combinations are assessed: C1—Wall Bio, Roof Bio, and Windows double; and C2—Wall Bio, Roof Bio, and Windows double with low g-value. The option included only having the bio retrofits for the walls and roof because they have similar thermal behavior to the synthetic ones (Table 5).
Table 5.
Energy consumption and percentage reduction in relation to the reference due to the application of improvement measures on the roof (placement of synthetic thermal insulation, XPS, or bio-based thermal and acoustic insulation), walls (placement of synthetic thermal insulation, EPS, or bio-based thermal and acoustic insulation), and windows (double or double with low solar factor) for each of the cities analyzed. Combination 1 (C1) corresponds to Wall Bio, Roof Bio, and Windows double, while combination 2 (C2) corresponds to Wall Bio, Roof Bio, and Windows double with low g-value. The intensity of the colors is proportional to the values.
The greatest savings are achieved by the interventions carried out on the roof, as savings of over 34% are achieved annually with both assessed insulation systems. This is followed by the interventions on the walls, which achieve energy savings of between 12 and 19%, regardless of the thermal insulation used. However, the use of a bio-based insulation board is a more economic, compatible, and technically efficient solution for the walls, as the coating is optional (considering that fire safety requirements are fulfilled), and currently, this type of surface is esthetically appealing, and the insulation system itself ensures water vapor permeability and good moisture buffering capacity [25], particularly when uncoated.
Finally, the glazing replacements, where the energy savings values are higher for the double glazing with low solar factor glass (16–26% annually) compared to the double glazing with normal glass (5–6% annually). It is interesting to notice that the lower improvements for this last retrofit action are achieved for Floriano and Teresina.
In addition, to show the potential of simultaneously applying these measures, two sets of combinations were tested (Table 5), as previously mentioned. The substantial effect of applying combined measures to on energy consumption is visible. For C1, this means an energy saving of 53–59% (depending on the location) when compared to the reference case, while for C2, this means a saving of 71–78% (depending on the location). This higher level of improvement is normal given the combination of retrofit measures at different levels of the case study simultaneously, i.e., roof, walls, and windows.
The Global Warming Potential (GWP) in kg CO2 eq. is determined for each of the rehabilitation measures selected for the case study. It is found that the insulation using lightweight hemp boards, which is an example of thermal and acoustic insulation based on agro-industrial waste [14,59], resulted in significant reductions in GWP. This is achieved in both; the roof with 77% and the wall with 67%, as listed in Table 6.
Table 6.
LCA of selected improvement measures in terms of GWP (kg CO2 eq.) and comparative reduction for the walls, roof, and windows retrofit.
Accordingly, this indicates the advantage of using bio-based thermal insulations over synthetic thermal insulations constituting EPS and XPS regarding the carbon footprint. Furthermore, bio-based insulation provides additional acoustic insulation, which can be vital in places with high external noise levels. Brazil, like other tropical countries, has a variety of agro-industrial waste that is a highly interesting source for producing building insulation. Moreover, there is a reduction in economic costs due to the usage of secondary materials. Also, a reduction in economic and environmental costs, which is associated with the reduction in volumes to be managed as waste.
Finally, replacing single glazing with double glazing results in a 1.4-fold increase in GWP, as listed in Table 6, making the carbon footprint more substantial. However, there is a small difference between the usage of double glazing producing 566 kg CO2 eq. and double glazing with a low solar factor producing 581 kg CO2 eq. However, given the properties associated with radiation transmission reduction in the latter being 0.09, the use of double glazing with a low solar factor largely offsets energy consumption, as listed in Table 6. Consequently, this glazing is the optimum solution for hot climates, such as those assessed in this study, in which no shading devices were considered. The use of shading devices, without jeopardizing daylight inside buildings, could be another alternative, at least in glazing with certain orientations.
Regarding the LCA quantified values listed in Table 6, only the A1–A3 (extraction, transportation, and manufacturing) stages are included, considering the Environmental Product Declarations (EPD) of the selected materials. The reference equivalence parameter for the GWP comparison in the LCA was thermal resistance; therefore, the thicknesses of the applied insulation are different.
Regarding the cost calculations for the selected improvement measures, the values are listed in Table 7. These values indicate a slight increase in costs when comparing the different retrofit scenarios of each building element when comparing the synthetic retrofit measures (EPS for the walls and XPS for the roof) with the bio-based ones.
Table 7.
Financial cost of selected improvement measures.
Comparing energy consumption, GWP, and cost values between the wall and roof retrofit scenarios, it can be seen that the bio-based option has a great advantage in terms of GHG emissions reduction without compromising the thermal behavior of the case study or costing substantially more. The EPS and lightweight hemp-based boards indicated a reduction from 180 kg CO2 eq. to 60 kg CO2 eq. in GWP, a negligible difference in terms of energy consumption, and a EUR 245 increase in cost between these two tested thermal insulation options. For the roof, the usage of lightweight hemp-based boards reduced the GWP from 310 kg CO2 eq. to 71 kg CO2 eq., with a EUR 338 increase between XPS and lightweight hemp-based boards and a negligible energy consumption difference.
4. Conclusions
This study aims to highlight the importance of adequate passive rehabilitation of buildings in the Northeast region of Brazil. This is employed to prevent discomfort and excessive energy consumption due to the expected future climate conditions. This objective is achieved through the development of a thermal computational model of a multi-family building, employing contemporary and future climate files for two climate change scenarios applied to a housing unit located on the top floor of a building. Most coastal cities, as they are the ones with higher populations, are selected, apart from Teresina, Floriano, and Jacobina, inland cities. The potential of three types of retrofit measures was assessed: on roofs, walls, and windows. The first two compared the effect of adding synthetic and bio-based thermal insulation solutions.
The energy consumption, the CO2 footprint (GWP), and the implementation cost were analyzed. Subsequently, by comparing these parameters for the walls and roof retrofit scenarios, it is seen that the bio-based options have a great advantage in terms of GHG emissions reduction without compromising the thermal behavior of the case study or costing substantially more. Including a bio-based insulation product can be especially important in Brazil towards sustainability, given the need for new buildings in this country and the lack of insulation in existing buildings.
It was shown that energy consumption for the contemporary climate is very high, with Floriano and Teresina, inland cities, obtaining the highest values of 525 and 435 kWh/(m2·year), respectively. However, it is expected that this consumption will tend to increase significantly with climate change. For example, Floriano reaches an energy consumption value of 715 kWh/(m2·year) at the end of the century for the RCP 8.5 scenario. As this study indicates, the high indoor temperatures for the contemporary climate, combined with the expected increase in air temperature, both in the near and distant future, make it very difficult to guarantee thermal comfort for the building occupants without a large increase in energy consumption. In terms of thermal comfort, it was shown that many users would classify the contemporary indoor climates as uncomfortable (at least 40%), and that this trend is expected to increase substantially due to climate change, reaching even more than 65% of the building’s users in some cases.
The importance of rehabilitation measures with different magnitude ranges was demonstrated: (1) 34–35% for the roof, (2) 12–19% for the walls, and (3) an average of 5–26% for glazing, depending on the type of glazing applied. It is also shown that the appropriate combination of several rehabilitation measures, at different levels, reached even greater energy savings than those obtained for the individually tested retrofits. Combination 1 reached energy savings of 53–59%, while combination 2 reached energy savings of 71–78% when compared to the reference case. The performed implementation cost assessment indicated that the bio-based options have only a slightly higher cost than the synthetic retrofit measures, varying between 2 and 3%. However, European costs were considered. Brazil is a country with many agro-forestry bio-based waste materials; the cost of local bio-based insulation boards should be lower than the ones considered.
Finally, through the LCA, the advantage of applying bio-based insulation to roofs and walls, such as hemp thermal insulation boards instead of synthetic insulation, was assessed. Therefore, due to the great potential Brazil has in manufacturing bio-based products, based on diversified high volumes of residues from agro-forestry industries, future studies should continue to address the development of affordable and ecologically efficient bio-based insulation boards and materials.
Additionally, although the two types of double glazing have very similar GWP, the thermal performance of the glazing with a low solar factor is much higher, which is why it is considered optimum whenever alternative shading solutions are not used. It is therefore concluded that specific studies on the rehabilitation of buildings should be carried out using holistic methodologies so that the recommended improvement measures are the most appropriate and advantageous for the respective case studies. Furthermore, this type or other passive measures should also be considered when designing new buildings to achieve more eco-efficient buildings in Northeast Brazil.
Author Contributions
Conceptualization, G.B.A.C. and P.F.; methodology, G.B.A.C. and P.F.; software, G.B.A.C.; validation, G.B.A.C.; formal analysis, G.B.A.C.; investigation, G.B.A.C.; resources, G.B.A.C. and N.M.; data curation, G.B.A.C.; writing—original draft preparation, G.B.A.C., P.F. and N.M.; writing—review and editing, G.B.A.C., P.F. and N.M.; visualization, G.B.A.C. and N.M. All authors have read and agreed to the published version of the manuscript.
Funding
This research was funded by the Fundação para Ciência e a Tecnologia (FCT), grant number [UIDB/04625/2025] of the CERIS research unit.
Data Availability Statement
The data presented in this study are available on request from the corresponding author.
Acknowledgments
The authors would like to thank the architects Raphael Pachamama and Fábio Gomes and the engineers Douglas Rocha and Alexandre Nunes for their clarifications.
Conflicts of Interest
The authors declare no conflict of interest.
References
- Intergovernmental Panel on Climate Change (IPCC). Climate Change 2014: Synthesis Report. Contribution of Working Groups I, II and III to the Fifth Assessment Report of the Intergovernmental Panel on Climate Change; Pachauri, R.K., Meyer, L.A., Eds.; Cambridge University Press: New York, NY, USA, 2014. [Google Scholar] [CrossRef]
- Roca-Musach, M.; Alonso-Montolio, C.; Cabillo, I.C.; Coch, H. The resilience of buildings to climate change: The role of mobile passive systems. J. Phys. Conf. Ser. 2023, 2600, 092029. [Google Scholar] [CrossRef]
- Attia, S.; Benzidane, C.; Rahif, R.; Amaripadath, D.; Hamdy, M.; Holzer, P.; Koch, A.; Maas, A.; Moosberger, S.; Petersen, S.; et al. Overheating calculation methods, criteria, and indicators in European regulation for residential buildings. Energy Build. 2023, 292, 113170. [Google Scholar] [CrossRef]
- Salameh, M.; Touqan, B. Traditional Passive Design Solutions as a Key Factor for Sustainable Modern Urban Designs in the Hot, Arid Climate of the United Arab Emirates. Buildings 2022, 12, 1811. [Google Scholar] [CrossRef]
- Silva, R.; Eggimann, S.; Fierz, L.; Fiorentini, M.; Orehounig, K.; Baldini, L. Opportunities for passive cooling to mitigate the impact of climate change in Switzerland. Build. Environ. 2022, 208, 108574. [Google Scholar] [CrossRef]
- Mohammadi, A.; Daraio, J.A. Improving the Energy Efficiency of Existing Residential Buildings by Applying Passive and Cost-Effective Solutions in the Hot and Humid Region of Iran. Space Ontol. Int. J. 2020, 9, 77–96. [Google Scholar] [CrossRef]
- Klepeis, N.E.; Nelson, W.C.; Ott, W.; Robinson, J.P. The National Human Activity Pattern Survey (NHAPS): A Resource for Assessing Exposure to Environmental Pollutants. J. Expo. Anal. Environ. Epidemiol. 2001, 11, 231–252. [Google Scholar] [CrossRef]
- United Nations Environment Programme. Building Materials and the Climate: Constructing a New Future; United Nations Environment Programme: Nairobi, Kenya, 2023. [Google Scholar]
- Liu, S.; Kwok, Y.T.; Lau, K.K.-L.; Ouyang, W.; Ng, E. Effectiveness of passive design strategies in responding to future climate change for residential buildings in hot and humid Hong Kong. Energy Build. 2020, 228, 110469. [Google Scholar] [CrossRef]
- Hu, M.; Zhang, K.; Nguyen, Q.; Tasdizen, T. The effects of passive design on indoor thermal comfort and energy savings for residential buildings in hot climates: A systematic review. Urban Clim. 2023, 49, 101466. [Google Scholar] [CrossRef]
- Dabaieh, M.; Wanas, O.; Hegazy, M.A.; Johansson, E. Reducing cooling demands in a hot dry climate: A simulation study for non-insulated passive cool roof thermal performance in residential buildings. Energy Build. 2015, 89, 142–152. [Google Scholar] [CrossRef]
- Kovacic, I.; Reisinger, J.; Honic, M. Life Cycle Assessment of embodied and operational energy for a passive housing block in Austria. Renew. Sustain. Energy Rev. 2018, 82, 1774–1786. [Google Scholar] [CrossRef]
- Almusaed, A.; Almssad, A.; Alasadi, A.; Yitmen, I.; Al-Samaraee, S. Assessing the Role and Efficiency of Thermal Insulation by the “BIO-GREEN PANEL” in Enhancing Sustainability in a Built Environment. Sustainability 2023, 15, 10418. [Google Scholar] [CrossRef]
- Cintura, E.; Faria, P.; Molari, L.; Barbaresi, L.; D’Orazio, D.; Nunes, L. A feasible re-use of an agro-industrial by-product: Hazelnut shells as high-mass bio-aggregate in boards for indoor applications. J. Clean. Prod. 2024, 434, 140297. [Google Scholar] [CrossRef]
- Alves, C.A.; Duarte, D.H.; Gonçalves, F.L. Residential buildings’ thermal performance and comfort for the elderly under climate changes context in the city of São Paulo, Brazil. Energy Build. 2016, 114, 62–71. [Google Scholar] [CrossRef]
- Falegari, S.; Javid, A.A.S. Integrating building information modeling and life cycle assessment to analyze the role of climate and passive design parameters in energy consumption. Energy Environ. 2024, 35, 2078–2106. [Google Scholar] [CrossRef]
- Harkouss, F.; Fardoun, F.; Biwole, P.H. Passive design optimization of low energy buildings in different climates. Energy 2018, 165, 591–613. [Google Scholar] [CrossRef]
- DesignBuilder Software Ltd. DesignBuilder. Available online: https://designbuilder.co.uk/ (accessed on 12 February 2025).
- Dalbem, R.; da Cunha, E.G.; Vicente, R.; Figueiredo, A.; Oliveira, R.; da Silva, A.C.S.B. Optimisation of a social housing for south of Brazil: From basic performance standard to passive house concept. Energy 2019, 167, 1278–1296. [Google Scholar] [CrossRef]
- EnergyPlus™. EnergyPlus. Available online: https://energyplus.net/ (accessed on 12 February 2025).
- Vázquez-Torres, C.E.; Bienvenido-Huertas, D.; Beizaee, A.; Bassam, A.; Torres, M.J. Thermal performance of historic buildings in Mexico: An analysis of passive systems under the influence of climate change. Energy Sustain. Dev. 2023, 72, 100–113. [Google Scholar] [CrossRef]
- EDSL USA, Inc. TAS: Thermal Analysis Software: Purpose-Built, Interoperable Programs that Facilitate Methodical Workflows. Available online: https://www.edsltas.com/about-tas/ (accessed on 12 February 2025).
- Stephan, A.; Crawford, R.H.; de Myttenaere, K. A comprehensive assessment of the life cycle energy demand of passive houses. Appl. Energy 2013, 112, 23–34. [Google Scholar] [CrossRef]
- Cintura, E.; Nunes, L.; Esteves, B.; Faria, P. Agro-industrial wastes as building insulation materials: A review and challenges for Euro-Mediterranean countries. Ind. Crops Prod. 2021, 171, 113833. [Google Scholar] [CrossRef]
- Collet, F.; Mertens, S.; Faria, P. RILEM TC 275-HDB round-robin tests and proposals: Moisture buffer value of vegetal concrete. Mater. Struct. 2025, 58, 36. [Google Scholar] [CrossRef]
- Cintura, E.; Faria, P.; Duarte, M.; Nunes, L. Bio-Wastes as Aggregates for Eco-Efficient Boards and Panels: Screening Tests of Physical Properties and Bio-Susceptibility. Infrastructures 2022, 7, 26. [Google Scholar] [CrossRef]
- Cintura, E.; Faria, P.; Duarte, M.; Nunes, L. Eco-efficient boards with agro-industrial wastes–Assessment of different adhesives. Constr. Build. Mater. 2023, 404, 132665. [Google Scholar] [CrossRef]
- Elmoudnia, H.; Millogo, Y.; Faria, P.; Jalal, R.; Waqif, M.; Saâdi, L. Development of Doum Palm Fiber-Based Building Insulation Composites with Citric Acid/Glycerol Eco-Friendly Binder. J. Compos. Sci. 2025, 9, 67. [Google Scholar] [CrossRef]
- Cintura, E.; Faria, P.; Molari, L.; Barbaresi, L.; D’Orazio, D.; Nunes, L. Characterization of an Arundo donax-based composite: A solution to improve indoor comfort. Ind. Crops Prod. 2024, 208, 117756. [Google Scholar] [CrossRef]
- Bourbia, S.; Kazeoui, H.; Belarbi, R. A review on recent research on bio-based building materials and their applications. Mater. Renew. Sustain. Energy 2023, 12, 117–139. [Google Scholar] [CrossRef]
- Boulebbina, C.; Mebarki, G.; Rahal, S. Passive solar house prototype design with a new bio-based material for a semi-arid climate. Mater. Renew. Sustain. Energy 2022, 11, 1–15. [Google Scholar] [CrossRef]
- Kubiś, M.; Łapka, P.; Cieślikiewicz, Ł.; Sahmenko, G.; Sinka, M.; Bajare, D. Analysis of the Thermal Conductivity of a Bio-Based Composite Made of Hemp Shives and a Magnesium Binder. Energies 2022, 15, 5490. [Google Scholar] [CrossRef]
- Gourlay, E.; Glé, P.; Marceau, S.; Foy, C.; Moscardelli, S. Effect of water content on the acoustical and thermal properties of hemp concretes. Constr. Build. Mater. 2017, 139, 513–523. [Google Scholar] [CrossRef]
- Autodesk Inc. Autodesk Revit: BIM Software to Design and Make Anything. Available online: https://www.autodesk.com/products/revit/overview?term=1-YEAR&tab=subscription (accessed on 12 February 2025).
- Autodesk Inc. Building Performance Analysis: Raised to the Power of the Cloud. Available online: https://gbs.autodesk.com/gbs (accessed on 12 February 2025).
- Autodesk Inc. Better Building Performance: Autodesk® Insight is a Powerful Guide to Better Building Energy and Environmental Performance. Available online: https://insight360.autodesk.com/oneenergy (accessed on 12 February 2025).
- One Click LCA Ltd. Available online: https://oneclicklca.com/ (accessed on 29 January 2025).
- Autodesk Inc. Dynamo Studio. Available online: https://www.autodesk.com/products/dynamo-studio/overview (accessed on 12 February 2025).
- Vettorazzi, E.; Figueiredo, A.; Rebelo, F.; Vicente, R.; Feiertag, G.A. Beyond passive House: Use of evolutionary algorithms in architectural design. J. Build. Eng. 2023, 76, 107058. [Google Scholar] [CrossRef]
- Mazur, Ł.; Szlachetka, O.; Jeleniewicz, K.; Piotrowski, M. External Wall Systems in Passive House Standard: Material, Thermal and Environmental LCA Analysis. Buildings 2024, 14, 742. [Google Scholar] [CrossRef]
- Alvares, C.A.; Stape, J.L.; Sentelhas, P.C.; Gonçalves, J.L.D.M.; Sparovek, G. Köppen’s climate classification map for Brazil. Meteorol. Z. 2013, 22, 711–728. [Google Scholar] [CrossRef] [PubMed]
- de Melo, P.C.; Caldas, L.R.; Masera, G.; Pittau, F. The potential of carbon storage in bio-based solutions to mitigate the climate impact of social housing development in Brazil. J. Clean. Prod. 2023, 443, 139862. [Google Scholar] [CrossRef]
- Rocha, D.L.; Júnior, L.U.D.T.; Marvila, M.T.; Pereira, E.C.; Souza, D.; de Azevedo, A.R.G. A Review of the Use of Natural Fibers in Cement Composites: Concepts, Applications and Brazilian History. Polymers 2022, 14, 2043. [Google Scholar] [CrossRef]
- Coelho, G.B.A.; Faria, P. Reabilitação térmica eco-eficiente de edifícios residenciais no Nordeste do Brasil através de modelação térmica para combater necessidades climáticas futuras. In Proceedings of the Congresso Internacional da Habitação no Espaço Lusófono (5CIHEL 2024), Lisbon, Portugal, 2–4 October 2024. [Google Scholar]
- WUFI®Plus–Thermal, Energy and Moisture Simulation of Buildings, Version 3.1.1.0; Fraunhofer Institute for Building Physics (Fraunhofer IBP): Stuttgart, Germany, 2017.
- Hosamo, H.; Coelho, G.B.; Buvik, E.; Drissi, S.; Kraniotis, D. Building sustainability through a novel exploration of dynamic LCA uncertainty: Overview and state of the art. Build. Environ. 2024, 264, 111922. [Google Scholar] [CrossRef]
- Coelho, G.B.A.; Buvik, E.; Hosamo, H.; Kraniotis, D. Assessing the Global Warming Potential of a Novel Hybrid Timber-Based Façade System Through Life Cycle and Considering Future Climate Conditions. In Proceedings of the International Conference on Net-Zero Civil Infrastructures: Innovations in Materials, Structures, and Management Practices (NTZR), Oslo, Norway, 19–21 June 2024. [Google Scholar]
- The MathWorks, Inc. MATLAB. Available online: https://www.mathworks.com/products/matlab.html (accessed on 29 January 2025).
- Coelho, G.B.A.; Kraniotis, D. A multistep approach for the hygrothermal assessment of a hybrid timber and aluminium based facade system exposed to different sub-climates in Norway. Energy Build. 2023, 296, 113368. [Google Scholar] [CrossRef]
- Henriques, F.M.A. Hygrothermal Behaviour of Buildings, 11.8th ed.; FCT-UNL: Caparica, Portugal, 2016. (In Portuguese) [Google Scholar]
- dos Santos, C.A.P.; Matias, L. U-Value of Building Envelope Elements, ITE 50 20th ed.; LNEC: Lisbon, Portugal, 2014. (In Portuguese) [Google Scholar]
- Badach, J.; Coelho, G.B.A.; Kraniotis, D.; Schild, P. Urban Heat Islands in the Urban built environment: Identification and potential mitigation strategies. In Lecture Notes Civil Engineering; Springer: Berlin, Germany, 2024. [Google Scholar] [CrossRef]
- Coelho, G.; Rebelo, H.; De Freitas, V.; Henriques, F.; Sousa, L. Current and future geographical distribution of the indoor conditions for high thermal inertia historic buildings across Portugal via hygrothermal simulation. Build. Environ. 2023, 245, 110877. [Google Scholar] [CrossRef]
- Meteonorm 8, Global Meteorological Database, Version 8.1.4.25305; WMO: Geneva, Switzerland, 2020.
- Nilsson, P.E.; Abel, E.; Clark, R.; Ekkberg, L.E.; Fahlén, P.; Fanger, P.O.; Fitzner, F.; Gunnarsen, L.; Jagemar, L.; Nielsen, P.V.; et al. Achieving the Desired Indoor Climate: Energy Efficiency Aspects of System Design; Studentlitteratur: Lund, Sweden, 2007. [Google Scholar]
- ISO 7730:2005; Ergonomics of the Thermal Environment–Analytical Determination and Interpretation of Thermal Comfort Using Calculation of the PMV and PPD Indices and Local Thermal Comfort Criteria. International Organization for Standardization (ISO): Geneva, Switzerland, 2005.
- EN 16798-1:2019; Energy Performance of Buildings Ventilation for Buildings: Indoor Environmental Input Parameters for Design and Assessment of Energy Performance of Buildings Addressing Indoor Air Quality, Thermal Environment, Lighting and Acoustics. European Committee for Standardization (CEN): Bruxelles, Belgium, 2019.
- CYPE Ingenieros, S.A. Price Generator. Portugal. Available online: https://geradordeprecos.info (accessed on 19 March 2025).
- Page, J.; Sonebi, M.; Amziane, S. Design and multi-physical properties of a new hybrid hemp-flax composite material. Constr. Build. Mater. 2017, 139, 502–512. [Google Scholar] [CrossRef]

Disclaimer/Publisher’s Note: The statements, opinions and data contained in all publications are solely those of the individual author(s) and contributor(s) and not of MDPI and/or the editor(s). MDPI and/or the editor(s) disclaim responsibility for any injury to people or property resulting from any ideas, methods, instructions or products referred to in the content. |
© 2025 by the authors. Licensee MDPI, Basel, Switzerland. This article is an open access article distributed under the terms and conditions of the Creative Commons Attribution (CC BY) license (https://creativecommons.org/licenses/by/4.0/).