Abstract
Over the past decades, the construction sector has focused strongly on reducing operational energy consumption. Other types of environmental impact that occur during the life span of construction works, however, have to be taken into account as well. This case study focuses on developing scenarios to improve the environmental profile of new buildings in the Flemish/Belgian context. The study takes into account current energy regulation and investigates the influence of energy scenarios and building type on the environmental profile. A life cycle energy assessment (LCEA) and a life cycle impact assessment (LCIA) were carried out for all scenarios, supplemented by a screening life cycle costing (LCC). The results indicate the importance of the compactness of a building, with the best results identified for the terraced scenario. The results are due to the reduced use of materials and, to a smaller extent, a reduction in energy consumption (smaller exposed surface). The results of the energy scenarios show a discrepancy between the LCEA and LCIA. According to the LCEA, passive scenarios are always preferable, but the LCIA results suggest two ways to reach a similar environmental profile. Firstly, by providing a level of insulation based on current regulations complemented with advanced technical services, and, alternatively, by increasing the level of insulation along with standard services. The results of the LCC show a similar trend to those of the LCIA. The results therefore suggest that there are multiple ways to improve the environmental profile of new buildings. Nevertheless, the choice of impact assessment method can have a strong influence on the results.
1. Introduction
According to the United Nations Environment Program’s Sustainable Buildings & Climate Initiative (UNEP–SBCI), buildings are responsible for 40% of global energy use and one third of global greenhouse gas emissions, both in developed and developing countries [1]. The literature has revealed that, in general, most energy consumption occurs during the service life of a building—required for heating, cooling, lighting, etc. This has triggered a strong focus on reducing operational energy demand [2,3]. This growing awareness resulted in several European building regulations, e.g., the Energy Performance of Buildings Directive (EPBD) 2002/91/EC and the revised EPBD 2010/31/EU issued by the European Union [4,5,6]. Although energy consumption is one of the key parameters to be taken into account during building design, other environmental impact categories should be considered as well, such as toxicity, acidification, and the depletion of resources [6]. Since a direct relationship exists between some environmental impact categories and energy, the overall energy consumption of buildings seems to be an appropriate indicator of the environmental performance. In calculating the environmental impact of a building, however, life cycle thinking is receiving more attention, since no relevant conclusions can be drawn about sustainability without taking into account environmental impact during the entire life cycle. One of the most scientifically accepted methodologies to do this is life cycle assessment (LCA), a method that prevents the shifting of environmental burdens across other life cycle phases. When energy consumption alone is considered over the entire life span, this is referred to as life cycle energy assessment (LCEA). The latter is a commonly used method in the last decades [3,7,8]. However, multiple studies emphasize that using energy as the sole indicator for creating an environmental profile of a building and its components is insufficient, especially when considering buildings with low operational energy consumption [9,10,11]. Nowadays, the energy efficiency of newly constructed residential buildings has improved significantly compared to the existing building stock. This reduction in operational energy, however, usually comes with an increased use of materials, an environmental cost that may counteract the benefits [11]. This trend indicates that future buildings will likely consume more materials and less energy, so factors other than energy consumption, e.g., toxicity and land use, will become increasingly important in understanding the environmental impact of new buildings.
To date, plenty of research has been done on materials in case-based comparisons between non-insulated and low energy buildings [2,12,13,14,15]. These comparisons, though, are becoming obsolete when dealing with new residential buildings. Energy regulations impose increasing requirements so a current newly built house already complies with a high level of insulation and high-performing technical services. Therefore, the reference building in this research will be a new dwelling that meets the Flemish energy requirements of 2014, and a comparison will be made relative to a passive scenario. Design parameters, such as building type, can also have a significant influence on the environmental profile of a building, but to date research including this parameter in analysis is sparse.
So, the first goal of this research is to investigate the importance of the choice of building type on the overall environmental impact.
The second goal is to assess possible improvements based on technical services for heating and ventilation.
This study further investigates whether methodological choices have an influence on the outcome of the optimization process. Design optimizations based on a life cycle energy assessment (LCEA) are compared with a life cycle impact assessment (LCIA) endpoint method.
Finally, a screening of the costs of the selected design optimizations is performed to test whether the additional investments are also financially beneficial.
2. Background
2.1. Life Cycle Environmental Performance
In current practice LCAs are executed according to the framework of the ISO 14040 series [16]. In order to analyze the environmental burdens of processes, products, or services during its entire life cycle and to make it possible to compare different studies, four steps apply: goal and scope, life cycle inventory (LCI), life cycle impact assessment (LCIA), and an interpretation [17,18,19,20]. The first step, goal and scope, defines purpose, objectives, functional unit, and system boundaries. One of the strengths of LCA is in defining investigated products, processes, or services based on their function instead of on their specific physical characteristics. This way, products can be compared that are inherently different but that fulfill a similar function, e.g., different insulation materials with an equal thermal performance [12]. The second step (LCI) consists of collecting, as well as describing and verifying, all data regarding inputs, processes, emissions, etc. of the whole life cycle. In the third step (LCIA), environmental impacts and used resources are quantified, based on the inventory analysis. The fourth and final step involves the interpretation of the results [16,18].
If only energy is considered as an indicator of the environmental profile, it is referred to as life cycle energy assessment (LCEA) and cannot be considered as a LCIA method. In general, the total life cycle energy is subdivided into embodied energy, operational energy, and energy for end-of-life treatment [6,8,9,21]. The embodied energy (EE) takes into account all energy required for extraction, production, transportation, and on-site construction, both of the materials of the initial construction and expected replacements during the use phase of the building. Some researches include feedstock energy as well, i.e., the upper or lower caloric value of the material [22]. Operational energy (OE) includes all energy required during the entire use phase e.g., for heating, ventilation, cooling, and lighting. Finally, when a building is demolished after its useful lifespan, end-of-life treatment must be taken into account as well, including possible benefits related to recycling, reuse, or energy recuperation during incineration. Such benefits are sometimes referred to collectively as recycling potential, which expresses the amount of embodied energy that can be made useful after demolition [23]. LCEA has proved its relevance for developing design optimization scenarios [15,24,25]. However, due to the development of multiple life cycle impact methods taking into account other environmental impact categories as well, today it is mainly considered to be useful only “to get a general view of the energyrelated environmental impacts in a life cycle and for a first comparison of individual products” [26].
Results of LCA studies depend to a great extent on the definition of the goal and scope, i.e., assumptions, system boundaries, scenarios, etc. To improve comparability of these results, for the construction sector in particular, a new wave of standardization was established and is still ongoing. The CEN Technical Committee 350 “Sustainability of construction works” (CEN TC 350) is developing standards for assessing all three aspects of sustainability (economic, ecological, social) both for new and existing construction works and for facilitating the integration of Environmental Product Declarations (EPDs) of construction products. At the same time, another part of the European Commission, the Directorate-General Environment, is developing Product Environmental Footprints (PEFs), which are applicable to all sectors albeit with specific sector-based Product Category Rules (PCR). The goal of this initiative is to establish a common methodological approach to enable Member States and private sector actors to assess, display, and benchmark the environmental performance of products, services, and companies [27].
A final remark related to the LCA methodology concerns the many approaches available to calculate the environmental impact during the LCIA. These include: single issues (carbon footprint, USEtox), midpoint methods (ILCD, ReCiPe), and endpoint methods (ReCiPe, CML). The first type is generally considered as rather limited and mainly useful for screening studies [26]. Midpoint methods, on the other hand, are in general considered more scientifically accurate as they take into account more environmental impact categories, but comparing results between two or more functionally equivalent solutions is often indecisive. Resulting solutions are almost never characterized by minimum impact results for all impact categories, so often a single score endpoint method is used for the evaluation of results. This last introduces considerable uncertainty to the result since value choices are involved during the weighting process, but the final result is a single score, making comparison easier [26,28]. Since this research focuses on a comparative assessment of multiple scenarios with various properties, we have opted for a single score LCIA method, which will be described in greater detail in Section 3.
Much research has been carried out related to the application of LCA in the construction sector, ranging from a focus on materials to entire buildings and their surroundings [2,6,8]. Since this research is a case study of an entire building, a discussion of previous work on product- or component-level LCAs is beyond the scope of this paper. Existing case studies often focus on optimizing current residential buildings compared with low-energy houses (LEH) or passive houses. An overall trend is the dominance of the use phase, mainly with respect to space heating and cooling demands [29,30,31,32,33,34]. Most of the optimization scenarios focus on improving the level of insulation, complemented with high-performance technical installations. Blengini and DiCarlo investigated a low-energy dwelling in Italy and found that although the operational energy was 10 times lower compared to the reference standard house, the total environmental impact was only reduced by a factor two [11]. Himpe et al. analyzed different scenarios for designing a zero-energy house in Belgium. They concluded that there was potential for reducing the non-renewable life cycle energy by 50% based on “a combination of the durable design of the building and a conscious selection of all construction materials and building services in practice” [9]. Another recent Belgian study by Stephan et al. pointed out that a passive house was preferable to a standard one, even if the embodied energy exceeds the operational energy [35,36].
A few studies have gone beyond a merely technical optimization to take building type and design into account as well. Verbeeck and Hens compared Belgian residential building types and developed non-insulated, standard insulated (requirements of 2006), and passive scenarios. For energy optimizations the passive scenarios scored best, but after analysis of different building types and designs the conclusions were less clear due to the different characteristics of each case [37,38,39]. Similar conclusions were drawn by Allacker, whose research reveals a great potential for improving the environmental profile through building design [40]. Rickwood, in contrast, demonstrated that the differences of life cycle energy between building types are rather small, since the energy benefits are often diminished due to the increased embodied energy related to structural requirements [41].
The literature lacks studies investigating the potential for improvement based on current energy regulations as reference (almost LEH) instead of outdated regulations or non-insulated dwellings or taking a closer look at the influence of building type on the environmental profile without the distortion of case-specific design parameters.
2.2. Life Cycle Economic Performance
As a concept, sustainability covers more than environmental issues; financial consequences of design decisions beyond initial investment must also be taken into account. Although both life cycle costing (LCC) and LCA are commonly applied, the combination of both in a building-related context is less common [42,43,44,45]. Similar to the LCA and LCEA methodology, LCC is the sum of all potential costs throughout the life cycle, expressed in present value monetary units. The calculation of the present value of future costs depends on inflation, cost of capital investment opportunities and personal consumption preferences. Future investment, such as maintenance and repair, can be taken into account by introducing a discount rate. For example, a discount rate of 0% means the timing of investments and costs does not matter, while higher discount rates indicate more importance given to the near-present [46]. Also, growth rates, independent of interest or inflation, have to be taken into account.
Two previous Belgian studies relevant to this research have combined economic and environmental analysis. Verbeeck developed a genetic algorithm to investigate environmental/economic optima, displayed as a Pareto-front. The optimal result was found to be a dwelling with a level of insulation equal to a low-energy or passive house combined with a condensing gas boiler [37]. Allacker added cleaning and maintenance costs as well and pointed out a discrepancy between environmental optima (reduction of the heating demand) and economic optima (optimizing cleaning and maintenance costs) with existing buildings as reference [40]. However, as mentioned in the previous section, both studies focused on developing optimization scenarios starting from the existing building stock or outdated energy regulations.
3. Methods
3.1. Case Study and Scenarios
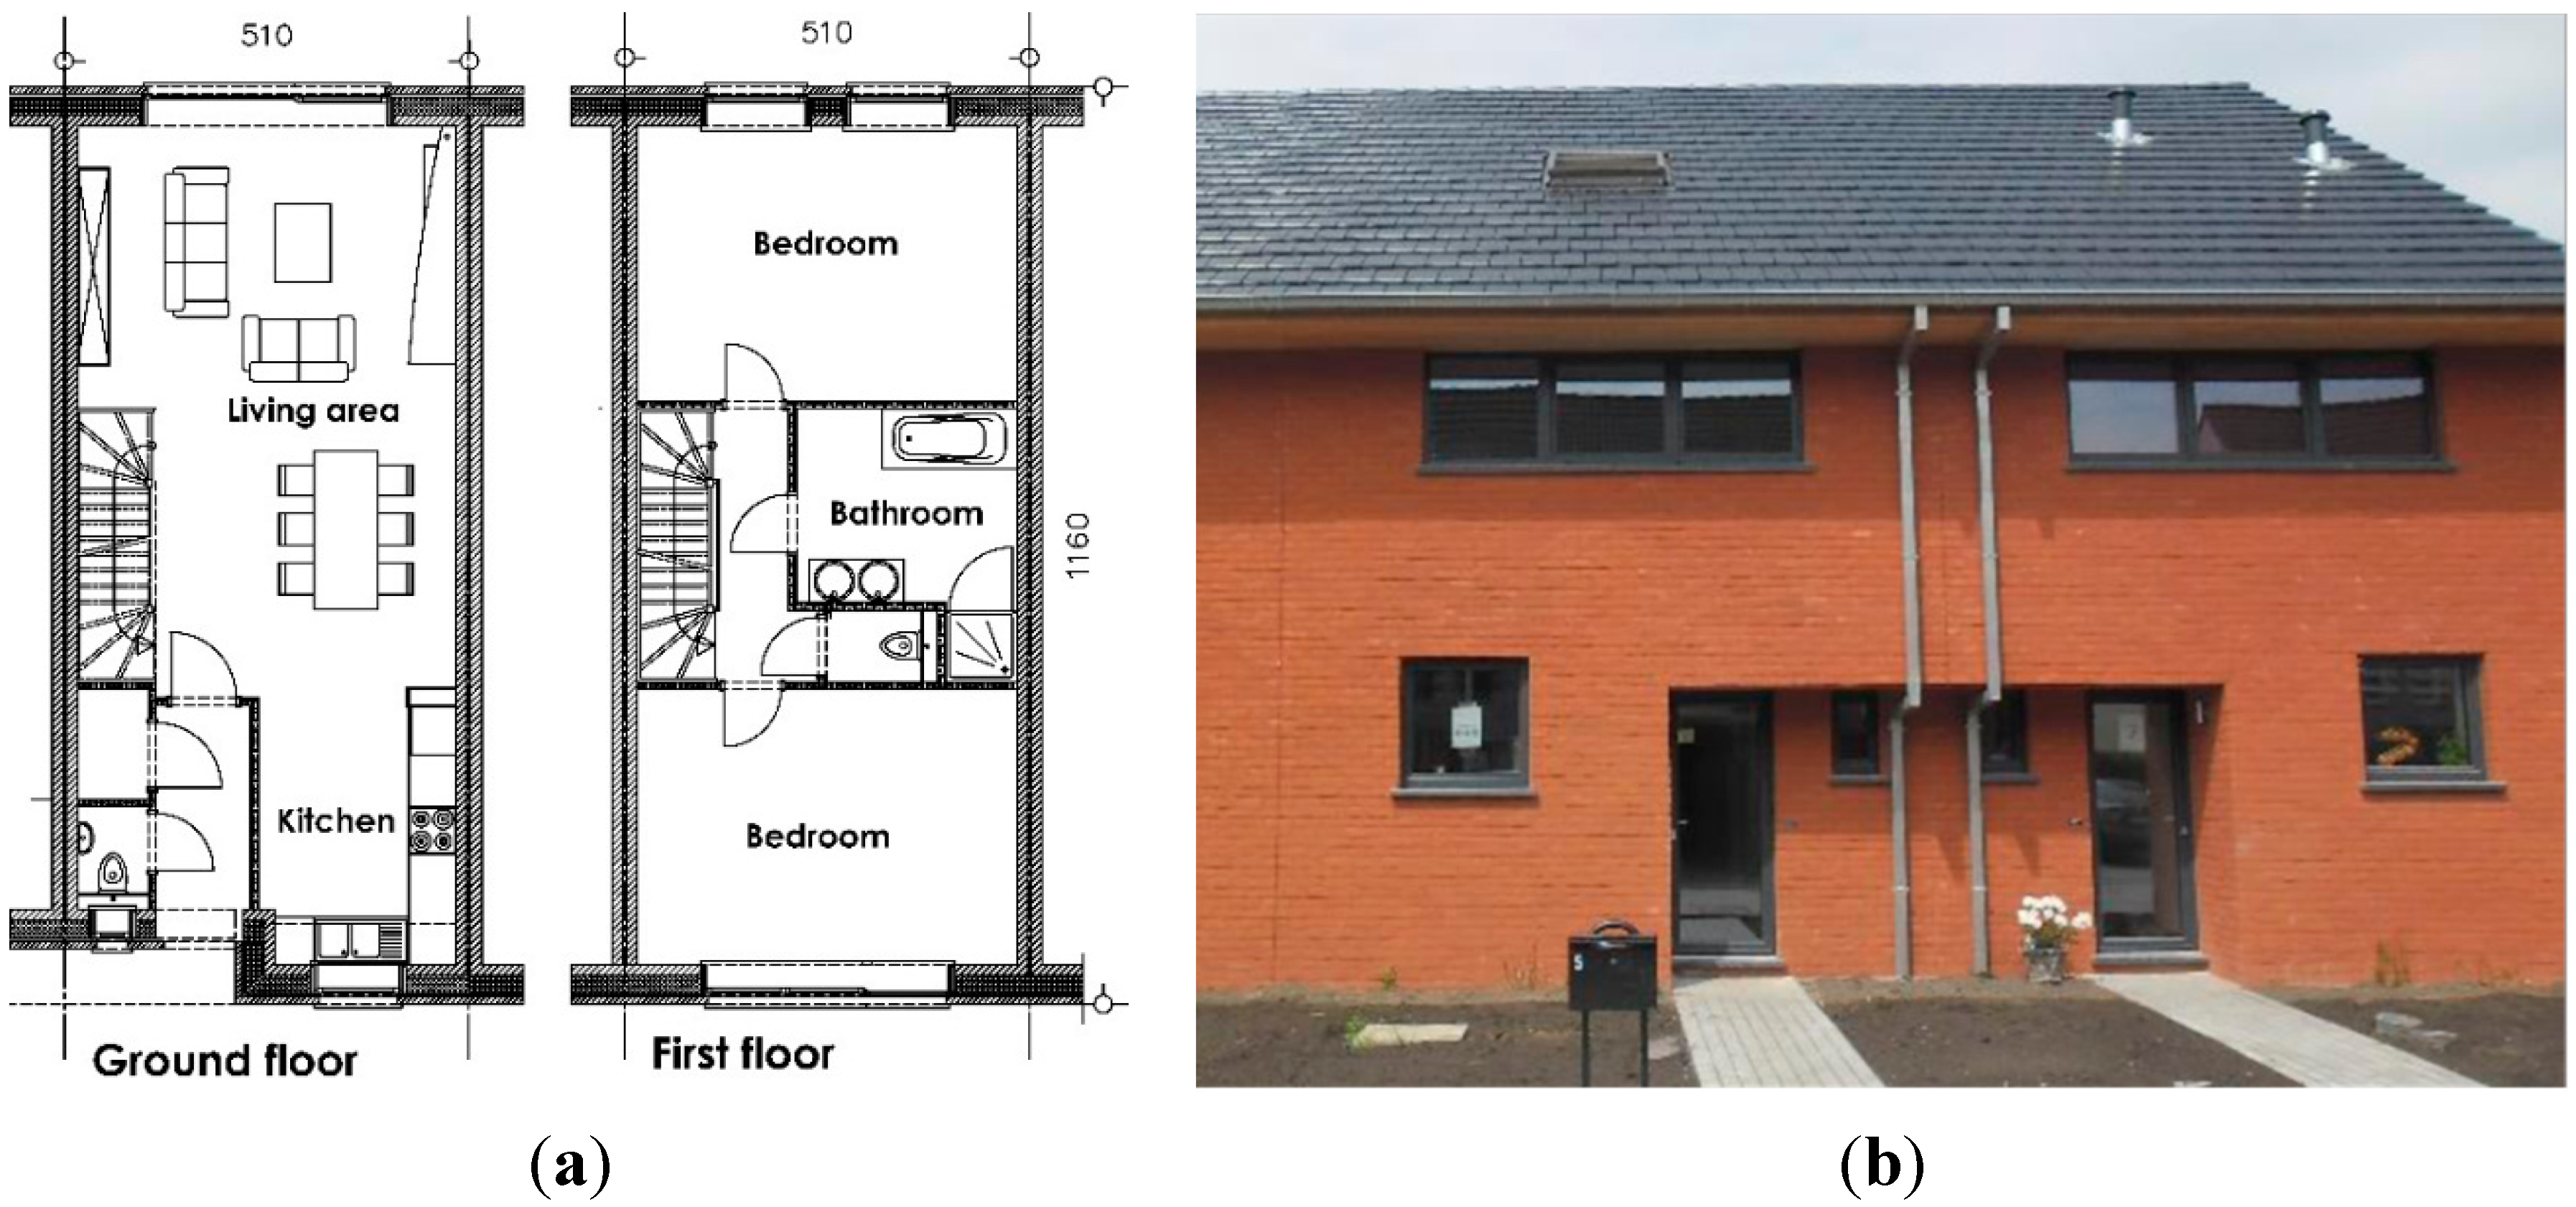
As described in Section 1, the main goal of this research is to develop optimization scenarios to improve the environmental performance of a representative Flemish dwelling based on current Flemish energy regulations [47,48]. The case study where these optimization scenarios have been applied is part of a new development located in Niel in the north of Flanders, Belgium. This development consists of a series of housing groups, each composed of three connected dwellings. The dwellings have a net floor surface of 117 m2, distributed over two floors and a habitable attic, and can accommodate four people. The main façade is oriented to the East (see Figure 1). This dwelling is considered to be representative since the average size of new buildings in Belgium is approximately 102–107 m2 for the period 2008–2014 [49]. In the same period the yearly average share of new buildings is approximately 0.7%. About 80% of the current Flemish building stock consists of single-family dwellings, though only 50% of the new buildings are single family dwelling [49,50]. The dwelling under study has three bedrooms, comparable to 50% of the Flemish single family dwellings [50]. The dwelling is constructed in line with Belgian building tradition, consisting of a massive structure with load-bearing masonry brick walls, an air cavity and brick façade, concrete floor slabs and pitched roof. All buildings in the urban development are constructed according to the passive house standards. Moreover, all included research scenarios are derived from the actual situation and are, in fact, simulations with a recalculation of the amount of materials, type of technical services, and energy consumption.

Figure 1.
(a) Floor plans; (b) View of front façade.
Figure 1.
(a) Floor plans; (b) View of front façade.
To develop scenarios for improving the environmental profile of a dwelling, a functional unit considering the entire building is required. In line with other Belgian research, the estimated lifespan of the building in its entirety is 60 years, though individual components can have a shorter service life [9,10,51]. All scenarios that have been developed take into account the same functional unit (net surface, total life span, and comfort requirements). The investigated scenarios can be divided into two groups: on the one hand the passive scenarios, in line with the real situation, and on the other hand the standard scenarios with adjusted levels of insulation and technical services in line with current energy regulations [52]. Details concerning the differences between these groups are listed in Table 1. As a result of the outcome of Section 2, for both the standard and the passive version two possible parameters for improvement have been included: building type and technical services. Three different building types are included (terraced, semi-detached, and detached) as well as six energy scenarios (see Table 2). The three building types together account for 80% of current building stock; the energy scenarios focus on the most applied services in Belgium [50]. A more extensive set of building designs and technical services would provide a more complete image, but this is beyond the scope of this research since many external factors such as local regulation, location, and orientation play a crucial role during the design process. The analysis considers the standard terraced variant as the reference scenario.

Table 1.
Composition building elements.
| Building Element | Composition | Total Thickness | U–Value |
|---|---|---|---|
| Floor slab | Standard: in situ reinforced concrete slab, PUR, screed, ceramic tiles | 0.3 m | 0.28 W/(m2·K) |
| Passive: in situ reinforced concrete slab, PUR, screed, ceramic tiles | 0.49 m | 0.1 W/(m2·K) | |
| Cavity | Standard: gypsum plaster, brickwork, EPS, air cavity, brick façade stone | 0.38 m | 0.23 W/(m2·K) |
| wall | Passive: gypsum plaster, brickwork, EPS, air cavity, brick façade stone | 0.5 m | 0.12 W/(m2·K) |
| Pitched roof | Standard: gypsum plasterboard, timber frame, glass wool (between rafters), ceramic roof tiles | 0.21 m | 0.22 W/(m2·K) |
| Passive: gypsum plasterboard, timber frame, glass wool (between rafters), EPS (above rafters), ceramic roof tiles | 0.36 m | 0.1 W/(m2·K) | |
| Windows | Standard: PVC frame, double glazing | - | 1.68–1.75 W/(m2·K) |
| Passive: PVC frame, triple glazing | - | 0.82–0.83 W/(m2·K) |
Table 2.
Energy scenarios.
| Energy Scenarios | Yearly Energy Demand | Space Heating and Hot Water Production | Ventilation | Airtightness-Leakage Rate |
|---|---|---|---|---|
| Standard: Standard terraced dwelling (reference) | 41,370 MJ | Condensing gas boiler with solar collector | mechanical extraction | 0.79 m3/(m2·h) |
| Standard Alt. 1: Standard terraced dwelling with heat pump | 12,543 MJ | Vertical heat pump | mechanical extraction | 0.79 m3/(m2·h) |
| Standard Alt. 2: Standard terraced dwelling with gas boiler only | 47,857 MJ | Condensing gas boiler | mechanical extraction | 0.79 m3/(m2·h) |
| Passive: Passive terraced dwelling | 9621 MJ | Vertical heat pump | balanced system with heat recovery | 0.79 m3/(m2·h) |
| Passive Alt. 1: Passive terraced dwelling with gas boiler and solar collector | 14,956 MJ | Condensing gas boiler with solar collector | balanced system with heat recovery | 0.79 m3/(m2·h) |
| Passive Alt. 2: Passive terraced dwelling with gas boiler only | 22,525 MJ | Condensing gas boiler | balanced system with heat recovery | 0.79 m3/(m2·h) |
The alternative technical services are applied to the terraced version of the dwellings (see Table 2 for the description of the scenarios). In the reference standard scenario, space heating and domestic hot water production are provided by a condensing gas boiler and a solar collector. The latter is necessary because of renewable energy requirements according to Flemish energy regulations (EPB). A mechanical ventilation unit is in place for extraction purposes only, with a natural supply of fresh air. In the basic passive scenario, space heating and hot water are produced by a vertical earth-water heat pump with a seasonal performance factor (SPF) of 4.06, consuming electricity from the Belgian grid. The ventilation demands are covered by a balanced system, with mechanical supply and extraction, including a unit for heat recovery. For both the standard and the passive version, two alternative energy scenarios have been investigated. For the standard version, the alternatives consist of (1) substituting the gas boiler and the solar collector with a heat pump similar to the baseline passive scenario and (2) omitting the solar collector of the base case to reduce investment costs. The alternatives for the passive house consist of a substitution of the heat pump by (3) a traditional condensing gas boiler and (4) a gas boiler with a solar collector. The impact on other building components is assumed to be negligible since the floor heating system remains the same for all scenarios.
3.2. Research Structure
The framework described in the ISO 14040 series is rather generally valid and applicable to all kinds of studies. Therefore it was decided to use, in addition to the ISO 14040 series, other reference works to improve the comparability of this study, in particular with other recent Belgian studies. Firstly, the attributional approach has been opted for since the main purpose is micro-level decision support (Situation A in the ILCD handbook) [53].
The modular framework developed by CEN TC 350 has a similar purpose to the ISO 14040 series and has served as a second reference work. We opted to include all mandatory modules as defined in the standards EN 15804 and EN 15978: production and construction (A), use (B), and end of life stage (C) [54,55]. However, module D (concerning recycling and reuse) has an inherently different modeling logic and is excluded to prevent confusion; see Section 3.5 for more details. The life cycle energy and life cycle environmental impact are defined in Formulas 1 and 2. It is important to note that EN 15804 does not allow for aggregation of results and EN 15978 only allows it when all modules are included. Since the main goal of this research is to compare the environmental impact and energy use over the entire life cycle, the different results per life cycle stage (modules) are summarized. More details about the included modules can be found in the next sections.
where:
- -
- LE: total energy consumption over the entire life cycle
- -
- LEI: total environmental impact over the entire life cycle
- -
- Ex/EIx: energy use / environmental impact within life cycle stage x
- -
- A1–3: production of construction materials (cradle-to-gate)
- -
- A4: transport to and from construction site
- -
- B4: replacement of components during the use phase
- -
- B6: operational energy during the use phase
- -
- C2: transport to disposal/treatment facilities
- -
- C3: waste processing
- -
- C4: final disposal
A third reference, the Public Waste Agency of Flanders (OVAM) report “Environmental profile of building elements” (referred to as MMG, based on the original Dutch title) has been used to ensure comparability with other Flemish studies [10]. This study aims at providing environmental profiles of building components. It is an attributional study mainly following CEN TC 350, but with an extended set of midpoints. The most important aspect of the MMG study for this research is its data on transport and end-of-life scenarios (ratio incineration, recycling, landfill and additional treatments, etc.) representative for the Flemish/Belgian context.
Despite the guiding ILCD handbook and standards described in the previous paragraphs, some assumptions related to system boundaries and data collection have not yet been defined. A first approach is a bottom-up process LCA, which takes into account all processes directly related to the system under study. The advantage of this approach is its accuracy; the disadvantages are incompleteness and multiple types of truncation errors occur. In contrast, input-output (I-O) analysis is based on data that map the flow of goods between sectors of an economy. As a consequence, it is complete but not specific. Hybrid LCA includes the completeness of the I-O approach, but replaces generic data with specific process data (when available), thus combining the strengths of both approaches [56,57,58,59,60]. A deeper discussion on this topic can be found in [61,62,63], but it is beyond the scope of this study. Previous research has found that the differences between process and hybrid I-O LCI can be as high as 80% of the total embodied energy. The main difference comes from filling up gaps in the process data, while 20% comes from other non-process-related sources [63]. Lenzen and Treloar indicate a similar discrepancy, though the conclusions of the comparison of wood vs. concrete structures remained the same [62]. Fay et al. conclude that additional insulation was mainly justified from an economic point of view and such an action only creates a small environmental benefit [64]. The authors are aware of this discrepancy, but to maintain comparability with the other Flemish studies have opted to work with data from the process-based database Ecoinvent 3.1.
The environmental impact of all different scenarios is calculated separately with two impact methods: Cumulative Energy Demand (CED) and ReCiPe Endpoint method with a hierarchist perspective (1.10). The first method takes energy consumption into account during the entire life cycle and is also referred to as life cycle energy assessment (LCEA). Despite the fact that this method neglects other kinds of impacts, it is still frequently applied. Six characterization categories are included based on the different primary energy carriers, of which three consider renewable sources and the other three non-renewable sources. Afterwards the scenarios are evaluated with the ReCiPe method as well, wherein the hierarchist perspective is applied since it is considered as the default model. This method, created by RIVM, CML, PRé Consultants, Radboud Universiteit, and CML-IA, implements both midpoints (problem-oriented approach; impact categories) and endpoints (damage-oriented approach; damage categories). The three endpoint categories (damage to human health, ecosystems, and resource availability) are normalized, weighted, and aggregated into a single score [65]. Finnveden et al. compared the midpoint and endpoint approaches and found that “[…] an advantage of midpoint approaches is that they make it possible to give consideration to the precautionary principle and give an extra weight to uncertain and partly unknown aspects […] in contrast to endpoint modelling which typically will give no consideration to impacts which cannot be modelled and thus are more uncertain and unknown” [66]. Lenzen quantified the uncertainty ranges and found that when endpoints are too uncertain to draw conclusions, a step back to more reliable midpoints can improve the validity of the results. However, “uncertain endpoint damages may tell as little as more certain but less relevant midpoint numbers” [67]. Despite the known limitations of single score endpoint methods, a more comprehensive image of the environmental profile is created compared to LCEA, since they consider a wide set of characterization categories (16 in this case) [68]. In the following sections, all data for the scenarios according to the two impact methods are presented in absolute values. However, since each impact method makes use of its own unit of measurement, all comparisons are expressed in terms of percentages, with the standard terraced dwelling as a reference unless otherwise stated.
3.3. Quantifying Impacts of Initial Construction
The construction team delivered all data concerning the actual situation and the other data were simulated accordingly. Table 3 displays a summarized and aggregated version of the bill of quantities of the standard terraced dwelling. As for the used materials (A1–3), the production mix of Western Europe is considered to be representative of the Belgian construction market. In case only data for other regions were available, the top level was harmonized by adapting energy mixes. The potential benefits of recycling and reuse were taken into account in this stage, considering the amount of recycled content in current market mixes to quantify the recycling potential. Transport scenarios (A4) were derived from the MMG study and consider generic scenarios for the Belgian context. Impact related to the erection of the building (A5) was neglected since its contribution to the overall impact is considered to be negligible [10].
Table 3.
Summary bill of quantities of the standard terraced dwelling
| Material | Total Mass |
|---|---|
| Masonry | 93,204 kg |
| Concrete | 122,608 kg |
| Steel | 2,882 kg |
| Insulation | 799 kg |
| Plastics | 190 kg |
| Windows and glazing | 12,747 kg |
| Wood | 1,146 kg |
| Finishing products | 4,887 kg |
| Technical installations | 1,498 kg |
| Others | 4,455 kg |
3.4. Quantifying Operational Impacts
In order to calculate the operational impacts, some simplifications have been made. This applies in particular if the modules are identical for all scenarios, such as maintenance, refurbishment, and water consumption (B2, B5. and B7) or if their influence is considered to be negligible, e.g., the normal use of the dwellings (besides operational energy) (B1) and repair (B3) [10]. The replacement of components (B4) and operational energy (B6) are taken into account since they are directly related to the topic of this research. For replacements, the same inventory data are applied as in module A. The replacement rates are based on the expected service life as described by BCIS [69].
The energy calculations were carried out by using EPB software Flanders (version 1.8.3), a static calculation tool used to verify compliance with the energy requirements. Research by Janssens and Delghust showed a discrepancy between the calculated and measured energy consumption when using this software. The biggest contribution to the deviation was mainly caused by user behavior and the use of default values for air infiltration [70]. In this research, the measured air infiltration is used instead of the default values, so it is assumed that the calculations are sufficiently accurate. User behavior can indeed influence the results to a great extent, but this deviation is assumed to be equal for all scenarios. In contrast to module A, the energy consumption during the use phase is directly linked to the Belgian context, so the Belgian energy mix (including imports) is used instead of the Western Europe mix.
3.5. Quantifying End-of-Life Impacts
In line with the modeling assumptions of CEN TC 350, end-of-life (EOL) and recycling are determined using a cut-off approach and the benefits and burdens of recycled products are assigned to the production phase (recycled content). As defined in EN 15804 and EN 15978, current technology is applied when calculating future impacts of waste treatment, both for replacements and the final disposal after 60 years [54,55]. The optional and separate module D, which contains information on possible benefits of recycling at the end of the life cycle, is excluded to avoid confusion. This module relies on the concept of system expansion (or avoided products) in contrast to the other three modules.
Impacts related to the demolition of the building (C1) are included but not displayed separately, as their influence is negligible. Similar to module A again, data from the MMG study have been derived concerning scenarios for transport (C2) and treatment (C3 and C4). In the graphs, the end of life is displayed in its entirety in order to enhance the comprehensibility of the figures. Even though it is current practice in Belgian, heat recovery during incineration has not been taken into account since it is part of module D.
3.6. Calculating Economic Costs
In this study all material, construction, and demolition costs are retrieved from ASPEN, a construction-cost database for Flanders [71]. In line with the Belgian SuFiQuaD project a discount rate of 2% is applied for replacement and maintenance cost [72]. For energy-related costs, future price predictions are derived from the “Annual Energy Outlook 2014, with projections to 2040” [73]. In addition, we have opted to work with real values (or present values) instead of nominal values, thereby taking into account the expected inflation and interest rates over time.
4. Results
4.1. Environmental Analysis
The first possibility for optimization is adapting the building type of the dwellings, depending on the degree of attachment with neighboring buildings. The results are presented in Table 4 and Table 5 and Figure 2 and Figure 3 and show a clear increase in the environmental impact if a dwelling is less connected with its neighbors. The explanation is twofold and similar for both impact methods. Firstly, the larger the exposed surface, the bigger the energy losses. Secondly, an external wall requires more material compared to a party wall because there are no requirements for facing bricks nor for insulation. For the alterations of the passive version, the changes in energy consumption are quite low and thus differences in impact are mainly due to a different amount of required material. This underlines the increasing importance of a thoughtful selection of construction materials.
Table 4.
Analysis by building type–ReCiPe.
| Scenario | Construction (Pt) | Use (Pt) | EoL (Pt) | Total (Pt) | Difference to Base | |||
|---|---|---|---|---|---|---|---|---|
| Standard Terraced | 4,561 | 20.2% | 17,262 | 76.3% | 803 | 3.5% | 22,627 | 0.0% |
| Standard Semi-detached | 5,357 | 20.7% | 19,613 | 75.8% | 920 | 3.6% | 25,889 | 14.4% |
| Standard Detached | 6,021 | 21.5% | 21,008 | 74.9% | 1,029 | 3.7% | 28,058 | 24.0% |
| Passive Terraced | 4,803 | 39.2% | 6,546 | 53.4% | 905 | 7.4% | 12,254 | −45.8% |
| Passive Semi-detached | 5,483 | 40.8% | 6,924 | 51.6% | 1,017 | 7.6% | 13,423 | −40.7% |
| Passive Detached | 6,332 | 43.6% | 7,030 | 48.4% | 1,163 | 8.0% | 14,526 | −35.8% |
Table 5.
Analysis by building type–CED.
| Scenario | Construction (GJ) | Use (GJ) | EoL (GJ) | Total (GJ) | Diffefernce to Base | |||
|---|---|---|---|---|---|---|---|---|
| Standard Terraced | 552.8 | 13.4% | 3,465.9 | 84.3% | 94.8 | 2.3% | 4,113.5 | 0.0% |
| Standard Semi-detached | 661.5 | 14.1% | 3,926.3 | 83.6% | 106.5 | 2.3% | 4,694.4 | 14.1% |
| Standard Detached | 731.0 | 14.5% | 4,197.6 | 83.2% | 119.5 | 2.4% | 5,048.2 | 22.7% |
| Passive Terraced | 618.3 | 21.4% | 2,169.5 | 75.2% | 98.1 | 3.4% | 2,886.0 | −29.8% |
| Passive Semi-detached | 714.1 | 22.9% | 2,303.0 | 73.7% | 107.7 | 3.4% | 3,124.8 | −21.1% |
| Passive Detached | 820.8 | 25.0% | 2,343.6 | 71.3% | 121.7 | 3.7% | 3,286.2 | −16.4% |
Although the same trends can be observed when comparing building types according to the two impact methods, there are some substantial differences as well, e.g., in results for the same building type. The first difference is the share of the use phase, which is significantly higher according to CED (around 83% vs. 75% for the standard scenarios, and around 74% vs. 51% for the passive scenarios). The impact of the use phase is mainly due to energy consumption. So it is obvious this is emphasized more by CED while (non-energy-related) impacts in ReCiPe assigned to building materials induce a much higher overall impact of the construction phase, which results in a reduction of the relative share of the use phase. However, not only is the distribution over the life cycle stages different for both impact methods, differences between the main versions exist as well (standard vs. passive). The passive scenario shows a decrease in impact of more than 45% for ReCiPe with respect to the reference standard scenario, compared to only 30% for CED. This can be explained by the differences between the characterization factors per method. It will be discussed in more detail at the end of this section.

Figure 2.
Graph building type–ReCiPe. For detailed description labels, see Section 3.2.
Figure 2.
Graph building type–ReCiPe. For detailed description labels, see Section 3.2.
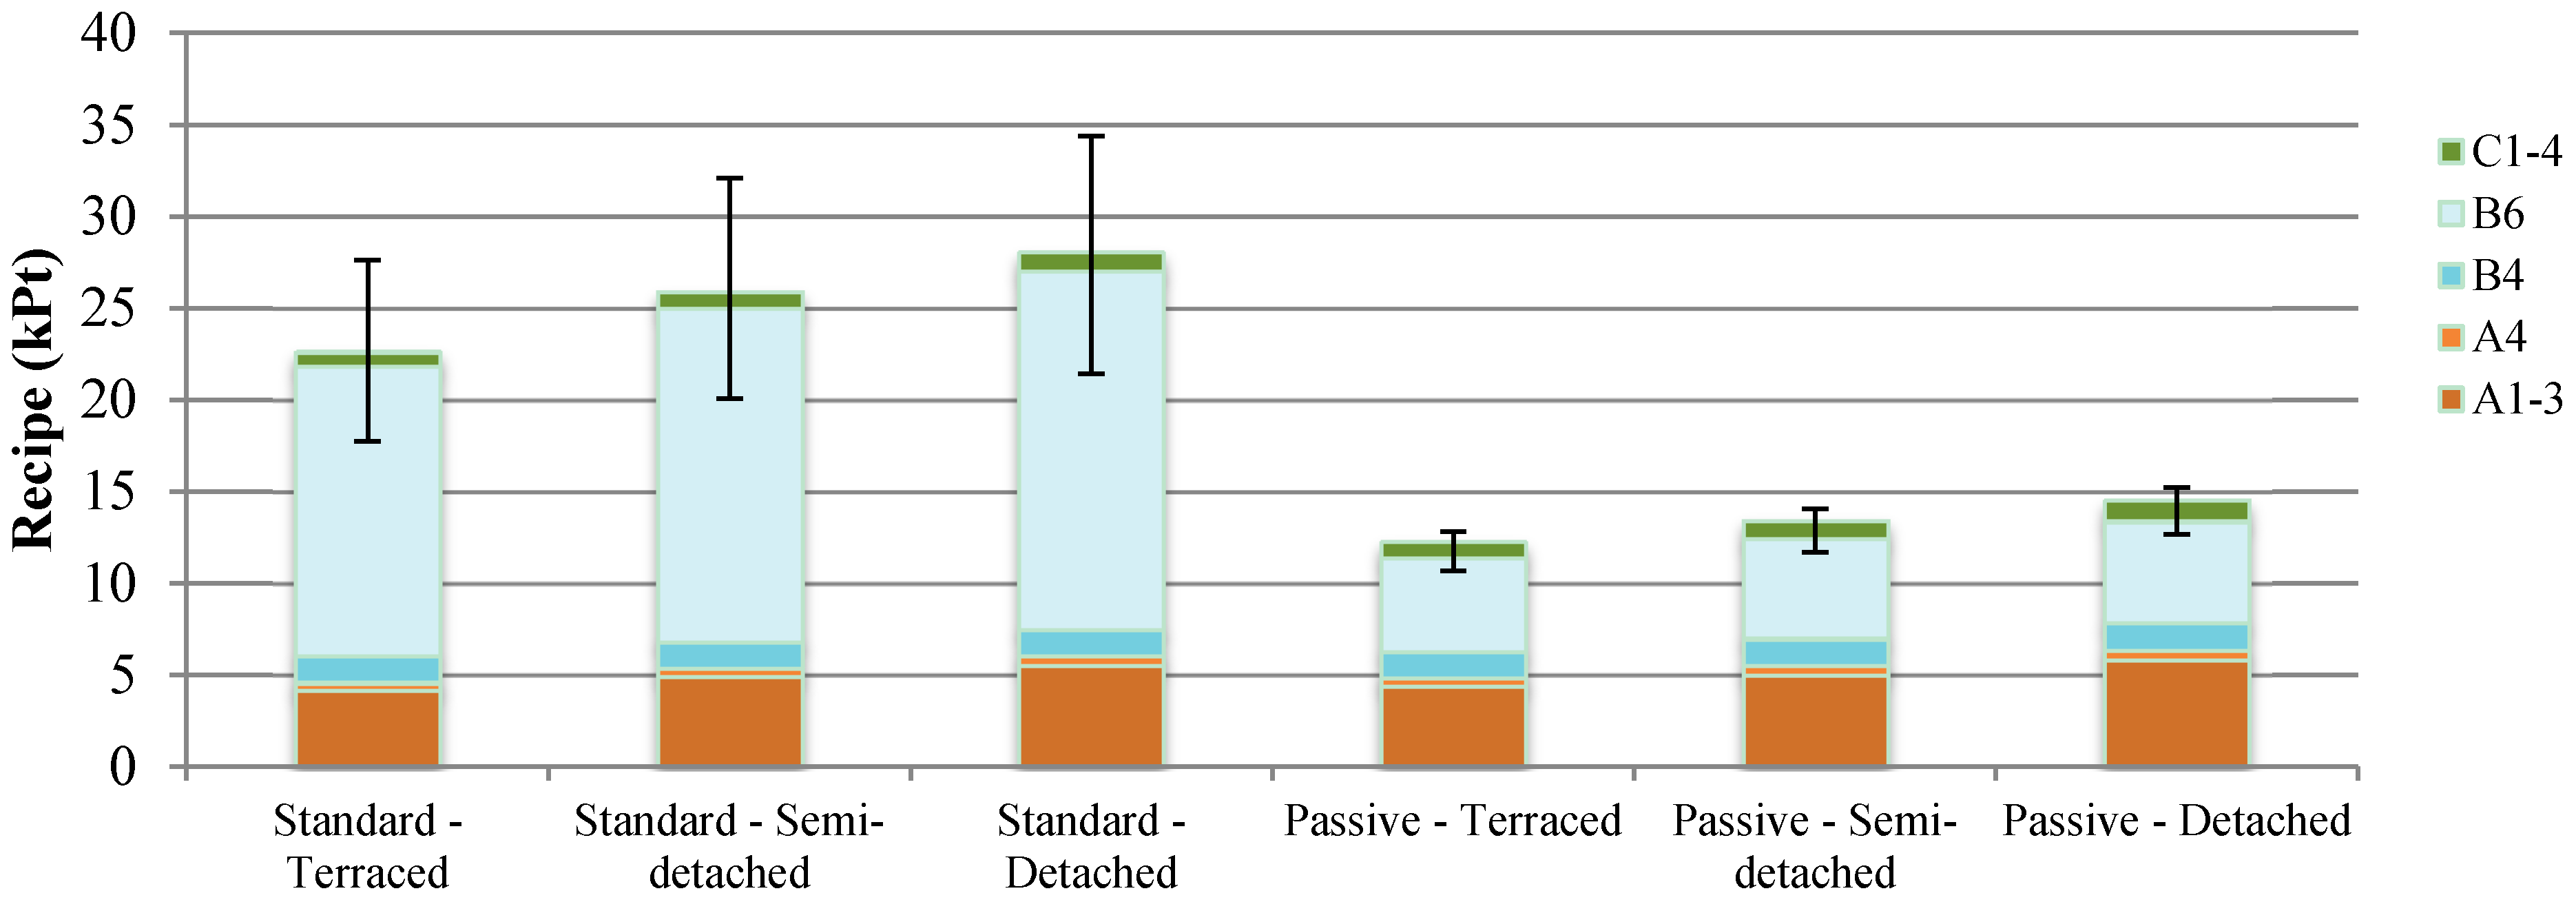
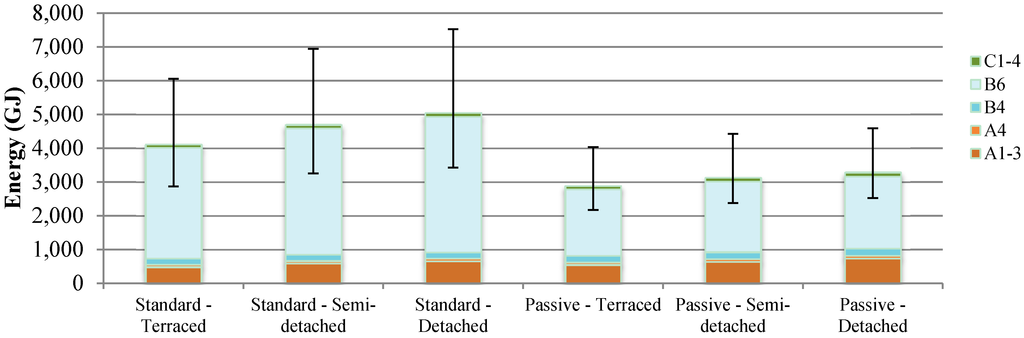
Figure 3.
Graph building type–CED. For detailed description labels, see Section 3.2.
Figure 3.
Graph building type–CED. For detailed description labels, see Section 3.2.

A second way to reduce environmental impact may be initiated by the use of alternative technical services, listed in Table 2. Looking at the results for the alternatives according to the two impact methods, it is clear that no overall trend can be identified in contrast to the analysis of the building type (see Table 6 and Table 7 and Figure 4 and Figure 5). The only similarities are the smaller fluctuations of the passive compared to the standard scenarios. An increased level of insulation reduces energy demand, so the potential benefits of efficient technical services are lower in the case of the passive scenarios. In the next paragraphs, the results according to ReCiPe will be discussed first, followed by the CED results. Afterwards the mutual differences will be examined more in detail.
Table 6.
Analysis of energy scenarios–ReCiPe.
| Scenario | Construction (Pt) | Use (Pt) | EoL (Pt) | Total (Pt) | Difference to Base | |||
|---|---|---|---|---|---|---|---|---|
| Standard | 4,561 | 20.2% | 17,262 | 76.3% | 803 | 3.5% | 22,627 | 0.0% |
| Standard Alt. 1 | 4,493 | 33.8% | 7,972 | 60.1% | 809 | 6.1% | 13,275 | −41.3% |
| Standard Alt. 2 | 4,439 | 17.9% | 19,573 | 78.9% | 803 | 3.2% | 24,814 | 9.7% |
| Passive | 4,803 | 39.2% | 6,546 | 53.4% | 905 | 7.4% | 12,254 | −45.8% |
| Passive Alt. 1 | 4,871 | 36.1% | 7,710 | 57.2% | 899 | 6.7% | 13,480 | −40.4% |
| Passive Alt. 2 | 4,748 | 29.5% | 10,426 | 64.9% | 899 | 5.6% | 16,074 | −29.0% |
For the description of the scenarios, see Table 2.
Table 7.
Analysis of energy scenarios–CED.
| Scenario | Construction (GJ) | Use (GJ) | EoL (GJ) | Total (GJ) | Difference to base | |||
|---|---|---|---|---|---|---|---|---|
| Standard | 552.8 | 13.4% | 3,465.9 | 84.3% | 94.8 | 2.3% | 4,113.5 | 0.0% |
| Standard Alt. 1 | 555.8 | 16.4% | 2,742.2 | 80.8% | 94.8 | 2.8% | 3,392.9 | −17.5% |
| Standard Alt. 2 | 545.9 | 11.9% | 3,932.1 | 86.0% | 94.8 | 2.1% | 4,572.8 | 11.2% |
| Passive | 618.3 | 21.4% | 2,169.5 | 75.2% | 98.1 | 3.4% | 2,886.0 | −29.8% |
| Passive Alt. 1. | 615.3 | 25.0% | 1,747.5 | 71.0% | 98.1 | 4.0% | 2,460.8 | −40.2% |
| Passive Alt. 2 | 608.4 | 20.3% | 2,292.5 | 76.4% | 98.1 | 3.3% | 2,999.0 | −27.1% |
For the description of the scenarios, see Table 2.
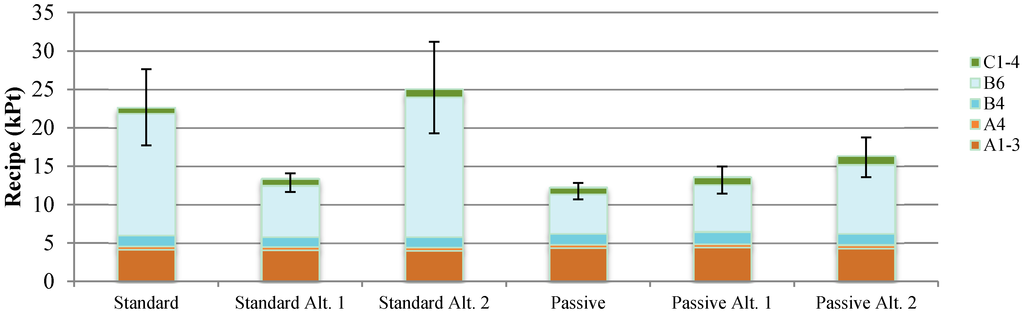
Figure 4.
Analysis of energy scenarios–ReCiPe. For detailed description labels, see Section 3.2.
Figure 4.
Analysis of energy scenarios–ReCiPe. For detailed description labels, see Section 3.2.
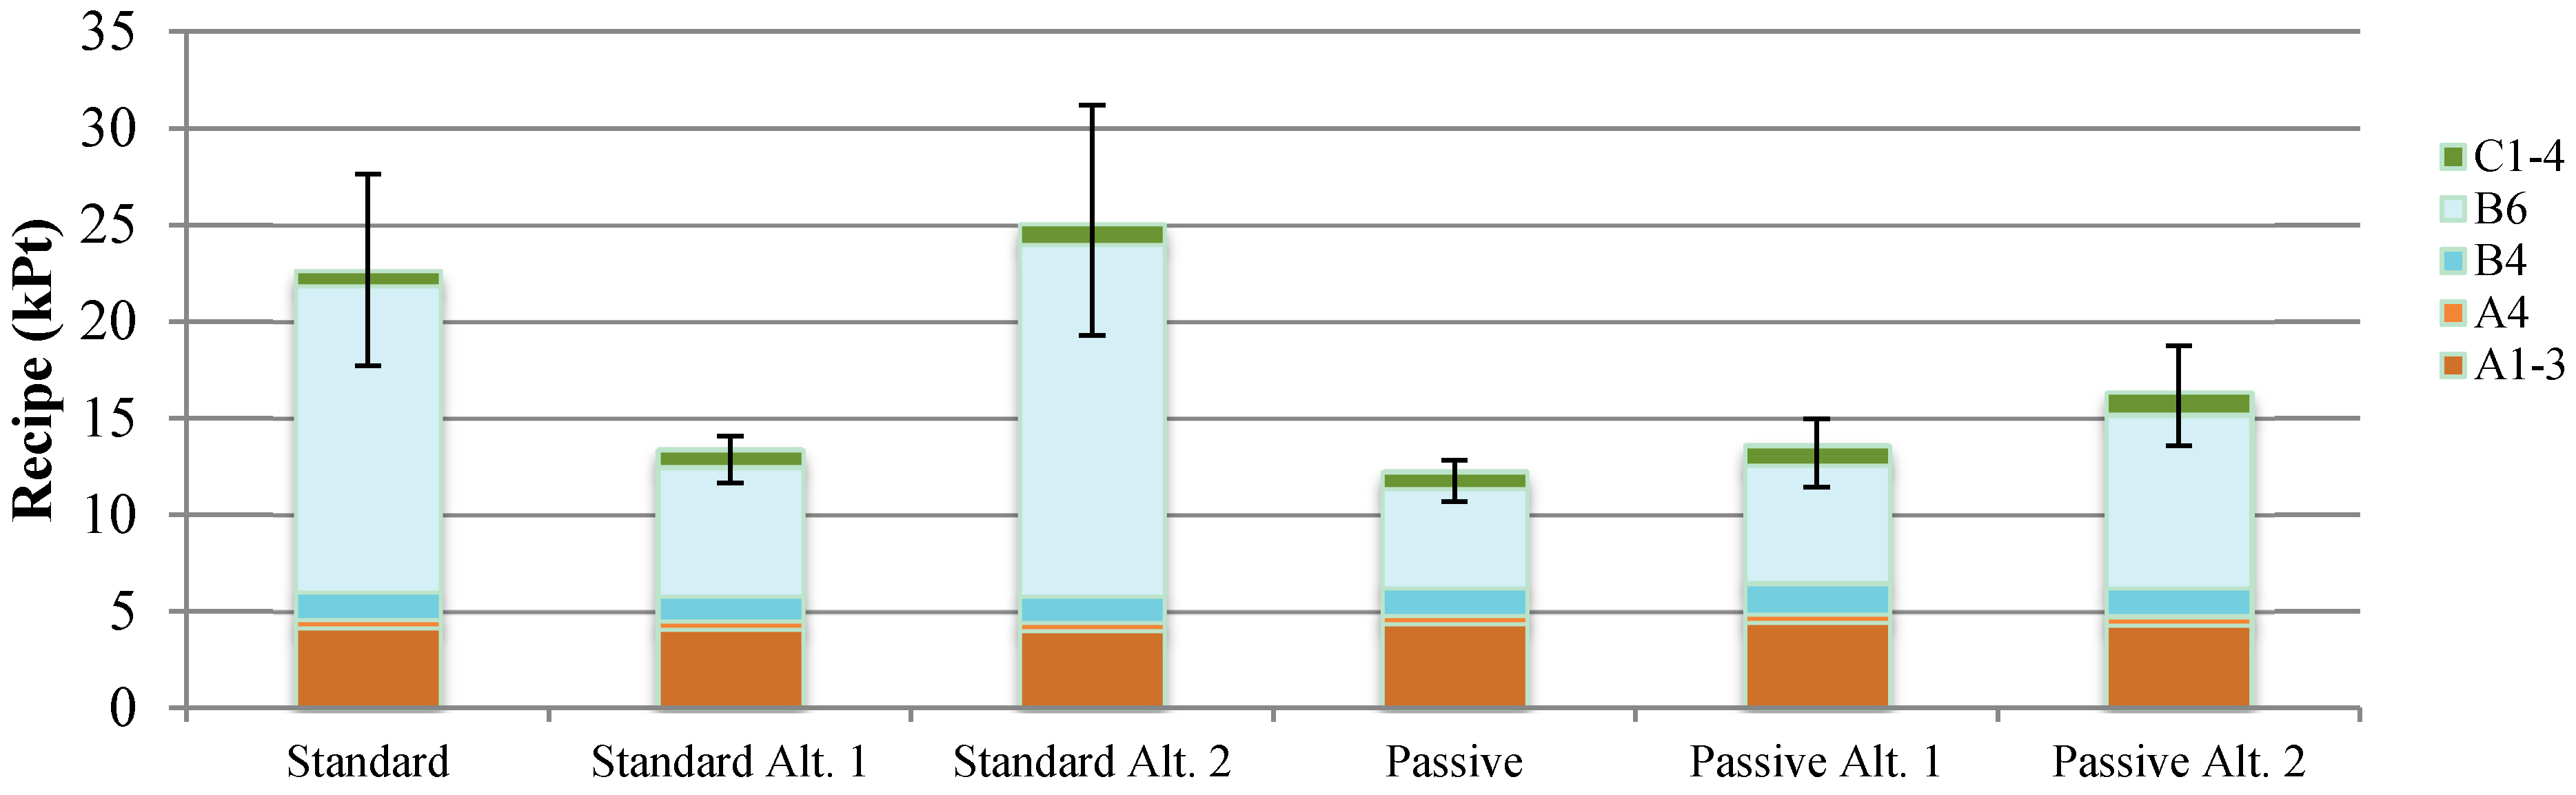
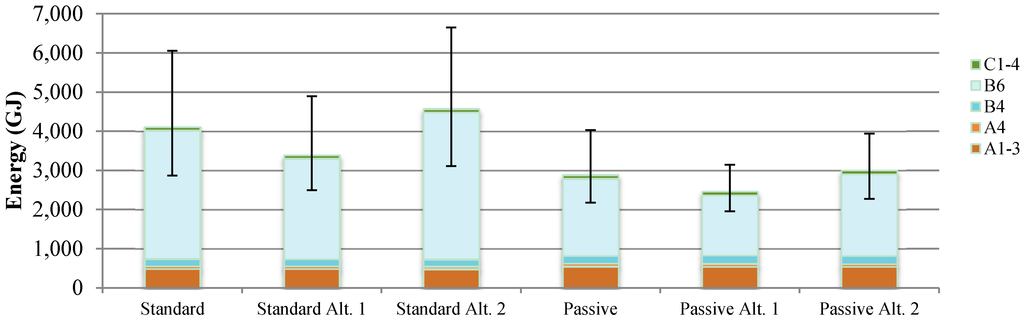
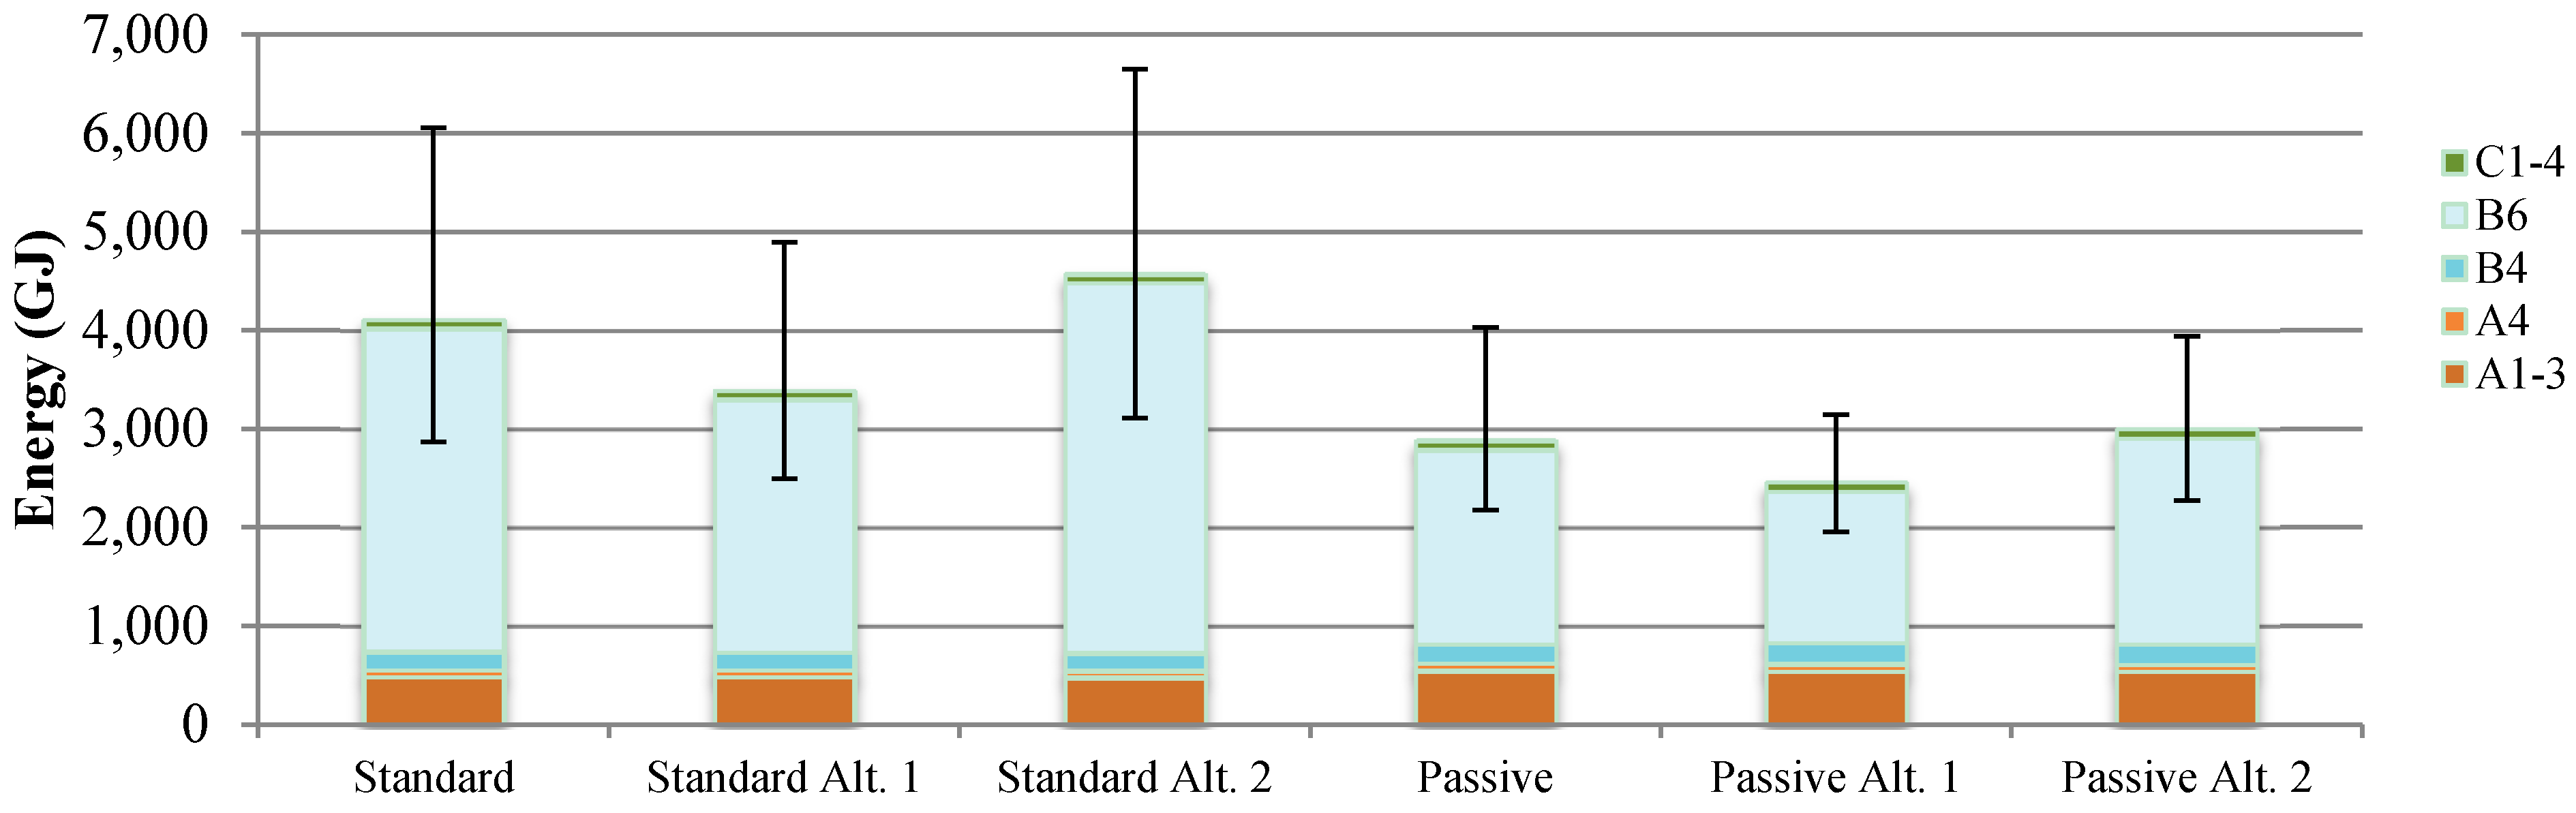
Figure 5.
Analysis of energy scenarios–CED. For detailed description labels, see Section 3.2.
Figure 5.
Analysis of energy scenarios–CED. For detailed description labels, see Section 3.2.
If ReCiPe is applied as the impact assessment method, the scenario with a traditional gas boiler without solar collector will result, for both the passive and standard dwelling, in an increase of the life cycle impact (Alt. 2). When the gas boiler scenarios with or without solar collector are compared, the increase is almost equal in absolute terms for both the standard and passive dwelling. The solar collector mainly influences the production of hot tap water, which is equal for all scenarios. Potential savings are only influenced to a limited extent by the level of insulation. Comparing the heat pump scenario of a standard dwelling (Stand. Alt. 1) with the reference system, a possible reduction of the environmental impact of more than 40% can be achieved. Conversely, replacing the heat pump in a passive dwelling by a condensing gas boiler with solar collector (Pass. Alt. 1) results in an increase of merely 10% of the life cycle impact up to a similar level of the standard dwelling with heat pump (Stand. Alt. 1). Even though a difference of 10% is not negligible, it is still useful to have multiple solutions to achieve a similar environmental profile.
According to the results using ReCiPe as an impact method, two possible tracks emerge as legitimate ways to achieve more sustainable dwellings. One consists of providing a solid level of insulation in line with the current energy regulations, complemented with efficient technical services for heating, i.e., in this study, this is represented by the standard scenario with a heat pump (Stand. Alt. 1). The other possibility is to increase the level of insulation towards passive house standard where good results can be obtained with more traditional heating systems. Additional improvements of the technical services can reduce the overall impact even more but only to a limited extent. It should be noted, however, that this result does not apply for domestic hot water production. In this case, the overall efficiency (system and distribution) and type of energy source clearly remain the main issue of concern because of their limited correlation with the level of insulation.
Calculating the environmental impact of the same scenarios with CED as indicator for environmental impact, different conclusions can be drawn. Firstly, the passive scenario is always preferred independent of the energy scenarios. The impact of the passive scenario with the least performing technical services (only a traditional condensing gas boiler) is still 27% lower compared to the best performing standard version with a heat pump. Another striking result is that for a standard dwelling a heat pump is the best option, while for a passive dwelling a gas boiler with solar collector is preferable. This observation will be discussed in more detail in the next paragraph. In contrast to the two possible tracks for reducing environmental impact of a dwelling according to ReCiPe, recommendations according to CED are hierarchical. They have a strong focus on reducing energy losses (more than is required by energy regulation) as demonstrated by the passive dwelling in this case. Only after such thorough interventions does further optimization of the technical services seem to be justified. Again, the same remarks remain valid for domestic hot water production, where the solar collector shows a clear reduction of the overall impact.
Previous results have shown the importance of both building type and technical optimizations when trying to improve the environmental profile of a building. The question of how to achieve a more sustainable dwelling can be answered in a different way depending on the applied impact method. In the final section of this paper the origin and implications of these differences are explored and discussed. In Figure 6 and Figure 7 the most important results of the previous energy scenarios are presented, but they are broken up by the impact categories of the two impact methods instead of over the life cycle phases. For the ReCiPe results, the endpoints are still being used, though the results are divided over 16 impact categories, similar to the midpoint approach. This is not to be confused with the midpoint approach of ReCiPe, where all categories have their own unit. In this case the endpoints distributed over midpoint categories represent potential damage expressed in a single score. CED has only six impact categories, depending on the type of primary energy source and on whether this source is renewable.

Figure 6.
Analysis of energy scenarios–ReCiPe–impact per category.
Figure 6.
Analysis of energy scenarios–ReCiPe–impact per category.
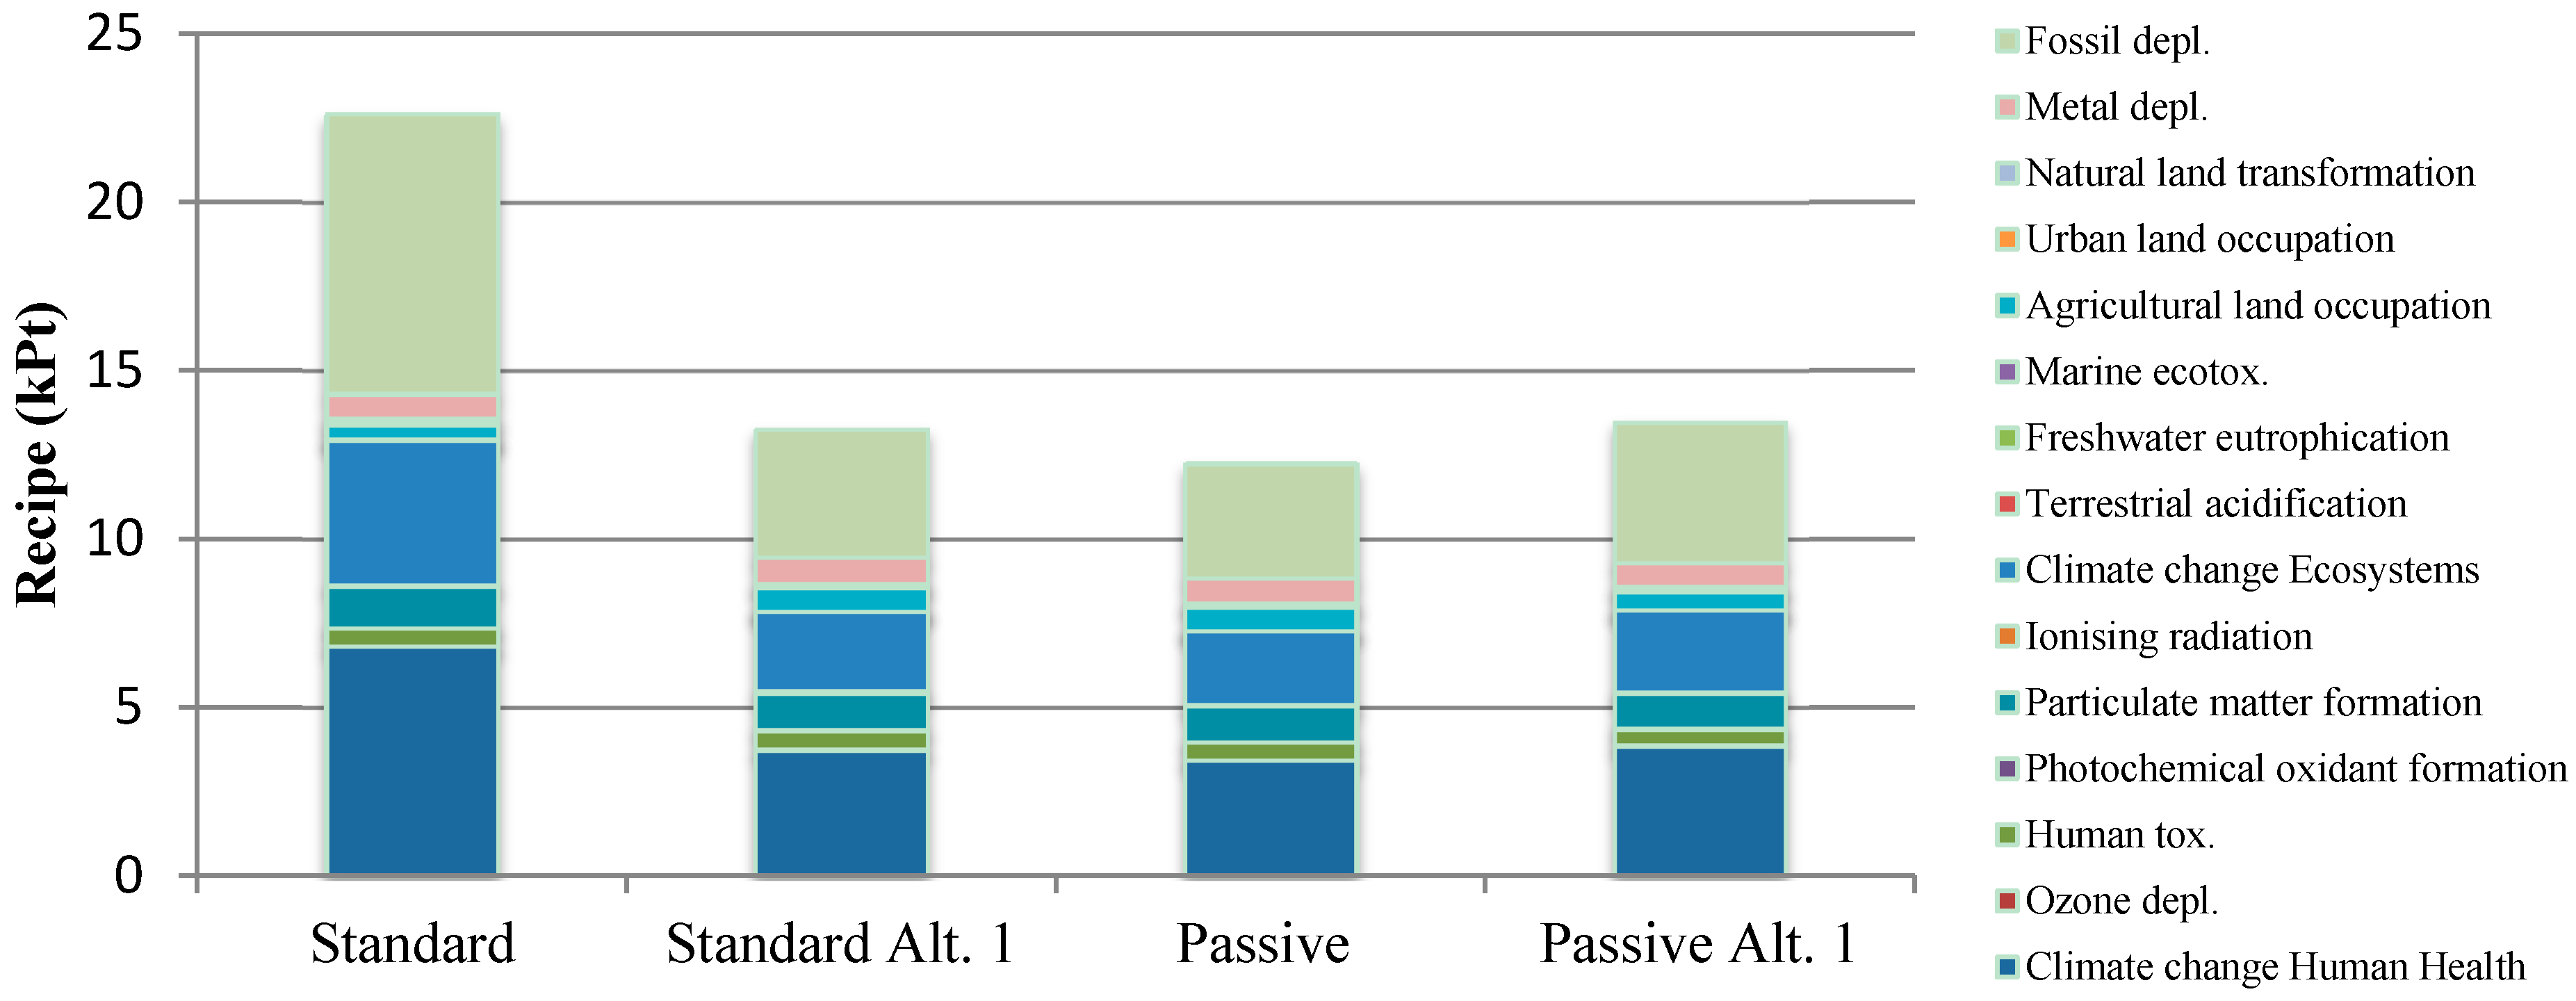

Figure 7.
Analysis of energy scenarios—CED—per impact category.
Figure 7.
Analysis of energy scenarios—CED—per impact category.
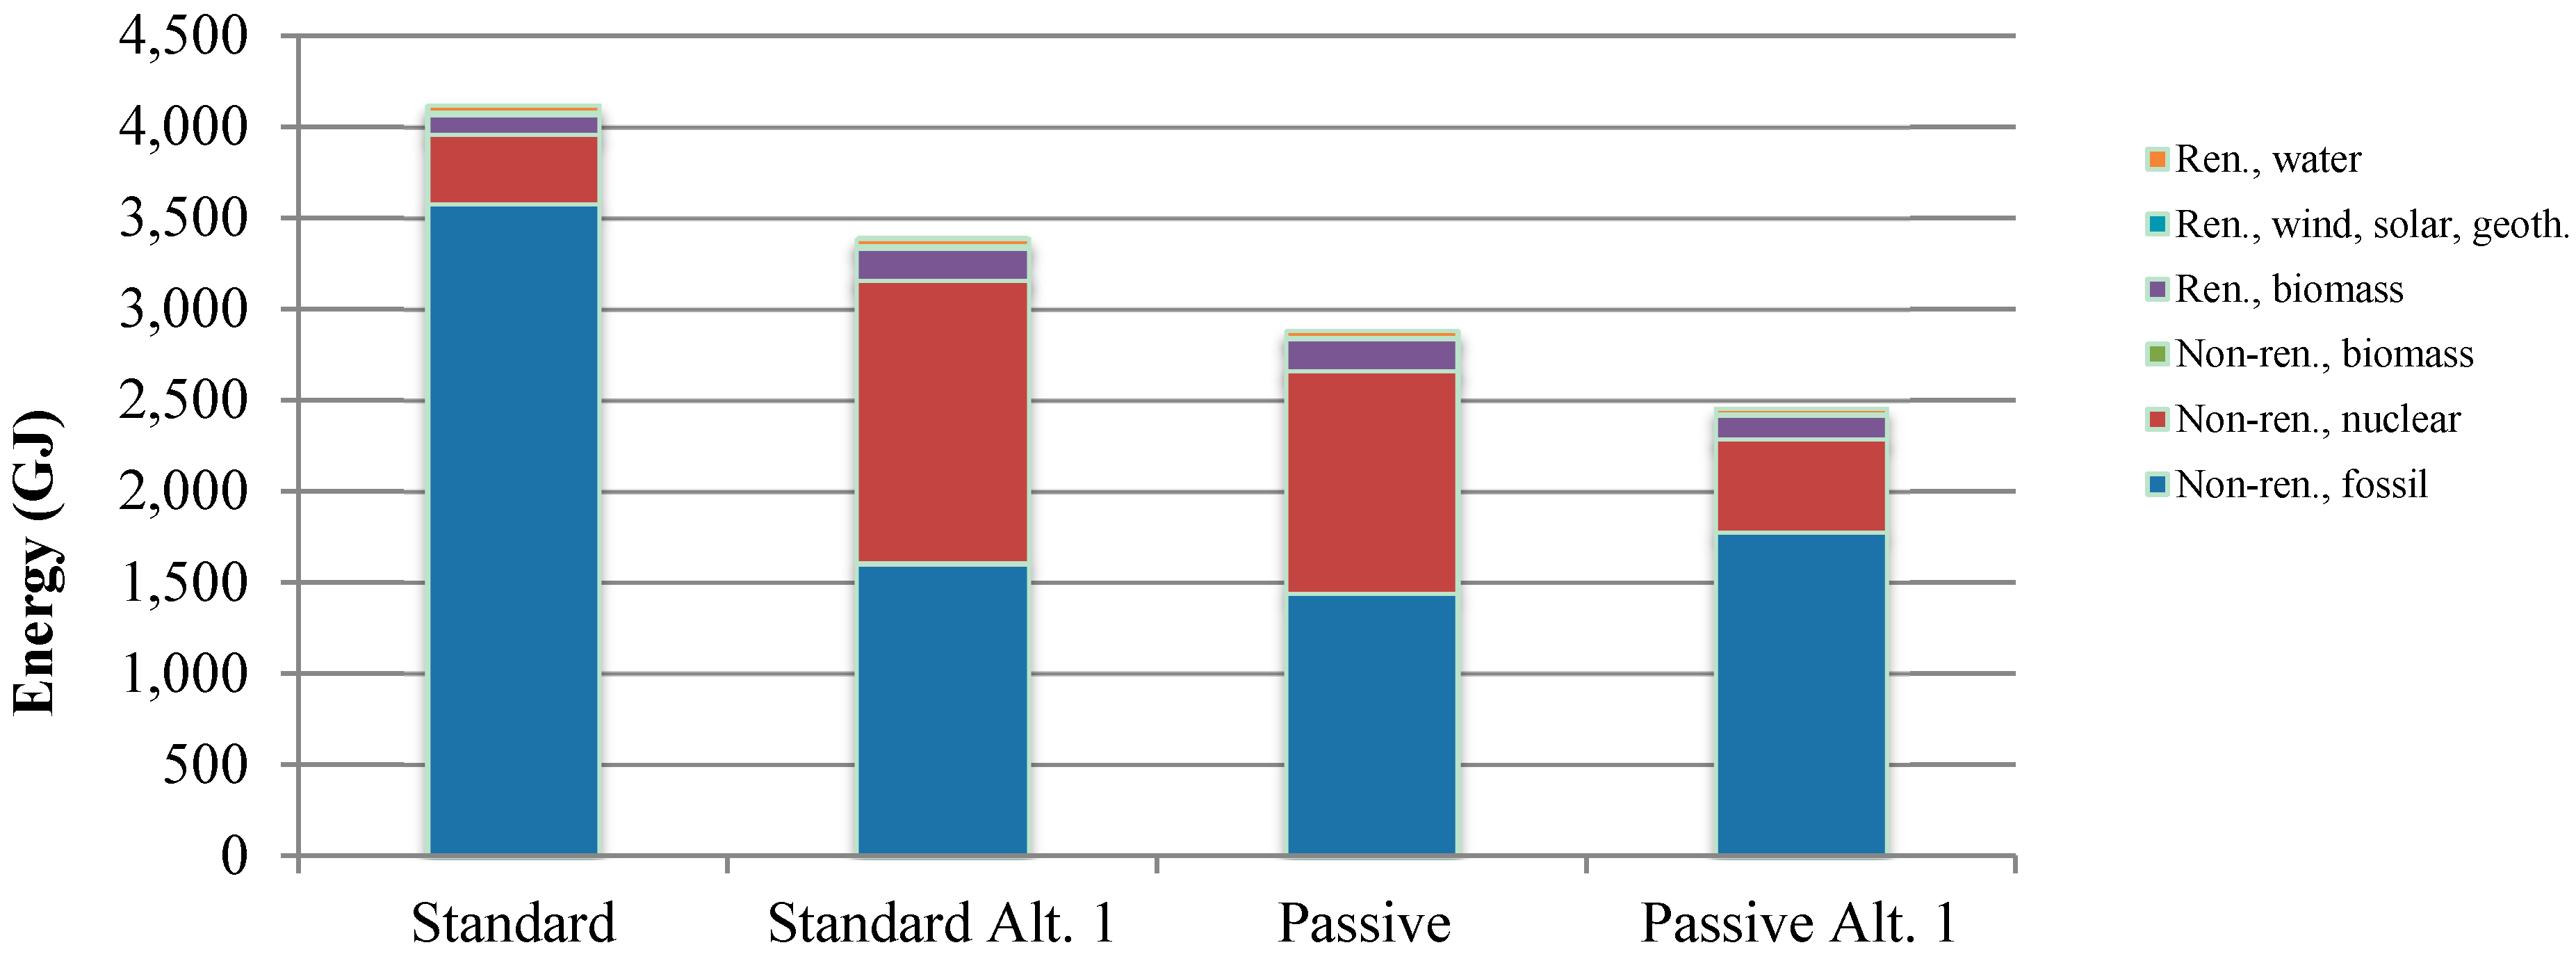
When comparing the distributions according to the two impact methods, some aspects are noticeable. First is in the share of non-renewable fossil and nuclear energy in the CED results. Almost half of the cumulated energy in the heat pump scenarios has a nuclear origin. This is directly related to the composition of the Belgian electricity mix, which consists of more than 50% nuclear power (including imports) [74,75,76]. Since the extraction of uranium and further production are energy-intensive, the contribution of nuclear energy influences the overall results to a great extent. As a consequence, the results for the heat pump scenarios are much less favorable compared to the ReCiPe results. Secondly, the ReCiPe results consider a much more differentiated set of impacts, going beyond the energy issue. This shows a more nuanced image even though energy consumption in all parts of the life cycle remains an important aspect. This results, for example, in a more pronounced construction phase. The combination of assigning a higher impact to nuclear energy and taking into account other possible impacts besides cumulative energy use results in a different conclusion depending on the choice of impact assessment method and consequently different strategies for optimizing building design.
4.2. Economic Analysis
In the previous section, different optimization scenarios were examined from an environmental point of view. However, in practice economic cost can have a great influence on the decision-making as well, especially during the design phase. So in addition to the environmental scenarios, a screening life cycle costing (LCC) has been executed to evaluate whether there exist any differences between the economic and the environmental optima. Included in the analysis are the costs of the initial construction, maintenance and energy consumption, and a rough estimation of the costs related to the end-of-life. Since price data are sensitive data, the comparison is only described in percentages with the terraced standard dwelling as a reference.
As can be seen in Table 8, over the entire estimated life span of 60 years, the results show general similarities with the LCA results of the ReCiPe impact method. The cheapest scenarios are the passive ones with a gas boiler, where the additional costs of the solar collector are recovered due to the lower operational energy costs. The life cycle economic cost of the standard scenario with heat pump is less than 2% higher compared to the passive house scenarios. So again there are two ways of reaching an optimum: one by increased insulation with cheaper (and less efficient) technical services and the other by opting for the best possible technical solutions accompanied with a base level of insulation.
Table 8.
Life cycle costing.
| Scenario | Construction | Use | EoL | Total | ||||
|---|---|---|---|---|---|---|---|---|
| Share Stage | Difference to Base | Share Stage | Difference to Base | Share Stage | Difference to Base | Share Stage | Difference to Base | |
| Standard | 50.4% | 0.0% | 46.9% | 0.0% | 2.7% | 0.0% | 100% | 0.0% |
| Standard Alt. 1 | 56.9% | 2.1% | 40.0% | −22.7% | 3.0% | 0.0% | 100% | −9.6% |
| Standard Alt. 2 | 47.6% | −5.3% | 49.6% | 6.1% | 2.7% | 0.0% | 100% | 0.2% |
| Passive | 60.6% | 9.2% | 36.4% | −29.3% | 3.0% | 0.0% | 100% | −9.1% |
| Passive Alt. 1 | 61.3% | 7.1% | 35.6% | −33.0% | 3.1% | 0.0% | 100% | −11.9% |
| Passive Alt. 2 | 57.6% | 1.8% | 39.3% | −25.4% | 3.1% | 0.0% | 100% | −11.0% |
For the description of the scenarios, see Table 2.
In addition to these results, practical issues may play an important role in the decision process. A vertical heath pump is not always possible, especially not in a dense and compact urban context. The same is true for the solar collector, where the optimal orientation is not always possible.
5. Discussion
In Section 4, the results demonstrated two possible ways of improving the environmental profile of a building, based on building type and energy scenarios. When examining building type, the results reveal the importance of the amount of required material rather than the influence of increased energy requirements. Though in a different context, Blengini and di Carlo recognized the increasing importance of material-related impacts when a sufficient level of insulation is installed [11,77]. Stephan et al. investigated the influence of building type, urban density, and transport in a low-density suburban neighborhood in Melbourne and found, as in this study, that a more enclosed and compact building type had a lower impact. However, the reasoning behind their conclusion was different. Since current building stock was the subject of research, compactness and size of exposed surface mainly influenced operational energy. The biggest differences, however, were caused by urban dynamics: more compact dwellings are in general smaller, require less surrounding infrastructure, and make public transport possible [78]. Allacker could not identify a single optimum building type, but indicated a potential for “the improvement of the dwelling type, layout and size,” which is in line with the conclusions of Rickwood et al. [41,51].
Depending on the impact assessment method, different ways to improve environmental profile were identified. This is consistent with the general lack of consensus in other research. Dahlstrøm et al. compared different heating systems for both standard and passive scenarios using the ReCiPe method as well, with similar conclusions, though the case is situated in Norway, with an electricity mix dominated by hydropower. When applying the European electricity mix and excluding electric heating, conclusions parallel to this research can be drawn [79]. Himpe et al. investigated zero-energy dwellings so no operational energy was considered when comparing scenarios, but, in line with the findings of this paper, standard scenarios could reach a similar environmental profile due to the use of efficient technical services [9]. These conclusions differ from the findings of previous studies using current building stock or outdated energy regulations as a reference, where reducing energy requirements was the prioritized action for improvement [39,80,81,82].
In Figure 2, Figure 3, Figure 4 and Figure 5 the 95% confidence intervals are displayed on the resulting variables, calculated by a Monte Carlo analysis with 2000 runs. The intervals are only a rough estimation of the actual uncertainty for multiple reasons. Firstly, the Monte Carlo analysis only takes into account the estimated uncertainty related to the processes under study, but not the uncertainty related to assumptions and scenarios. Secondly, Ecoinvent 3.1 contains loops and inverted operators (due to the database structure), entailing mistakes in the Monte Carlo analysis [83]. Such errors are corrected manually, but more research is needed on this topic to determine the extent to which these errors impact the applicability of results.
This research study, furthermore, is based on a process LCA, which tends to underestimate overall environmental impact. All examined scenarios are composed of similar materials and structural concepts, so it is assumed that comparison still provides useful insights, but interesting future work could complement this research using a hybrid I/O approach.
Another limitation is the fact that only one case has been investigated, albeit a representative one for newly built dwellings in Belgium. It would be premature to draw generalized conclusions based on these results for implementation on a larger scale. Scenarios that consider evolution during the use of a building could complement this study, since a life span of 60 years is currently applied, but in practice the life span is often longer and renovations should be taken into account as well.
In addition, this research is based on an attributional approach of LCA, which is common practice in current building research and meaningful in this context of micro-level decision support. However, for the development of long-term future scenarios on a bigger scale, a consequential approach would be more suitable. For example, for some building products replacing extrapolated averages by (a set of) marginal suppliers and taking constrained suppliers into account as well can influence the results quite heavily. Therefore, it is recommended that future research include a consequential LCA, parallel to this study, to give a proper policy support.
In line with the previous comment, Environmental Product Declarations (EPDs) have an attributional logic (so they can only be used for product selection and may not serve as a base for long-term policy) and in their current form are too difficult to be interpreted by designers. An ALCA- and CLCA-based, easy-to-use environmental label complementing energy regulation should be developed, having designers and future owners as a target group.
Another future research opportunity can be found by extending the scale of the subject of study. Results indicate the importance of building type and technical services. It may, then, be possible to obtain a more substantial reduction in environmental impact and economic cost by “scaling up.” Designs at the district level and technical services serving more than a single dwelling, for example, deserve more attention, both from academia as from policy makers.
Lastly, attention should be paid to the choice of materials, because when energy efficiency increases their impact will increase too, both in absolute values and in their relative contribution with respect to the other life cycle phases. At the moment, the Flemish energy regulations for new buildings demand a certain level of insulation, efficiency of technical services, and production of renewable energy, without specifying how this should be achieved. More research is needed to ensure that when energy efficiency is increased to a maximum, this will not be jeopardized by a bigger impact of the materials needed to realize it.
6. Conclusions
The main goal of this research is to develop optimization scenarios for dwellings representative for the Flemish context, with the current energy regulation as reference. The research also takes into account the influence of assessment method on such optimizations, in this case using Cumulative Energy Demand to create a life cycle energy assessment and ReCiPe endpoint hierarchist perspective to account for environmental impacts beside energy. The development of a new district in Niel in the north of Flanders (Belgium) served as a basis for a case-based approach. Two ways to possibly reduce the environmental impact have been included in this research, namely changing building type and technical services. When considering building type, both methods show similar results with a preference for the terraced version. The biggest contribution to the differences in impact is caused by the amount of used materials, especially in the case of the passive versions. For the standard dwelling versions, the increase of heat losses in correlation with a larger exposed surface is higher than in the passive version, but still lower than the impacts related to the increased material consumption.
The energy scenarios show less uniform results, with different priorities for optimization depending on the impact assessment method. When ReCiPe is applied, two ways of optimizing are possible to reach a similar environmental impact minimum: firstly by following the current regulations for insulation complemented with efficient technical services, and secondly by an extensive reduction of energy losses—entailing a reduced (but not negligible) influence of the efficiency of technical services on the results. Calculations according to CED result in a hierarchical approach for optimization, where a lower insulation level cannot be compensated for with well-performing technical services alone.
The results of the screening LCC, which is included to verify whether the environmental optima are realistic proposals or not, show results similar to ReCiPe. Two possible strategies achieve a similar reduction of life cycle economic cost: increased insulation with cheaper technical services or best possible technical solutions accompanied by a base-level of insulation.
To conclude, the results indicate that the choice of impact assessment method does play an important role when conducting a life cycle assessment. Despite the fact that energy is a significant issue throughout the life cycle of buildings, it is meaningful to take other environmental impacts into account as well to create a more complete environmental profile. In this way, more differentiated and nuanced scenarios can be created to reduce the environmental impact of new buildings.
Acknowledgments
The authors would like to express their gratitude to the University of Antwerp and the Flemish Institute for Technical Research (VITO) for their support.
Author Contributions
Matthias Buyle conceived, designed, and performed the simulations; Matthias Buyle, Amaryllis Audenaert, Johan Braet and Wim Debacker analyzed the data and wrote the paper.
Conflicts of Interest
The authors declare no conflict of interest.
References
- United Nations Environmental Programme, Sustainable Buildings and Climate Initiative. Buildings and climate change: a summary for decision-makers. Available online: http://www.Unep.Org/Sbci/Pdfs/Sbci-Bccsummary.Pdf (accessed On 30 April 2015).
- Buyle, M.; Braet, J.; Audenaert, A. Life Cycle Assessment In The Construction Sector: A Review. Renew. Sustain. Energy Rev. 2013, 26, 379–388. [Google Scholar] [CrossRef]
- Sharma, A.; Saxena, A.; Sethi, M.; Shree, V. Life Cycle Assessment Of Buildings: A Review. Renew. Sustain. Energy Rev. 2011, 15, 871–875. [Google Scholar] [CrossRef]
- The European Parliament. Directive 2002/91/Ec Of The European Parliament And Of The Council On The Energy Performance Of Buildings. Off. J. Eur. Union 2003, 4, 65–71. [Google Scholar]
- The European Parliament. Directive 2010/31/Eu Of The European Parliament And Of The Council On The Energy Performance Of Buildings (Recast). Off. J. Eur. Union 2010, 153, 13–35. [Google Scholar]
- Satori, I.; Hestnes, A.G. Energy Use In The Life Cycle Of Conventional And Low-Energy Buildings: A Review Article. Energy Build. 2007, 39, 249–257. [Google Scholar] [CrossRef]
- Guinée, J.B.; Heijungs, R.; Huppes, G.; Zamagni, A.; Masoni, P.; Buonamici, R.; Ekvall, T.; Rydberg, T. Life Cycle Assessment: Past, Present, And Future. Environ. Sci. Technol. 2011, 45, 90–96. [Google Scholar] [CrossRef] [PubMed]
- Cabeza, L.F.; Rincón, L.; Vilariño, V.; Pérez, G.; Castell, A. Life Cycle Assessment (Lca) And Life Cycle Energy Analysis (Lcea) Of Buildings And The Building Sector: A Review. Renew. Sustain. Energy Rev. 2014, 29, 394–416. [Google Scholar] [CrossRef]
- Himpe, E.; Trappers, L.; Debacker, W.; Delghust, M.; Laverge, J.; Janssens, A.; Moens, J.; Van Holm, M. Life Cycle Energy Analysis Of A Zero-Energy House. Build. Res. Inf. 2013, 41, 435–449. [Google Scholar] [CrossRef]
- Debacker, W.; Allacker, K.; De Troyer, F.; Janssen, A.; Delem, L.; Vito, K.P.; De Nocker, L.; Spirinckx, C.; Van Dessel, J. Environmental Profile Of Building Elements; OVAM: Mechelen, Belgium, 2012. [Google Scholar]
- Blengini, G.A.; Di Carlo, T. The Changing Role Of Life Cycle Phases, Subsystems And Materials In The Lca Of Low Energy Buildings. Energy Build. 2009, 42, 869–880. [Google Scholar] [CrossRef]
- Audenaert, A.; De Cleyn, S.H.; Buyle, M. Lca Of Low-Energy Flats Using The Eco-Indicator 99 Method: Impact Of Insulation Materials. Energy Build. 2012, 47, 68–73. [Google Scholar] [CrossRef]
- Ortiz, O.; Catsells, F.; Sonnemann, G. Sustainability In The Construction Industry: A Review Of Recent Developments Based On Lca. Constr. Build. Mater. 2009, 23, 28–39. [Google Scholar] [CrossRef]
- Ramesh, T.; Prakash, R.; Shukla, K.K. Life Cycle Energy Analysis Of Buildings: An Overview. Energy Build. 2010, 42, 1592–1600. [Google Scholar] [CrossRef]
- Karimpour, M.; Belusko, M.; Xing, K.; Bruno, F. Minimising The Life Cycle Energy Of Buildings: Review And Analysis. Build. Environ. 2014, 73, 106–114. [Google Scholar] [CrossRef]
- Iso. Iso 14040-Environmental Management–Life Cycle Assessment–Principles And Framework; International Organisation For Standardization: Geneva, Switserland, 2006. [Google Scholar]
- Guinée, J.B.; Gorrée, M.; Heijungs, R.; Huppes, G.; Kleijn, R.; De Koning, A. Handbook On Life Cycle Assessment: Operational Guide To The Iso Standards; Kluwer Academic Publisher: Dordrecht, The Netherlands, 2002. [Google Scholar]
- International Organization for Standardization. Iso 14044-Environmental Management-Life Cycle Assessment-Requirements And Guidelines; International Organisation for Standardization: Geneva, Switzerland, 2006. [Google Scholar]
- Rebitzer, G.; Ekvall, T.; Frischknecht, R.; Hunkeler, D.; Norris, G.; Rydberg, T.; Schmidt, W.-P.; Suh, S.; Weidema, B.P.; Pennington, D.W. Life Cycle Assessment Part 1: Framework, Goal And Scope Definition, Inventory Analysis, And Applications. Environ. Int. 2004, 30, 701–720. [Google Scholar] [CrossRef] [PubMed]
- Reiter, S. Life Cycle Assessment Of Buildings–A review. In Proceedings Of The Sustainability Workshop And Third Plenary Meeting, Brussels, Belgium, 7 July 2010; pp. 1–19.
- Chau, C.K.; Leung, T.M.; Ng, W.Y. A Review On Life Cycle Assessment, Life Cycle Energy Assessment And Life Cycle Carbon Emissions Assessment On Buildings. Appl. Energy 2015, 143, 395–413. [Google Scholar] [CrossRef]
- Thormark, C. A Low Energy Building In A Life Cycle–Its Embodied Energy, Energy Need For Operation And Recycling Potential. Build. Environ. 2002, 37, 429–435. [Google Scholar] [CrossRef]
- Thormark, C. The Effect Of Material Choice On The Total Energy Need And Recycling Potential Of A Building. Build. Environ. 2006, 41, 1019–1026. [Google Scholar] [CrossRef]
- Adalberth, K.; Almgren, A.; Petersen, E.H. Life Cycle Assessment Of Four Multi-Family Buildings. Int. J. Low Energy Sustain. Build. 2001, 2, 1–21. [Google Scholar]
- Debacker, W. Structural Design And Environmental Load Assessment Of Multi-Use Construction Kits For Temporary Applications Based On 4 dimensional Design. Ph.D. Thesis, Vrije Universiteit, Brussel, Belgium, 2009. [Google Scholar]
- Hischier, R.; Editors, B.W.; Althaus, H.; Bauer, C.; Doka, G.; Dones, R.; Frischknecht, R.; Hellweg, S.; Humbert, S.; Jungbluth, N.; et al. Implementation Of Life Cycle Impact Assessment Methods. Ecoinvent Report No. 3, V 2.2; Ecoinvent Report No. 3.; Ecoinvent Centre, Swiss Federal Laboratories For Materials Testing And Research (Empa): Dübendorf, Switzerland, 2010. [Google Scholar]
- European Commission. Synthesis Of The Stakeholder Consultation Delivering More Sustainable Consumption And Production; Technical Report-2012-062; Brussels, Belgium, 2012. [Google Scholar]
- Huppes, G.; Van Oers, L. Background Review Of Existing Weighting Approaches In Life Cycle Impact Assessment (LCIA). Available online: http://www.avnir.org/documentation/e_book/BackgroundReviewExistingWeightingApprochesInLCIA.pdf (accessed On 30 April 2015).
- Adalberth, K. Energy Use During The Life Cycle Of Single-Unit Dwellings: Examples. Build. Environ. 1997, 32, 321–329. [Google Scholar] [CrossRef]
- Asif, M.; Muneer, T.; Kelley, R. Life Cycle Assessment: A Case Study Of A Dwelling Home In Scotland. Build. Environ. 2007, 42, 1391–1394. [Google Scholar] [CrossRef]
- Marceau, M.L.; Vangeem, M. Comparison Of The Life Cycle Assessments Of An Insulating Concrete Form House And A Wood Frame House. J. Astm Int. 2006, 3, 1–11. [Google Scholar]
- Matasci, C. Life Cycle Assessment Of 21 Buildings: Analysis of The Different Life Phases and Highlighting of The Main Causes of Their Impact on the Environment. Available online: http://infoscience.epfl.ch/record/148332/files/eth-30551-01.pdf?version=2 (accessed On 30 April 2015).
- Ortiz-Rodríguez, O.; Castells, F.; Sonnemann, G. Life Cycle Assessment Of Two Dwellings: One In Spain, A Developed Country, And One In Colombia, A Country Under Development. Sci. Total Environ. 2010, 408, 2435–2443. [Google Scholar] [CrossRef] [PubMed]
- Peuportier, B.L.P. Life Cycle Assessment Applied To The Comparative Evaluation Of Single Family Houses In The French Context. Energy Build. 2001, 33, 443–450. [Google Scholar] [CrossRef]
- Stephan, A.; Crawford, R.H.; De Myttenaere, K. A Comprehensive Assessment Of The Life Cycle Energy Demand Of Passive Houses. Appl. Energy 2013, 112, 23–34. [Google Scholar] [CrossRef]
- Stephan, A.; Crawford, R.H.; De Myttenaere, K. Towards A Comprehensive Life Cycle Energy Analysis Framework For Residential Buildings. Energy Build. 2012, 55, 592–600. [Google Scholar] [CrossRef]
- Verbeeck, G.; Hens, H. Optimisation Of extremely low energy residential buildings. Available online: https://Bwk.Kuleuven.Be/Bwf/Phds/Phdverbeeck (accessed On 30 April 2015).
- Verbeeck, G.; Hens, H. Life Cycle Inventory Of Buildings: A Calculation Method. Build. Environ. 2010, 45, 1037–1041. [Google Scholar] [CrossRef]
- Verbeeck, G.; Hens, H. Life Cycle Inventory Of Buildings: A Contribution Analysis. Build. Environ. 2010, 45, 964–967. [Google Scholar] [CrossRef]
- Allacker, K. Sustainable Building, The Development Of An Evaluation Method. Available online: https://Lirias.Kuleuven.Be/Bitstream/123456789/267749/1/Karen%2ballacker_Phd_Final_For%2bupload.Pdf (accessed On 30 April 2015).
- Rickwood, P.; Glazebrook, G.; Searle, G. Urban Structure And Energy—A Review. Urban Policy Res. 2008, 26, 57–81. [Google Scholar] [CrossRef]
- Jaber, S.; Ajib, S. Optimum, Technical And Energy Efficiency Design Of Residential Building In Mediterranean Region. Energy Build. 2011, 43, 1829–1834. [Google Scholar] [CrossRef]
- Hasan, A.; Vuolle, M.; Sirén, K. Minimisation Of Life Cycle Cost Of A Detached House Using Combined Simulation And Optimisation. Build. Environ. 2008, 43, 2022–2034. [Google Scholar] [CrossRef]
- Gustafsson, S.I. Optimization Of Insulation Measures On Existing Buildings. Energy Build. 2000, 33, 49–55. [Google Scholar] [CrossRef]
- Blanchard, S.; Reppe, P. Life Cycle Analysis Of A Residential Home In Michigan; University of Michigan: Ann Arbor, MI, USA, 1998. [Google Scholar]
- Gluch, P.; Bauman, H. The Life Cycle Costing (Lcc) Approach: A Conceptual Discussion Of Its Usefulness For Environmental Decision-Making. Build. Environ. 2004, 39, 571–580. [Google Scholar] [CrossRef]
- Government Of Flanders. Decreet Houdende Algemene Bepalingen Betreffende Het Energiebeleid; Government Of Flanders: Brussels, Belgium, 2009.
- Government Of Flanders. Besluit Van De Vlaamse Regering Houdende Algemene Bepalingen Over Het Energiebeleid; Government Of Flanders: Brussels, Belgium, 2010.
- Statistics Belgium. Kerncijfers 2014, Statistisch Overzicht Van België [Key Figures2014, Statistical Overview Of Belgium]; Statistics Belgium: Brussels, Belgium, 2014. [Google Scholar]
- Heylen, K.; Le Roy, M.; Vanden Broucke, S.; Vandekerckhove, B.; Winters, S. Wonen In Vlaanderen: De Resultaten Van De Woonsurvey 2005 En De Uitwendige Woonschouwing 2005. Available online: http://www.steunpuntruimteenwonen.be/index.php?option=com_content&task=view&id=50&Itemid=1&lang=nl (accessed On 30 April 2015).
- Allacker, K. Environmental And Economic Optimisation Of The Floor On Grade In Residential Buildings. Int. J. Life Cycle Assess. 2012, 17, 813–827. [Google Scholar] [CrossRef]
- Government Of Flanders. Energiebesluit Van 19 November 2010; Government Of Flanders: Brussels, Belgium, 2010.
- European Commission-Joint Research Centre-Institute For Environment And Sustainability. Ilcd Handbook: General Guide To Life Cycle Assessment–Detailed Guidance, 1st Ed. ed; Publications Office Of The European Union: Luxembourg, 2010. [Google Scholar]
- The European Committee for Standardization. En 15804:2012-Sustainability Of Construction Works-Environmental Product Declarations-Core Rules For The Product Category Of Construction Products; The European Committee for Standardization: Geneva, Switzerland, 2012. [Google Scholar]
- The European Committee for Standardization. En 15978:2011-Sustainability Of Construction Works—Assessment Of Environmental Performance Of Buildings—Calculation Method; The European Committee for Standardization: Geneva, Switzerland, 2011. [Google Scholar]
- Treloar, G.J. Environmental Assessment Using Both Financial And Physical Quantities. Available online: Http://Anzasca.Net/Wp-Content/Uploads/2014/08/Anzasca2007_Graham-J-Treloar.Pdf (accessed On 30 April 2015).
- Dixit, M.K.; Culp, C.H.; Fernández-Solís, J.L. System Boundary For Embodied Energy In Buildings: A Conceptual Model For Definition. Renew. Sustain. Energy Rev. 2013, 21, 153–164. [Google Scholar] [CrossRef]
- Treloar, G.J. Extracting Embodied Energy Paths From Input–Output Tables: Towards An Input–Output-Based Hybrid Energy Analysis Method. Econ. Syst. Res. 1997, 9, 375–391. [Google Scholar] [CrossRef]
- Majeau-Bettez, G.; Strømman, A.H.; Hertwich, E.G. Evaluation Of Process- And Input-Output-Based Life Cycleinventory Databases With Regards To Truncation And Aggregation Issues. Environ. Sci. Technol. 2011, 45, 10170–10177. [Google Scholar] [CrossRef] [PubMed]
- Majeau-Bettez, G.; Wood, R.; Strømman, A.H. Unified Theory Of Allocations And Constructs In Life Cycle Assessment And Input-Output Analysis. J. Ind. Ecol. 2014, 18, 747–770. [Google Scholar] [CrossRef]
- Suh, S. Critical Review System Boundary Selection In Life-Cycle Inventories Using Hybrid Approaches. Environ. Sci. Technol. 2006, 38, 657–664. [Google Scholar] [CrossRef]
- Lenzen, M.; Treloar, G. Embodied Energy In Buildings: Wood Versus Concrete-Reply To Borjesson And Gustavsson. Energy Policy 2002, 30, 249–255. [Google Scholar] [CrossRef]
- Crawford, R.H. Post-Occupancy Life Cycle Energy Assessment Of A Residential Building In Australia. Archit. Sci. Rev. 2014, 57, 114–124. [Google Scholar] [CrossRef]
- Fay, R.; Treloar, G.; Iyer-Raniga, U. Life-Cycle Energy Analysis Of Buildings: A Case Study. Build. Res. Inf. 2000, 28, 31–41. [Google Scholar] [CrossRef]
- Goedkoop, M.; Heijungs, R.; Huijbregts, M.; De Schryver, A.; Struijs, J.; Van Zelm, R. Recipe 2008: A Life Cycle Impact Assessment Method Which Comprises Harmonised Category Indicators At The Midpoint And The Endpoint Level; Ministry Of Housing, Spatial Planning And Environment: Den Haag, The Netherlands, 2012. [Google Scholar]
- Finnveden, G.; Hauschild, M.Z.; Ekvall, T.; Guinée, J.; Heijungs, R.; Hellweg, S.; Koehler, A.; Pennington, D.; Suh, S. Recent Developments In Life Cycle Assessment. J. Environ. Manag. 2009, 91, 1–21. [Google Scholar] [CrossRef]
- Lenzen, M. Uncertainty In Impact And Externality Assessments-Implications For Decision-Making (13 Pp). Int. J. Life Cycle Assess. 2006, 11, 189–199. [Google Scholar] [CrossRef]
- Weidema, B.P. Comparing Three Life Cycle Impact Assessment Methods From An Endpoint Perspective. J. Ind. Ecol. 2014. [Google Scholar] [CrossRef]
- Building Cost Information Service. Bmi Life Expectancy Of Building Components; Connelly-Manton Ltd: London, UK, 2006. [Google Scholar]
- Janssens, A.; Delghust, M. Onderzoek Naar De Relatie Tussen Het Berekend Energieverbruik In De Epb-Aangifte En Het Reële Energieverbruik Op Basis Van Enquêtegegevens; Uiniversity of Ghent: Ghent, Belgium, 2013. [Google Scholar]
- Aspen. Regional Construction Costs-Residential Buildings-Region Flanders (Regionale Bouwkosten-Gebouwen Voor Bewoning-Rego Vlaanderen); Aspen: Antwerp, Belgium, 2014. [Google Scholar]
- Debacker, W.; Allacker, K.; Spirinckx, C.; Geerken, T.; De Troyer, F. Identification Of Environmental And Financial Cost Efficient Heating And Ventilation Services For A Typical Residential Building In Belgium. J. Clean. Prod. 2013, 57, 188–199. [Google Scholar] [CrossRef]
- U.S. Energy Information Administration. Annual Energy Outlook 2014 With Projections To 2040; U.S. Energy Information Administration: Washington, DC, USA, 2014.
- Treyer, K.; Bauer, C. Life Cycle Inventories Of Electricity Generation And Power Supply In Version 3 Of The Ecoinvent Database—Part Ii: Electricity Markets. Int. J. Life Cycle Assess. 2014. [Google Scholar] [CrossRef]
- Treyer, K.; Bauer, C. Life Cycle Inventories Of Electricity Generation And Power Supply In Version 3 Of The Ecoinvent Database—Part I: Electricity Generation. Int. J. Life Cycle Assess. 2013. [Google Scholar] [CrossRef]
- International Energy Agency. Energy Policies Of Iea Countries. Belgium 2009 Review; International Energy Agency: Paris, France, 2009. [Google Scholar]
- Blengini, G.A.; Di Carlo, T. Energy-Saving Policies And Low-Energy Residential Buildings: An Lca Case Study To Support Decision Makers In Piedmont (Italy). Int. J. Life Cycle Assess. 2010, 15, 652–665. [Google Scholar] [CrossRef]
- Stephan, A.; Crawford, R.H.; De Myttenaere, K. Multi-Scale Life Cycle Energy Analysis Of A Low-Density Suburban Neighbourhood In Melbourne, Australia. Build. Environ. 2013, 68, 35–49. [Google Scholar] [CrossRef]
- Dahlstrøm, O.; Sørnes, K.; Eriksen, S.T.; Hertwich, E.G. Life Cycle Assessment Of A Single-Family Residence Built To Either Conventional- Or Passive House Standard. Energy Build. 2012, 54, 470–479. [Google Scholar] [CrossRef]
- Winther, B.N.; Hestnes, A.G. Solar Versus Green: The Analysis Of A Norwegian Row House. Sol. Energy 1999, 66, 387–393. [Google Scholar] [CrossRef]
- Rossi, B.; Marique, A.-F.; Glaumann, M.; Reiter, S. Life-Cycle Assessment Of Residential Buildings In Three Different European Locations, Basic Tool. Build. Environ. 2012, 51, 395–401. [Google Scholar] [CrossRef]
- Ortiz, O.; Bonnet, C.; Bruno, J.C. Sustainability Based On Lcm Of Residential Dwellings: A Case Study In Catalonia, Spain. Build. Environ. 2009, 44, 584–594. [Google Scholar] [CrossRef]
- Henriksson, P.J.G.; Zhang, W.; Guinée, J.B. Updated Unit Process Data For Coal Based Energy In China Including Parameters For Overall Dispersions Original. Int. J. Life Cycle Assess. 2015, 20, 185–195. [Google Scholar] [CrossRef]
© 2015 by the authors; licensee MDPI, Basel, Switzerland. This article is an open access article distributed under the terms and conditions of the Creative Commons Attribution license (http://creativecommons.org/licenses/by/4.0/).