1. Introduction
The building construction industry in China has no parallel in terms of growth. Between 1985 and 2004, 10 Bm
2 in new construction was added resulting in 40 Bm
2 of total floor area in China by around 2005 [
1]. About 30% of China’s total energy use can be attributed to buildings. In addition, although per capita carbon emissions is low, energy use in commercial buildings can be high. Xiao
et al. [
2] conducted a statistical analysis of annual energy use data from 4600 office buildings across China and observed a unique dual sector characteristic in energy use intensity reflecting a large proportion of buildings with low energy use intensity (EUI) and a small proportion of buildings with a significantly higher EUI. An example is given where two large office buildings in the same city, one with and one without operable windows, attributed 0.2 kWh/m
2-year and 5.8 kWh/m
2-year, respectively, to heating, ventilation, and air-conditioning (HVAC) energy use, the former having opened windows during the transitional seasons to meet comfort requirements. Growth in the proportion of buildings in the latter category is anticipated and can be attributed to an increased demand for a higher service standard. As the demand for a higher standard of living increases, demand for amenities such as large area windows, tighter ranges on indoor setpoint temperatures, 24-h HVAC operation,
etc., will increase. These drivers point to significant growth in the energy use intensity per building and energy demand overall across the country.
To counter this increased demand, the Chinese government has and continues to implement aggressive energy policies to improve the energy efficiency of buildings. Growth in commercial building primary energy use is expected to increase from 5 Quads (10
12 Btu) in 2005 to more than 13 Quads by 2020, where about 50%–60% of energy use is due to heating, ventilation, and air-conditioning (HVAC) and 20%–30% is due to lighting [
3,
4]. The “Design Standard for Energy Efficiency of Public Buildings” (GB 50189-2005, [
5]) was implemented in July 2005 with the goal of reducing public sector building energy use levels by 50% compared to consumption levels in 1983 (public buildings include office buildings, schools, hotels, hospitals, retail,
etc.). Seven years later, major cities (e.g., Beijing, Shanghai, Tianjin, Chongqing, and Shenzhen) have or are implementing more stringent energy efficiency standards that target a 65% reduction in energy use. There are also voluntary certification programs such as the Evaluation Standard for Green Buildings (GB/T 50378-2006) initiated in 2006 and the Three-Star Green Buildings program. These programs are similar to the US Green Building Council’s Leadership in Energy and Environmental Design (LEED) program and have been developed to award sustainable building design and operations.
In the face of rapid growth in the buildings sector over the past two decades, such policies are a powerful and practical means of enabling China to meet greenhouse gas emission reduction goals. China’s 12th Five Year Plan (2011–2015) seeks to reduce all sector energy intensity (primary energy use per unit of gross domestic product (GDP)) by 16% and commits to reduce CO
2 intensity (CO
2 per unit GDP) by 40%–45% below 2005 levels by 2020 [
6]. Implementation of energy efficiency policies will also enable China to address critical situations brought on by rapid urbanization, reducing energy demand given limited supply, improving environmental quality through the reduction of air pollution, and enhancing market competitiveness by reducing operating costs.
Like the US, China building energy efficiency codes are developed in collaboration with The Ministry of Construction, The Ministry of Housing and Urban Development (MOHURD), industry or manufacturer associations, and the design and engineering community. The GB 50189-2005 Standard was developed and is supported by the China Academy of Building Research. The Standard is mandatory nationwide and is enforced by local governments. Like the development of the US model energy code American Society of Heating, Refrigerating and Air-Conditioning Engineers (ASHRAE) 90.1, the GB 50189-2005 Standard was developed by modeling a typical early 1980s public building using the US Department of Energy’s DOE-2 building energy simulation program, then applying energy efficient component measures to achieve 50% savings [
7]. Selection of component measures is driven by a balance between efficiency goals and practical constraints, identifying which energy-efficiency strategies and measures will deliver adequate, sustained savings, which are commercially available and supported by a relatively mature infrastructure for efficient dissemination across the country, which are likely to succeed given the preferences of the building industry, and which will meet the cost-effective criteria defined by a competitive market.
Fenestration systems—windows, solar control shading systems, and daylighting systems—affect two of the largest energy end uses in Chinese public buildings: HVAC and lighting. The objective of this study is to: (a) provide an overview of applicable code requirements and current efforts within China to enable characterization and comparison of window and shading products, and (b) quantify the load reduction and energy savings potential of several key advanced window and shading systems, given the divergent views on how space conditioning requirements will be met in the future. We investigate the 50% and 65% energy efficiency code requirements as related to windows, then survey which basic window glazing products meet the prescriptive requirements mandated by the codes. We then investigate the energy savings potential of several alternate fenestration systems to gauge performance relative to the GB 50189-2005 Standard and discuss the potential success of such measures within the pragmatic context of the commercial building construction market in China.
2. Energy-Efficiency Requirements for Fenestration
2.1. Energy-Efficiency Standards
As a component measure, windows are subject to efficiency requirements dictated by the code. Maximum whole window U-values and center-of-glass shading coefficient (SC) requirements are specified in the mandatory section of the GB 50189-2005 code. Similar to the ASHRAE 90.1 building energy efficiency standard [
8], the requirements are defined by climate zone, window orientation, and window-to-wall ratio (WWR, defined without the window frame). See
Table 1. To enable reduction of lighting energy use, small area windows with a WWR less than 0.4 must have a center-of-glass visible transmittance (Tvis) greater than or equal to 0.4, even though there are no mandatory requirements for daylighting controls. Exterior shading is recommended in some climates. A minimum of 30% of the windows must be operable.
Table 1.
Prescriptive building envelope requirements defined by the GB 50189-2005 Standard.
Table 1.
Prescriptive building envelope requirements defined by the GB 50189-2005 Standard.
| Climate Zone Severe Cold A (Harbin) |
| Element | Max. Uw, Actual Uw, Actual Ug (W/m2·K) | Max SC Value, Actual SHGC |
| Window | WWR ≤ 0.2 | 3.0, 2.51, 1.8 | - |
| 0.2 < WWR ≤ 0.3 | 2.8, 2.37, 1.8 | - |
| 0.3 < WWR ≤ 0.4 | 2.5, 2.30, 1.8 | - |
| 0.4 < WWR ≤ 0.5 | 2.0, 1.84, 1.3 | - |
| 0.5 < WWR ≤ 0.7 | 1.7, 1.59, 1.1 | - |
| Climate Zone Cold (Beijing) |
| Element | Max. Uw, Actual Uw, Actual Ug (W/m2·K) | Max SC Value, Actual SHGC |
| Window | WWR ≤ 0.2 | 3.5, 3.09, 2.7 | - |
| 0.2 < WWR ≤ 0.3 | 3.0, 3.00, 2.7 | - |
| 0.3 < WWR ≤ 0.4 | 2.7, 2.14, 1.6 | SC ≤ 0.7, 0.44 |
| 0.4 < WWR ≤ 0.5 | 2.3, 2.08 1.6 | SC ≤ 0.6, 0.44 |
| 0.5 < WWR ≤ 0.7 | 2.0, 1.99, 1.6 | SC ≤ 0.5, 0.44 |
| Climate Zone Hot Summer/Cold Winter (Shanghai) |
| Element | Max. Uw, Actual Uw, Actual Ug (W/m2·K) | Max SC Value, Actual SHGC |
| Window | WWR ≤ 0.2 | 4.7, 3.09, 2.7 | - |
| 0.2 < WWR ≤ 0.3 | 3.5, 2.95, 2.5 | SC ≤ 0.55, 0.41 |
| 0.3 < WWR ≤ 0.4 | 3.0, 2.77, 2.4 | SC ≤ 0.50/0.60 *, 0.37 |
| 0.4 < WWR ≤ 0.5 | 2.8, 2.10, 1.6 | SC ≤ 0.45/0.55 *, 0.32 |
| 0.5 < WWR ≤ 0.7 | 2.5, 1.99, 1.6 | SC ≤ 0.40/0.50 *, 0.30 |
| Climate Zone Hot Summer/Warm Winter (Guangzhou) |
| Element | Max. Uw, Actual Uw, Actual Ug (W/m2·K) | Max SC value, Actual SHGC |
| Window | WWR ≤ 0.2 | 6.5, 5.79, 5.8 | - |
| 0.2 < WWR ≤ 0.3 | 4.7, 3.12, 2.4 | SC ≤ 0.5/0.6 *, 0.41 |
| 0.3 < WWR ≤ 0.4 | 3.5, 3.03, 2.4 | SC ≤ 0.45/0.55 *, 0.41 |
| 0.4 < WWR ≤ 0.5 | 3.0, 2.96, 2.4 | SC ≤ 0.4/0.5 *, 0.37 |
| 0.5 < WWR ≤ 0.7 | 3.0, 2.20, 1.6 | SC ≤ 0.35/0.45 *, 0.32 |
The stricter 65% Standards were developed and piloted for select cities as mentioned above. As an illustration of these more stringent standards, we list the prescriptive window requirements defined by the Shanghai Design Standard for Energy Efficiency in Public Buildings (DGJ08-107-20) in
Table 2.
Table 2.
Prescriptive window requirements defined by the DGJ08-107-20 code for Climate Zone Hot Summer/Cold Winter (Shanghai).
Table 2.
Prescriptive window requirements defined by the DGJ08-107-20 code for Climate Zone Hot Summer/Cold Winter (Shanghai).
| Element | Max. U values (W/m2·K) | Window Shading Coefficient |
|---|
| Roof | 0.5 | - |
| Walls | 0.8 | - |
| Floor (contacted with ambient air) | 0.8 | - |
| Window | WWR ≤ 0.2 | 3.5 | - |
| 0.2 < WWR ≤ 0.3 | 3.2 | SCW ≤ 0.45 |
| 0.3 < WWR ≤ 0.4 | 2.8 | SCW ≤ 0.40/0.50 * |
| 0.4 < WWR ≤ 0.5 | 2.5 | SCW ≤ 0.35/0.45 * |
| 0.5 < WWR ≤ 0.7 | 2.2 | SCW ≤ 0.30/0.40 * |
For example, the 65% Shanghai Standard requires that public buildings greater than 5000 m2 in floor area with central air-conditioning have a total window shading coefficient (SCW) value of 0.30 or less and a whole window U-value of 2.2 W/m2-K or less for large-area, vertical windows with a WWR (without frame) between 0.50 and 0.70 facing south, east, or west. Here, the SCW is the product of the Shading Coefficient of Windows (SW) and the External Shading Coefficient (SD). SW is the product of the center-of-glass shading coefficient (SC) and the window frame factor, f (e.g., f = 0.70 for wood frame, f = 0.75 for aluminum frame). SD is determined by exterior (outdoor) shading type, geometry, orientation of window, and degree of opacity using a look-up table. The 65% Shanghai Standard enables the designer to reduce the solar control requirements for the glazed window if exterior or between-pane shading systems are used. For the same example above, if a horizontal overhang that is as deep as the height of the window is used, SD would be 0.7 for a south-facing window and the maximum center-of-glass shading coefficient SC of an aluminum-framed window could be raised from 0.40 to 0.57 (i.e., SCw = SC × f × SD so with no overhang, 0.3 = SC × 0.75 × 1 and with the overhang, 0.3 = SC × 0.75 × 0.70).
If an operable exterior or between-pane shading system is used and covers the whole window, the Shanghai Standard requires no calculation of the SCW, and the SCW is simply considered as code-compliant (User Instructions for DGJ08-107-20). The U-value requirements can also be reduced with a correction factor, g (e.g., g = 0.9 for a roller shade, g = 0.95 for a blind). For example, if a roller shade is used, the SCw requirement is considered as met regardless of the window properties, and the U-value requirement is increased to 2.4 W/m2-K compared to 2.2 W/m2-K if no exterior shade was used. The operation of the shade is not mandated—the shade can be manually operated or automated with motorized controls. In the case of ASHRAE 90.1, no credit is given for exterior shading unless the shading is proven to be permanently installed and if operable, automated at all times to control for the worst case sunny condition (even if it is overcast).
2.2. Prescriptive Glazing and Shading Measures
The primary means of meeting the GB 50189-2005 code is to specify unshaded glazed windows with the requisite properties. There are ten Chinese glass manufacturers, several of which are foreign firms manufacturing glass in partnership with Chinese manufacturers (i.e., Pilkington, Taiwan Glass, Asahi). China Southern Glass is by far the largest Chinese manufacturer. Domestic manufacturing is critical for compliance materials and products in large, rapidly growing construction markets like China. Not only is there a 40% tariff imposed on foreign products making imported products very expensive, demanding construction schedules result in low tolerance for delays in product delivery. Because of these constraints, the code development process accommodates cost-effective products that are commercially available from Chinese manufacturers.
The process of characterizing window properties using standardized methods was initiated in China to enable consumers to select, compare, and verify products for code compliance. Since the early 1990s, glass manufacturers from around the world have measured their products using protocols defined by international standards and submitted these data to the International Glazing Database (IGDB) [
9]. The IGDB, which was developed and is maintained by the Lawrence Berkeley National Laboratory (LBNL), now contains over 4100 glazing products. MOHURD and industry organizations initiated discussions with LBNL in early 2010 on how to measure window properties to enable entry of Chinese products to the IGDB, with a first training session occurring in August 2010 at LBNL. In October 2010, MOHURD agreed to begin to adopt the International Standards Organization ISO 15099, which specifies the detailed calculations procedures for determining the thermal and optical transmission properties of window systems. Data submissions were first received in November 2010 and a second international training workshop was held at LBNL in February 2011. Manufacturers were then qualified to submit data after successfully participating in an interlaboratory comparison.
All ten manufacturers are now contributing measured spectral, conductance, and emittance data for their glazing products to the IGDB, coordinated through the China National Safety Glass and Quartz Glass Test Center. As of the latest release of the IGDB (version 23), there were a total of 246 submittals from Chinese manufacturers (
Table 3). In parallel, a Chinese version of LBNL’s Window 6 software [
10] was rewritten in collaboration with LBNL and is now being distributed by the Guangdong Provincial Academy of Building Research (PABR). This software tool computes whole window solar heat gain coefficient (SHGC) and
U-values for any arbitrary combination of glazings from the IGDB, spacers and framing systems, gas fills, and some common shading devices in accordance with ISO 15099. Framing and spacer products are offered by numerous vendors in China. Some foreign companies with manufacturing plants in China import thermally-broken spacers for use in the fabrication of insulating glass units. LBNL’s Therm software for modeling framing and spacer systems is publicly available and free for use (in English).
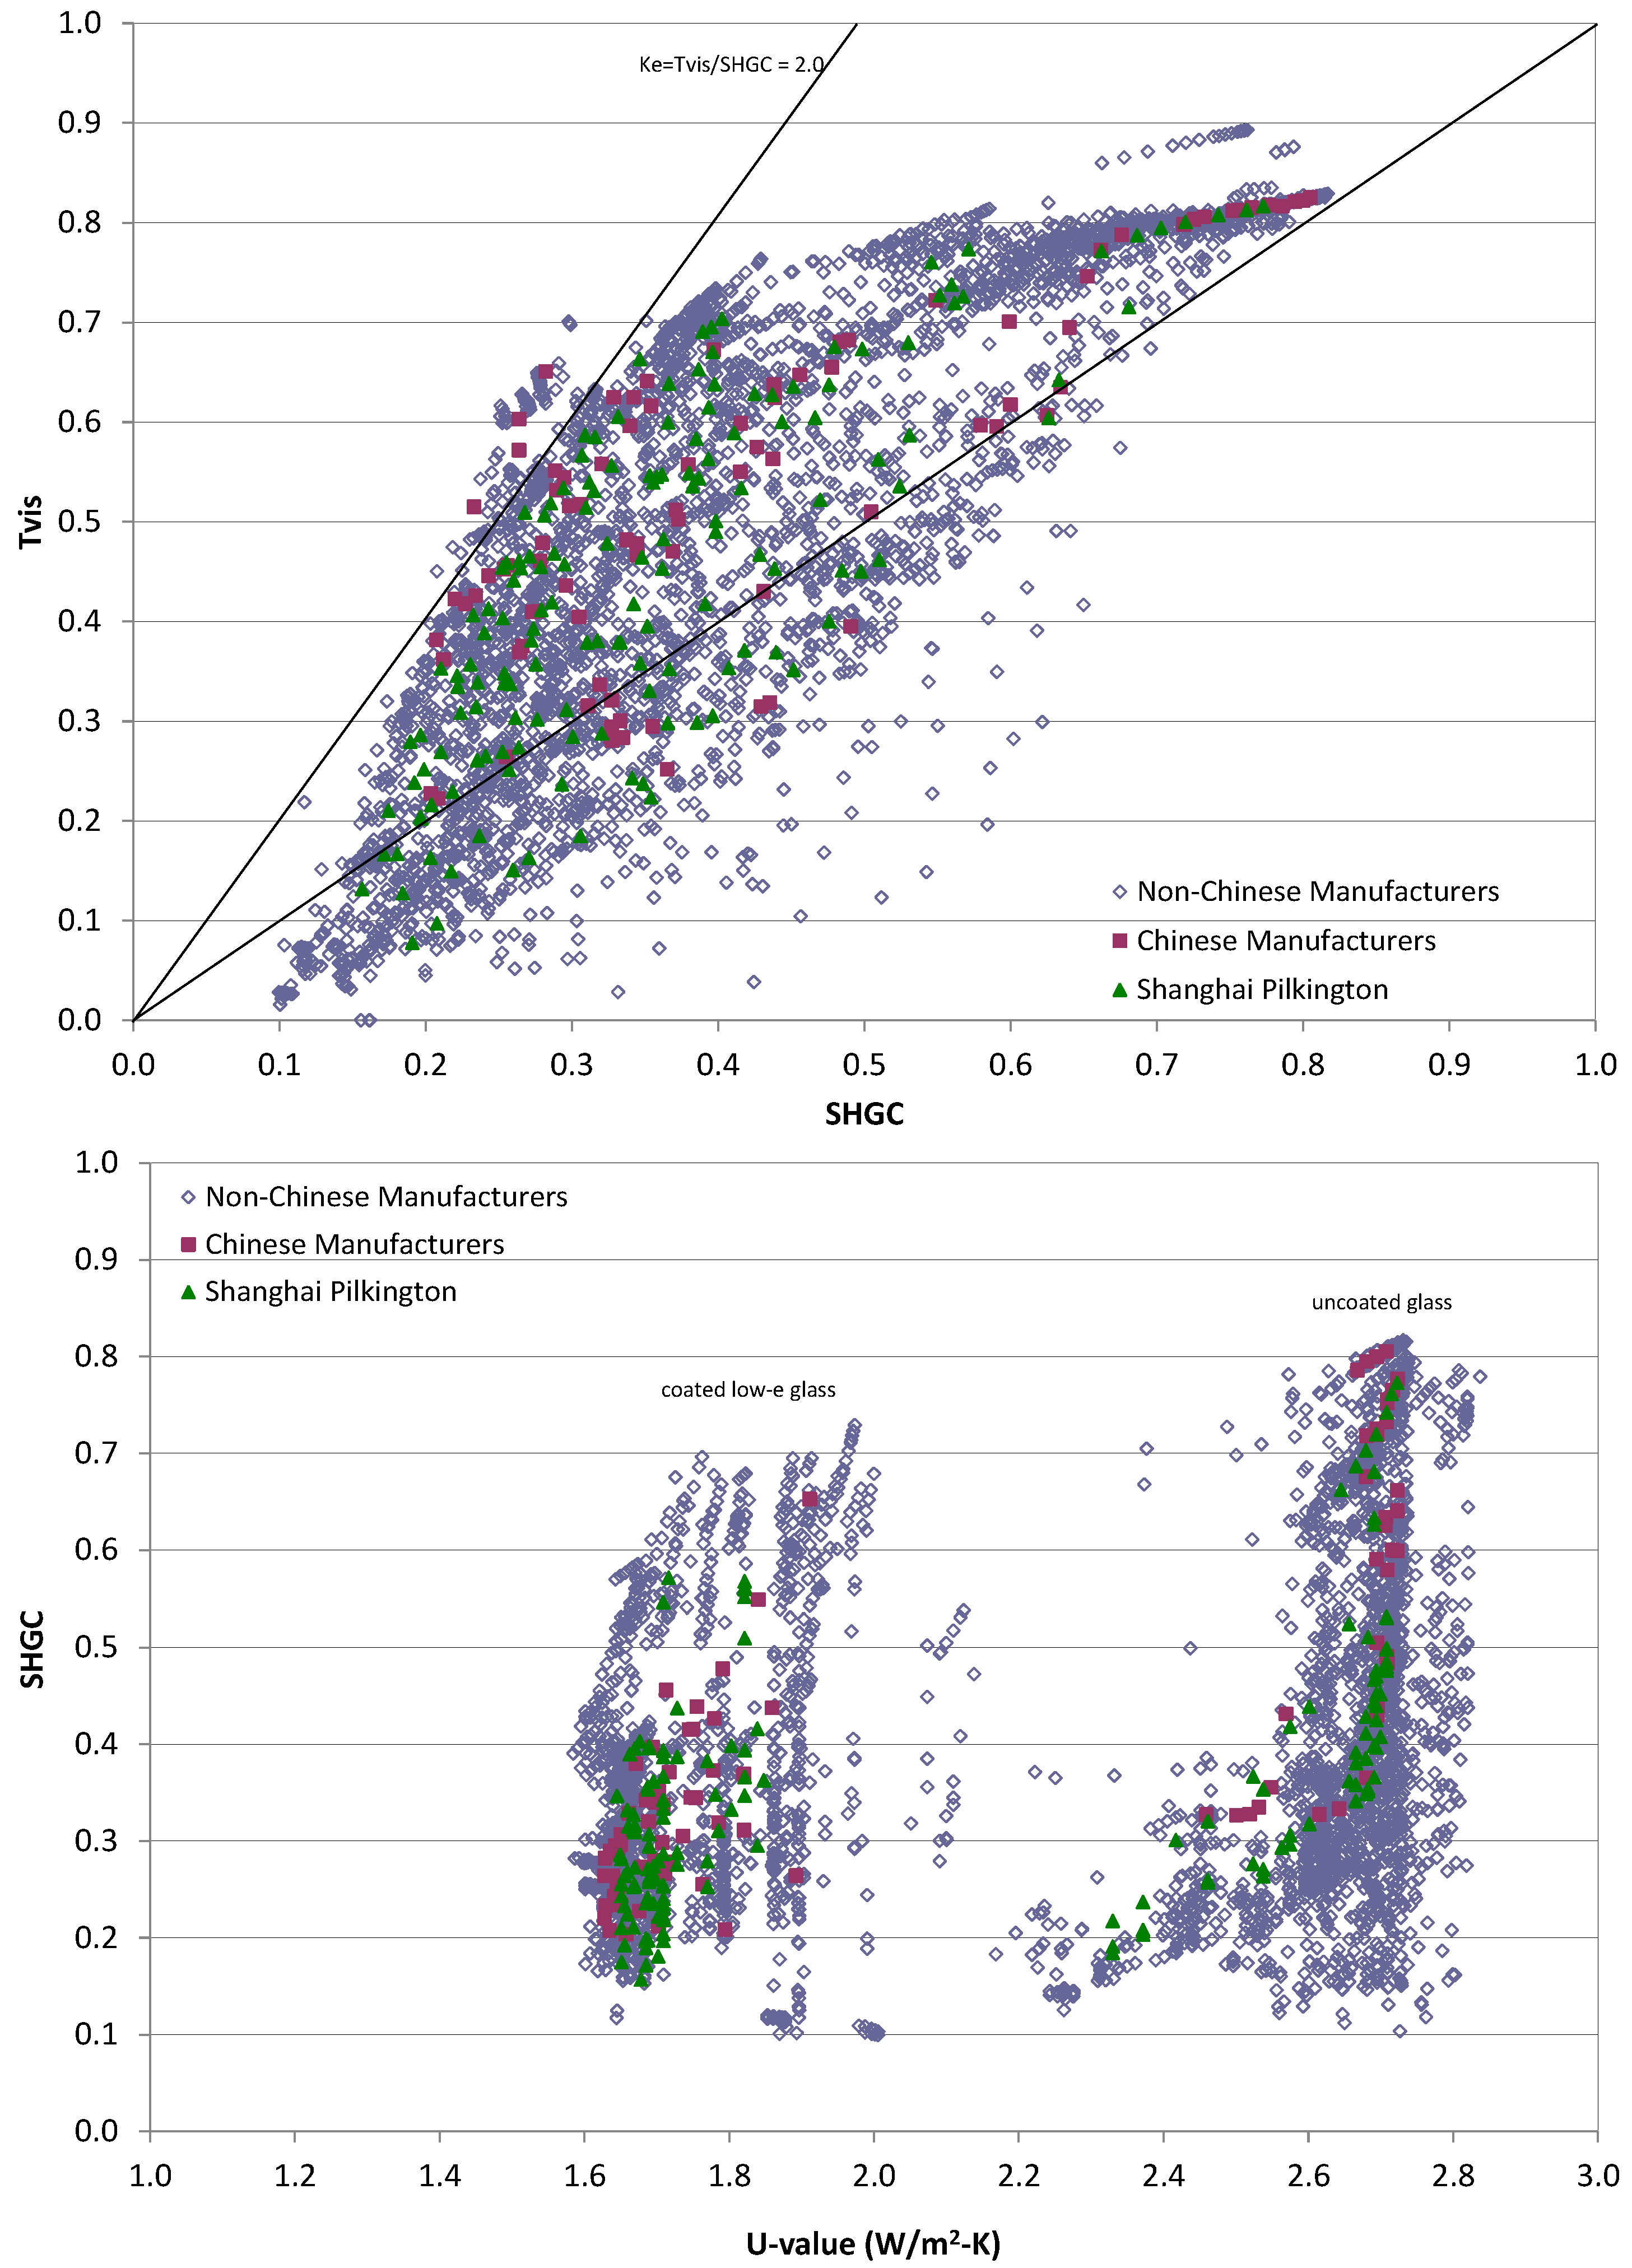
To understand what range of window products are commercially available from Chinese manufacturers, glazing layers from the IGDB were combined into an insulating glass unit (IGU), assuming a clear 3 mm inboard lite, thermally broken spacer, and a 12.7 mm air gap. Center-of-glass SHGC, U-value, and visible transmittance (Tvis) data for these IGUs are given for all Chinese manufacturers and for all commercial products available worldwide in
Figure 1 (SC values can be converted to SHGC by multiplying the value by 0.87 (e.g., SC = 0.30 is SHGC = 0.26). Products with a daylight-to-solar ratio (Tvis/SHGC) between 2.0 to 2.5 are amongst the high-performance glazings on the market today for commercial building applications since they simultaneously reject solar gain and admit daylight. As shown in
Figure 1, there are more than a few glazing products that meet the more stringent requirements (assuming the center-of-glass
U-value is nearly the same as the whole window
U-value if the window is large).
Figure 1.
Center-of-glass solar heat gain coefficient, U-value, and visible transmittance (Tvis) data for all glass layers in the IGDB (version 23) combined with a clear 3 mm inboard lite and a 12.7 mm air gap. Lines depict a Ke ratio (Tvis/SHGC) of 2.0 and 2.5.
Figure 1.
Center-of-glass solar heat gain coefficient, U-value, and visible transmittance (Tvis) data for all glass layers in the IGDB (version 23) combined with a clear 3 mm inboard lite and a 12.7 mm air gap. Lines depict a Ke ratio (Tvis/SHGC) of 2.0 and 2.5.
Table 3.
Chinese glass manufacturers with submittals in the International Glazing Database (IGDB).
Table 3.
Chinese glass manufacturers with submittals in the International Glazing Database (IGDB).
| Manufacturer | No. of products in IGDB ver.23 |
|---|
| AGC Flat Glass (Dalian) Co., Ltd (company of Asahi) (AFD) | 1 |
| China Southern Glass (CSG) | 61 |
| Grand Engineering Glass (GRA) | 8 |
| Guangdong Avic Special Glass Technology Co., Ltd (SGT) | 0 |
| Intex Glass ( Xaimen ) Co., Ltd (INX) | 0 |
| Luoyang NewJingrun Architectural Glass Co., Ltd (NJR) | 1 |
| Shanghai Yaohua Pilkington Glass Co., Ltd (SYP) | 155 |
| Taiwan Glass Ind. Corp. (TGI) | 14 |
| Yantai Jialong Nano Industry Co., Ltd (YJN) | 3 |
| ZNG Glass Co., Ltd. (ZNG) | 3 |
| Total submittals | 246 |
There are no comparable single value performance indices for comparing shading and daylighting systems. For glazings, a normal incidence value for SC and Tvis is sufficient to compare different products. For shading systems, SC and Tvis can vary significantly, depending on solar angle of incidence and position of the shading system (tilt angle of louvers, height of shade,
etc.). There is significant research activity underway to characterize and model the solar heat gain and daylight performance of light scattering or optically complex fenestration systems using bidirectional transmittance and reflectance or scattering distribution function (BSDF) data [
11,
12]. At present, the energy performance of common systems like roller shades or Venetian blinds can be modeled in software like EnergyPlus assuming hemispherical diffusing or Lambertian surface reflectance properties.
3. Energy Savings Potential of Fenestration Measures
3.1. Definition of Office Building Prototype
To understand how advanced window and shading technologies will perform relative to the GB 50189-2005 Standard, we use building energy simulations to evaluate the energy savings potential for a prototypical office building. In a prior study by Lam
et al. [
13], building energy simulations were conducted for the five major climate zones in China to investigate the thermal and energy performance of office buildings and identify measures that could increase building energy efficiency. Findings indicated that passive solar designs would yield significant energy savings in severe cold and cold climates and control of solar heat gains through windows in hot climates were required. In a related study by Yang
et al. [
14], heat gains and losses of three generic office building envelope designs were assessed for the five major climates in China to determine what building envelope measures could be used to improve building energy efficiency during major retrofits of existing buildings in China. This second study provided more specific guidance for the different climates, such as use of solar control films to reduce solar gains or using reduced
U-value windows for heating-dominated climates. Unlike these prior studies, this study provides a more detailed evaluation of the various window and shading parameters affecting perimeter zone energy performance.
In the US, building energy-efficiency codes were initially developed by conducting parametric building energy simulations of prototypical buildings [
15]. Building prototypes are often abstract, synthetic buildings, not real buildings, that have been developed for the purpose of being representative of a population of buildings of a given type; e.g., office, hospital,
etc., Data are collected on real buildings and these data are used to formulate a statistical representation of building construction, systems, and operations [
16]. The US Department of Energy (DOE) has invested in the development of such prototypes over the past few decades, and has made such prototypes publicly available for use by the buildings industry in order to standardize methods for evaluating technical measures and policies [
17]. The models were developed for use with the EnergyPlus building energy simulation program [
18]. We made inquiries as to whether the Chinese had similar models and were answered with the affirmative, but the models are proprietary and not available for public use. Therefore, in order to estimate energy savings of alternate energy efficiency measures, we modified the DOE large office prototype so that we had one EnergyPlus model that complied with the 1983 baseline building model (“baseline”) and a second model that complied with the GB 50189-2005 standard (“code”). Assumptions for these models are given in
Appendix A (
Table A1,
Table A2,
Table A3,
Table A4 and
Table A5).
The large office prototype is a 12-story, 48 m high building with a rectangular floor plate that is 73 m (north-south) by 49 m (east-west). Perimeter zones are 4.57 m deep, with a 2.7 m ceiling height and a floor-to-floor height of 4 m. Exterior walls are of mass wall construction. No exterior obstructions were modeled. Internal loads were 18 W/m
2 for lighting, 13 W/m
2 for equipment loads, and 8 m
2 per person for occupant loads. Occupancy was primarily between the hours of 9:00 to 17:00 on weekdays. The HVAC schedule assumed setpoint temperatures of 20 °C for heating and 26 °C for cooling during occupied hours, and 12 °C for heating and 37 °C for cooling during unoccupied hours. Detailed schedules are given in
Appendix Table A5.
In China, HVAC systems for typical existing construction tend to be distributed, not centralized [
19,
20] and for new, low-energy building design, innovative heating and cooling strategies will tend to rely more on distributed hydraulic, perimeter zone solutions. For example, two- or four-pipe fan coil unit (FCU) systems with centralized outdoor air unit are more popular than variable-air-volume (VAV) systems. These FCUs are typically mounted in the ceiling at the entrance of the room, then used by the occupants on demand. Two-pipe systems cost less than four-pipe systems, but the two-pipe system is either in the cooling or heating mode which results in thermal discomfort if the system is meeting cooling demands in the south zone but heating is required in the north zone. Four-pipe systems enable more flexibility in maintaining individual zone comfort and are therefore more appropriate for large, high quality office buildings.
For heating, the solution depends on the climate. In Northern China, most buildings utilize district heating. In central China, the heating equipment is diverse, ranging from district heating, hot water boilers, to heat pumps. In Southern China, heating equipment is not allowed. Therefore, district heating is defined for the office prototype for the Harbin and Beijing climates, and no heating system is defined for Guangzhou. According to colleagues in China, the air-source heat pump is a better choice for providing heating in Shanghai because natural gas is expensive. However, modeling an air-source heat pump as central plant equipment is not supported in the current version of EnergyPlus, so we decided to use the electric hot water boiler as the heating equipment for the Shanghai climate.
Cooling is typically provided by water-cooled chillers for commercial buildings in China, so we used two equal-sized, water-cooled chillers in the prototype. The core of the office building as well as the facades with large-area windows and significant sun exposure require cooling even in winter. To provide chilled water to the building in winter with the proper handling of the condenser water for anti-freezing, we can either run the chiller or use the water-side economizer to generate the chilled water. In the prototype, we use the chiller to produce the chilled water in the winter for cooling.
3.2. Parametric Analysis of Window Systems
Parametric simulations were run on the large office prototype, varying the climate, window area, and window type (
Table 4). The windows for the 1983 baseline building were modeled using the Simple Glazing System method in EnergyPlus, and the GB 50189-2005 code and alternate windows were modeled using detailed glazing system data obtained from using full spectral data in the Window 6 software tool, which implements the ISO 15099 Standard for the calculation of SHGC and
U-value.
Table 4.
EnergyPlus parametric simulations.
Table 4.
EnergyPlus parametric simulations.
| Parameter | Values |
|---|
| Climate zones | Harbin, Beijing, Shanghai, Guangzhou |
| WWR | 0%, 15%, 30%, 45%, 60%, 70% |
| Window type | Reference | 1983 construction |
| Code | GB 50189-2005 compliant window |
| E1 | Low-e window |
| E2 | Low-e window with interior roller shade |
| E3 | Low-e window with exterior roller shade |
| F1 | Highly insulated window |
| F2 | Highly insulated window with interior roller shade |
| F3 | Highly insulated window with exterior roller shade |
Because we used data from commercially available, not hypothetical windows, the maximum SC and
U-value requirements for the 2005 code were not matched exactly. Actual values are given in
Table 4 for the windows that best matched the code requirements. As noted above,
U-value and SC requirements defined by Chinese codes are not in complete agreement with the definitions used by the ASHRAE 90.1 standard. The Chinese code defines WWR and SC without the frame but includes the frame in the definition of
U-value. The ASHRAE standard was used to define the WWR. No adjustments were made to the SC value, assuming that the frame area had a small effect.
Two alternate window types were modeled using Window 6
idf format descriptions as input to EnergyPlus: a spectrally selective dual pane window (E) and a triple pane insulating window (F) (
Table 5). Each window was modeled with no shade (case 1), with an interior shade (case 2), or with an exterior shade (case 3); e.g., E2 is window E with an interior shade.
Table 5.
Advanced window properties.
Table 5.
Advanced window properties.
| Type | Window E | Window F |
|---|
| Spectrally-Selective, Dual-Pane, Low-e | Highly Insulating, Triple-Layer, Low-e |
|---|
| Layer 1 | 6 mm low-e (IGDB ID# 5439) | 6 mm low-e (IGDB ID# 5439) |
| Gap | 1.27 cm Argon | 1.27 cm Argon |
| Layer 2 | 6 mm Clear (IGDB ID# 103) | Suspended film (IGDB ID# 350) |
| Gap | - | 1.27 cm Argon |
| Layer 3 | - | 6 mm low-e (IGDB ID# 5439 flipped) |
| U-value * | 2.17(15%), 2.01(30%), 1.92(45%), 1.85(60%), 1.76(70%) | 1.50(15%), 1.35(30%), 1.26(45%), 1.20(60%), 1.11(70%) |
| SHGC | 0.272 | 0.226 |
| SC | 0.313 | 0.260 |
| Tvis | 0.639 | 0.465 |
| Tvis/SHGC | 2.35 | 2.06 |
Both the interior and exterior shades were operated at each time step to reduce HVAC perimeter zone loads. A light gray fabric roller shade with an openness factor of 3% was modeled using the standard models in EnergyPlus. Spectral measurements for solar and visible absorption, reflectance and transmittance were used as input to the model. Operation of the shade was modeled using the “On night if heating and on day if cooling” mode (based on the setpoint and zone temperatures) to control window heat gains and losses and minimize HVAC energy use. Other measures (e.g., furniture placement, location of task and view direction) were assumed to be used to address other constraints such as thermal and visual discomfort. The algorithm was implemented as follows: (a) if it is nighttime (sun is down), then if the zone heating rate of the previous time step is non-zero (e.g., 10 W), then the shade is fully lowered over the window; and (b) if it is daytime (sun is up) and the zone cooling rate of the previous time step is non-zero, then the shade is lowered over the window.
3.3. Definition of Energy Use Metrics
The various window systems were evaluated using two metrics: (1) perimeter zone sensible heating and cooling load; and (2) perimeter zone HVAC energy use. These metrics were based on the loads and energy use for all twelve floors of the office prototype.
The perimeter zone sensible heating and cooling loads represent the sensible energy needed to maintain the room air temperature at the desired level as the zone thermal load resulting from heat flow through the building envelope and internal loads from equipment, people, and lighting varies. Inefficient mechanical system design and operations, such as how the HVAC system is sized, the operation and air flow rate from the dampers, and how outside air is conditioned, can obscure the performance impact of fenestration efficiency measures. These reported loads are independent of the HVAC system in use and are therefore useful as an indicator of how well the building envelope passively mitigates the thermal effects of the outdoor environment as would occur in very low energy buildings. Because there is significant uncertainty as to whether the HVAC models closely represent the systems used in China, these data provide fundamental information on the relative effectiveness of each window system in managing loads. The loads were computed assuming the same cooling and heating setpoint schedule as the HVAC schedule, where the load was zero if the zone temperature was within the setpoint deadband.
Annual HVAC energy use was also determined to provide a complete assessment on energy performance impacts. For this prototype, the ratio of the perimeter area to the total floor area was low (Ap/Atotal = 0.30) causing core energy use to dominate the whole building energy use profile. Therefore, perimeter zone district heating energy use or electric boiler energy use was determined by allocating energy use in proportion to the thermal demands within the zones. Perimeter zone HVAC electricity consumption was also determined in proportion to the thermal demands within the zones and included the total energy use required by all electric-based equipment (central plant chiller, condenser, pumps, fan coil units) needed to provide heating, cooling, and ventilation to these zones.
3.4. Results for a Cold Climate
Beijing was chosen as the representative city in a cold climate. Results are given in
Table 6,
Table 7,
Table 8 and
Table 9, and
Figure 2 and
Figure 3. In
Figure 2 and
Figure 3, the
x-
y plot depicts window-to-wall ratio (WWR) on the
x-axis and the sensible zone loads or annual energy use (MJ/m
2-floor-year) on the
y-axis. For reference, conversion factors are: 11.35 MJ/m
2-year = 1 kBtu/ft
2-year; 38.74 MJ/m
2-year = 1 kWh/ft
2-year. Performance of the two types of windows is benchmarked against the GB 50189-2005 code. Both unshaded windows E1 and F1 meet the SC and
U-value requirements of the 2005 code across the full range of WWR.
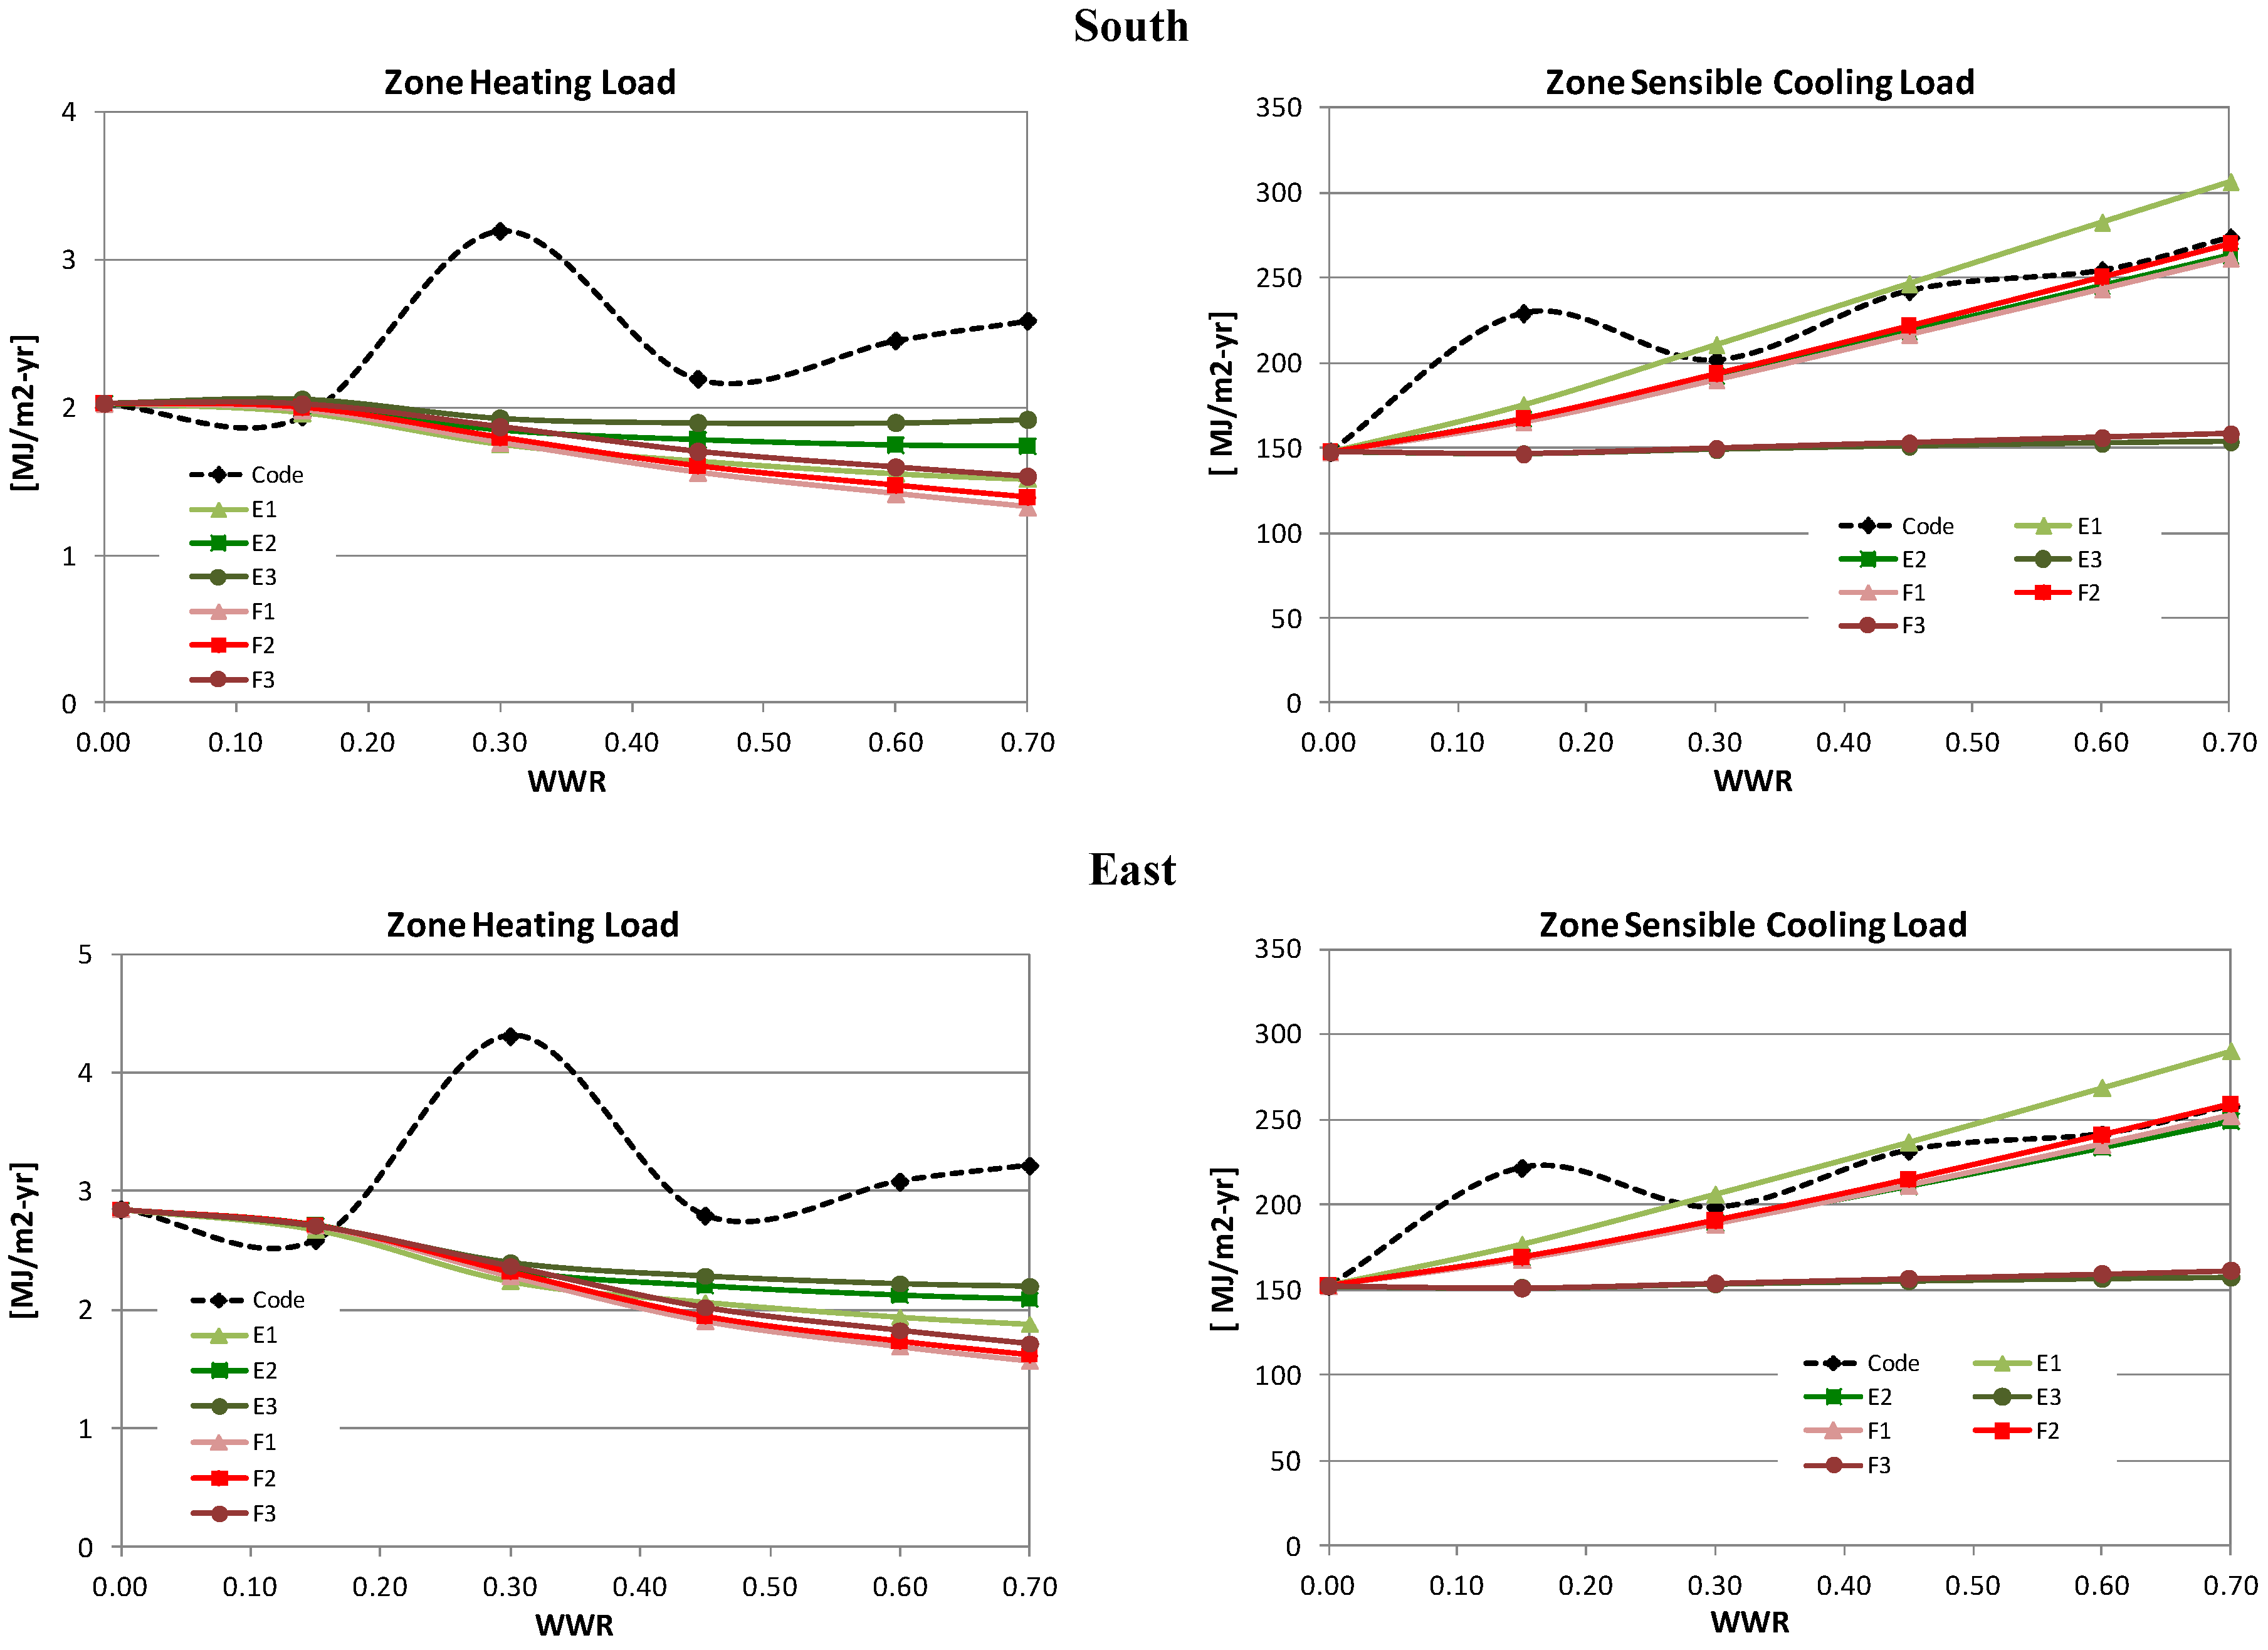
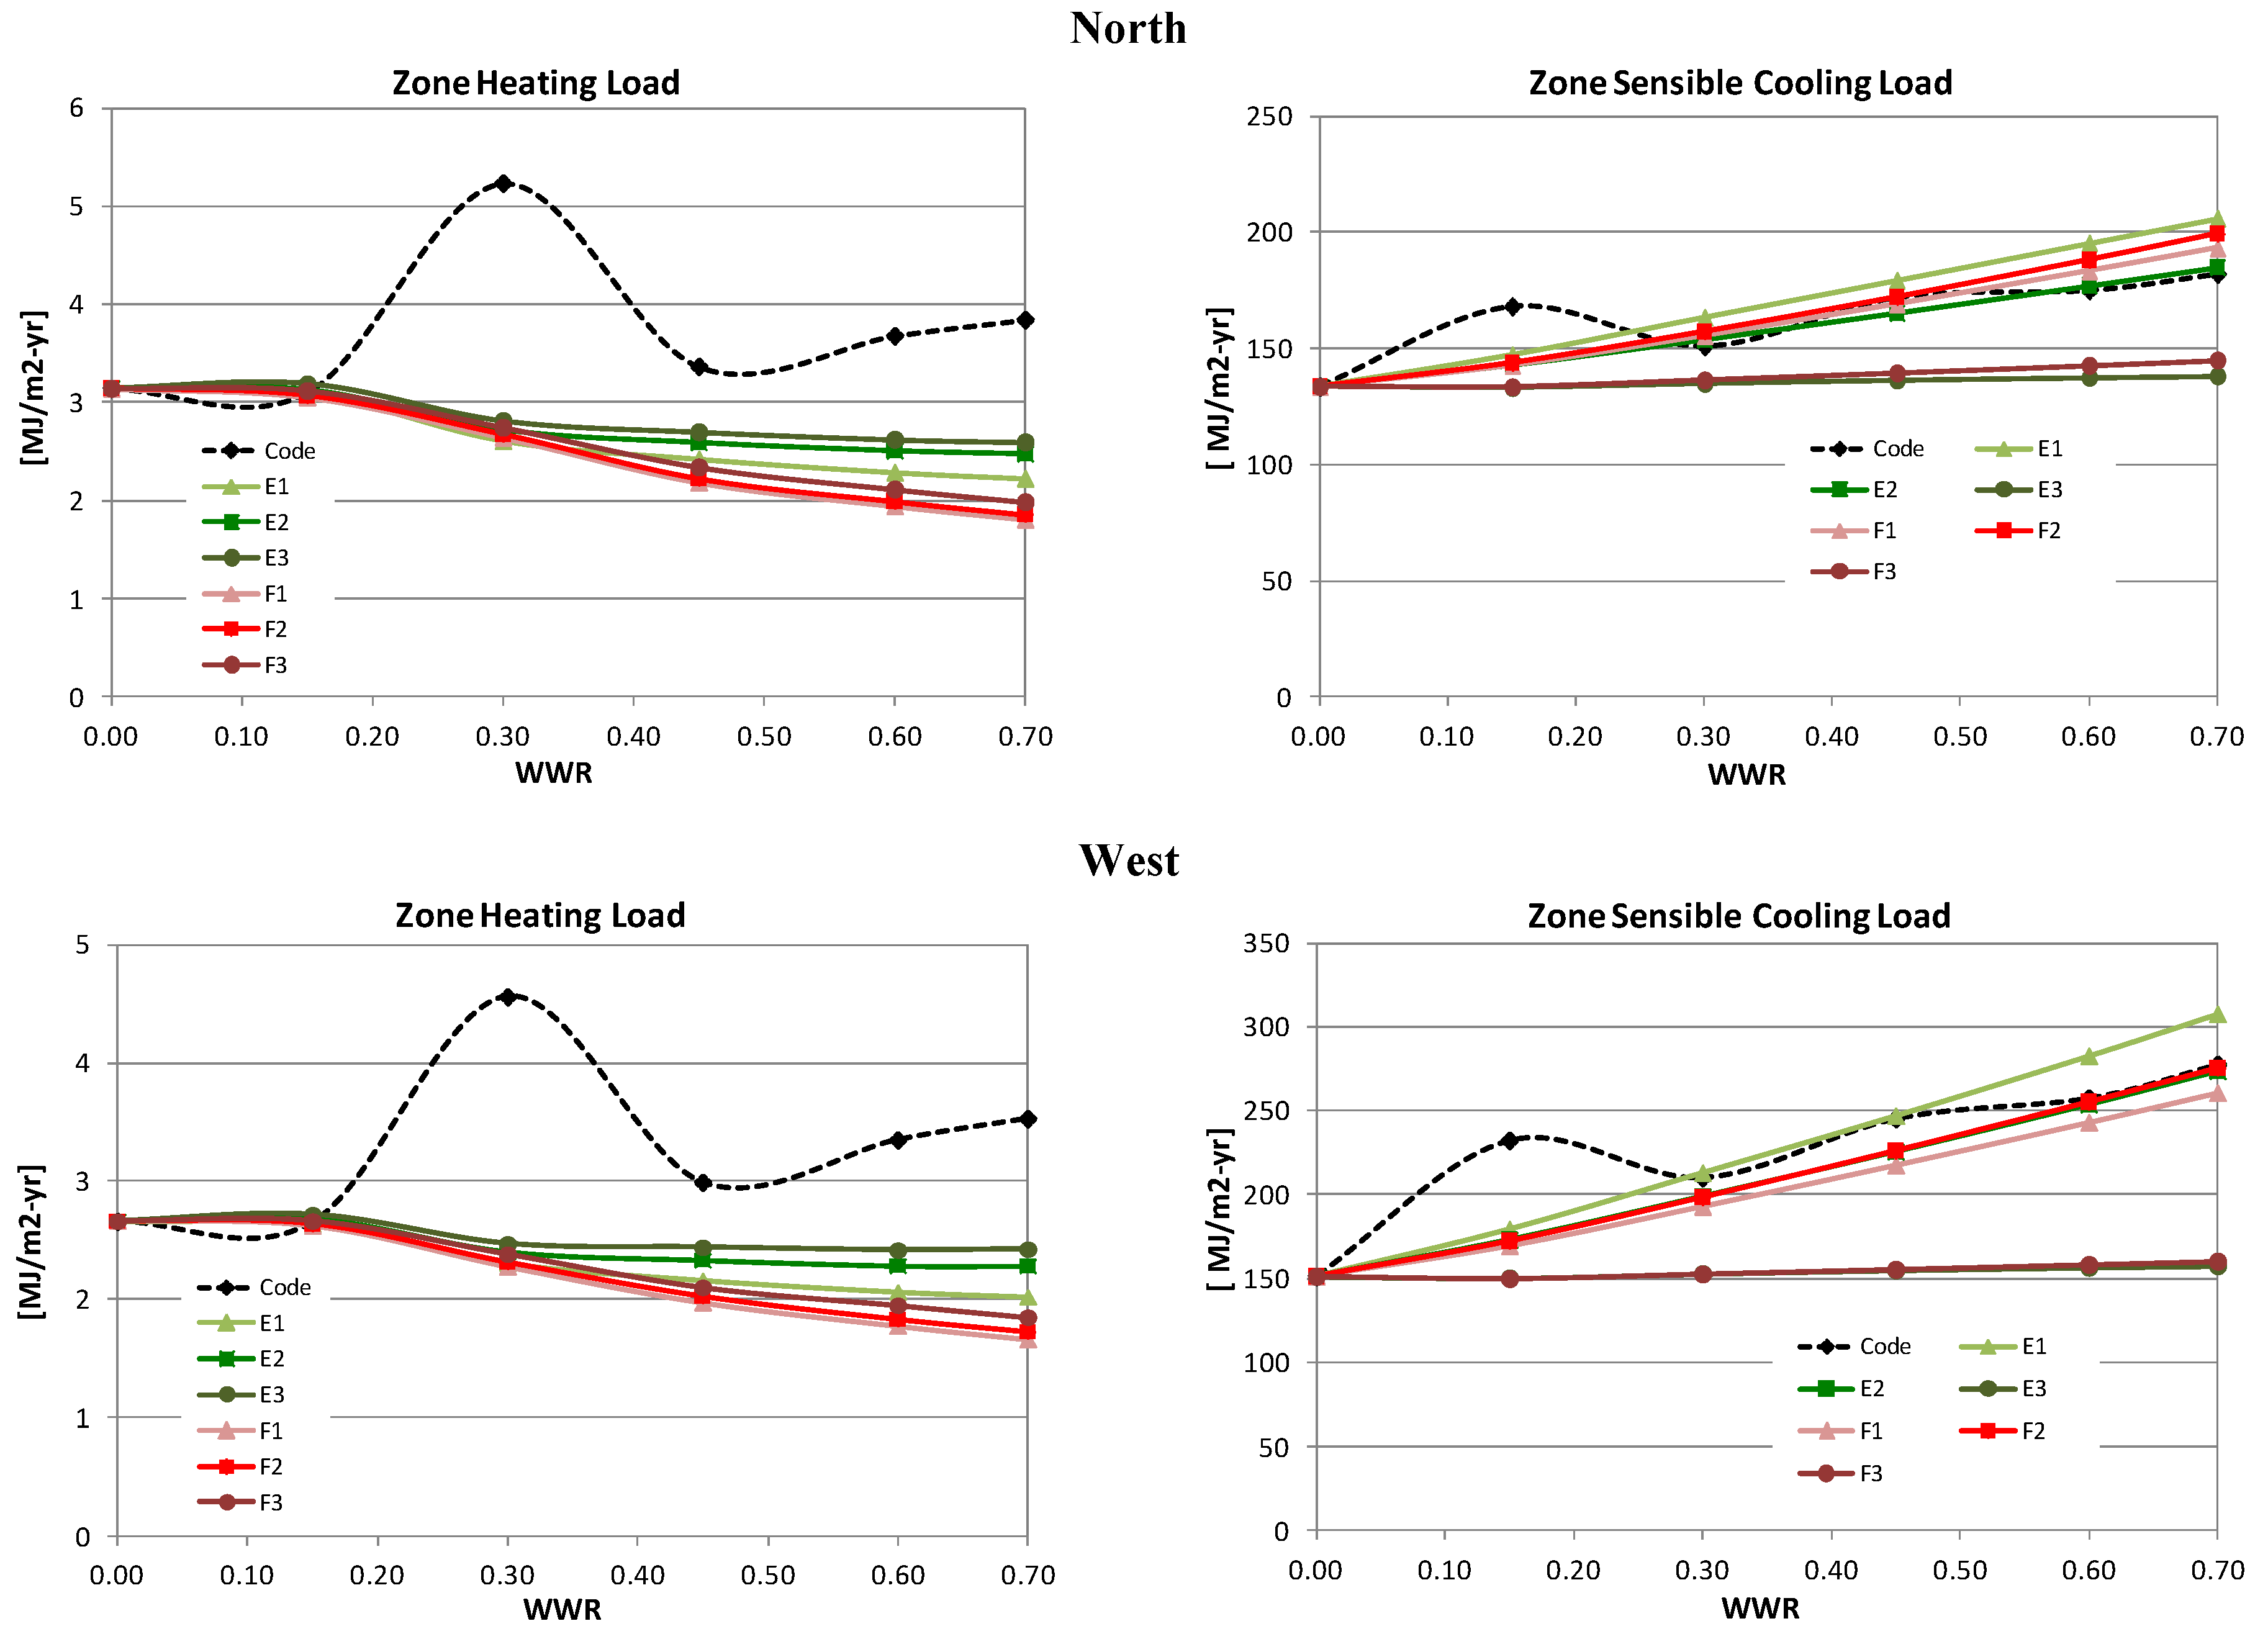
Figure 2.
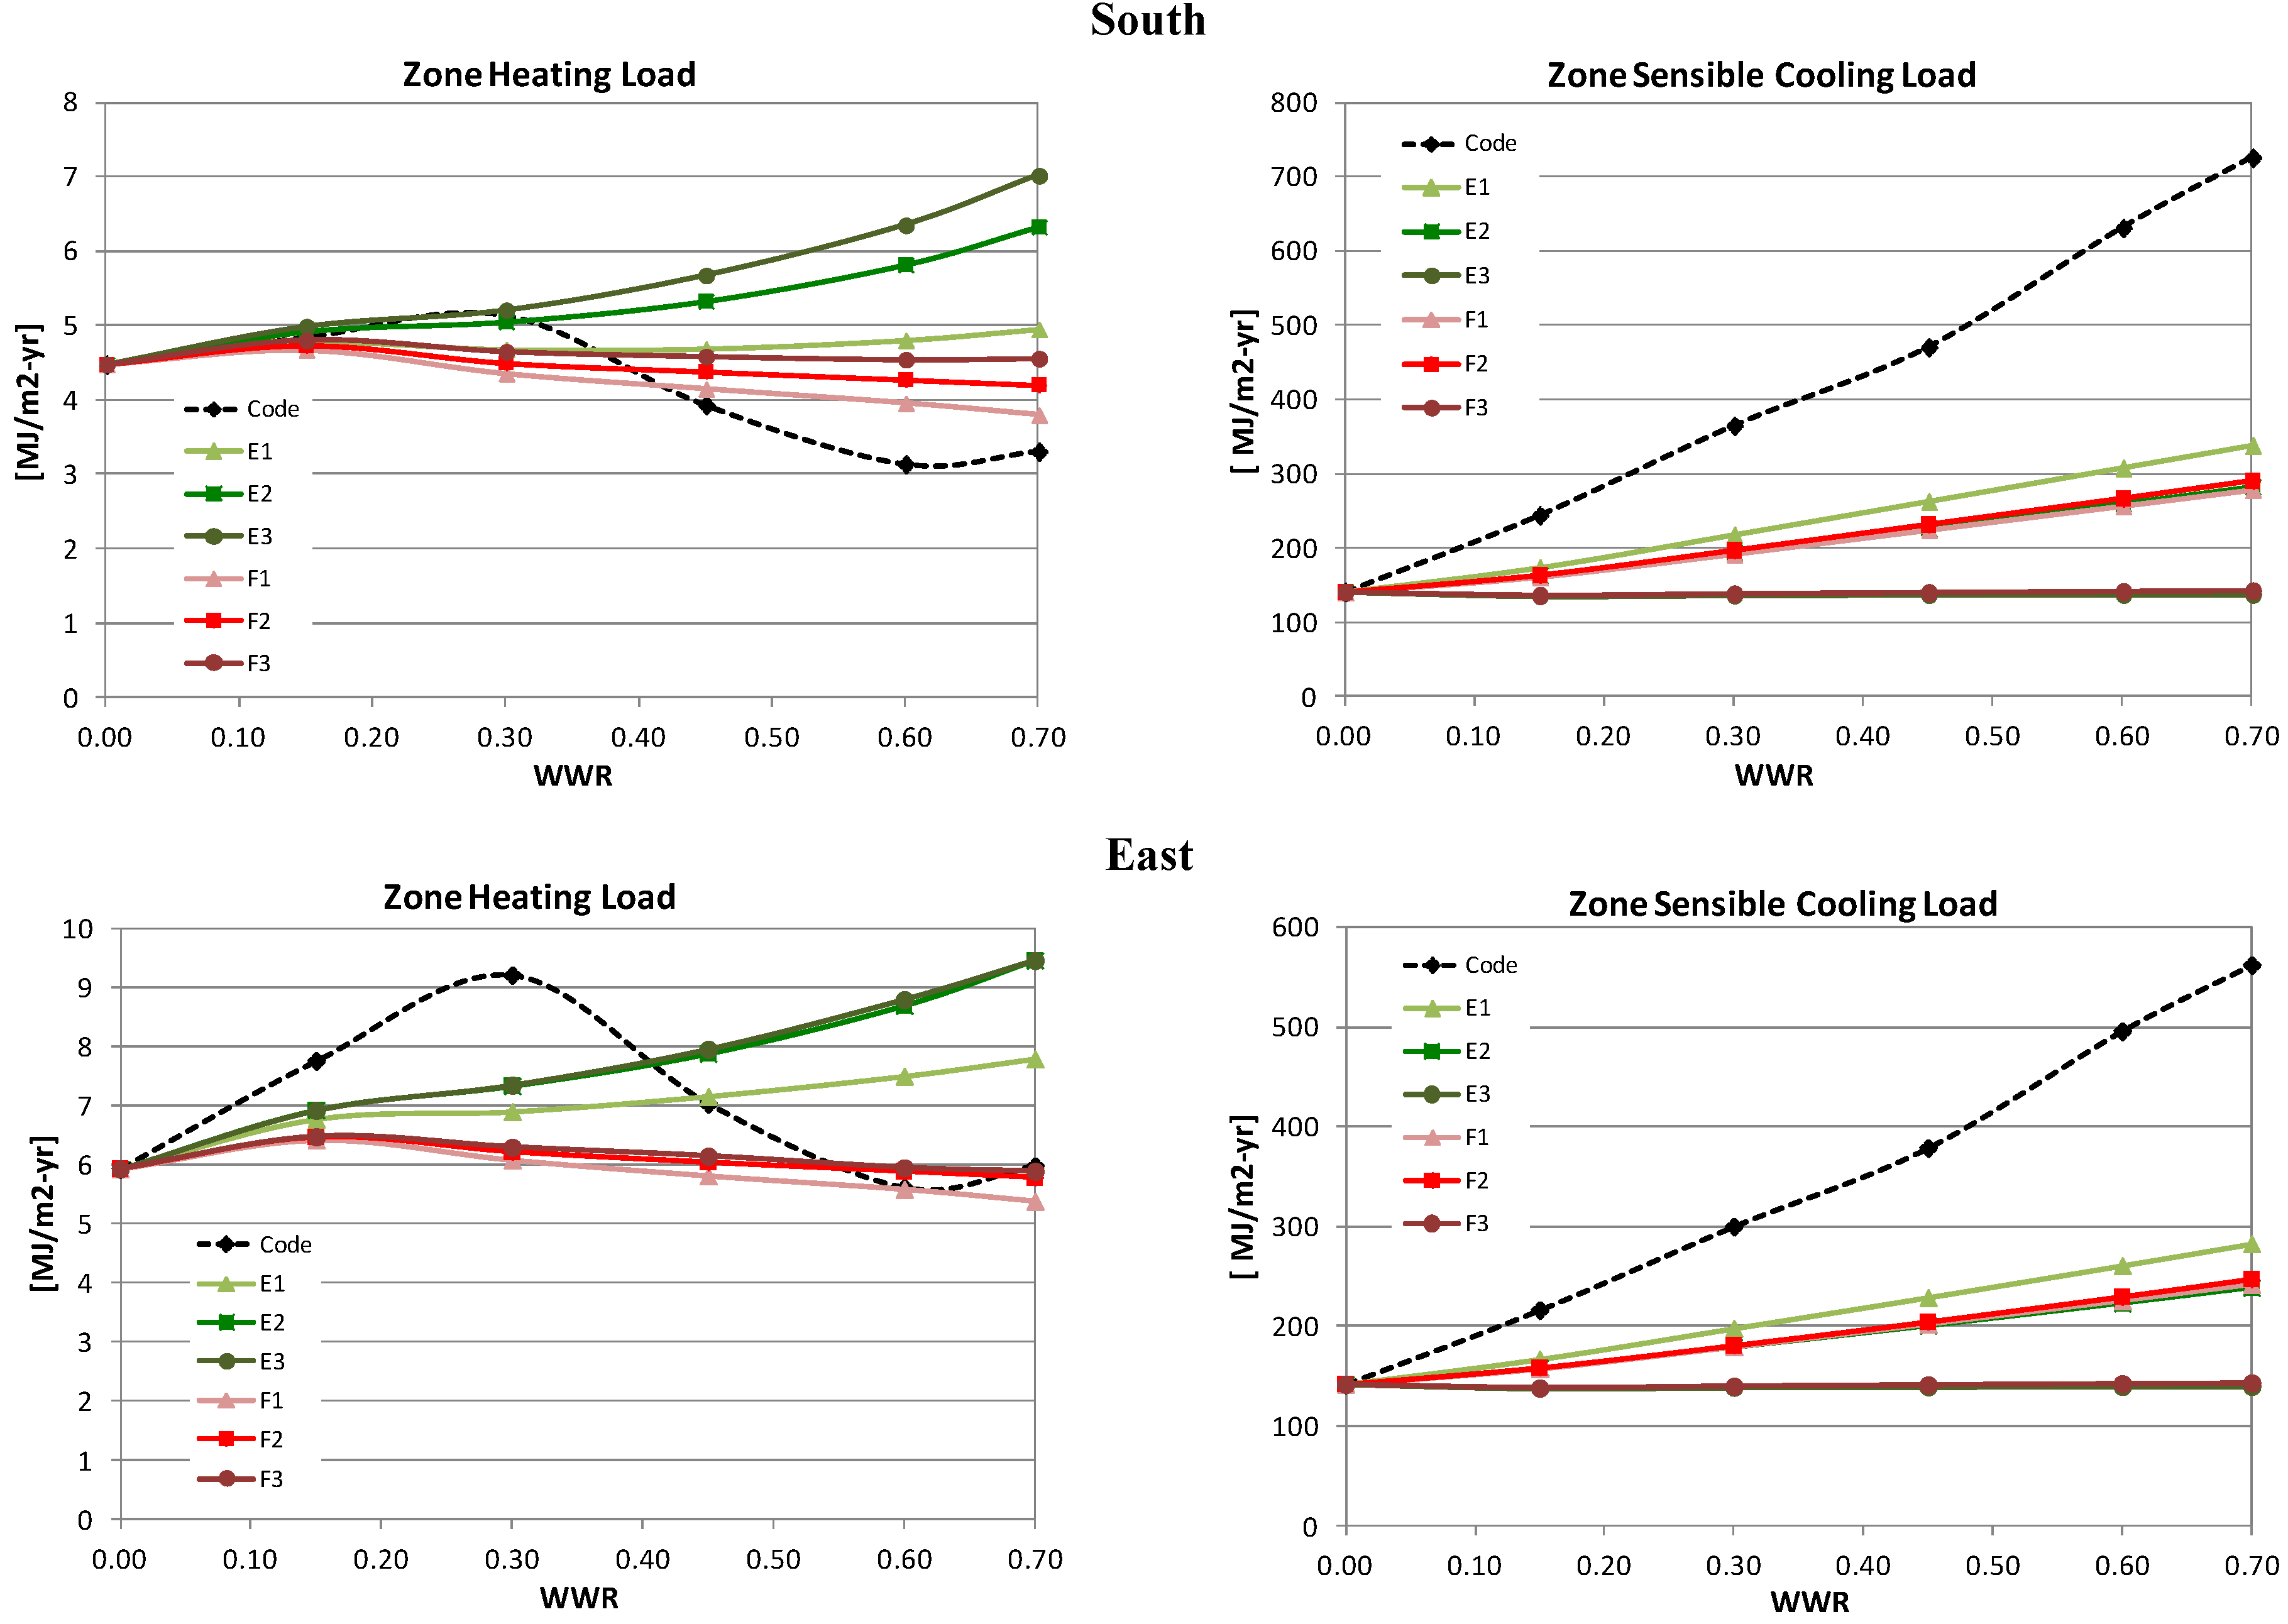
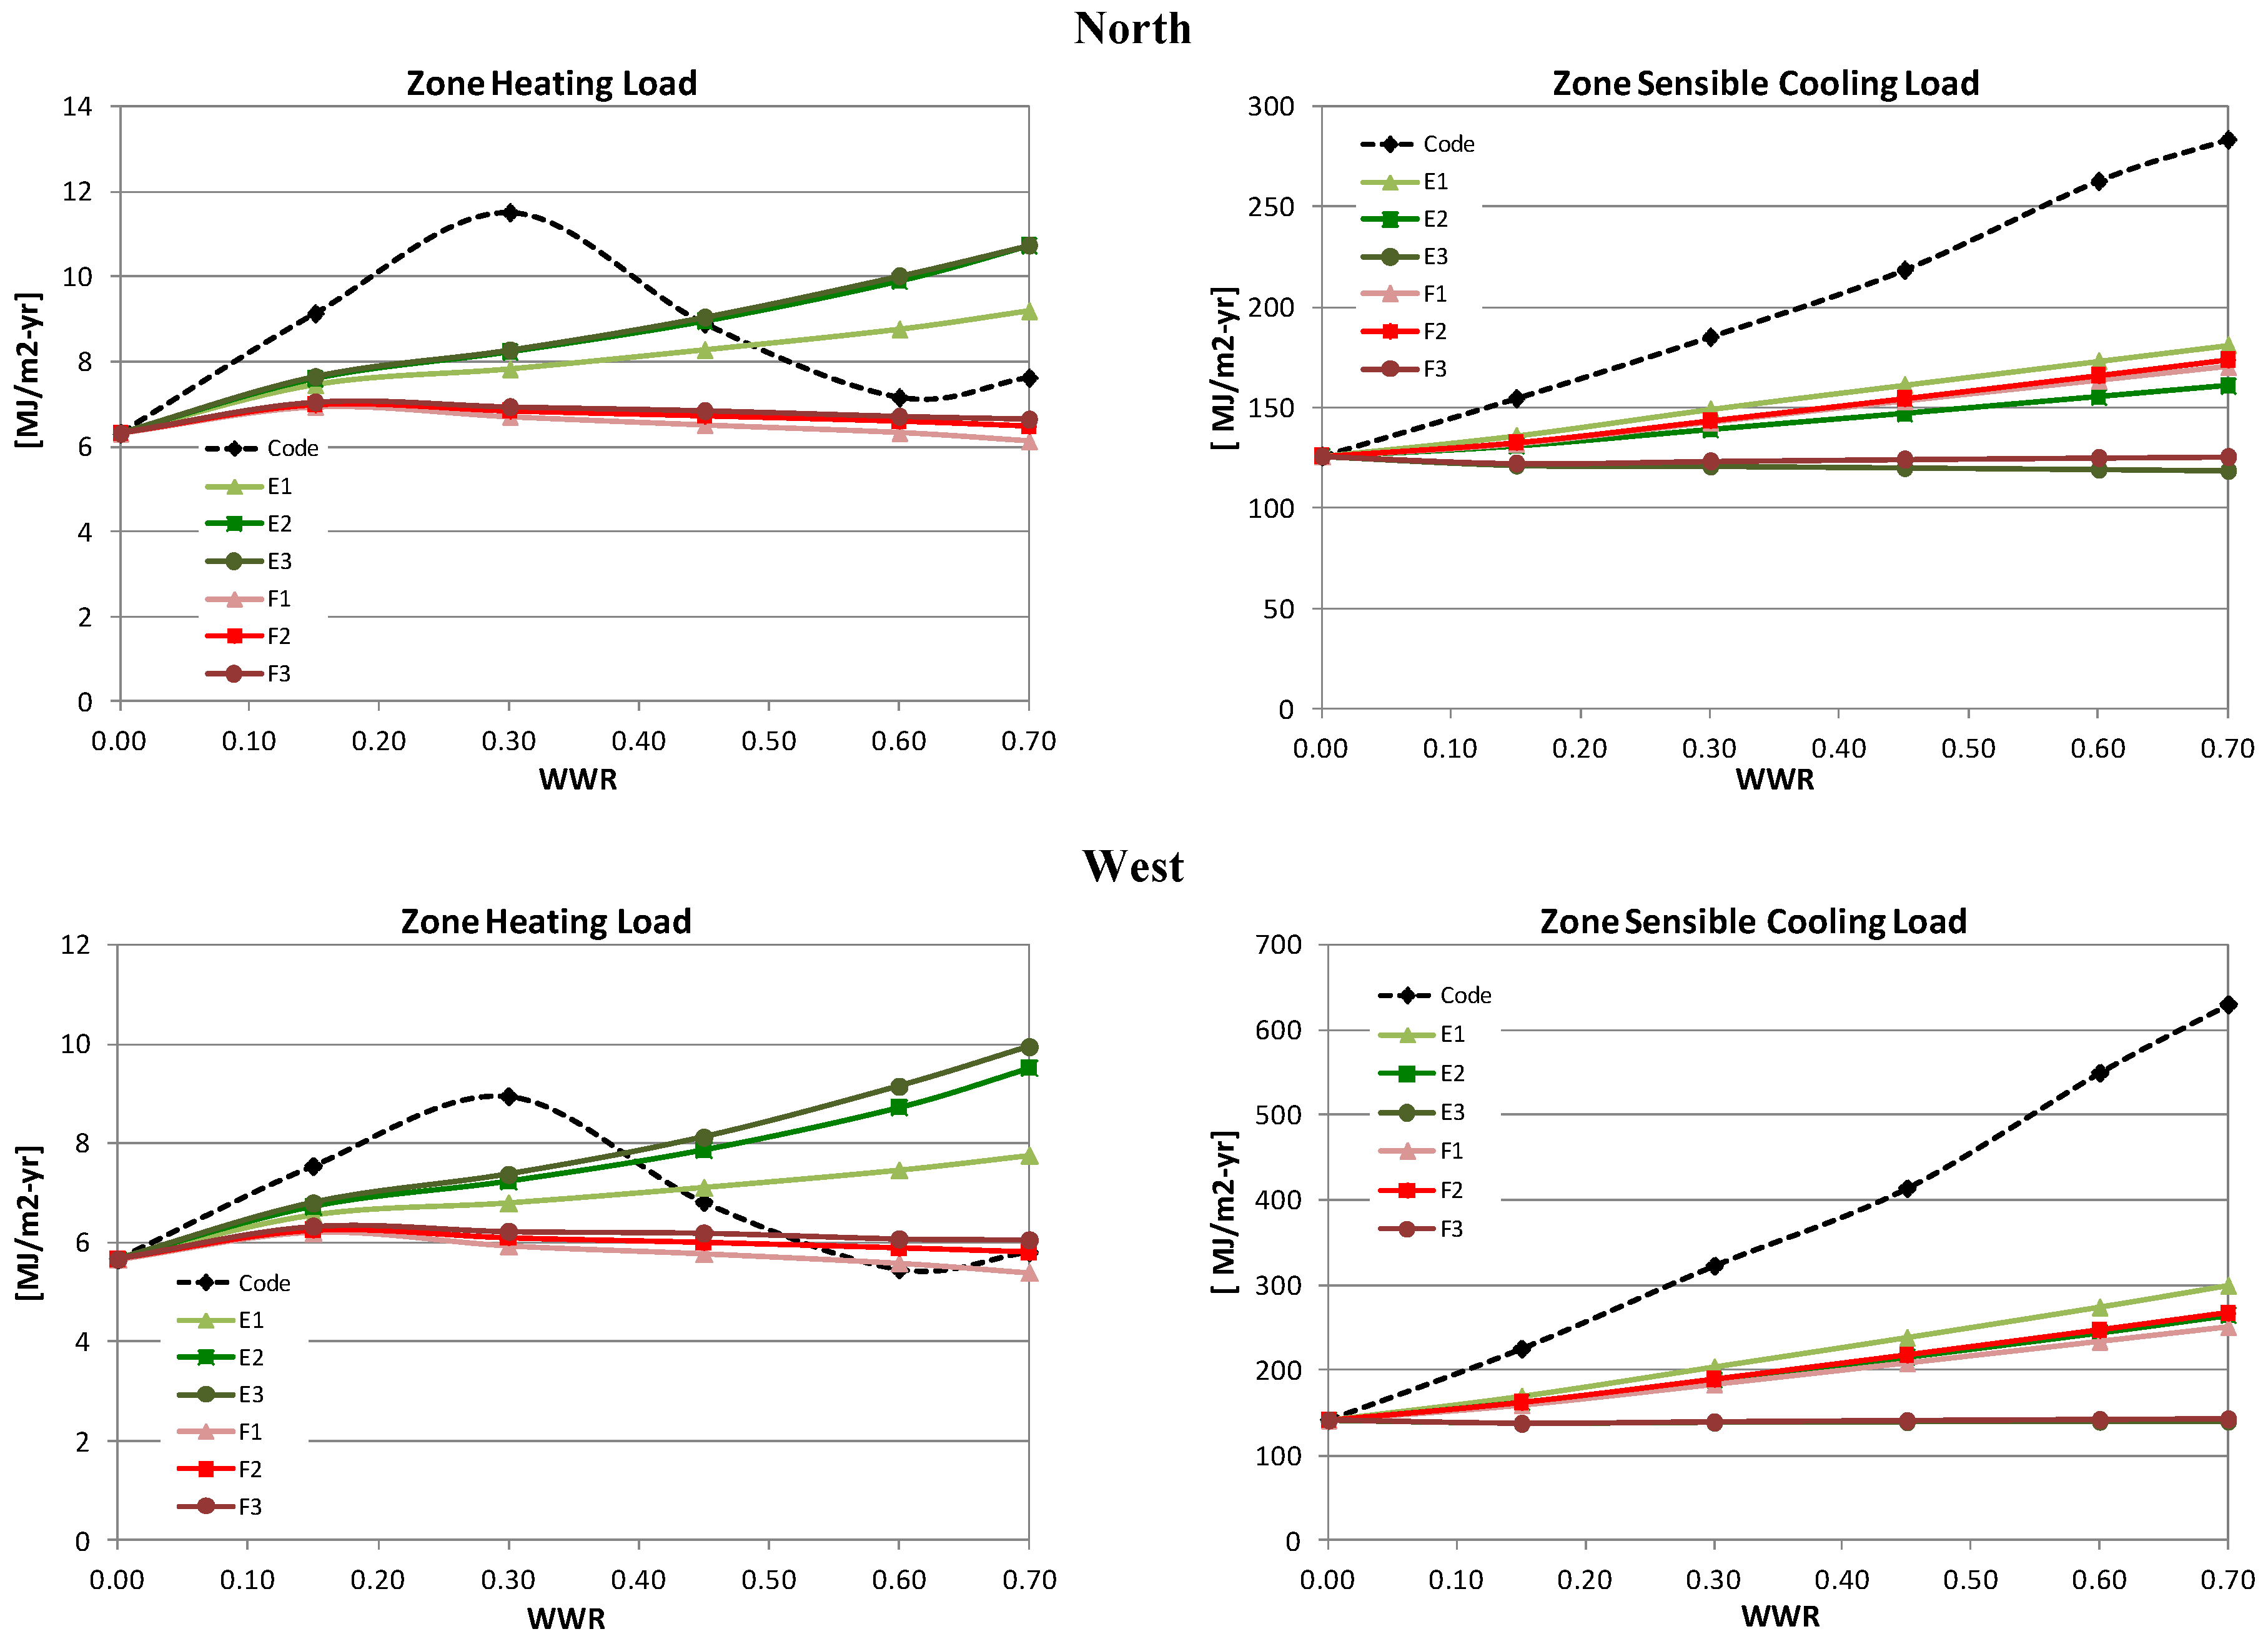
Heating and sensible cooling loads (MJ/m2-year) for perimeter zones in Beijing.
Figure 2.
Heating and sensible cooling loads (MJ/m2-year) for perimeter zones in Beijing.
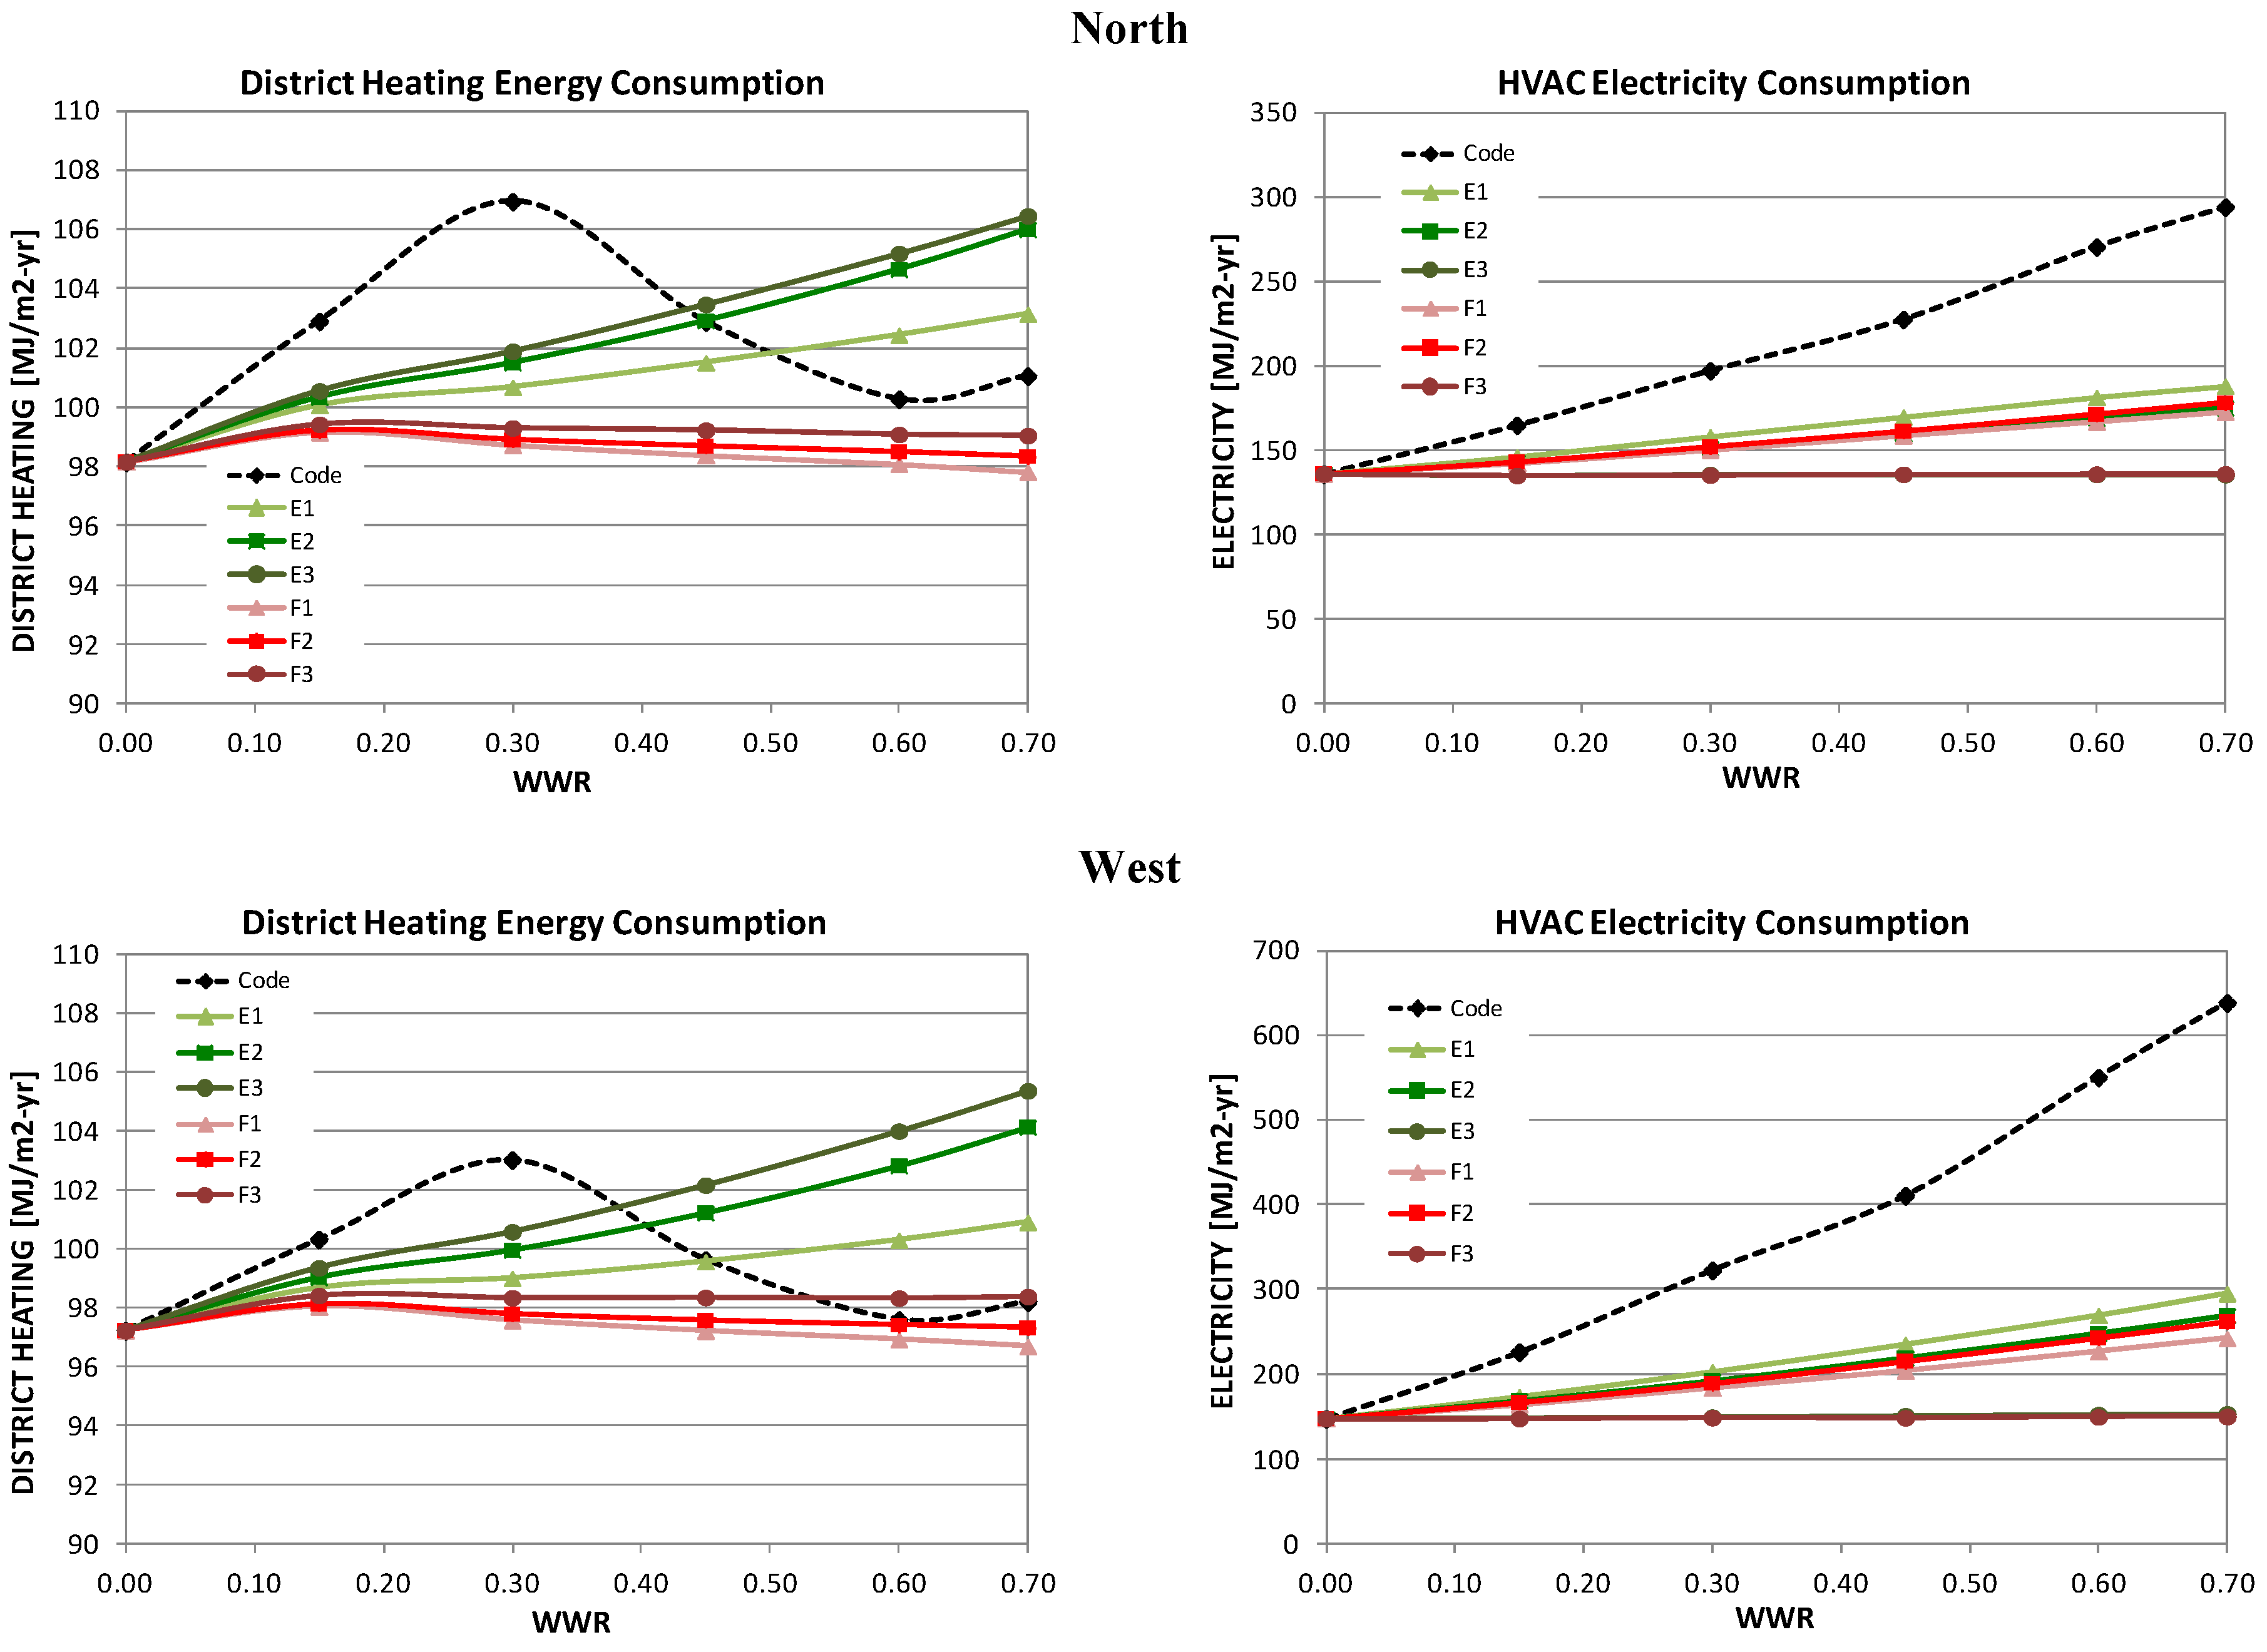
Figure 3.
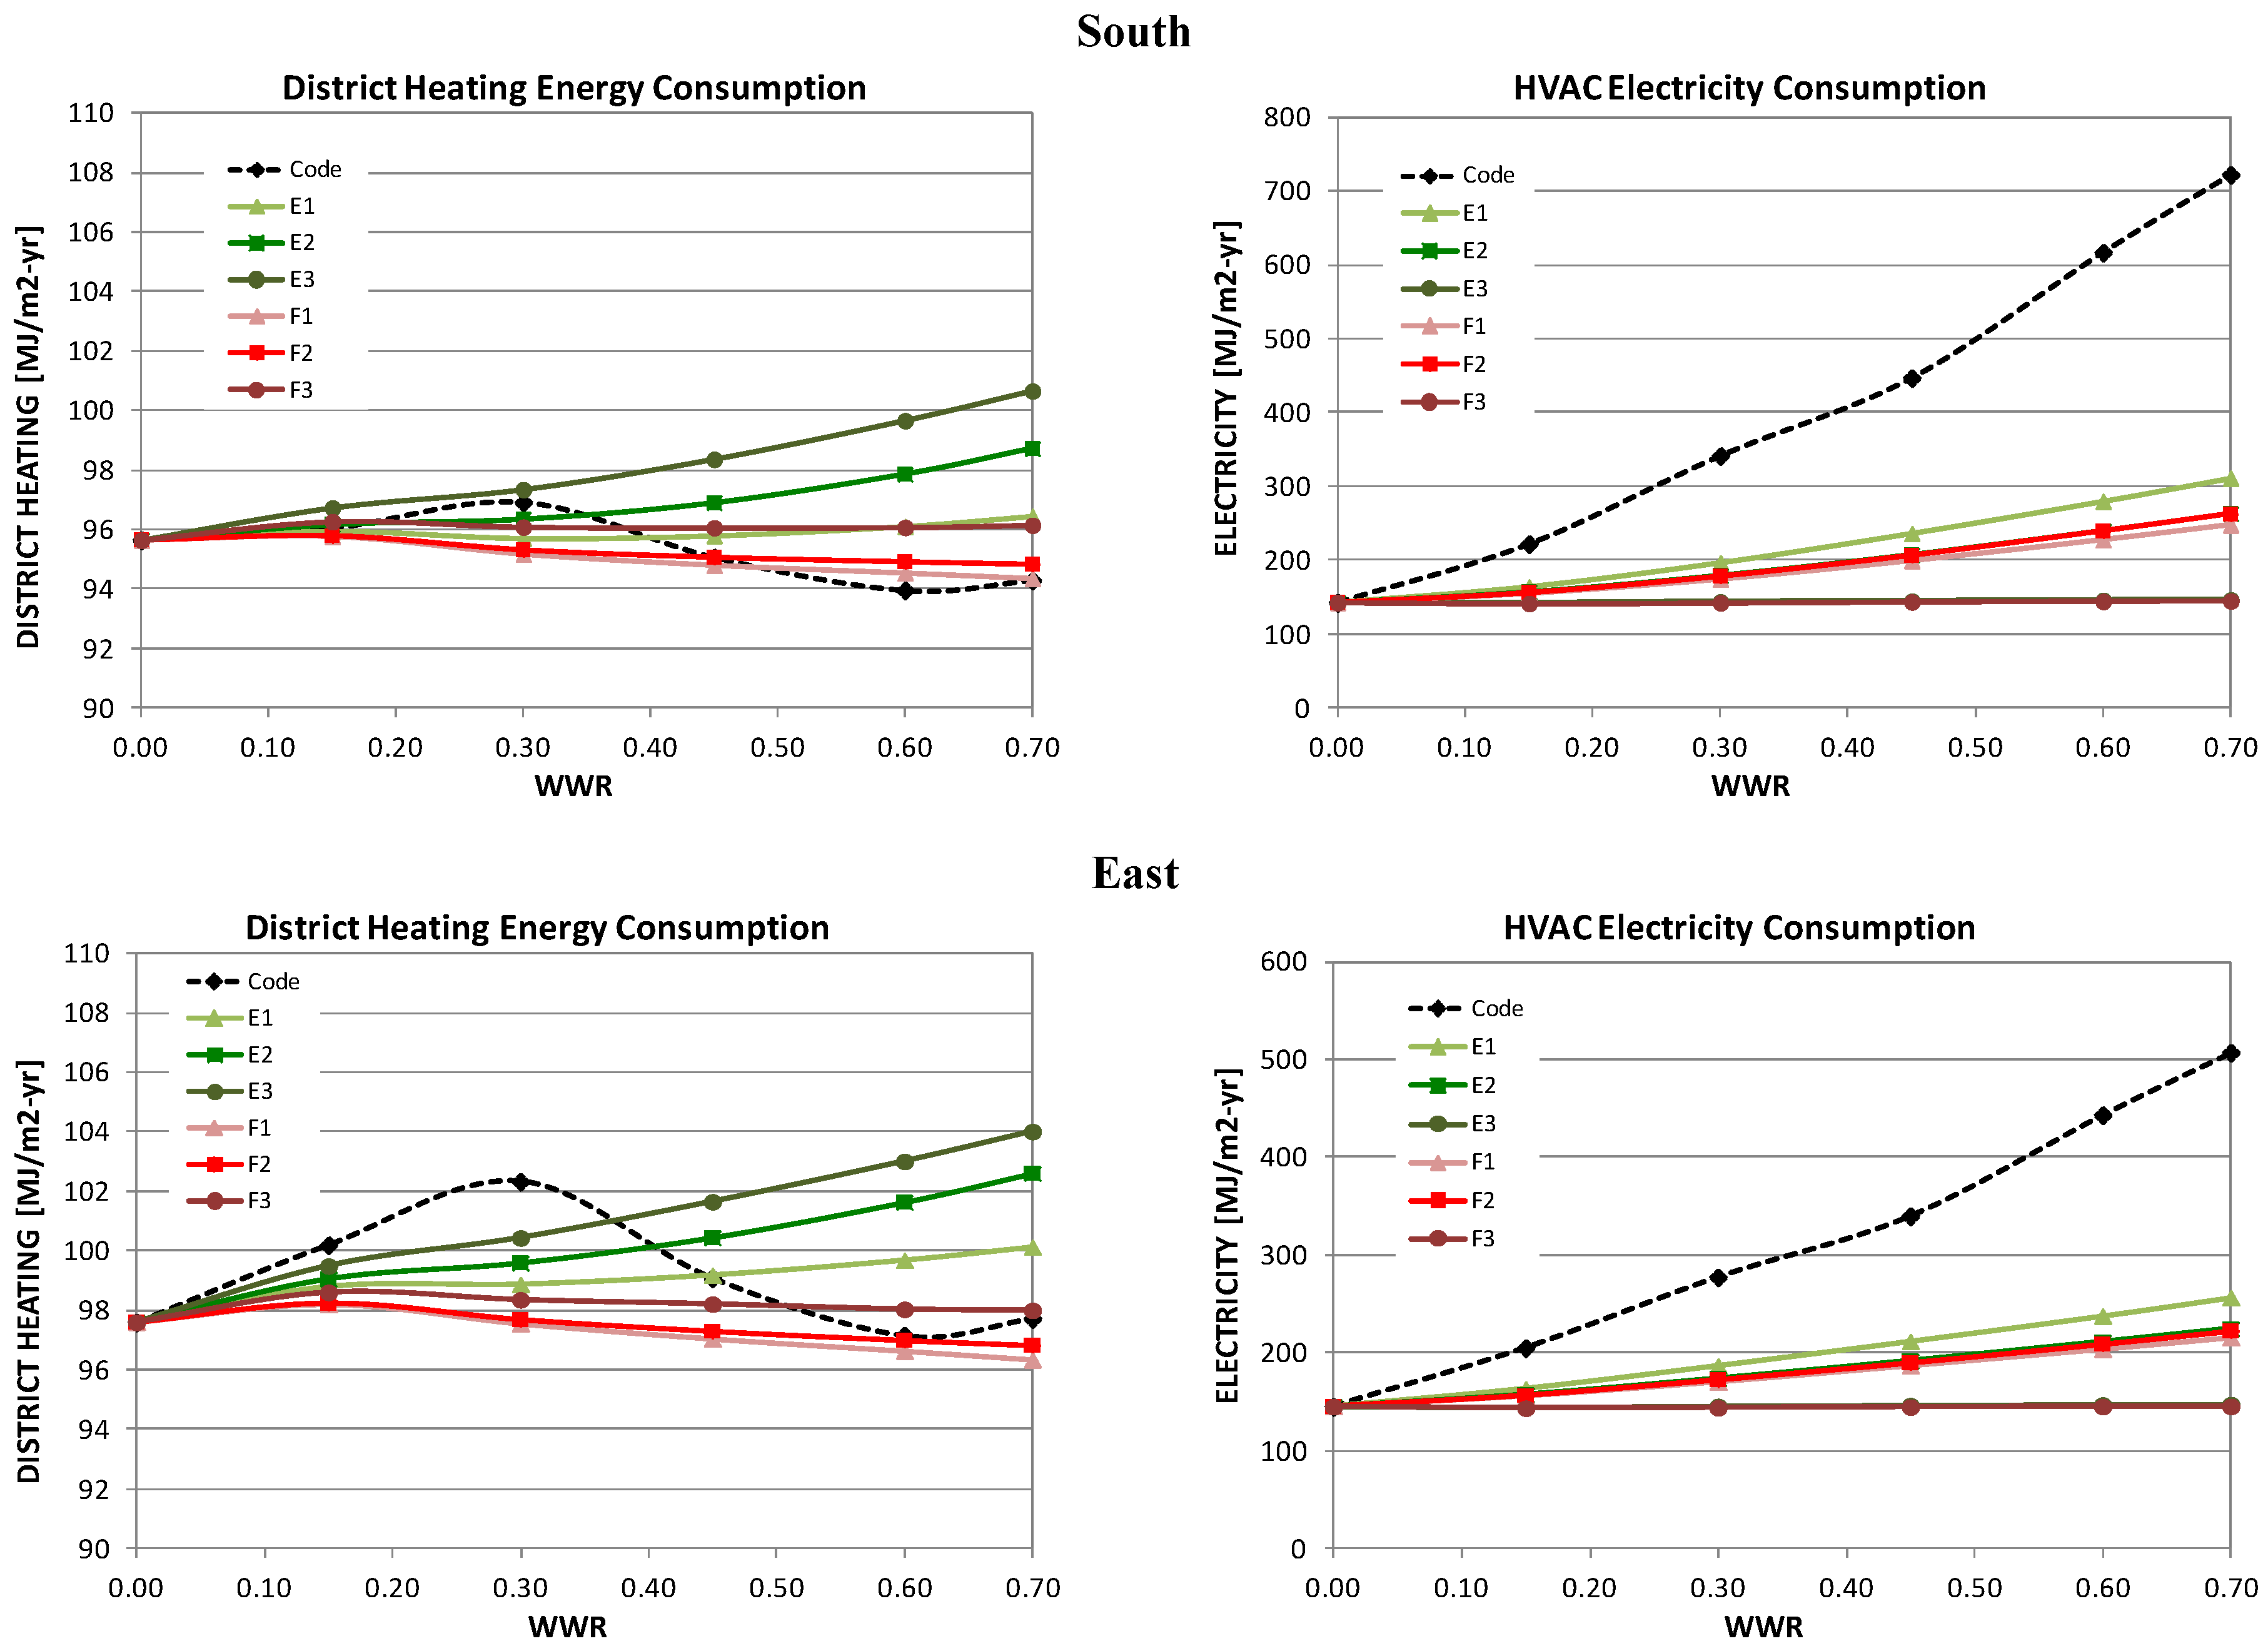
Disaggregated energy use (MJ/m2-year) for perimeter zones in Beijing.
Figure 3.
Disaggregated energy use (MJ/m2-year) for perimeter zones in Beijing.
Table 6.
Zone heating load (MJ/m2-year) and percent savings compared to the GB 50189-2005 Standard for Beijing.
Table 6.
Zone heating load (MJ/m2-year) and percent savings compared to the GB 50189-2005 Standard for Beijing.
| Window Type |
|---|
| WWR | Code | E1 | F1 | E2 | F2 | E3 | F3 |
|---|
| EUI | EUI | % | EUI | % | EUI | % | EUI | % | EUI | % | EUI | % |
|---|
| South zone |
| 0.00 | 4.48 | 4.48 | 0% | 4.48 | 0% | 4.48 | 0% | 4.48 | 0% | 4.48 | 0% | 4.48 | 0% |
| 0.15 | 4.83 | 4.77 | 1% | 4.67 | 3% | 4.92 | −2% | 4.73 | 2% | 4.99 | −3% | 4.80 | 1% |
| 0.30 | 5.13 | 4.68 | 9% | 4.36 | 15% | 5.05 | 2% | 4.50 | 12% | 5.21 | −1% | 4.65 | 9% |
| 0.45 | 3.93 | 4.69 | −19% | 4.15 | −6% | 5.33 | −35% | 4.38 | −11% | 5.67 | −44% | 4.58 | −17% |
| 0.60 | 3.14 | 4.80 | −53% | 3.95 | −26% | 5.82 | −85% | 4.27 | −36% | 6.35 | −103% | 4.54 | −45% |
| 0.70 | 3.31 | 4.95 | −50% | 3.80 | −15% | 6.33 | −91% | 4.20 | −27% | 7.02 | −112% | 4.56 | −38% |
| East zone |
| 0.00 | 5.93 | 5.93 | 0% | 5.93 | 0% | 5.93 | 0% | 5.93 | 0% | 5.93 | 0% | 5.93 | 0% |
| 0.15 | 7.77 | 6.78 | 13% | 6.42 | 17% | 6.93 | 11% | 6.47 | 17% | 6.93 | 11% | 6.48 | 17% |
| 0.30 | 9.22 | 6.90 | 25% | 6.08 | 34% | 7.34 | 20% | 6.22 | 33% | 7.35 | 20% | 6.30 | 32% |
| 0.45 | 7.04 | 7.16 | −2% | 5.81 | 17% | 7.89 | −12% | 6.04 | 14% | 7.96 | −13% | 6.15 | 13% |
| 0.60 | 5.61 | 7.50 | −34% | 5.59 | 0% | 8.70 | −55% | 5.89 | −5% | 8.80 | −57% | 5.95 | −6% |
| 0.70 | 5.98 | 7.80 | −30% | 5.38 | 10% | 9.47 | −58% | 5.79 | 3% | 9.47 | −58% | 5.89 | 2% |
| North zone |
| 0.00 | 6.31 | 6.31 | 0% | 6.31 | 0% | 6.31 | 0% | 6.31 | 0% | 6.31 | 0% | 6.31 | 0% |
| 0.15 | 9.13 | 7.45 | 18% | 6.94 | 24% | 7.59 | 17% | 6.98 | 23% | 7.64 | 16% | 7.04 | 23% |
| 0.30 | 11.51 | 7.82 | 32% | 6.70 | 42% | 8.23 | 29% | 6.84 | 41% | 8.27 | 28% | 6.93 | 40% |
| 0.45 | 8.89 | 8.27 | 7% | 6.51 | 27% | 8.95 | −1% | 6.72 | 24% | 9.04 | −2% | 6.84 | 23% |
| 0.60 | 7.15 | 8.76 | −22% | 6.32 | 12% | 9.89 | −38% | 6.59 | 8% | 10.01 | −40% | 6.71 | 6% |
| 0.70 | 7.62 | 9.19 | −21% | 6.12 | 20% | 10.73 | −41% | 6.47 | 15% | 10.74 | −41% | 6.64 | 13% |
| West zone |
| 0.00 | 5.66 | 5.66 | 0% | 5.66 | 0% | 5.66 | 0% | 5.66 | 0% | 5.66 | 0% | 5.66 | 0% |
| 0.15 | 7.54 | 6.54 | 13% | 6.19 | 18% | 6.72 | 11% | 6.25 | 17% | 6.79 | 10% | 6.33 | 16% |
| 0.30 | 8.95 | 6.79 | 24% | 5.93 | 34% | 7.23 | 19% | 6.09 | 32% | 7.37 | 18% | 6.22 | 30% |
| 0.45 | 6.81 | 7.11 | −4% | 5.77 | 15% | 7.86 | −15% | 6.00 | 12% | 8.12 | −19% | 6.19 | 9% |
| 0.60 | 5.45 | 7.46 | −37% | 5.58 | −2% | 8.72 | −60% | 5.88 | −8% | 9.15 | −68% | 6.07 | −11% |
| 0.70 | 5.80 | 7.75 | −34% | 5.39 | 7% | 9.52 | −64% | 5.80 | 0% | 9.95 | −71% | 6.05 | −4% |
Table 7.
Zone sensible cooling load (MJ/m2-year) and percent savings compared to the GB 50189-2005 Standard for Beijing.
Table 7.
Zone sensible cooling load (MJ/m2-year) and percent savings compared to the GB 50189-2005 Standard for Beijing.
| Window Type |
|---|
| WWR | Code | E1 | F1 | E2 | F2 | E3 | F3 |
|---|
| EUI | EUI | % | EUI | % | EUI | % | EUI | % | EUI | % | EUI | % |
|---|
| South zone |
| 0.00 | 140.44 | 140.44 | 0% | 140.44 | 0% | 140.44 | 0% | 140.44 | 0% | 140.44 | 0% | 140.44 | 0% |
| 0.15 | 243.84 | 173.28 | 29% | 160.87 | 34% | 162.88 | 33% | 163.26 | 33% | 135.57 | 44% | 136.02 | 44% |
| 0.30 | 364.42 | 217.49 | 40% | 191.83 | 47% | 193.99 | 47% | 196.50 | 46% | 136.60 | 63% | 137.96 | 62% |
| 0.45 | 470.15 | 262.45 | 44% | 224.36 | 52% | 226.45 | 52% | 231.15 | 51% | 137.16 | 71% | 139.68 | 70% |
| 0.60 | 630.80 | 307.71 | 51% | 256.89 | 59% | 259.65 | 59% | 266.05 | 58% | 137.53 | 78% | 141.20 | 78% |
| 0.70 | 725.44 | 337.87 | 53% | 278.68 | 62% | 282.22 | 61% | 289.76 | 60% | 137.63 | 81% | 142.14 | 80% |
| East zone |
| 0.00 | 141.45 | 141.45 | 0% | 141.45 | 0% | 141.45 | 0% | 141.45 | 0% | 141.45 | 0% | 141.45 | 0% |
| 0.15 | 216.02 | 166.62 | 23% | 157.11 | 27% | 158.02 | 27% | 158.07 | 27% | 137.58 | 36% | 137.79 | 36% |
| 0.30 | 299.75 | 197.51 | 34% | 178.96 | 40% | 178.79 | 40% | 180.33 | 40% | 138.54 | 54% | 139.46 | 53% |
| 0.45 | 378.48 | 228.57 | 40% | 201.73 | 47% | 200.24 | 47% | 203.96 | 46% | 139.01 | 63% | 140.89 | 63% |
| 0.60 | 495.64 | 260.55 | 47% | 225.20 | 55% | 222.70 | 55% | 229.14 | 54% | 139.30 | 72% | 142.13 | 71% |
| 0.70 | 561.97 | 282.35 | 50% | 241.36 | 57% | 238.17 | 58% | 246.72 | 56% | 139.36 | 75% | 142.86 | 75% |
| North zone |
| 0.00 | 125.83 | 125.83 | 0% | 125.83 | 0% | 125.83 | 0% | 125.83 | 0% | 125.83 | 0% | 125.83 | 0% |
| 0.15 | 154.65 | 136.08 | 12% | 132.10 | 15% | 131.05 | 15% | 132.64 | 14% | 121.39 | 22% | 122.36 | 21% |
| 0.30 | 185.26 | 149.29 | 19% | 142.80 | 23% | 139.15 | 25% | 143.51 | 23% | 120.90 | 35% | 123.41 | 33% |
| 0.45 | 218.60 | 161.40 | 26% | 153.27 | 30% | 147.08 | 33% | 154.54 | 29% | 120.13 | 45% | 124.34 | 43% |
| 0.60 | 262.87 | 173.33 | 34% | 163.48 | 38% | 155.32 | 41% | 166.00 | 37% | 119.31 | 55% | 125.11 | 52% |
| 0.70 | 283.57 | 181.24 | 36% | 170.31 | 40% | 160.79 | 43% | 173.81 | 39% | 118.67 | 58% | 125.57 | 56% |
| West zone |
| 0.00 | 140.91 | 140.91 | 0% | 140.91 | 0% | 140.91 | 0% | 140.91 | 0% | 140.91 | 0% | 140.91 | 0% |
| 0.15 | 224.95 | 168.97 | 25% | 158.72 | 29% | 162.18 | 28% | 161.75 | 28% | 136.95 | 39% | 137.02 | 39% |
| 0.30 | 322.51 | 203.40 | 37% | 183.06 | 43% | 188.39 | 42% | 188.91 | 41% | 138.17 | 57% | 138.69 | 57% |
| 0.45 | 413.71 | 238.02 | 42% | 208.18 | 50% | 215.41 | 48% | 217.29 | 47% | 138.95 | 66% | 140.14 | 66% |
| 0.60 | 549.67 | 273.82 | 50% | 233.54 | 58% | 244.17 | 56% | 246.61 | 55% | 139.46 | 75% | 141.40 | 74% |
| 0.70 | 630.12 | 299.17 | 53% | 250.58 | 60% | 264.60 | 58% | 266.72 | 58% | 139.54 | 78% | 142.16 | 77% |
Table 8.
HVAC electricity energy use intensity (EUI, MJ/m2-year) and percent savings compared to the GB 50189-2005 Standard for Beijing.
Table 8.
HVAC electricity energy use intensity (EUI, MJ/m2-year) and percent savings compared to the GB 50189-2005 Standard for Beijing.
| Window Type |
|---|
| WWR | Code | E1 | F1 | E2 | F2 | E3 | F3 |
|---|
| EUI | EUI | % | EUI | % | EUI | % | EUI | % | EUI | % | EUI | % |
|---|
| South zone |
| 0.00 | 142.58 | 142.58 | 0% | 142.58 | 0% | 142.58 | 0% | 142.58 | 0% | 142.58 | 0% | 142.58 | 0% |
| 0.15 | 221.88 | 163.95 | 26% | 154.99 | 30% | 156.86 | 29% | 155.94 | 30% | 141.89 | 36% | 141.32 | 36% |
| 0.30 | 341.34 | 196.59 | 42% | 174.22 | 49% | 179.18 | 48% | 178.12 | 48% | 143.60 | 58% | 142.22 | 58% |
| 0.45 | 446.93 | 236.37 | 47% | 199.30 | 55% | 207.20 | 54% | 206.36 | 54% | 144.62 | 68% | 143.43 | 68% |
| 0.60 | 617.05 | 279.94 | 55% | 227.54 | 63% | 239.74 | 61% | 239.29 | 61% | 145.72 | 76% | 144.19 | 77% |
| 0.70 | 722.40 | 311.30 | 57% | 247.81 | 66% | 262.95 | 64% | 262.57 | 64% | 146.30 | 80% | 144.69 | 80% |
| East zone |
| 0.00 | 144.66 | 144.66 | 0% | 144.66 | 0% | 144.66 | 0% | 144.66 | 0% | 144.66 | 0% | 144.66 | 0% |
| 0.15 | 204.80 | 162.96 | 20% | 155.36 | 24% | 156.78 | 23% | 155.86 | 24% | 143.81 | 30% | 143.16 | 30% |
| 0.30 | 277.20 | 186.40 | 33% | 169.80 | 39% | 173.23 | 38% | 171.92 | 38% | 145.04 | 48% | 143.54 | 48% |
| 0.45 | 339.84 | 211.41 | 38% | 186.43 | 45% | 191.31 | 44% | 189.42 | 44% | 145.80 | 57% | 144.30 | 58% |
| 0.60 | 443.25 | 237.45 | 46% | 203.43 | 54% | 210.75 | 52% | 208.68 | 53% | 146.52 | 67% | 144.71 | 67% |
| 0.70 | 507.13 | 256.29 | 49% | 215.34 | 58% | 224.30 | 56% | 222.18 | 56% | 146.86 | 71% | 144.89 | 71% |
| North zone |
| 0.00 | 136.09 | 136.09 | 0% | 136.09 | 0% | 136.09 | 0% | 136.09 | 0% | 136.09 | 0% | 136.09 | 0% |
| 0.15 | 165.04 | 146.20 | 11% | 142.39 | 14% | 143.02 | 13% | 143.19 | 13% | 135.26 | 18% | 135.14 | 18% |
| 0.30 | 197.30 | 158.13 | 20% | 150.18 | 24% | 151.16 | 23% | 152.13 | 23% | 135.77 | 31% | 135.39 | 31% |
| 0.45 | 227.74 | 169.75 | 25% | 158.65 | 30% | 159.73 | 30% | 161.31 | 29% | 135.83 | 40% | 135.93 | 40% |
| 0.60 | 270.60 | 181.41 | 33% | 166.86 | 38% | 168.84 | 38% | 171.31 | 37% | 135.76 | 50% | 136.04 | 50% |
| 0.70 | 294.17 | 188.04 | 36% | 172.57 | 41% | 175.01 | 41% | 178.17 | 39% | 135.68 | 54% | 136.12 | 54% |
| West zone |
| 0.00 | 147.19 | 147.19 | 0% | 147.19 | 0% | 147.19 | 0% | 147.19 | 0% | 147.19 | 0% | 147.19 | 0% |
| 0.15 | 225.84 | 173.24 | 23% | 163.70 | 28% | 168.21 | 26% | 166.40 | 26% | 148.30 | 34% | 147.40 | 35% |
| 0.30 | 322.57 | 202.46 | 37% | 183.45 | 43% | 191.87 | 41% | 188.85 | 41% | 149.13 | 54% | 148.45 | 54% |
| 0.45 | 410.58 | 234.80 | 43% | 203.69 | 50% | 218.77 | 47% | 214.79 | 48% | 150.79 | 63% | 148.31 | 64% |
| 0.60 | 550.30 | 269.00 | 51% | 226.21 | 59% | 247.77 | 55% | 242.50 | 56% | 152.19 | 72% | 149.29 | 73% |
| 0.70 | 638.42 | 294.83 | 54% | 241.73 | 62% | 268.83 | 58% | 261.77 | 59% | 152.98 | 76% | 149.86 | 77% |
Table 9.
District heating energy consumption (MJ/m2-year) and percent savings compared to the GB 50189-2005 Standard for Beijing.
Table 9.
District heating energy consumption (MJ/m2-year) and percent savings compared to the GB 50189-2005 Standard for Beijing.
| Window Type |
|---|
| WWR | Code | E1 | F1 | E2 | F2 | E3 | F3 |
|---|
| EUI | EUI | % | EUI | % | EUI | % | EUI | % | EUI | % | EUI | % |
|---|
| South zone |
| 0.00 | 95.64 | 95.64 | 0% | 95.64 | 0% | 95.64 | 0% | 95.64 | 0% | 95.64 | 0% | 95.64 | 0% |
| 0.15 | 96.05 | 95.94 | 0% | 95.76 | 0% | 96.17 | 0% | 95.78 | 0% | 96.72 | −1% | 96.26 | 0% |
| 0.30 | 96.91 | 95.70 | 1% | 95.17 | 2% | 96.35 | 1% | 95.31 | 2% | 97.34 | 0% | 96.08 | 1% |
| 0.45 | 95.07 | 95.79 | −1% | 94.80 | 0% | 96.90 | −2% | 95.07 | 0% | 98.36 | −3% | 96.06 | −1% |
| 0.60 | 93.96 | 96.10 | −2% | 94.54 | −1% | 97.85 | −4% | 94.92 | −1% | 99.66 | −6% | 96.07 | −2% |
| 0.70 | 94.29 | 96.44 | −2% | 94.35 | 0% | 98.71 | −5% | 94.83 | −1% | 100.66 | −7% | 96.14 | −2% |
| East zone |
| 0.00 | 97.59 | 97.59 | 0% | 97.59 | 0% | 97.59 | 0% | 97.59 | 0% | 97.59 | 0% | 97.59 | 0% |
| 0.15 | 100.19 | 98.78 | 1% | 98.19 | 2% | 99.04 | 1% | 98.22 | 2% | 99.48 | 1% | 98.60 | 2% |
| 0.30 | 102.33 | 98.87 | 3% | 97.54 | 5% | 99.58 | 3% | 97.68 | 5% | 100.43 | 2% | 98.35 | 4% |
| 0.45 | 99.08 | 99.18 | 0% | 97.03 | 2% | 100.43 | −1% | 97.29 | 2% | 101.65 | −3% | 98.20 | 1% |
| 0.60 | 97.15 | 99.68 | −3% | 96.62 | 1% | 101.63 | −5% | 96.99 | 0% | 103.00 | −6% | 98.03 | −1% |
| 0.70 | 97.72 | 100.12 | −2% | 96.33 | 1% | 102.60 | −5% | 96.82 | 1% | 104.01 | −6% | 97.99 | 0% |
| North zone |
| 0.00 | 98.15 | 98.15 | 0% | 98.15 | 0% | 98.15 | 0% | 98.15 | 0% | 98.15 | 0% | 98.15 | 0% |
| 0.15 | 102.90 | 100.05 | 3% | 99.14 | 4% | 100.33 | 3% | 99.20 | 4% | 100.55 | 2% | 99.42 | 3% |
| 0.30 | 106.94 | 100.67 | 6% | 98.71 | 8% | 101.49 | 5% | 98.89 | 8% | 101.89 | 5% | 99.30 | 7% |
| 0.45 | 102.88 | 101.50 | 1% | 98.37 | 4% | 102.91 | 0% | 98.67 | 4% | 103.47 | −1% | 99.23 | 4% |
| 0.60 | 100.27 | 102.43 | −2% | 98.07 | 2% | 104.64 | −4% | 98.48 | 2% | 105.19 | −5% | 99.08 | 1% |
| 0.70 | 101.05 | 103.13 | −2% | 97.81 | 3% | 105.99 | −5% | 98.33 | 3% | 106.45 | −5% | 99.04 | 2% |
| West zone |
| 0.00 | 97.23 | 97.23 | 0% | 97.23 | 0% | 97.23 | 0% | 97.23 | 0% | 97.23 | 0% | 97.23 | 0% |
| 0.15 | 100.33 | 98.67 | 2% | 98.04 | 2% | 99.03 | 1% | 98.12 | 2% | 99.36 | 1% | 98.42 | 2% |
| 0.30 | 103.03 | 99.00 | 4% | 97.57 | 5% | 99.96 | 3% | 97.79 | 5% | 100.59 | 2% | 98.35 | 5% |
| 0.45 | 99.64 | 99.57 | 0% | 97.21 | 2% | 101.22 | −2% | 97.57 | 2% | 102.17 | −3% | 98.36 | 1% |
| 0.60 | 97.60 | 100.30 | −3% | 96.92 | 1% | 102.83 | −5% | 97.41 | 0% | 104.01 | −7% | 98.34 | −1% |
| 0.70 | 98.20 | 100.91 | −3% | 96.69 | 2% | 104.14 | −6% | 97.32 | 1% | 105.38 | −7% | 98.39 | 0% |
As window area increases, thermal losses are offset by increased solar heat gains so the net effect of the window’s
U-value and SHGC on annual sensible heating loads is in proportion to these heat flows (
Figure 2). The GB 50189-2005 code results in less sensible heating energy use for large-area windows because the maximum prescribed
U-value is low and SHGC is high. The low-e window (E) and highly-insulated, low-e window (F) do not perform as well as code for WWR > 0.30 because both the
U-value and SHGC of these windows are lower than that prescribed by code, resulting in less solar heat gains to offset heating demands. When WWR ≤ 0.30, the
U-value of the window plays a more significant role than SHGC in affecting the zone sensible heating load. When WWR > 0.30, the opposite is true: SHGC plays a more significant role. Use of the interior or exterior shading produced very little difference in the annual load because the shades were raised when the zone was in the heating mode.
The maximum variation in zone sensible heating load between all windows modeled was small—3.8 MJ/m
2-year, which translates to a difference in annual district heating energy use of 9 MJ/m
2-year or 8% (
Figure 3). For this office building, the fraction of annual heating energy used to heat up the outdoor ventilation air is significantly greater than that used to offset perimeter zone heating losses since the internal loads from people, equipment, and lights are high. Heating energy usage is therefore not a major factor when selecting windows for this cold climate—the code windows give reasonably good performance during the heating season. The lower
U-value windows, however, will mitigate thermal discomfort due to an occupant’s radiative heat losses to cold window surfaces.
On the other hand, we see that sensible cooling energy use varies significantly between the various window types modeled, where the prescribed code window performed the poorest due to its higher SHGC. Here, windows E and F with exterior shading were able to reduce sensible cooling loads by as much as 585 MJ/m2-year (80%), resulting in performance levels that are equivalent to an opaque insulated wall for even the largest window area (WWR = 0.70).
All the variations on windows E and F improved total energy performance significantly compared to the GB 50189-2005 code. Windows E1 and F1 (unshaded) produced up to 66% savings in HVAC electricity consumption and 5% savings in district heating energy. Interior shades provided negligible benefit over unshaded windows. Exterior shades produced the least sensible cooling load and annual HVAC electricity consumption (up to 80% savings). With the same HVAC energy consumption levels for small and large area windows, the large area windows provide an added benefit of admitting more daylight. Energy savings due to daylighting were not included in this analysis.
Selecting the right window type is more consequential on the south, west, and east than on the north orientation. When a whole building facade retrofit is not economically possible, one should prioritize use of high performance window and shading systems based on this order. Overall, windows E3 and F3 provide the best performance in the cold climate. Since E3 is economically more attractive, E3 is recommended in the cold climate.
3.5. Results for a Hot Summer/Cold Winter Climate
Shanghai was chosen as the representative city for the hot summer and cold winter climate. The results are given in
Table 10,
Table 11,
Table 12 and
Table 13 and
Figure 4 and
Figure 5. The code is less restrictive on
U-value and more restrictive on SHGC compared to the cold Beijing climate. Both unshaded windows E1 and F1 meet the SC and
U-value requirements of the GB 50189-2005 code for all WWR (and all requirements for the 65% Shanghai code DGJ08-107-20 except for Window E1 for WWR between 0.50 and 0.70).
Figure 4.
Heating and sensible cooling loads (MJ/m2-year) for perimeter zones in Shanghai.
Figure 4.
Heating and sensible cooling loads (MJ/m2-year) for perimeter zones in Shanghai.
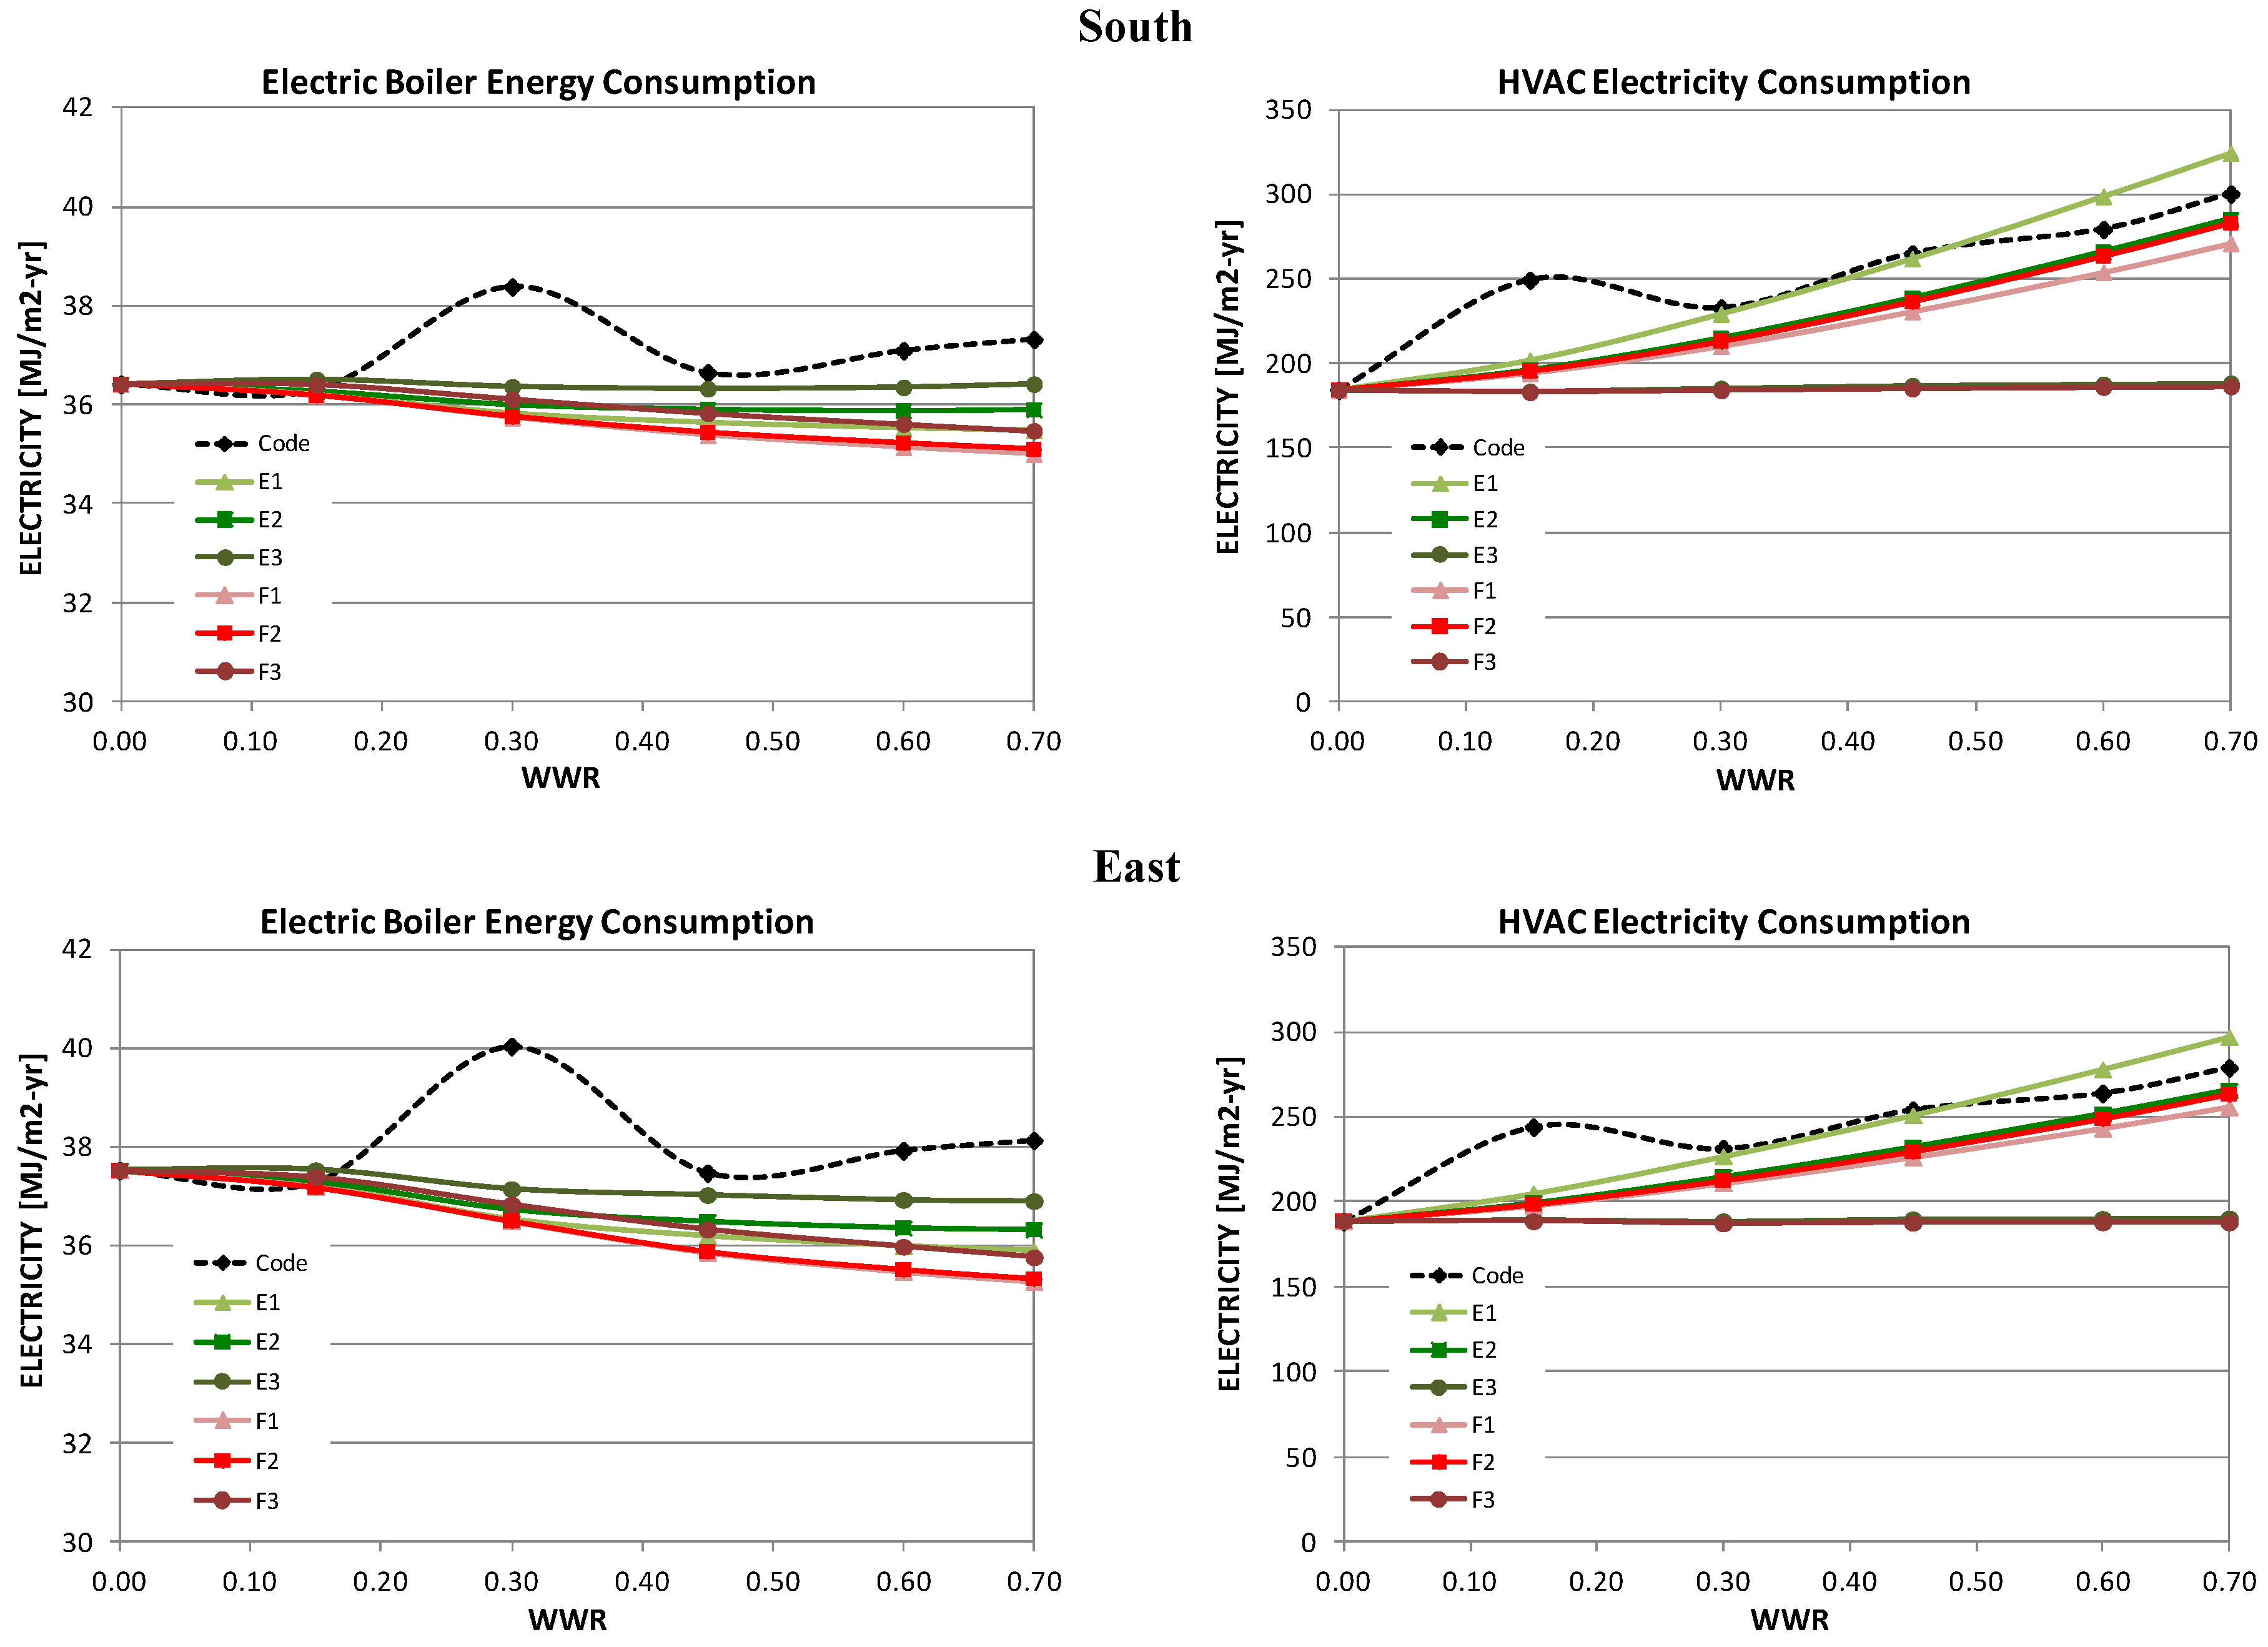
Figure 5.
Disaggregated energy use (MJ/m2-year) for perimeter zones in Shanghai.
Figure 5.
Disaggregated energy use (MJ/m2-year) for perimeter zones in Shanghai.
Table 10.
Zone heating load (MJ/m2-year) and percent savings compared to the GB 50189-2005 Standard for Shanghai.
Table 10.
Zone heating load (MJ/m2-year) and percent savings compared to the GB 50189-2005 Standard for Shanghai.
| Window Type |
|---|
| WWR | Code | E1 | F1 | E2 | F2 | E3 | F3 |
|---|
| EUI | EUI | % | EUI | % | EUI | % | EUI | % | EUI | % | EUI | % |
|---|
| South zone |
| 0.00 | 2.03 | 2.03 | 0% | 2.03 | 0% | 2.03 | 0% | 2.03 | 0% | 2.03 | 0% | 2.03 | 0% |
| 0.15 | 1.94 | 1.96 | -1% | 1.98 | −2% | 2.01 | −4% | 2.00 | −3% | 2.05 | −6% | 2.02 | −4% |
| 0.30 | 3.20 | 1.75 | 45% | 1.76 | 45% | 1.85 | 42% | 1.80 | 44% | 1.93 | 40% | 1.87 | 42% |
| 0.45 | 2.19 | 1.64 | 25% | 1.56 | 29% | 1.78 | 19% | 1.60 | 27% | 1.90 | 14% | 1.70 | 22% |
| 0.60 | 2.45 | 1.56 | 37% | 1.41 | 42% | 1.75 | 29% | 1.47 | 40% | 1.90 | 23% | 1.60 | 35% |
| 0.70 | 2.59 | 1.52 | 41% | 1.33 | 49% | 1.74 | 33% | 1.39 | 46% | 1.92 | 26% | 1.53 | 41% |
| East zone |
| 0.00 | 2.85 | 2.85 | 0% | 2.85 | 0% | 2.85 | 0% | 2.85 | 0% | 2.85 | 0% | 2.85 | 0% |
| 0.15 | 2.59 | 2.68 | −3% | 2.71 | −5% | 2.72 | −5% | 2.71 | −5% | 2.71 | −5% | 2.71 | −5% |
| 0.30 | 4.31 | 2.24 | 48% | 2.28 | 47% | 2.33 | 46% | 2.32 | 46% | 2.40 | 44% | 2.37 | 45% |
| 0.45 | 2.80 | 2.07 | 26% | 1.90 | 32% | 2.20 | 21% | 1.94 | 31% | 2.29 | 18% | 2.02 | 28% |
| 0.60 | 3.08 | 1.94 | 37% | 1.69 | 45% | 2.12 | 31% | 1.73 | 44% | 2.22 | 28% | 1.83 | 41% |
| 0.70 | 3.22 | 1.88 | 42% | 1.56 | 51% | 2.09 | 35% | 1.61 | 50% | 2.20 | 32% | 1.71 | 47% |
| North zone |
| 0.00 | 3.14 | 3.14 | 0% | 3.14 | 0% | 3.14 | 0% | 3.14 | 0% | 3.14 | 0% | 3.14 | 0% |
| 0.15 | 3.10 | 3.09 | 0% | 3.05 | 2% | 3.14 | −1% | 3.07 | 1% | 3.19 | −3% | 3.12 | 0% |
| 0.30 | 5.23 | 2.61 | 50% | 2.64 | 49% | 2.73 | 48% | 2.68 | 49% | 2.81 | 46% | 2.75 | 48% |
| 0.45 | 3.37 | 2.42 | 28% | 2.19 | 35% | 2.59 | 23% | 2.23 | 34% | 2.70 | 20% | 2.34 | 30% |
| 0.60 | 3.68 | 2.29 | 38% | 1.94 | 47% | 2.51 | 32% | 1.99 | 46% | 2.62 | 29% | 2.12 | 42% |
| 0.70 | 3.84 | 2.23 | 42% | 1.81 | 53% | 2.48 | 36% | 1.86 | 52% | 2.60 | 32% | 1.99 | 48% |
| West zone |
| 0.00 | 2.66 | 2.66 | 0% | 2.66 | 0% | 2.66 | 0% | 2.66 | 0% | 2.66 | 0% | 2.66 | 0% |
| 0.15 | 2.66 | 2.63 | 1% | 2.62 | 1% | 2.68 | −1% | 2.64 | 1% | 2.72 | −2% | 2.66 | 0% |
| 0.30 | 4.56 | 2.31 | 49% | 2.28 | 50% | 2.40 | 47% | 2.31 | 49% | 2.47 | 46% | 2.38 | 48% |
| 0.45 | 2.99 | 2.16 | 28% | 1.97 | 34% | 2.33 | 22% | 2.03 | 32% | 2.44 | 18% | 2.10 | 30% |
| 0.60 | 3.35 | 2.06 | 38% | 1.77 | 47% | 2.29 | 32% | 1.83 | 45% | 2.42 | 28% | 1.95 | 42% |
| 0.70 | 3.53 | 2.02 | 43% | 1.66 | 53% | 2.28 | 35% | 1.73 | 51% | 2.43 | 31% | 1.85 | 48% |
Table 11.
Zone sensible cooling load (MJ/m2-year) and percent savings compared to the GB 50189-2005 Standard for Shanghai.
Table 11.
Zone sensible cooling load (MJ/m2-year) and percent savings compared to the GB 50189-2005 Standard for Shanghai.
| Window Type |
|---|
| WWR | Code | E1 | F1 | E2 | F2 | E3 | F3 |
|---|
| EUI | EUI | % | EUI | % | EUI | % | EUI | % | EUI | % | EUI | % |
|---|
| South zone |
| 0.00 | 147.48 | 147.48 | 0% | 147.48 | 0% | 147.48 | 0% | 147.48 | 0% | 147.48 | 0% | 147.48 | 0% |
| 0.15 | 229.12 | 175.19 | 24% | 165.20 | 28% | 167.16 | 27% | 167.22 | 27% | 146.40 | 36% | 146.32 | 36% |
| 0.30 | 201.76 | 210.56 | -4% | 189.99 | 6% | 192.32 | 5% | 193.62 | 4% | 148.90 | 26% | 149.50 | 26% |
| 0.45 | 242.21 | 246.57 | -2% | 216.51 | 11% | 218.36 | 10% | 221.71 | 8% | 150.94 | 38% | 152.69 | 37% |
| 0.60 | 254.30 | 282.62 | −11% | 243.32 | 4% | 244.98 | 4% | 250.55 | 1% | 152.60 | 40% | 155.88 | 39% |
| 0.70 | 273.54 | 306.52 | −12% | 261.45 | 4% | 262.94 | 4% | 270.23 | 1% | 153.51 | 44% | 158.07 | 42% |
| East zone |
| 0.00 | 152.22 | 152.22 | 0% | 152.22 | 0% | 152.22 | 0% | 152.22 | 0% | 152.22 | 0% | 152.22 | 0% |
| 0.15 | 221.51 | 176.54 | 20% | 167.72 | 24% | 169.04 | 24% | 169.01 | 24% | 151.28 | 32% | 151.04 | 32% |
| 0.30 | 198.22 | 205.98 | −4% | 188.47 | 5% | 189.40 | 4% | 190.58 | 4% | 153.51 | 23% | 153.81 | 22% |
| 0.45 | 231.63 | 236.57 | −2% | 211.14 | 9% | 210.83 | 9% | 214.67 | 7% | 155.29 | 33% | 156.59 | 32% |
| 0.60 | 241.24 | 268.60 | −11% | 235.29 | 2% | 233.54 | 3% | 240.75 | 0% | 156.67 | 35% | 159.41 | 34% |
| 0.70 | 257.69 | 290.26 | −13% | 252.22 | 2% | 249.13 | 3% | 258.86 | 0% | 157.43 | 39% | 161.36 | 37% |
| North zone |
| 0.00 | 133.60 | 133.60 | 0% | 133.60 | 0% | 133.60 | 0% | 133.60 | 0% | 133.60 | 0% | 133.60 | 0% |
| 0.15 | 168.15 | 147.22 | 12% | 142.72 | 15% | 142.71 | 15% | 143.77 | 14% | 133.15 | 21% | 133.46 | 21% |
| 0.30 | 150.97 | 163.39 | −8% | 155.46 | −3% | 153.79 | −2% | 157.19 | −4% | 134.94 | 11% | 136.41 | 10% |
| 0.45 | 171.99 | 179.34 | −4% | 169.06 | 2% | 165.29 | 4% | 172.05 | 0% | 136.40 | 21% | 139.49 | 19% |
| 0.60 | 175.07 | 195.38 | −12% | 183.35 | −5% | 177.09 | −1% | 188.07 | −7% | 137.56 | 21% | 142.73 | 18% |
| 0.70 | 182.12 | 206.06 | −13% | 193.26 | −6% | 185.03 | −2% | 199.32 | −9% | 138.20 | 24% | 145.01 | 20% |
| West zone |
| 0.00 | 151.23 | 151.23 | 0% | 151.23 | 0% | 151.23 | 0% | 151.23 | 0% | 151.23 | 0% | 151.23 | 0% |
| 0.15 | 232.39 | 179.33 | 23% | 169.33 | 27% | 172.98 | 26% | 172.24 | 26% | 150.34 | 35% | 149.88 | 36% |
| 0.30 | 210.17 | 212.97 | −1% | 192.90 | 8% | 198.85 | 5% | 198.38 | 6% | 152.89 | 27% | 152.64 | 27% |
| 0.45 | 245.37 | 247.02 | −1% | 217.56 | 11% | 225.62 | 8% | 226.13 | 8% | 155.02 | 37% | 155.44 | 37% |
| 0.60 | 257.69 | 282.69 | −10% | 243.11 | 6% | 253.72 | 2% | 255.21 | 1% | 156.64 | 39% | 158.32 | 39% |
| 0.70 | 277.74 | 307.72 | −11% | 260.81 | 6% | 273.64 | 1% | 275.48 | 1% | 157.54 | 43% | 160.29 | 42% |
Table 12.
HVAC electricity energy use intensity (EUI, MJ/m2-year) and percent savings compared to the GB 50189-2005 Standard for Shanghai.
Table 12.
HVAC electricity energy use intensity (EUI, MJ/m2-year) and percent savings compared to the GB 50189-2005 Standard for Shanghai.
| Window Type |
|---|
| WWR | Code | E1 | F1 | E2 | F2 | E3 | F3 |
|---|
| EUI | EUI | % | EUI | % | EUI | % | EUI | % | EUI | % | EUI | % |
|---|
| South zone |
| 0.00 | 184.27 | 184.27 | 0% | 184.27 | 0% | 184.27 | 0% | 184.27 | 0% | 184.27 | 0% | 184.27 | 0% |
| 0.15 | 249.32 | 201.88 | 19% | 194.24 | 22% | 196.18 | 21% | 195.37 | 22% | 183.53 | 26% | 182.98 | 27% |
| 0.30 | 232.86 | 229.29 | 2% | 210.19 | 10% | 214.95 | 8% | 212.98 | 9% | 185.28 | 20% | 184.07 | 21% |
| 0.45 | 264.93 | 261.92 | 1% | 230.68 | 13% | 238.59 | 10% | 236.51 | 11% | 186.95 | 29% | 185.20 | 30% |
| 0.60 | 279.29 | 298.78 | −7% | 253.91 | 9% | 265.85 | 5% | 263.43 | 6% | 187.76 | 33% | 186.06 | 33% |
| 0.70 | 300.32 | 324.36 | −8% | 271.04 | 10% | 285.23 | 5% | 283.03 | 6% | 188.31 | 37% | 186.47 | 38% |
| East zone |
| 0.00 | 188.63 | 188.63 | 0% | 188.63 | 0% | 188.63 | 0% | 188.63 | 0% | 188.63 | 0% | 188.63 | 0% |
| 0.15 | 244.12 | 204.98 | 16% | 197.83 | 19% | 199.52 | 18% | 198.62 | 19% | 189.40 | 22% | 188.60 | 23% |
| 0.30 | 231.41 | 226.78 | 2% | 210.86 | 9% | 214.75 | 7% | 212.54 | 8% | 188.61 | 18% | 187.21 | 19% |
| 0.45 | 254.24 | 250.98 | 1% | 226.17 | 11% | 232.23 | 9% | 229.61 | 10% | 189.74 | 25% | 187.70 | 26% |
| 0.60 | 264.02 | 277.94 | −5% | 243.07 | 8% | 251.71 | 5% | 248.82 | 6% | 190.02 | 28% | 187.91 | 29% |
| 0.70 | 279.03 | 296.90 | −6% | 255.62 | 8% | 265.54 | 5% | 263.19 | 6% | 190.27 | 32% | 187.87 | 33% |
| North zone |
| 0.00 | 177.92 | 177.92 | 0% | 177.92 | 0% | 177.92 | 0% | 177.92 | 0% | 177.92 | 0% | 177.92 | 0% |
| 0.15 | 211.83 | 189.64 | 10% | 185.44 | 12% | 186.60 | 12% | 186.53 | 12% | 177.30 | 16% | 176.97 | 16% |
| 0.30 | 200.83 | 202.83 | −1% | 193.72 | 4% | 196.22 | 2% | 195.96 | 2% | 178.31 | 11% | 177.95 | 11% |
| 0.45 | 214.95 | 216.81 | −1% | 203.34 | 5% | 206.28 | 4% | 207.37 | 4% | 179.41 | 17% | 178.80 | 17% |
| 0.60 | 219.80 | 232.06 | −6% | 213.55 | 3% | 218.05 | 1% | 219.79 | 0% | 179.71 | 18% | 179.50 | 18% |
| 0.70 | 227.69 | 242.47 | −6% | 221.20 | 3% | 226.15 | 1% | 228.99 | −1% | 179.95 | 21% | 179.81 | 21% |
| West zone |
| 0.00 | 191.50 | 191.50 | 0% | 191.50 | 0% | 191.50 | 0% | 191.50 | 0% | 191.50 | 0% | 191.50 | 0% |
| 0.15 | 268.26 | 217.22 | 19% | 207.72 | 23% | 212.26 | 21% | 210.35 | 22% | 193.09 | 28% | 191.98 | 28% |
| 0.30 | 255.32 | 245.36 | 4% | 226.69 | 11% | 234.52 | 8% | 232.67 | 9% | 195.48 | 23% | 193.26 | 24% |
| 0.45 | 283.97 | 278.30 | 2% | 245.86 | 13% | 261.44 | 8% | 256.18 | 10% | 195.47 | 31% | 192.48 | 32% |
| 0.60 | 298.61 | 314.38 | −5% | 268.93 | 10% | 290.75 | 3% | 283.80 | 5% | 196.57 | 34% | 193.13 | 35% |
| 0.70 | 320.45 | 340.29 | −6% | 285.21 | 11% | 312.15 | 3% | 303.56 | 5% | 197.35 | 38% | 193.47 | 40% |
Table 13.
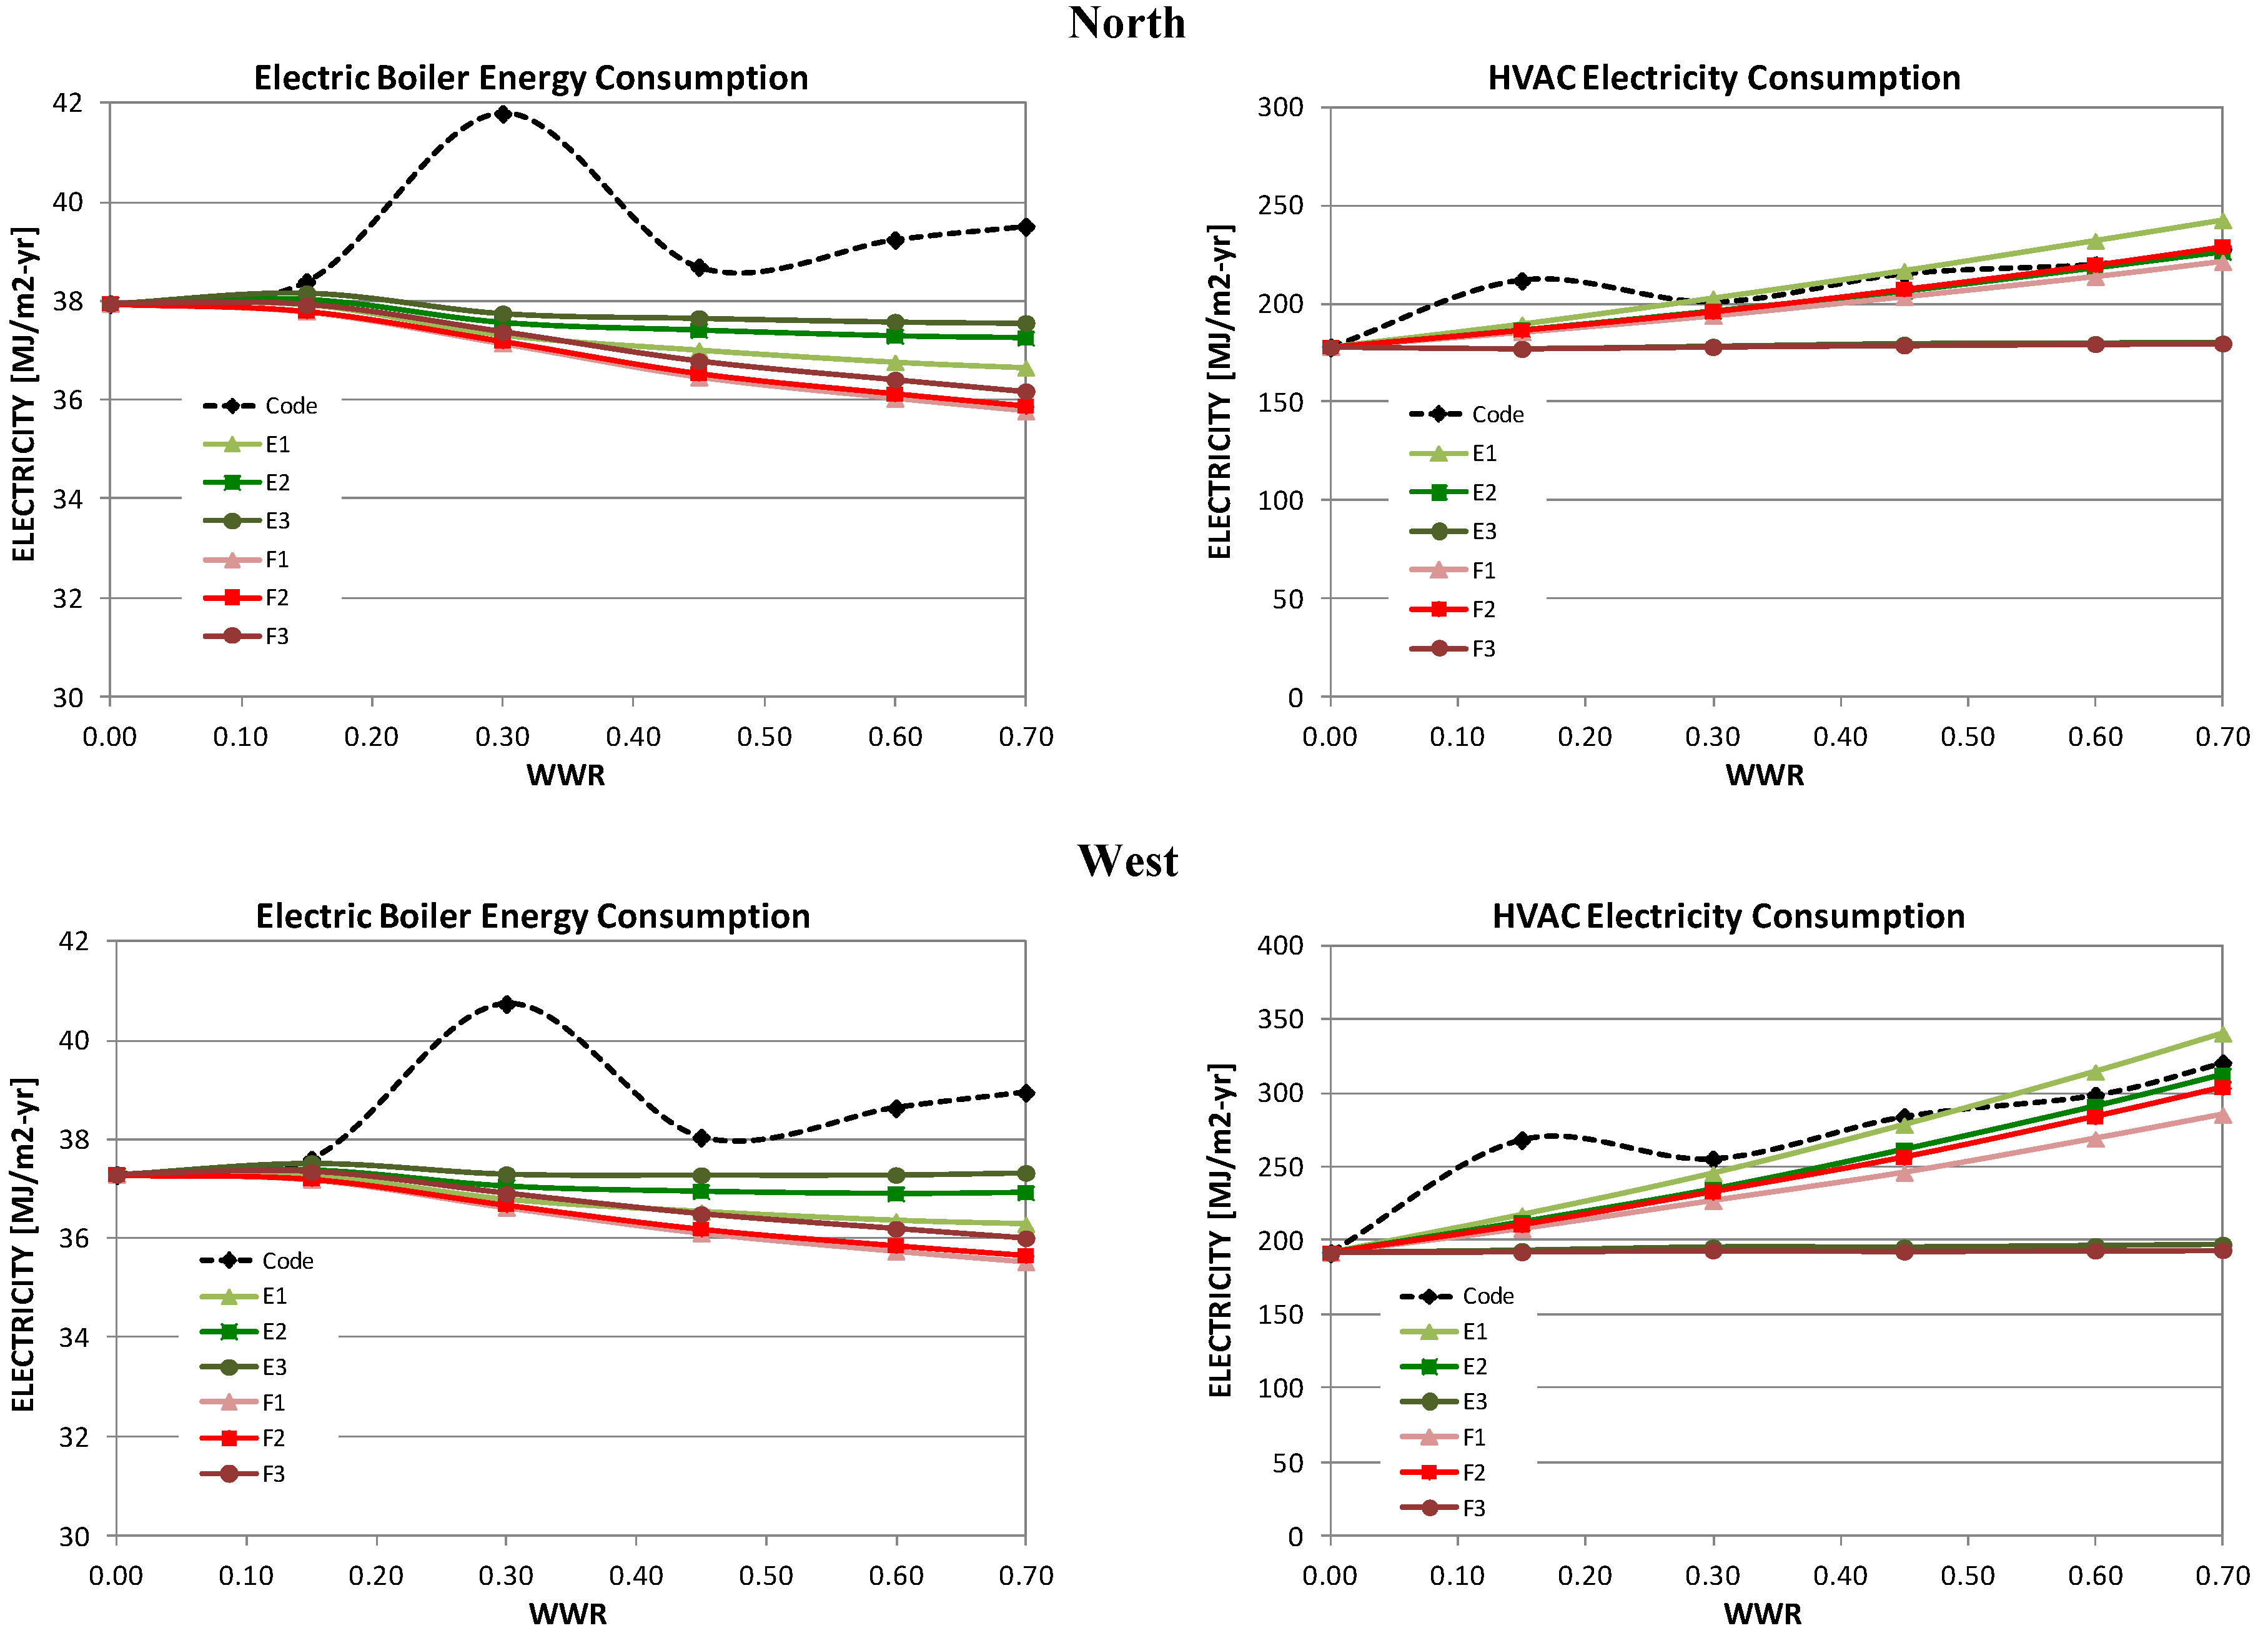
Boiler electricity consumption (MJ/m2-year) and percent savings compared to the GB 50189-2005 Standard for Shanghai.
Table 13.
Boiler electricity consumption (MJ/m2-year) and percent savings compared to the GB 50189-2005 Standard for Shanghai.
| Window Type |
|---|
| WWR | Code | E1 | F1 | E2 | F2 | E3 | F3 |
|---|
| EUI | EUI | % | EUI | % | EUI | % | EUI | % | EUI | % | EUI | % |
|---|
| South zone |
| 0.00 | 36.41 | 36.41 | 0% | 36.41 | 0% | 36.41 | 0% | 36.41 | 0% | 36.41 | 0% | 36.41 | 0% |
| 0.15 | 36.30 | 36.19 | 0% | 36.19 | 0% | 36.26 | 0% | 36.18 | 0% | 36.51 | −1% | 36.40 | 0% |
| 0.30 | 38.38 | 35.82 | 7% | 35.74 | 7% | 35.99 | 6% | 35.76 | 7% | 36.36 | 5% | 36.11 | 6% |
| 0.45 | 36.64 | 35.63 | 3% | 35.38 | 3% | 35.90 | 2% | 35.43 | 3% | 36.32 | 1% | 35.83 | 2% |
| 0.60 | 37.09 | 35.52 | 4% | 35.14 | 5% | 35.88 | 3% | 35.22 | 5% | 36.35 | 2% | 35.61 | 4% |
| 0.70 | 37.32 | 35.48 | 5% | 35.00 | 6% | 35.90 | 4% | 35.10 | 6% | 36.42 | 2% | 35.47 | 5% |
| East zone |
| 0.00 | 37.52 | 37.52 | 0% | 37.52 | 0% | 37.52 | 0% | 37.52 | 0% | 37.52 | 0% | 37.52 | 0% |
| 0.15 | 37.28 | 37.21 | 0% | 37.19 | 0% | 37.29 | 0% | 37.17 | 0% | 37.53 | −1% | 37.39 | 0% |
| 0.30 | 40.04 | 36.52 | 9% | 36.48 | 9% | 36.73 | 8% | 36.49 | 9% | 37.14 | 7% | 36.83 | 8% |
| 0.45 | 37.47 | 36.18 | 3% | 35.85 | 4% | 36.48 | 3% | 35.87 | 4% | 37.02 | 1% | 36.32 | 3% |
| 0.60 | 37.92 | 35.98 | 5% | 35.46 | 7% | 36.35 | 4% | 35.51 | 6% | 36.92 | 3% | 35.97 | 5% |
| 0.70 | 38.13 | 35.88 | 6% | 35.25 | 8% | 36.31 | 5% | 35.32 | 7% | 36.90 | 3% | 35.76 | 6% |
| North zone |
| 0.00 | 37.94 | 37.94 | 0% | 37.94 | 0% | 37.94 | 0% | 37.94 | 0% | 37.94 | 0% | 37.94 | 0% |
| 0.15 | 38.39 | 37.93 | 1% | 37.78 | 2% | 38.03 | 1% | 37.79 | 2% | 38.16 | 1% | 37.92 | 1% |
| 0.30 | 41.79 | 37.31 | 11% | 37.14 | 11% | 37.56 | 10% | 37.18 | 11% | 37.75 | 10% | 37.38 | 11% |
| 0.45 | 38.69 | 37.01 | 4% | 36.45 | 6% | 37.41 | 3% | 36.53 | 6% | 37.66 | 3% | 36.79 | 5% |
| 0.60 | 39.24 | 36.76 | 6% | 36.02 | 8% | 37.29 | 5% | 36.12 | 8% | 37.59 | 4% | 36.42 | 7% |
| 0.70 | 39.51 | 36.65 | 7% | 35.77 | 9% | 37.25 | 6% | 35.87 | 9% | 37.56 | 5% | 36.18 | 8% |
| West zone |
| 0.00 | 37.29 | 37.29 | 0% | 37.29 | 0% | 37.29 | 0% | 37.29 | 0% | 37.29 | 0% | 37.29 | 0% |
| 0.15 | 37.60 | 37.27 | 1% | 37.18 | 1% | 37.38 | 1% | 37.20 | 1% | 37.52 | 0% | 37.34 | 1% |
| 0.30 | 40.74 | 36.78 | 10% | 36.62 | 10% | 37.05 | 9% | 36.68 | 10% | 37.30 | 8% | 36.91 | 9% |
| 0.45 | 38.04 | 36.53 | 4% | 36.10 | 5% | 36.94 | 3% | 36.18 | 5% | 37.28 | 2% | 36.49 | 4% |
| 0.60 | 38.63 | 36.35 | 6% | 35.73 | 8% | 36.90 | 4% | 35.85 | 7% | 37.28 | 3% | 36.20 | 6% |
| 0.70 | 38.95 | 36.28 | 7% | 35.52 | 9% | 36.92 | 5% | 35.65 | 8% | 37.33 | 4% | 36.01 | 8% |
All types of windows E and F reduced the heating load and annual heating energy use with performance independent of window area. The unshaded window F1 yielded the best performance. Similar to the cold climate, the magnitude of heating energy savings resulting from the windows E and F is trivial and heating of outdoor ventilation air was the principle cause of the heating demand. Therefore, heating energy consumption is not a major consideration when selecting windows in hot summer and cold winter climates.
Exterior shaded windows (E3 and F3) produced the most significant reductions in the sensible cooling load as well as the HVAC electricity consumption compared to the 2005 code: ranging from 10% to 42% for the four different orientations as WWR increases from 0.15 to 0.70 and for some cases, resulting in less energy use than an opaque insulated wall. For the south zone with window E3 and WWR = 0.70, for example, the sensible cooling load and HVAC electricity use were reduced from 273.54 to 153.51 MJ/m2-year (44%) and from 300.32 to 188.31 MJ/m2-year (37%), respectively. The unshaded low-e window E1 resulted in greater HVAC electricity use than code for WWR ≥ 0.30 and should be avoided. Windows E2, F1, and F2 provided comparable energy performance as the code window.
In summary, the recommendation for the hot summer and cold winter climate is the same as the cold climate; i.e., the low-e window with exterior shading gives the best performance in terms of energy savings and initial cost and can result in less energy use than an opaque insulated wall. With daylighting, such systems would result in ultra-low energy use in internal load dominated commercial buildings.
4. Market Context
We offer some anecdotal observations on the building construction industry in China and provide some analysis on how this market context could provide unique opportunities for broad deployment of advanced fenestration products for low energy commercial buildings.
As in the US, public buildings in China are financial instruments that are designed and built by private sector developers with the goal of achieving a short-term, profitable return on investment. In order to compete in the market, decisions are made to balance pragmatic decisions that affect the capital cost of the building against the function, aesthetics, and rentability of the end product. The GB 50189-2005 sets the floor for energy-efficient performance and the LEED or Three Star certification programs provide the upper bound for performance, the latter making the property more attractive not only for local but also foreign businesses with a vested interest in sustainable practices.
The cost of construction in China is significantly lower than in the US: about $600–1300 US/m2 in China versus $2000–5000 US/m2 in the U.S. (as of 2012). Full construction documents can take a few months with a dedicated team of two or three people and construction of a large building can be completed within three to six months. For a medium-size development (~60,000 m2 of floor area), the installed cost of a curtainwall system with large-area, spectrally selective low-e IGU windows is about $220 US/m2 (based on conversations with an architectural/ engineering team). This cost can increase to $285 US/m2 if exterior shading (700 mm deep) and other curtainwall details (e.g., shadow box at spandrel, ceramic frits, transoms, caps) are added to improve the aesthetics of the façade. Simple payback periods of less than three years based on energy savings is desirable. Energy costs are similar to the US, with an average of $0.11/kWh. In some areas, time of use rates apply with a $0.07/kWh base and costs of $0.13/kWh during peak periods defined by the residential load, which occur at 8:00 a.m. and 6:00 p.m.
A life cycle cost analysis showed that a simple payback of 1.5 years and an internal rate of return (IRR) of 65% was obtained if an advanced low-e window with exterior shading (Window E3) was used instead of the window prescribed by the GB 50189-2005 code in Beijing. A simple payback of 6 years and an IRR of 17% were obtained for this same scenario in Shanghai. Assumptions for this analysis were that the code and E3 windows cost $200/m2 and $285/m2 installed, respectively, heating cost $7.1/GJ, electricity including demand cost $0.15/kWh (flat rate), the discount rate was 6%, and the life of the technology was 30 years. Given the attractiveness of this financial investment, achieving goals of 30%–50% reductions in perimeter zone energy use below the 2005 code appear to be broadly feasible in China.
The commercial real estate developer is fully aware of the cost and limitations of maintaining reliable building operations in China. While the window E3 system does not require motorization (conscientious occupants with instructions on how to operate to the shades could achieve similar results), savings cannot be guaranteed without automation. One developer indicated that motorized systems were to be avoided since these systems require maintenance and were likely to fail in the short term. Exterior shading systems that attract pigeons or accumulate dirt or particulates from city smog were undesirable. Domestic products were preferred for practical reasons: (a) foreign products incur a 40% tariff; and (b) local Chinese manufacturers would uphold the terms of the warranty in a timely manner.
With the exception of construction cost, the business context is very similar to the US. Given the relatively low cost of construction, energy operating cost for the tenant becomes more of a critical issue for businesses that lease the space. The Three-Star Green Building certification becomes important within this context. For certification, the Ministry of Construction uses monitored data to assess energy performance relative to the energy-efficiency standard. Tenants can then use the certification for informed decision-making.
Exterior shading systems have long been known to produce the most significant reductions in HVAC energy use, particularly in internal load dominated buildings like office buildings, and have been used extensively throughout Europe. These systems are used in only a fraction of commercial buildings in the US because the codes are much less stringent and the cost of energy is lower. ASHRAE 90.1-2010 and 189.1 codes are imposing more stringent requirements that could increase use of exterior shading systems. However, in addition to cost constraints, proper implementation, code enforcement, and long-term maintenance are key concerns for operable systems. Between-pane motorized shading systems are more expensive and are subject to issues of long-term maintenance as well. Clearly, innovative products are needed to address these challenges.
Highly insulating windows have significantly greater potential for market uptake (particularly in colder climates like Beijing) since no maintenance is required and the window is likely to meet the aesthetic requirements of developers. There is significant on-going R&D worldwide to improve performance of component technologies (IGU, spacers, framing) as well as produce such systems at lower cost.
5. Discussion and Conclusions
Space heating, cooling, and lighting energy use are three of the largest energy end uses in commercial or public buildings in China and energy-efficient window and shading systems can have a significant impact on reducing these end uses in perimeter zones. To quantify these impacts, one needs to have an accurate depiction of the typical characteristics of HVAC systems and how they are operated. A prototypical large office building model originated from the DOE reference building was adapted to comply with the GB 50189-2005 Standard.
Two types of advanced window systems were evaluated by comparing zone heating and sensible cooling load as well as the HVAC energy use in the perimeter zones. A spectrally-selective low-e dual pane window and a triple pane, highly insulated window were modeled. The windows were combined with an interior or exterior roller shade that was controlled on a time step basis to minimize heating and cooling energy use. Parametric analysis of these various window types using EnergyPlus indicated that for both the cold Beijing climate, and hot summer and cold winter Shanghai climate, the spectrally-selective low-e dual pane window with an exterior roller shade and the triple pane window with an exterior roller shave provide the best performance in terms of energy savings, while the spectrally-selective low-e dual pane window with an exterior roller shade is more economically attractive due to its lower cost.
The economics of such solutions is highly dependent on the specifics of the space conditioning. If occupants are not using space conditioning either due to thermal preferences defined by adaptation to a broader range of environmental conditions or for reasons of economy given that energy costs are high, then the economics of the solution must be judged based on how the solution improves thermal comfort and habitability of indoor spaces. If a developer is selecting energy-efficiency measures based on a short return on investment and low capital cost, then advanced window solutions may be made cost-effective by including not only projected energy use reductions into the calculation but also potential capital reductions due to downsizing of HVAC capacity and air distribution systems and increased comfort and amenity provided by such solutions. Even so, with the low costs for labor and materials in China, anecdotal data suggests that the simple payback periods for even the more aggressive energy efficiency measures will be less than 5–7 years.
This study illustrates that the goal of achieving 30%–50% lower perimeter zone energy use compared to the current GB 50189-2005 code can be straightforward with unshaded high performance low-e windows that are commercially available today. To meet even more aggressive energy-efficiency and greenhouse gas emission reduction goals, low-e windows with operable exterior shading can be used to achieve up to 50%–80% reductions in perimeter zone energy use within a simple payback of 2–6 years in internal load dominated commercial buildings.


