5.1. Phase A
In this phase, the total annual energy consumption in kWh/m2, defined as the energy purchased to or generated within the building, which consisted of cooling, heating, lighting, and photovoltaic energy generation was analyzed for the STD office building. The main purpose was to identify the glazing element that presented the best performance under different conditions. Furthermore the energy balance index (EBI) was calculated as the algebraic sum of all energy contributions so that the production of photovoltaic energy is subtracted from the overall consumption.
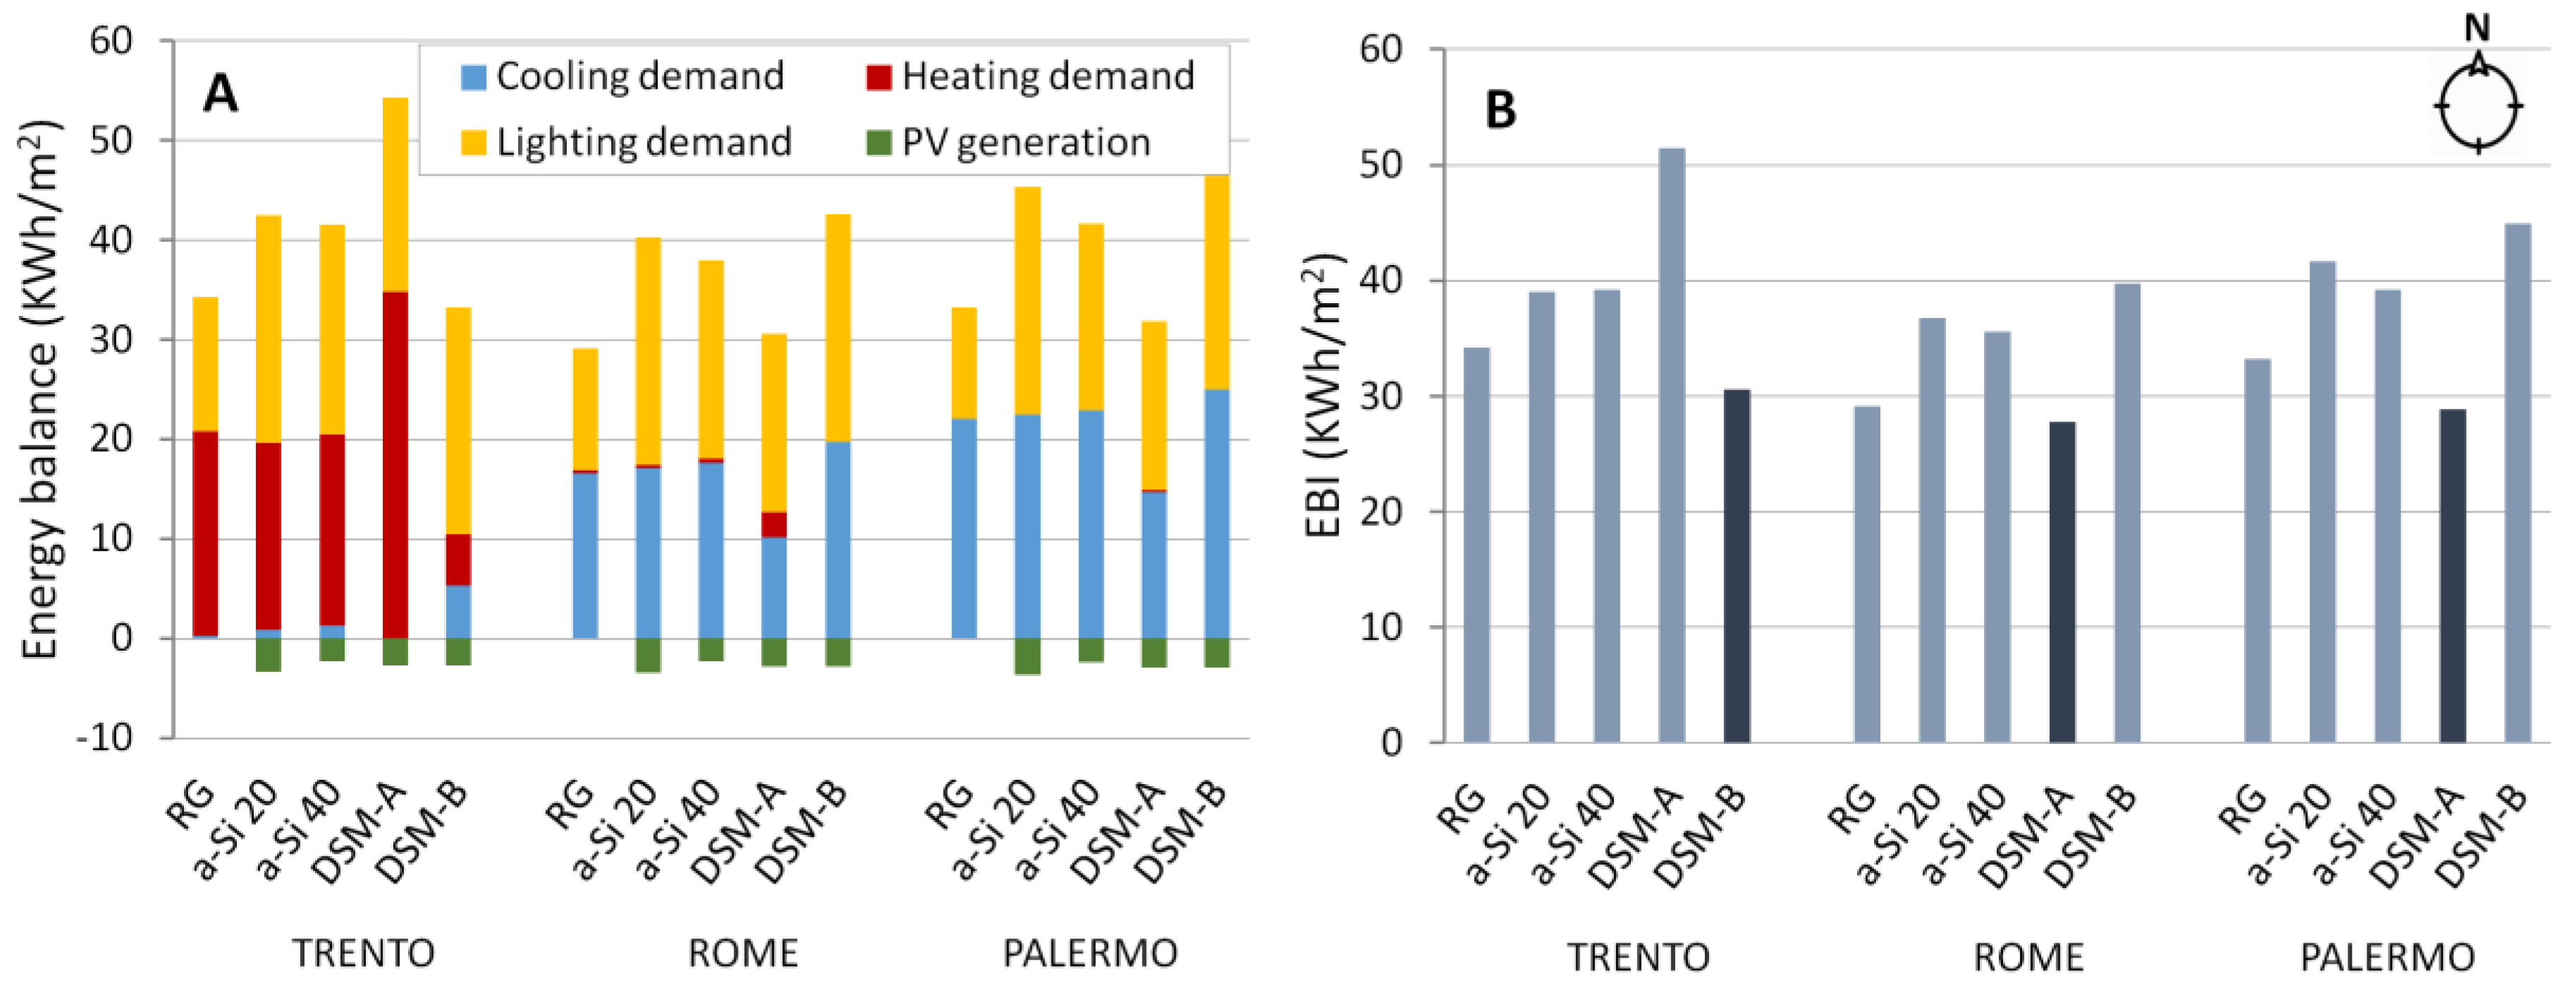
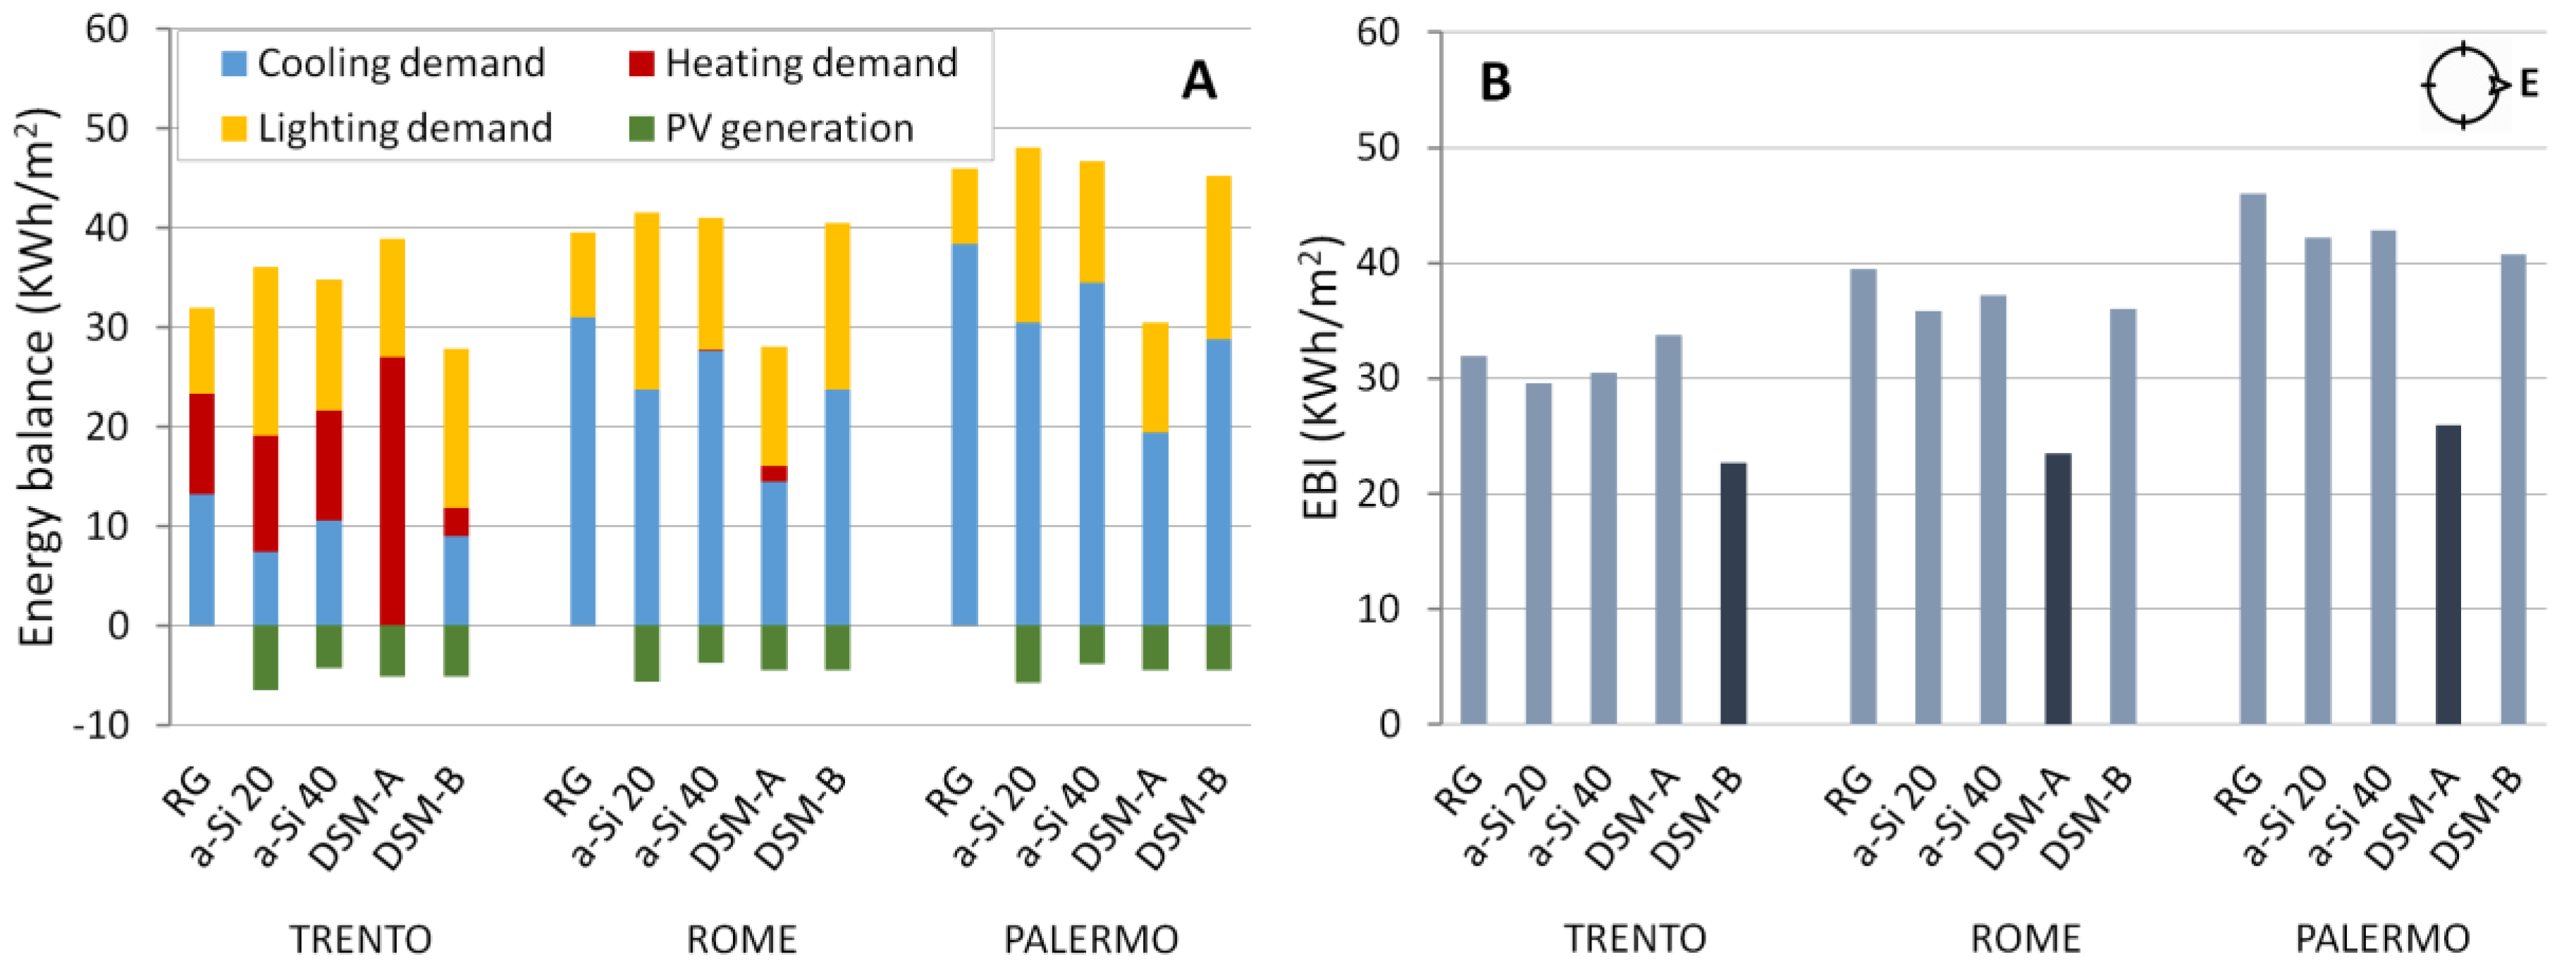
Figure 7 shows the energy balance (A) and the EBI index (B) for the three locations considering the external wall exposed towards the north.
It can be observed that the traditional double glazing RG presents different behaviors in the three cities; concerning heating and cooling, in Trento, only heating demand is present, while in Rome and Palermo, the opposite occurs. In Trento only one element, the DSM-B, is responsible for a cooling demand that cannot be considered negligible (5.3 kWh/m2).
In Trento, DSM-A has the maximum heating demand, 34.8 kWh/m2, while the DSM-B has the lowest cooling demand of about 5 kWh/m2. The maximum lighting demand occurs with the DSM-B and a-Si 20.
Rome and Palermo have similar consumption. Indeed, cooling demand is dominant in both cities, even if heating demand is not negligible for the DSM-A element in Rome. In these cities cooling demand is the highest with DSM-B glazing and the lowest with DSM-A. On the contrary, in Trento heating is dominant, and it is greatly reduced by using DSM-B glass.
Semi-transparent photovoltaic element a-Si 20 generated the highest energy; in fact it has the highest value of conversion efficiency among all the selected items.
It has to be remarked that, if northern exposure is considered, the PV production is mainly due to the diffuse component of solar irradiance.
The EBI index is shown in
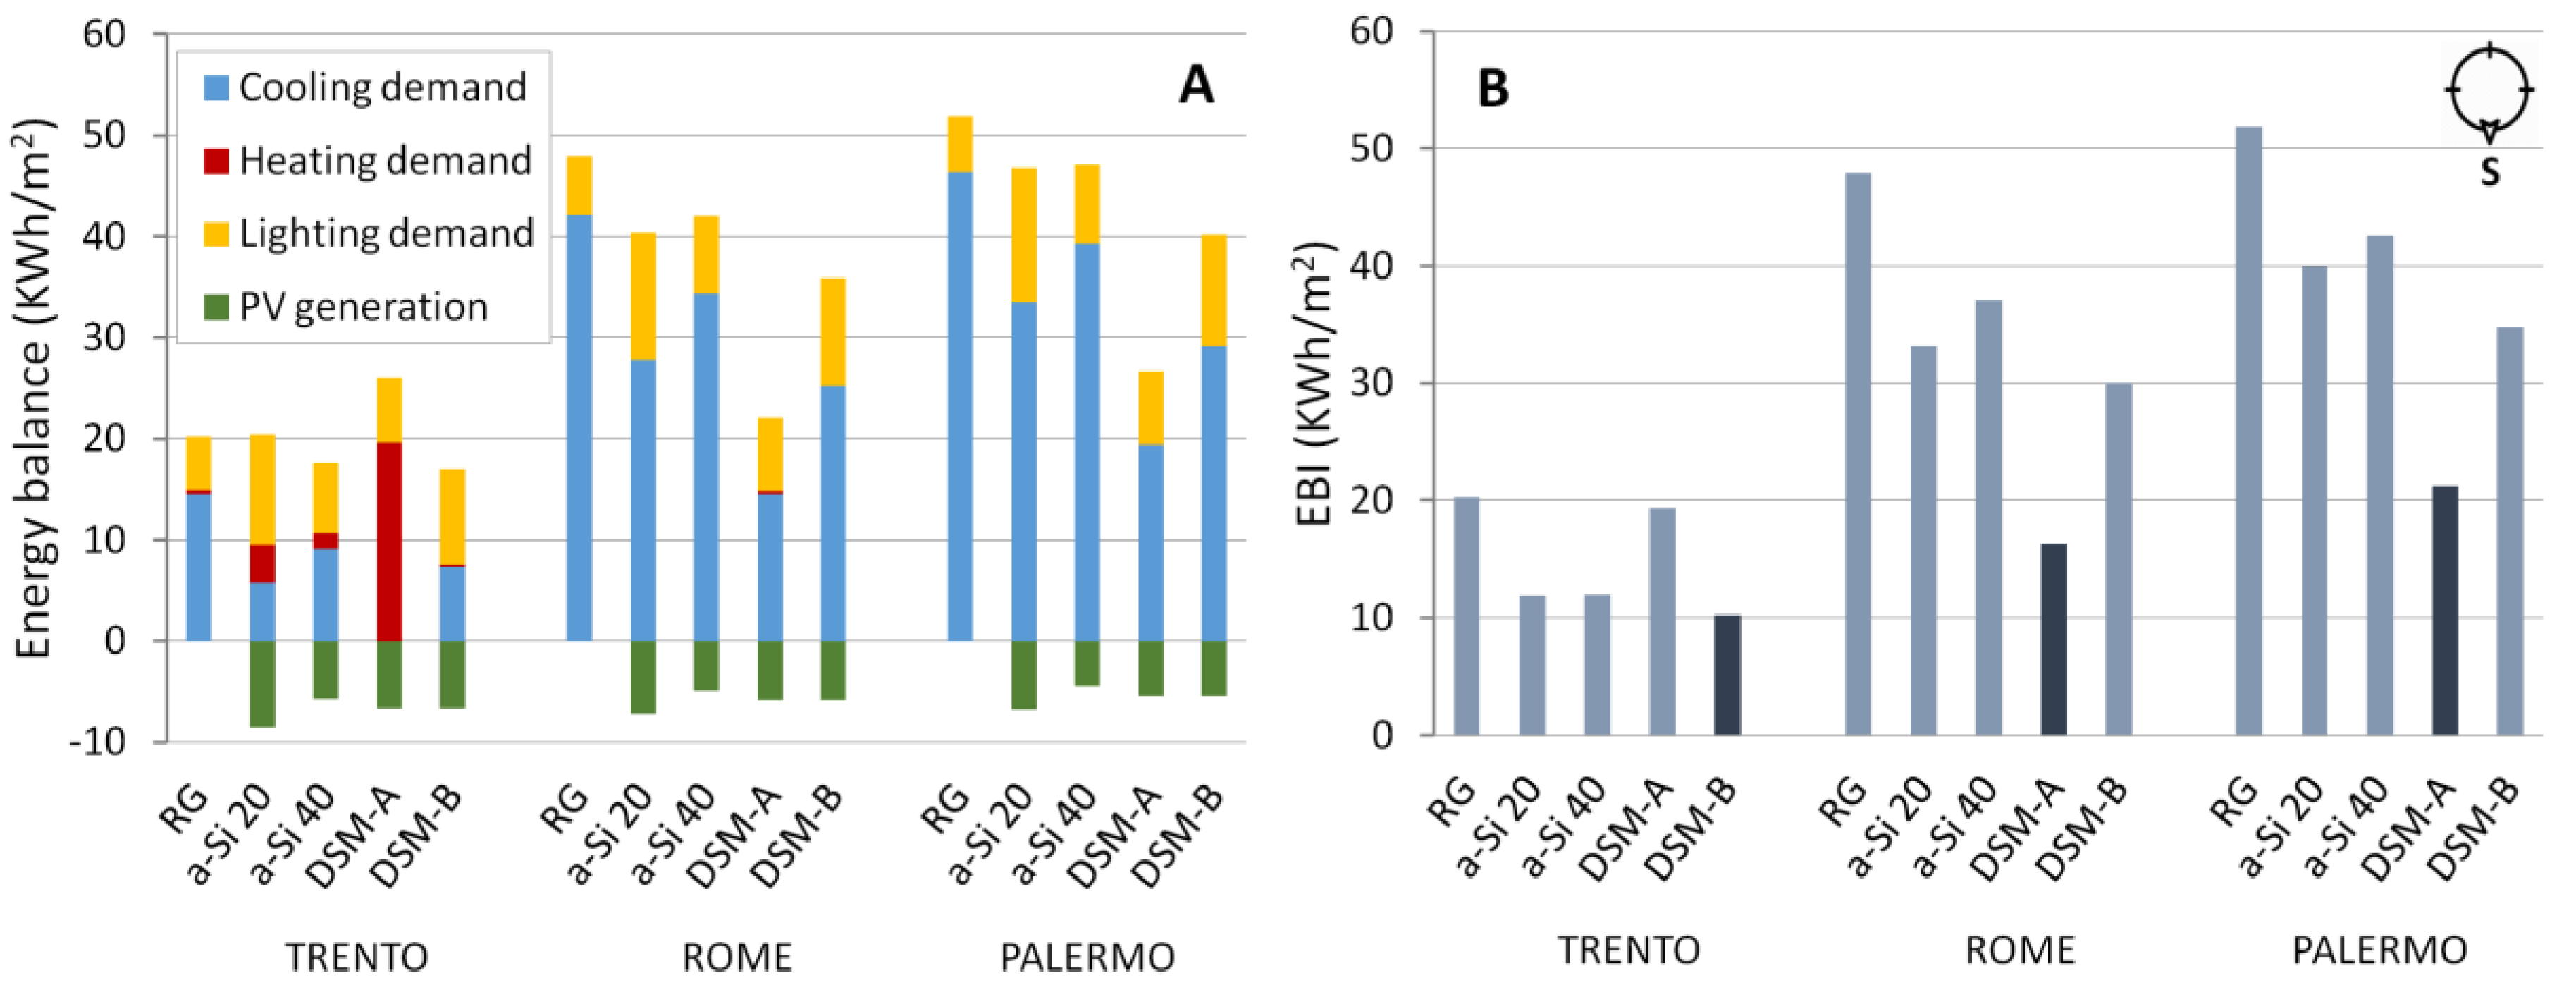
Figure 7B. EBI shows that the elements that have the lowest annual consumption are DSM-B for Trento and DSM-A for Rome and Palermo. The increase of heat in the south side produces an increase of cooling demand, as shown in
Figure 8A, which is a maximum with RG glazing and a minimum with a-Si 20 in Trento and DSM-A in Rome and Palermo.
In Trento, DSM-A maintains the same trend as on the north side and the cooling demand remains negligible, while heating demand is predominant (19.6 kWh/m2). The a-Si 20 provides the highest energy consumption value for lighting demand. In Rome and Palermo, heating demand is negligible considering all the window types. In Trento, DSM-B has the lowest consumption, while in Rome and Palermo, DSM-A results as the best performing.
Also for EBI (
Figure 8B), the same DSM had the lowest energy consumption with respect to the other elements. PV production is almost equivalent for all sites and technologies; however a slight improvement in production is visible in Trento due to the more favorable irradiance incidence on a vertical wall for higher latitudes where the sun elevation is lower. Considering PV production, a-Si-20 is the most well performing for all sites.
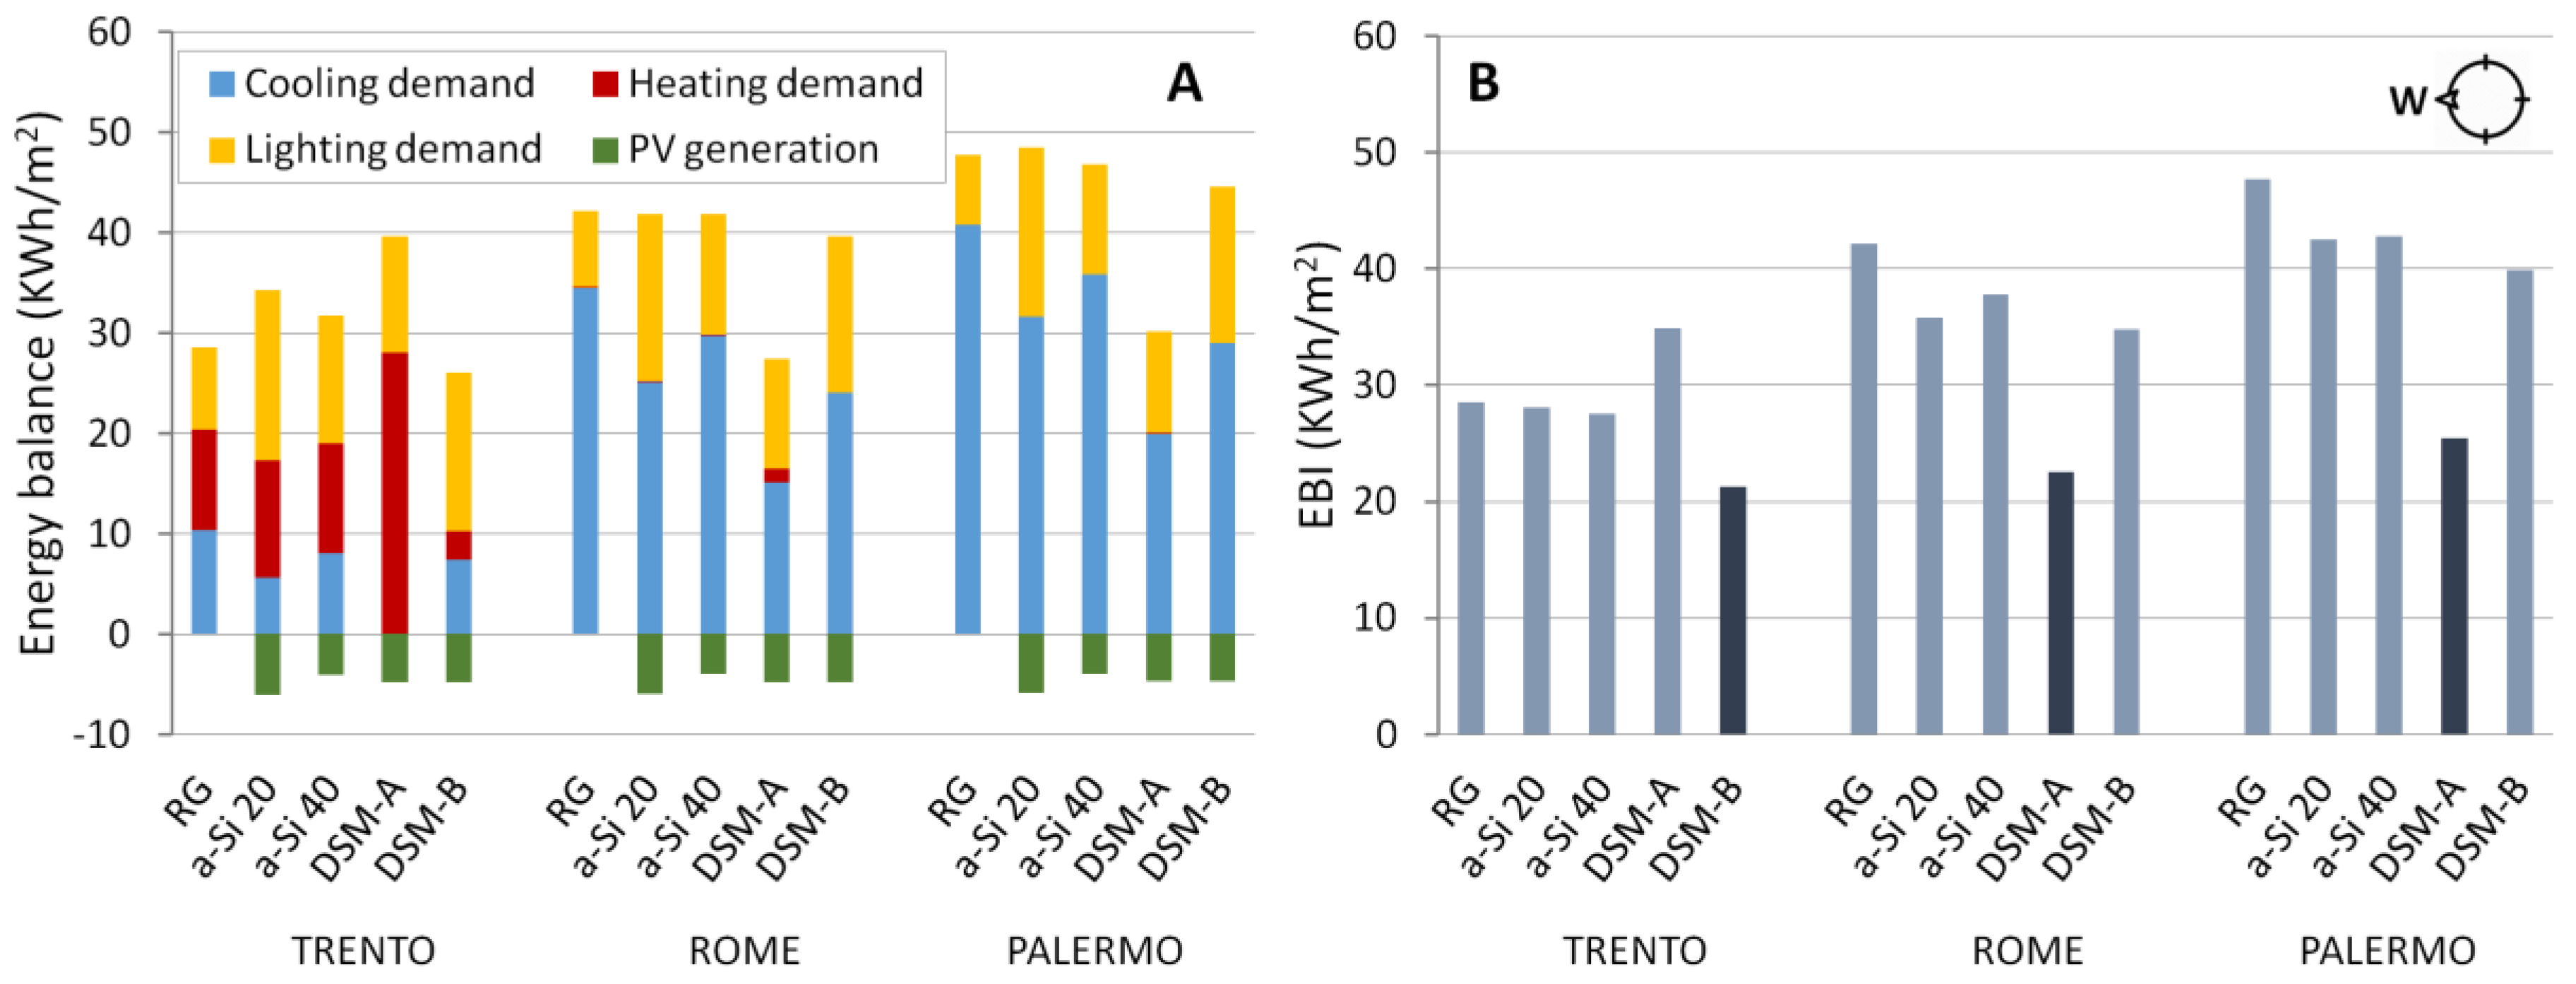
Figure 9 presents the results for the eastern orientation. The cooling demand in Trento (
Figure 9A) is similar to the situation examined earlier. In fact, the range of consumption values reported with eastern orientation is 1 kWh/m
2 less than those of the south side. Instead heating demand is not negligible as with southern exposure. The maximum heating consumption is achieved with the DSM-A, while the minimum is reached with the DSM-B. In the other cities, the heating values are negligible, with the exception of Rome with semi-transparent DSM-A.
On the contrary, the cooling demand for Rome and Palermo has a behavior similar to the southern side.
The energy balance index EBI shows that also in this case the best performing elements are DSM-B (Trento) and DSM-A (Rome–Palermo).
The results of the simulation on the western orientation reproduce, with different values, the trend of consumption previously described for the eastern orientation (
Figure 10A).
Nevertheless, in Rome and Palermo, the cooling demand and the production of photovoltaic energy are slightly greater, while the heating demand decreases compared to the East since the air temperature is higher in the afternoon than in the morning.
The energy balance index (see
Figure 10B), shows that even for this orientation of the glazing elements, the best performance among those we studied were as follows: DSM-B for Trento and DSM-A for Rome and Palermo.
Table 7 resumes the best choices of glazing elements for the three cities and the four orientations based on the EBI evaluation. DSM-B, which presents better insulation performance, is more suitable for a cold climate while DSM-A, having minor insulation, is preferable in a warm climate.
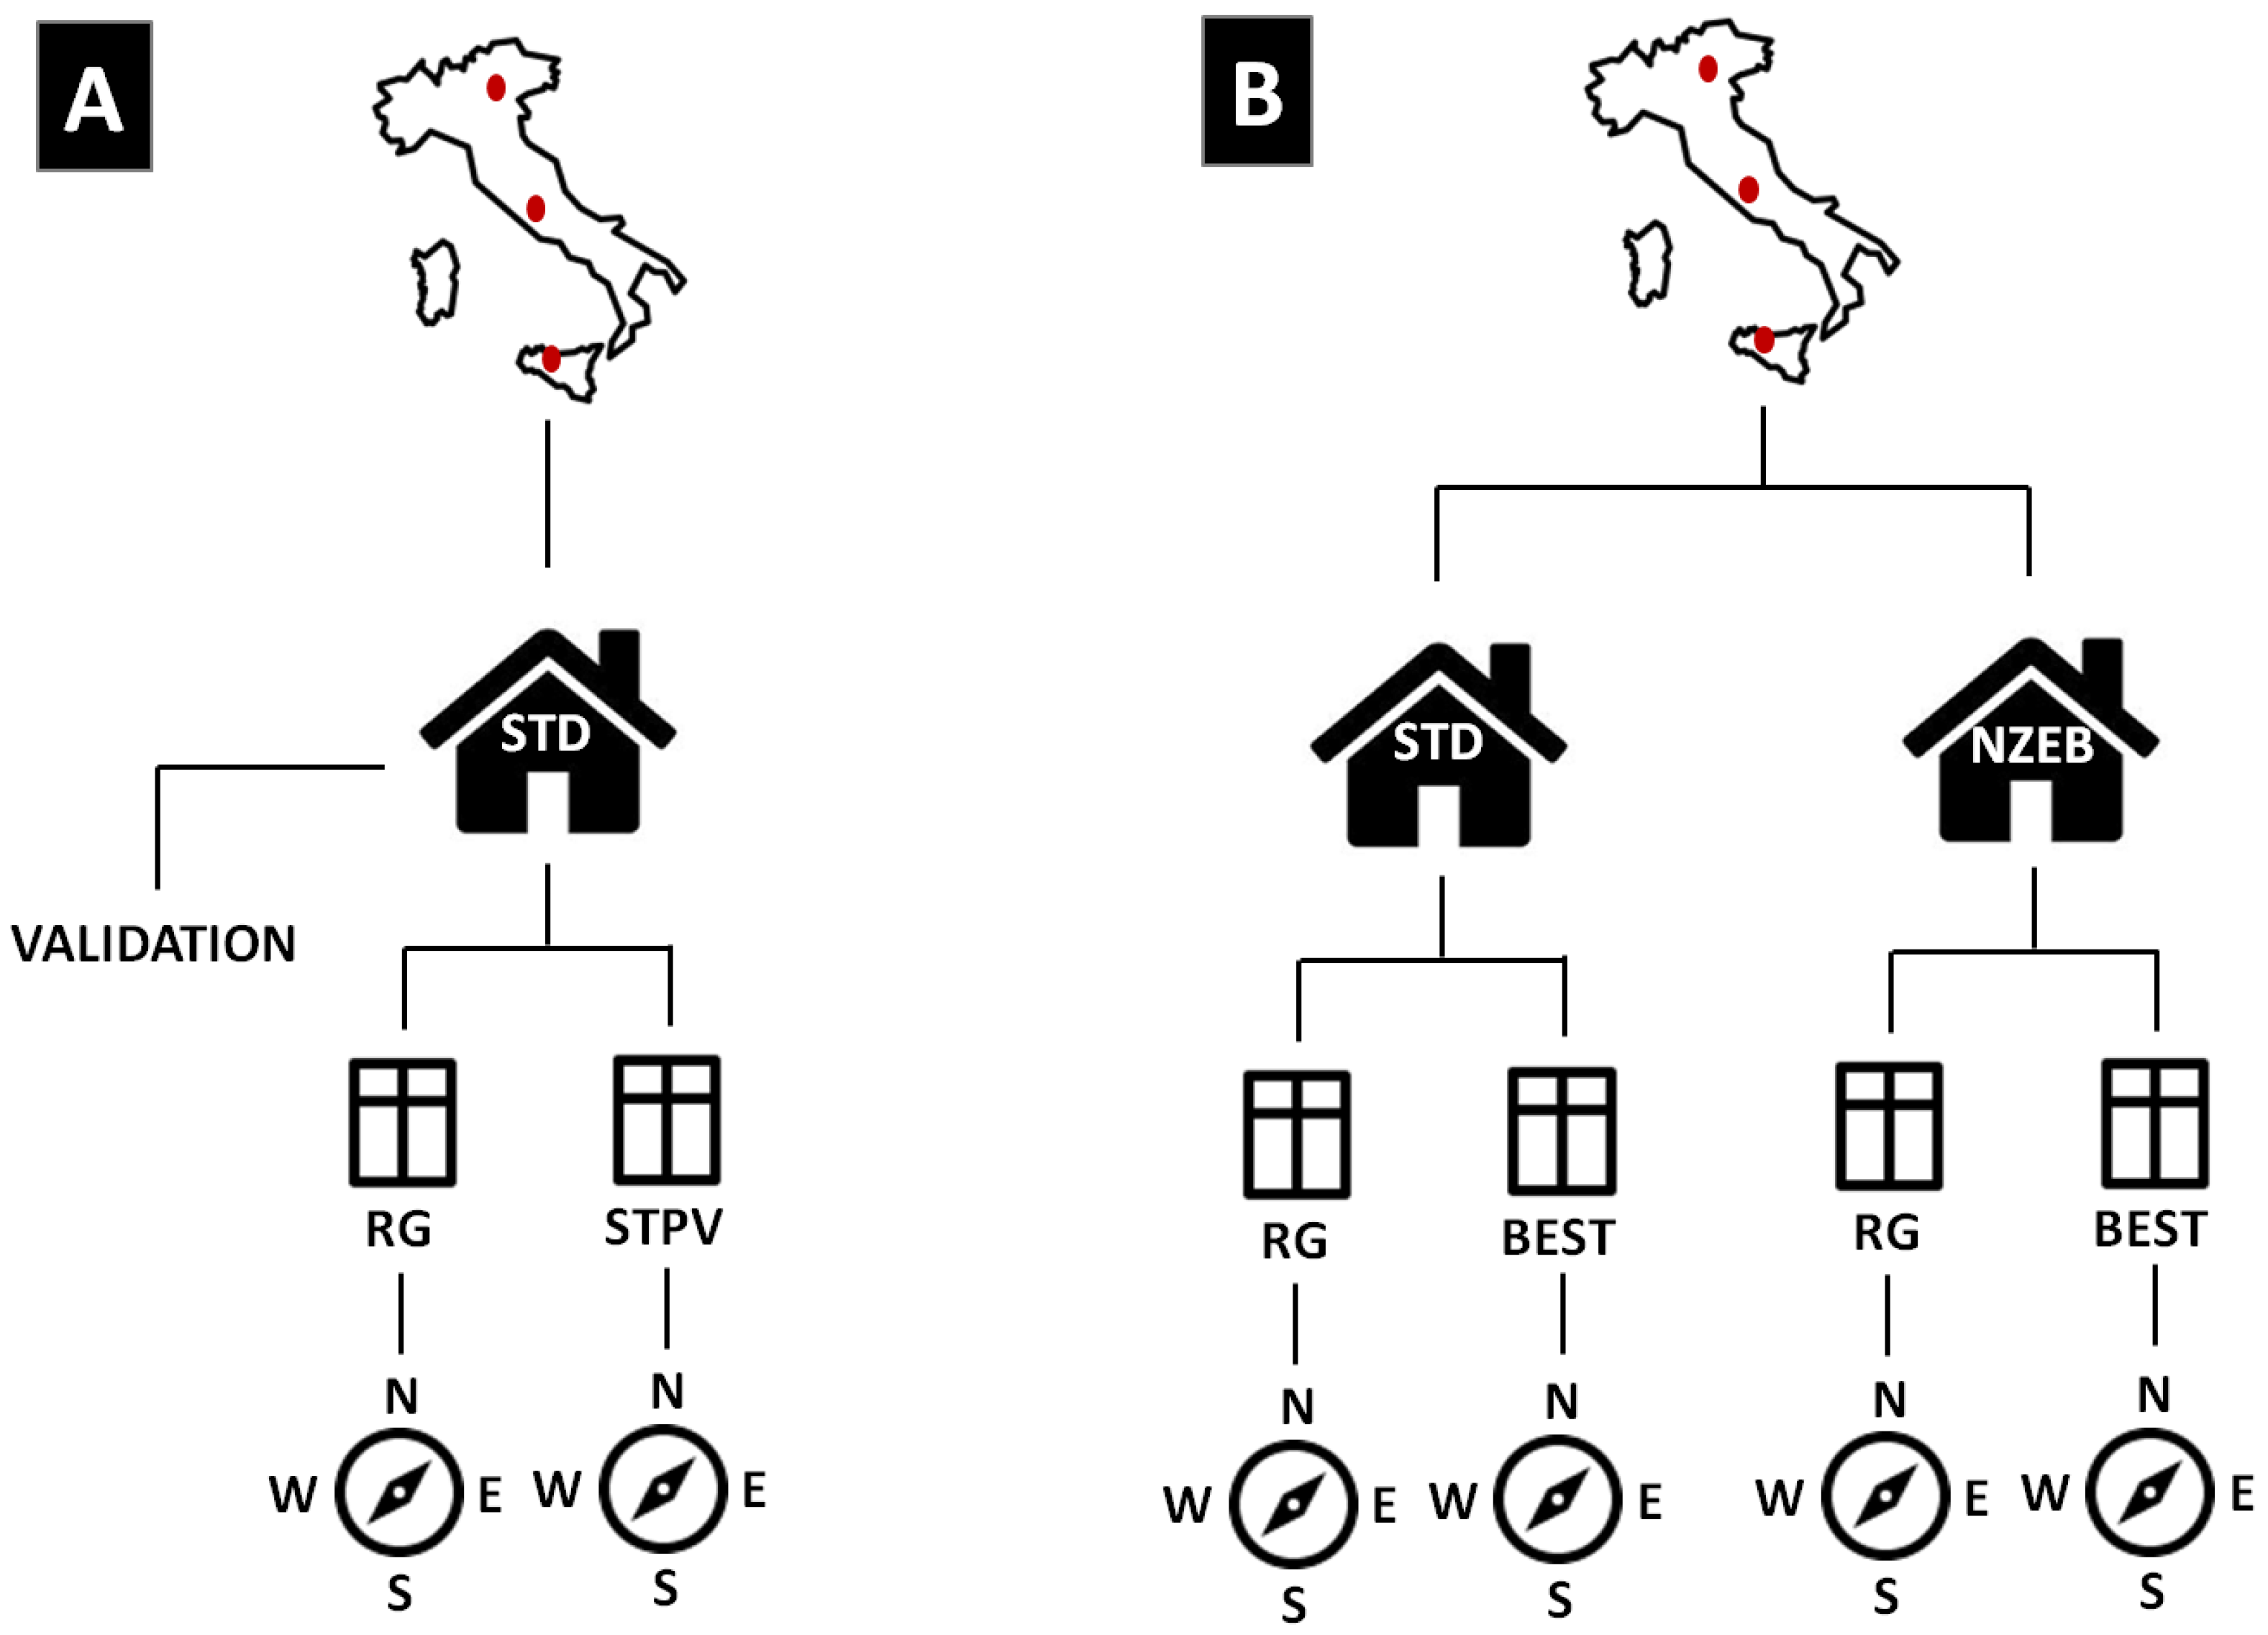
5.2. Phase B
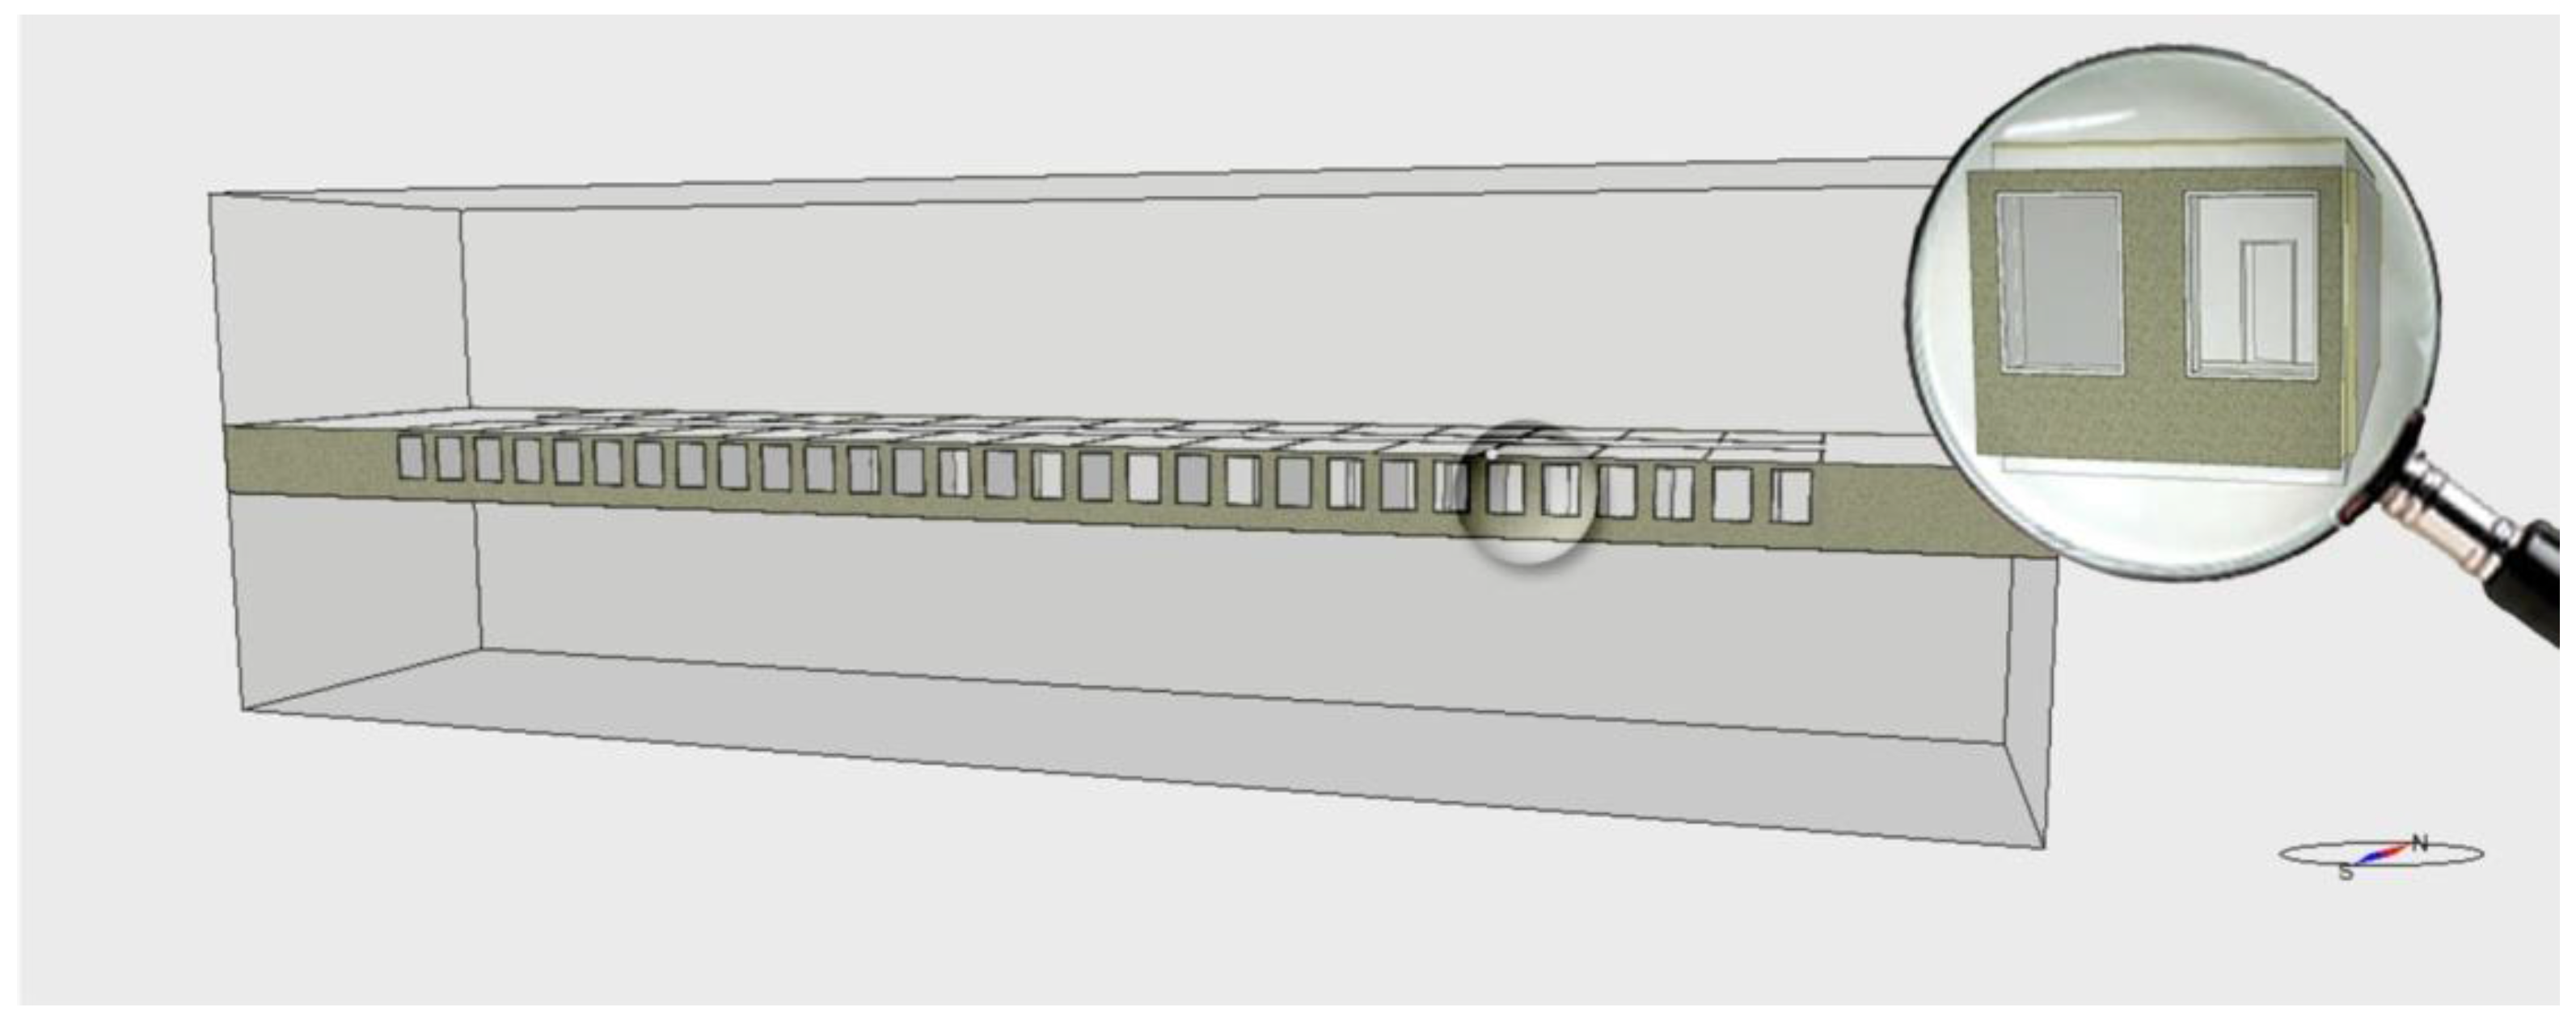
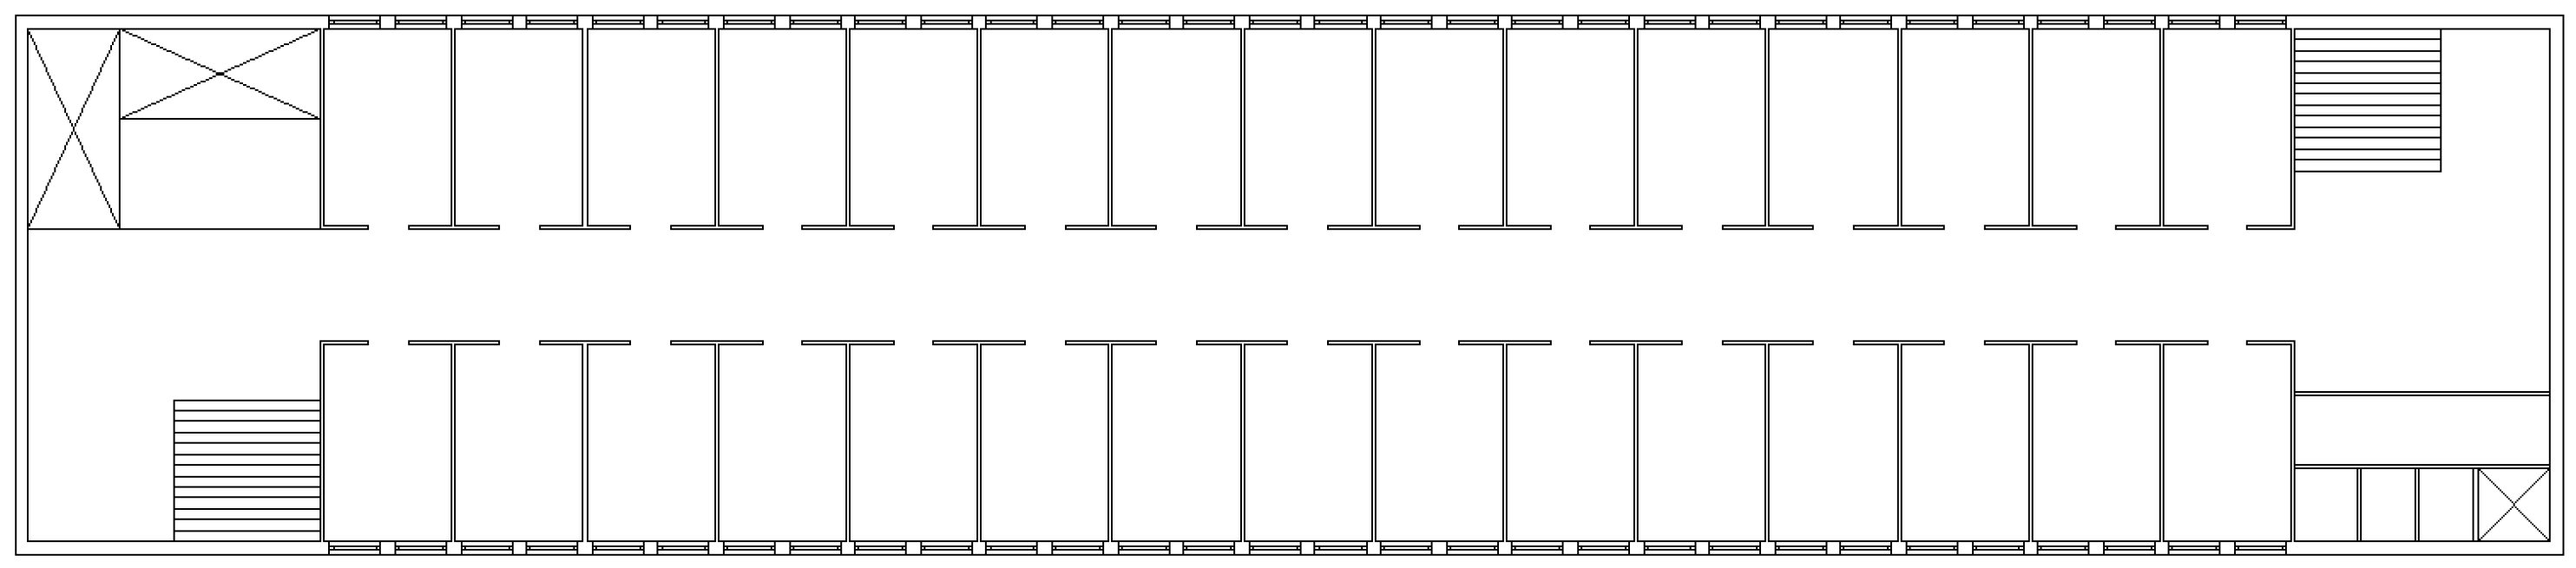
In this phase, the entire floor of the building was simulated to determine the most efficient solutions in terms of energy saving under different conditions. The 30 office rooms have the same characteristics as the office model simulated in Phase A; the corridor has only the light as the internal load, with the control sensor set to 500 lx.
Two types of reference buildings were tested; the STD with the reference glazing RG and the NZEB with the reference glazing elements listed in
Table 4.
For each type of reference, STD and NZEB, the windows were then replaced by inserting the most performing elements identified in Phase A in the three cities (see
Table 7). The performance of the references with respect to the most performing solution was compared for the North/South (N/S) and East/West (E/W) orientations (
Figure 11 and
Figure 12).
Twenty-four simulations were conducted in total; twelve for the North/South exposure and twelve for the East/West exposure.
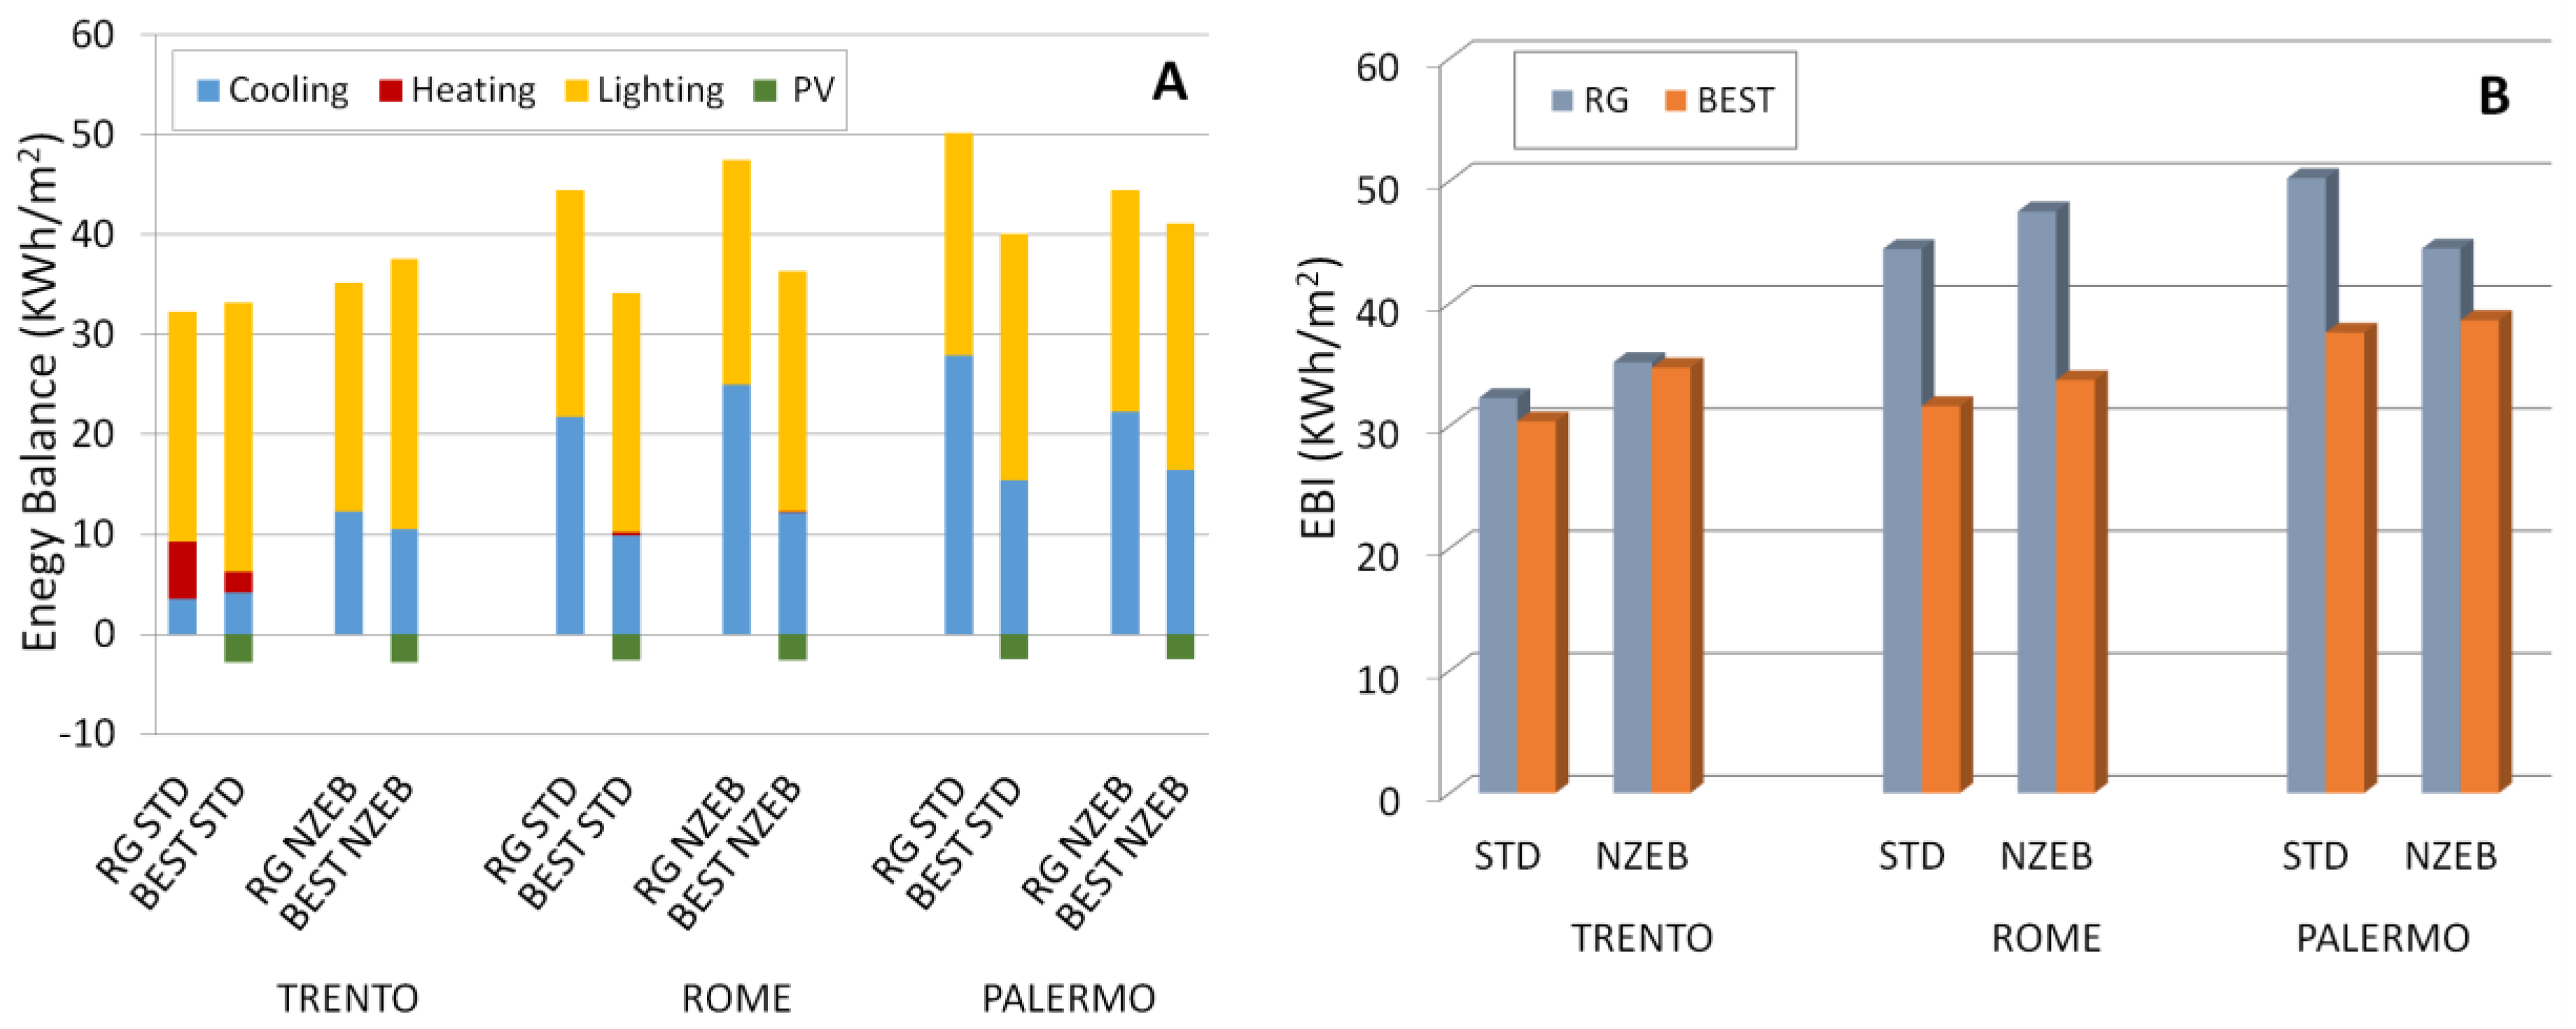
For the N/S orientation, as shown in
Figure 11B, the NZEB building equipped with RG outperformed the STD with RG only in Palermo. This is mainly due to the fact that cooling is the greatest thermal energy demand. Indeed, for Rome and Trento, the high insulation of the walls and windows, required by NZEB, causes overheating of the building, which results in a high cooling demand. This is not the case in Palermo since the U-value of the reference glass in NZEB is higher than that in STD. Moreover the U-values for the walls in STD and NZEB are comparable, so the overheating is less for NZEB (see
Table 3 and
Table 4).
A considerable difference in energy demand is observed when DSM-A is used instead of RG in Rome and Palermo (
Figure 11A). In fact, the cooling demand decreases in all the BEST simulations except in Trento, where the BEST STD cooling value is a little higher than the RG STD cooling value. Heating demand is not negligible only in Trento, and it is considerably reduced by the DSM-B BEST glass.
Concerning lighting demand, when BEST is used, the transparency decreases and the lighting demand increases because the amount of light that passes through the window decreases due to the low transparency of DSM.
The minimum EBI difference between BEST and RG is obtained in the NZEB building in Trento (1.25%), while the maximum EBI difference is obtained in Rome, always considering the NZEB building (29%). In Palermo, while the RG STD has a higher EBI than the RG NZEB, we observe that BEST NZEB consumes more energy than BEST STD. This is due to the fact that RG NZEB is less insulated than RG STD in the glazing component, while, once BEST is applied to both models, the lower wall U-value of NZEB tends to overheat the office. Under these specific conditions and hypotheses, it can be concluded that in Trento the use of STPV with a N/S orientation is not producing a convenient improvement in energy saving. On the contrary, in Rome the maximum saving is observed.
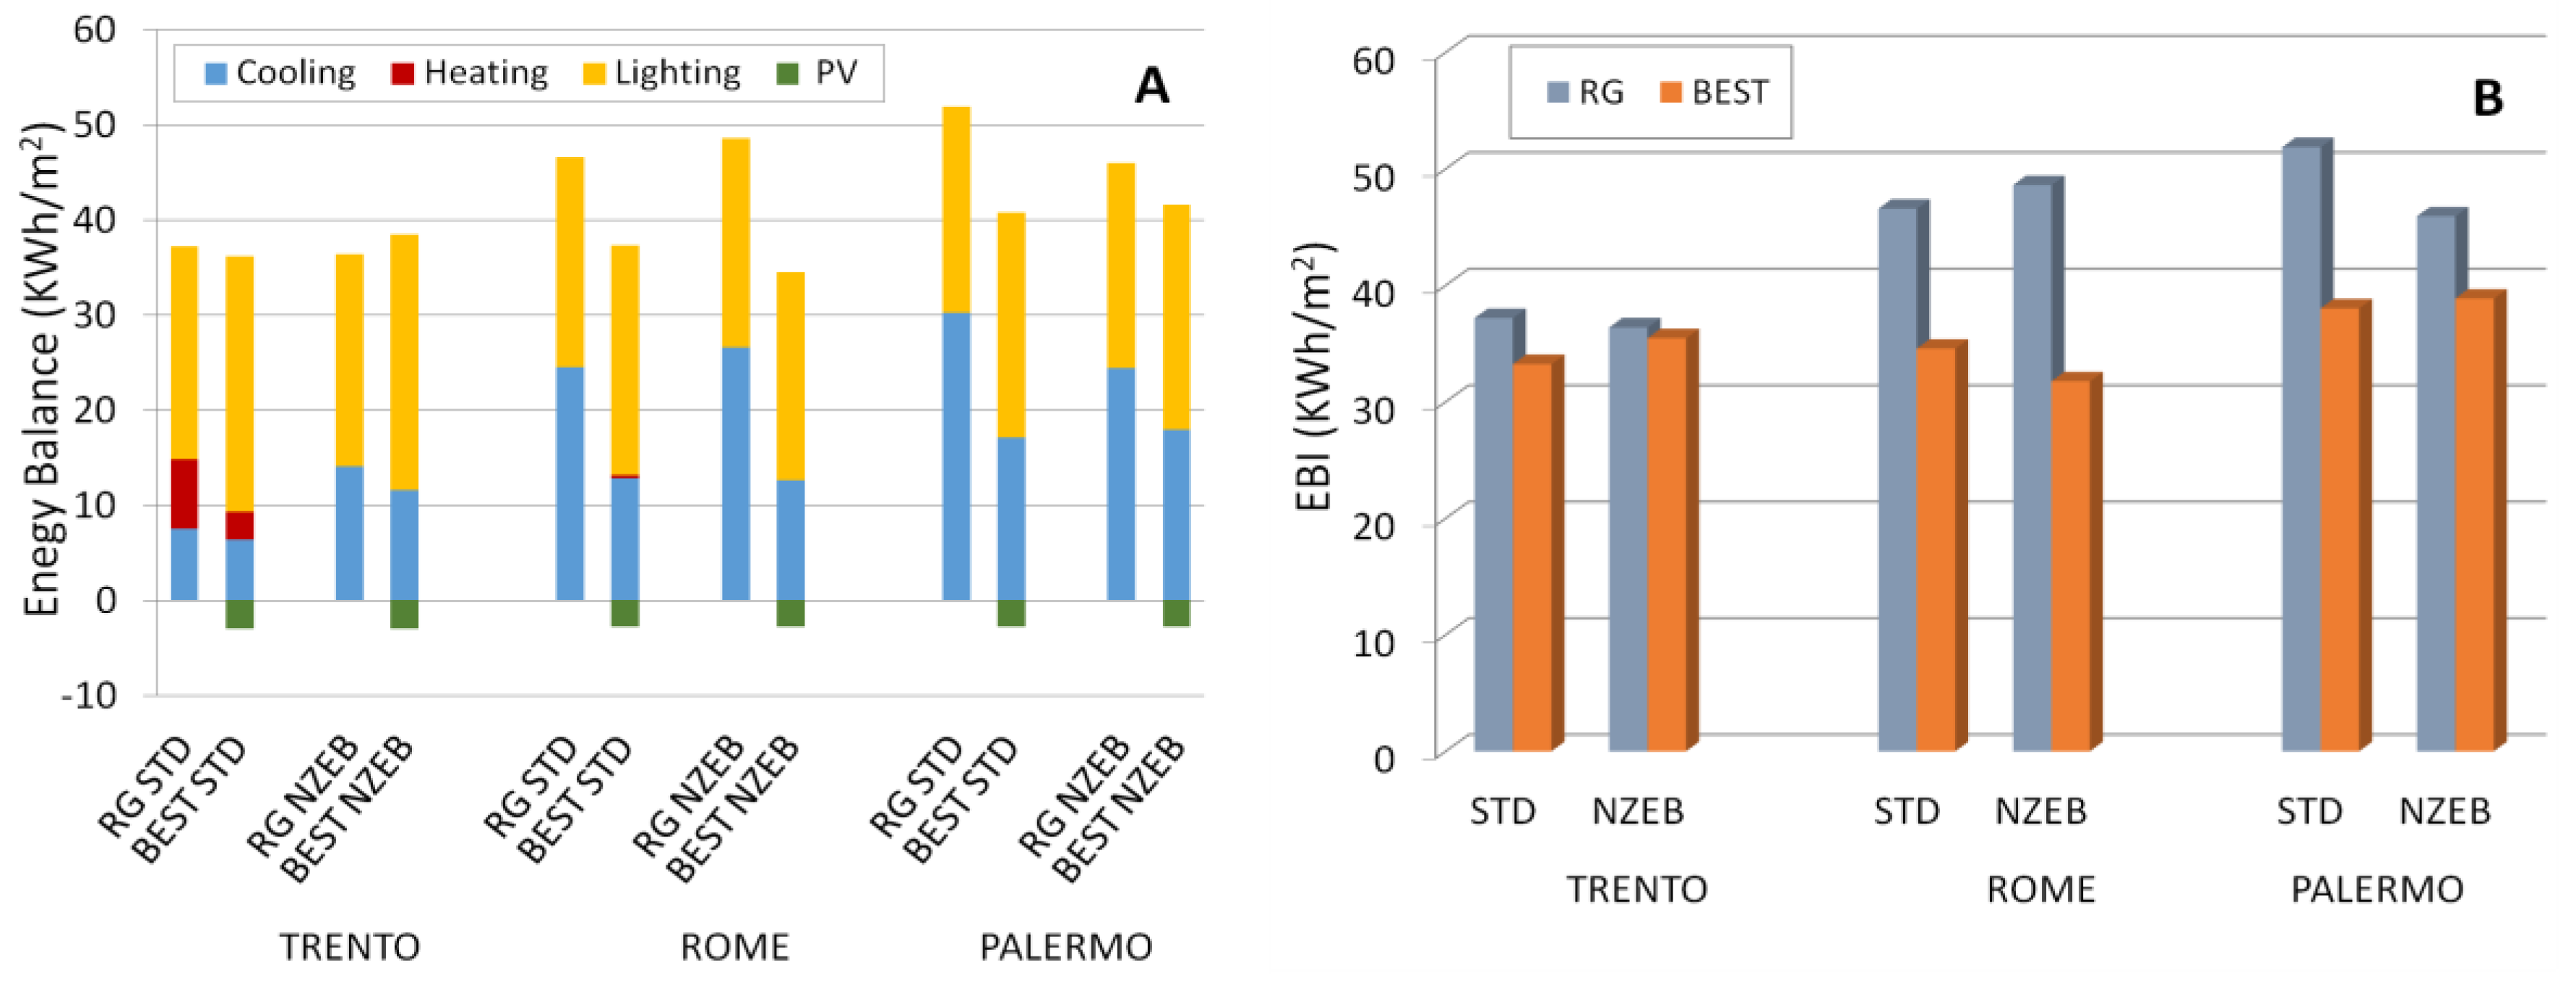
For the E/W orientation (
Figure 12B), the NZEB with RG building outperforms the STD with RG, also in Trento. Indeed the E/W orientation increases both heating and cooling demand with respect to the N/S orientation in STD. This is due to the difference in sun elevation, with a lower greenhouse effect in winter and a higher effect in summer.
The maximum value of cooling demand is produced by the RG STD in Palermo, while the minimum is reached in Trento by BEST STD.
As for the N/S side, only the STD simulations for Trento show a heating demand that it is not negligible.
Lighting demand presents higher values in the BEST simulations for the same reason as in the N/S orientation.
The minimum EBI difference between RG and BEST for NZEB is observed in Trento (2.55%), while maximum is obtained in Rome for the same building (34.65%).
The trend of the simulations is very similar to those described in the N/S side, but the total energy balance for all the simulations in the E/W orientation (
Figure 12A) presents higher values than N/S, side except for the BEST NZEB in Rome (
Figure 11A).
For each series of simulations, the EBI improvement of BEST with respect to RG (for STD and NZEB models in the three cities) was calculated for the two sides, N/S and E/W, as shown in
Table 8.
The difference between the E/W and N/S percentages evidences the saving obtained by one orientation or the other. It can be observed that for almost all locations this difference is positive, indicating that an E/W orientation is more favorable. This is because north exposure is less effective in PV production than all the other orientations.


