Abstract
Researchers have long puzzled over suicidal behavior. In this paper, we posit that when people are unable to attract mates given unfavorable sex ratios, suicide rates increase. Sex ratio, the proportion of males in a population, is linked to a variety of behaviors, including marriage stability, violence, depression, and infidelity. We test whether suicide rates are associated with county-level sex ratios utilizing data from 1999 to 2018, controlling for a variety of factors known to be associated with suicide risk. We find that sex ratio is associated with suicide rates, where a greater proportion of males in a county (age 35–74) is associated with an increased rate of suicide for these males. Mediation analyses show that these effects are mediated by male marriage rates. Counter to predictions, male-biased sex ratios also tend to be associated with increased female suicide rates for women aged 35 to 74, and this effect is mediated by the unmarried sex ratio (i.e., when there are more unmarried men compared to unmarried women in a county, there is increased female suicide). Overall, these results suggest that male-biased sex ratios are associated with suicide rates for both men and women, but the mediators vary.
1. Introduction
Over the past twenty years, the total suicide rate in the United States (US) has increased 35% (Hedegaard et al. 2020), resulting in approximately 48,000 deaths in 2018 (Meszaros 2020). While the US suicide rate declined in 2019 and 2020, it rebounded in 2021 (Garnett and Curtin 2023). Elucidating the factors that influence suicidal behaviors is critically important. Despite extensive research, predicting who will commit suicide remains difficult (Franklin et al. 2017). A variety of individual-level predictors are associated with suicidal behavior, some of which include the following: prior suicide attempts (Chen et al. 2013); depression (American Foundation for Suicide Prevention 2021); marital dissolution or relationship problems (Cutright et al. 2007; O’Neill et al. 2018; Kposowa 2000); ethnic background (Alcántara and Gone 2007; Wong et al. 2014; Utsey et al. 2007; Vanderwerker et al. 2007); gender (Denney et al. 2009; Cutright et al. 2007); sexual assault (Dworkin et al. 2017); and unemployment or financial stress (Stack 2000; O’Connor and Nock 2014; Kposowa 2001). Early suicide research focused on population-level influences included social disintegration and social isolation (Durkheim 1897). Today, we recognize many population-level factors, including population density (Singh and Siahpush 2002; Hirsch 2006), relative cohort size (Stack 2000), and even altitude (Brenner et al. 2011). The number of suicide attempts (non-fatal suicidal behavior) far outweighs the number of fatal suicides, which may partially reflect the access to and use of lethal means (Thomas and Gunnell 2010). While men have almost four times the rate of suicide compared to women in the US, women actually have higher rates of suicidal attempts, and this difference may be partially explained by their choice of means (Spicer and Miller 2000).
Understanding the factors that affect suicidal behaviors is an important area of research that has led to insights from a variety of approaches, including ecological studies (McCleary et al. 2002; Dixon et al. 2007; Brenner et al. 2011; Luo et al. 2011), individual-level demographic correlates (Spicer and Miller 2000; Denney et al. 2009), clinical risk assessments (Carter et al. 2017; Tello et al. 2020; Nock et al. 2010), and evolutionary cross-cultural perspectives (Syme et al. 2016; Syme and Hagen 2019; DeCatanzaro 1980; Soper 2018; Stack 2000; Ziker and Snopkowski 2020). Unfortunately, even with extensive research across a variety of fields, suicide rates continue to have an upward trend in the United States across all age groups under 75 (Hedegaard et al. 2020).
Evolutionary arguments of suicide focus on ultimate-level explanations, particularly how a behavior that eliminates future reproductive success can evolve. These hypotheses include the inclusive fitness model, which argues that suicide may occur if it increases the inclusive fitness of relatives (DeCatanzaro 1980). For example, if an individual requires extensive help from relatives, but has a low likelihood of reproducing oneself or being able to provide help to others (also known as the burdensomeness model), suicide may be an adaptive choice. A few hypotheses focus on suicidal behavior as a costly signal; the bargaining model argues that suicidal behavior is a costly signal of need (Syme et al. 2016), while the costly apology model suggests that some suicidal behavior is an honest signal of apology (Syme and Hagen 2019). Both of these models suggest that fatal suicide is an unfortunate byproduct of the honest signal, and may help explain the large discrepancy in numbers of suicidal attempts compared to fatal suicide. Other hypotheses focus on suicide as maladaptive, a potential mismatch between prior and current environments (DeCatanzaro 1980), byproducts of our complex brains (Soper 2018), or a consequence of adaptive developmental trajectories (Ziker and Snopkowski 2020). Ethical concerns of working with humans and the challenge of inferring past evolutionary pressures makes it difficult to fully test these hypotheses.
In many cases, adversity may adaptively cause low mood or depression (Darwin 1887; Nesse 2000). Evidence shows that the level of hardship is proportional to depressive symptoms (Kendler et al. 1998) and the majority resolve over time (Ten Have et al. 2017). Among the Tsimane, a forager-horticulturalist group living in the lowlands of Bolivia, functional disability, where a person is unable to provide resources to others, is associated with increased rates of depression (Stieglitz et al. 2015). Social conflict, including marital, family, and work conflicts, along with physical and sexual assault, are also associated with depression and suicidality (Syme and Hagen 2020). The inability to achieve social goals, such as experiencing the breakdown of a marital relationship or the inability to find a partner, poor relationships with kin resulting in reduced support (both given and received), and the inability to provide investment for children and other relatives may induce feelings of low mood or depression as a proximate means to promote reallocation of effort and resources (Nesse 2000). In some cases, this low mood (also described as negative valence) may propel people to pursue alternative behaviors that lead to better outcomes (Nesse 2000). Other individuals, who may be unable to change these outcomes (for instance, due to health challenges, or inability to relocate due to employment restrictions), may experience major depressive symptoms and suicidal behaviors. Brain pathology without any associated situational effects may also explain depression and suicidal behavior in some cases.
Population-level sex ratio, defined as the proportion of men in a population (Ancona et al. 2017), relates to a variety of social behaviors, such as marriage stability (Uggla and Mace 2017; Uggla and Andersson 2018) and health outcomes, including sexually transmitted disease rates (Pouget 2017) and depression (Zhou and Hesketh 2017). Given the link among marital status, depression, and suicide risk, it is a logical next step to hypothesize that sex ratio may help us understand the geographical patterning of suicide rates. Theoretically, sex ratio may influence behavior because of supply and demand in heterosexual mating markets (Guttentag and Secord 1983; Pedersen 1991; Schacht and Smith 2017). Individuals of the sex that is less frequent have more bargaining power in selecting partners of the other sex (in heterosexual mating markets). In contrast, individuals of the sex that is more frequent will have greater competition among members of their own sex in attracting and retaining a mate. We note that biological sex is not equivalent to gender, but theoretical arguments about sex ratio (or gender ratio) and data sources reporting information on people’s sex/gender typically do not meaningfully distinguish sex and gender, a problem that can be rectified in the future with better data collection around gender identity.
Empirical results have shown that under conditions of male-biased sex ratios (more males than females), divorce rates are lower, marriage rates are higher, and men are less open to engaging in uncommitted sex (Uggla and Mace 2017; Pouget et al. 2010; Schacht and Borgerhoff Mulder 2015; Hurtado and Hill 1992; Angrist 2002). These results are frequently interpreted as men being more willing to engage in long-term, stable pair bonds in male-biased populations for two reasons: first, it is preferred by females, and females have greater power to achieve their preference (Uggla and Mace 2017). Second, any male ending a relationship will find few potential mates given the limited number of females in the population. Other interpretations have also been posited, including that men utilize their structural power to control women, resulting in women marrying at younger ages and refraining from work outside the home (Guttentag and Secord 1983; O’Brien 1991). Suicide rates may be associated with sex ratio as the number of locally available potential partners may influence one’s ability to achieve social goals, particularly the ability to marry, remain married, and remarry following divorce. Individuals may be more likely to feel lonely or depressed if they are not married, but also if their prospects for marriage or partnership are low. Marriage has been documented to improve mental health (Simon 2002; Horwitz et al. 1996) and reduce suicide risk (Kposowa 2000, 2001). Depression and suicidal tendencies have also been linked to male-biased sex ratios in China through their effect on men being unable to marry (Zhou and Hesketh 2017; Zhou et al. 2013). If there is an overabundance of men unable to find monogamous female partners in heterosexual mating markets due to male-biased sex ratios, men may experience an increased suicide risk.
Sex ratio may associate with suicide risk differently for men and women given sex differences in the relationship between family dynamics and depression. For instance, marriage reduces the rates of depression more for men than women (Horwitz et al. 1996). Unmarried men (including never married, divorced, and widowed) are less likely to have contact with friends, children, or relatives than unmarried women, resulting in greater loneliness (Rokach et al. 2007; Pinquart 2003). Finally, being a father has less of a protective effect against suicide than being a mother (Stack 2021). These factors contribute to the expectation that suicide rates are higher for men unable to partner than women in a similar circumstance.
Prior research has shown that male suicide is higher in male-biased areas of Japan (Kuroki 2013). Another study utilizing data from 1980 found that a relatively higher proportion of men to women in a US state was associated with a higher male suicide rate, but no association with female suicide rates was observed (Lester 1999). Contrary to these studies, a cross-national survey of 142 countries found that male-biased sex ratios were associated with reduced suicide (Moore et al. 2020). Unfortunately, people are unlikely to perceive sex ratio at the level of the state or nation (Brandner et al. 2020). Examining the role of sex ratio in US counties provides a better opportunity to examine how sex ratio may relate to suicide rates at a more local level.
The factors influencing suicide risk change across the life span. For instance, elderly people may be more likely to have a terminal illness or severe medical condition that may contribute to suicide risk (perhaps because of their perceived burdensomeness), while unemployment is simultaneously less likely to play a role for those who are retired. In contrast, young adults are more likely to experience a relationship difficulty, such as an argument or break up, prior to suicide (O’Neill et al. 2018). A study from a male-biased region of China found that unmarried men aged 30–40 experienced higher rates of depression and suicidal ideation than married men aged 30–40 or younger men aged 20–30 regardless of marital status (Zhou and Hesketh 2017). This suggests that being ‘never married’ may associate with suicide risks at older ages—at an age when one’s peers have already married. We predict that the association between sex ratio and county-level suicide rate is more likely to exist at older ages.
Examining the mediators of sex ratio on county-level suicide rates will provide a better understanding of potential mechanisms underpinning these relationships (if any). For this research, we examine two potential mediators, both indicative of being partnered and ability to partner. The first is the proportion of men [women] who are married in a given age range. Prior research has shown that marriage is protective against suicide; therefore, the proportion of people who are married in a community may be associated with lower suicide rates. At a population level though, many counties have low marriage rates (e.g., counties with large university populations), which has no effect on suicide rates. Further, approximately 40% of births in the US between 2007 and 2018 were to unmarried women (Martin et al. 2019), suggesting that ‘marriage’ may not be the best measure of partnership behavior in the US today. Theoretically, it is not just the proportion of people who are married that we think should be considered, but whether there are people available to partner with. Based on this hypothesis, we also examine the operational sex ratio, measured here as the number of unmarried men divided by the total number of unmarried people (in each age range). Unmarried people include those who have never married and those who are separated, divorced, or widowed. Operational sex ratio is typically defined as the ratio of males to females that are in the mating pool at a given time and place. This does not perfectly align with our measure here since we cannot be sure whether unmarried individuals have a partner but should serve as a proxy. We expect that when there is a higher number of unmarried men compared to unmarried women, this is indicative of males having fewer available partners.
In this research, we examine the relationship between sex ratio and suicide rates in US counties for men and women separately in three age groups and utilize mediation analyses to examine possible mediators of any documented relationships. Our hypotheses are as follows:
Hypothesis 1.
The proportion of men in a county will positively correlate with male suicide rate, particularly for older age groups.
Hypothesis 2.
The proportion of men in a county will negatively correlate with female suicide rates, although the effect will be dampened compared to men.
We have no clear hypotheses related to the mediators, instead using these as exploratory analyses.
2. Materials and Methods
To examine the relationship between sex ratio and suicide rates, we utilize data from the Center for Disease Control’s (CDC) Underlying Cause of Death database (Centers for Disease Control and Prevention 2020), which includes data on suicide rates for each county in the United States and the number of men and women living in each county (for particular age groups) from 1999 to 2018. The suicide rate for each county is calculated across the twenty-year period to minimize missing data (more detail below in Missing Data). We excluded ten counties whose boundaries changed during the study (four of which were eliminated and six of which were added), resulting in 3137 counties. Data from individuals aged 15–74 in each county were included, categorized as follows: 15–34, 35–54, and 55–74. Individuals over age 74 were excluded due to terminal illness as a cause of suicide, which would be more frequent among elderly individuals. The number of individuals who die of intentional self-harm (ICD-10 code: X60–X84) were included in our definition of suicide for each county.
The male suicide rate of a county is defined as the number of male suicidal deaths per 100,000 male population. Similarly, we calculate a female suicide rate for each county. When the number of suicide deaths is less than ten for a county over the timespan, the number of deaths is suppressed. Across 1999–2018, for the entire age range (ages 15–74), this includes 281 counties for men (~9%) and 1263 counties for women (~40%). We discuss our methods for dealing with missing values below (see Missing Data).
To calculate sex ratio, we divide the number of males by the number of total people living in a county for a particular age-range. Population counts (by sex–age category) are reported in the CDC’s Underlying Cause of Death database (Centers for Disease Control and Prevention 2020). Sex ratio values include imprisoned persons, which can dramatically impact a county’s sex ratio, particularly in rural counties with large prisons. To reduce this bias, we exclude counties with more than 1% of their population imprisoned (approximately 21% of counties). As a sensitivity analysis, we also estimate the number of males and females living in each county (for the particular age span) who were not living in a correctional facility (United States Census Bureau 2010a; United States Justice Department 2018). For details on how this was calculated, see Supplementary Materials Correctional Facilities.
2.1. Missing Data
Counties with fewer than ten suicides over the 20-year time period (for a given sex-age category) are missing. These missing data are particularly problematic because there is a higher likelihood of missing values for counties with few people and low suicide rates, while those counties with few people and high suicide rates are less likely to be missing, overestimating the effect of rurality on suicide. Given the large amount of missing data—particularly for female suicide rates—and the potential bias associated with the pattern of missingness, we utilize two methods to deal with missing values. First, we exclude counties with small populations. The cut-off varies, but we exclude counties below a sex-specific population cut-off that results in five or fewer missing values. Second, we utilize a multivariate imputation by chained equations (MICE) method to impute the suicide rate based on predictive mean matching using the other variables in the model (including sex ratio and control variables listed below) in a linear mixed-effects model (lmer function in R) to allow for random intercepts by state. We create five imputed datasets. Since we know that there were fewer than ten suicides in counties with missing data, we use the imputed rate to determine the predicted number of suicides. For any county whose predicted number of suicides was higher than nine, we replace the imputation with nine and re-calculate the imputed suicide rate. Then, we pool the estimates and calculate the standard error based on Rubin’s rules (Rubin 1987).
2.2. Confounding Variables
There are a variety of other demographic factors known to influence suicide rates that we control for throughout our analyses, including unemployment rate (Yang and Lester 1995), veteran status (Kaplan et al. 2012; Kuehn 2009), household income (Kposowa 2001), population density (Kegler et al. 2017; Singh and Siahpush 2002), and economic decline (Luo et al. 2011), measured as percent change in population, and ethnic background, where higher suicide rates have been observed for those identifying as white or Native American (Ivey-Stephenson et al. 2017; Utsey et al. 2007). Suicide is also geographically patterned, where western states have higher suicide rates than others (Baller and Richardson 2002).
To understand the relationship between sex ratio and suicide, one needs to control for potential confounding variables, and examine suicide rates separately for males and females. When possible, we identify age-specific values for control variables. For instance, instead of using the unemployment rate for the entire county, we utilize the unemployment rate for the age categories closest to the age-specific suicide rate we are examining. For age-specific unemployment rates, we utilize data from the 2010 and 2018 five-year American Community Survey (ACS) with data on age-specific unemployment (United States Census Bureau 2010b, 2018a). Data on age-specific percentage of veterans is only available beginning with the 2015 American Community Survey (which covered the previous 5 years (United States Census Bureau 2015). To calculate age-specific median household income, we utilize the median income by age of householder in the past twelve months (in inflation-adjusted dollars for that year) from the American Community Survey five-year estimates from 2010 and 2018 (United States Census Bureau 2010c, 2018b). To control for urban-rural, we include population density of the county, averaged across 2000 and 2010, defined as: total population (United States Census Bureau 2020) divided by total land area (United States Census Bureau 2011). The ethnic background of the county is measured as the percentage of people who identify as white (alone or in combination with one or more other races) in each county and the percentage of people who identify as American Indian or Alaska Native (alone or in combination with one or more other races) averaged across the 2000 (United States Census Bureau 2000) and 2010 (United States Census Bureau 2010d) censuses. Additional details can be found in Supplementary Materials Confounding Variables.
2.3. Data Analysis
We conduct linear mixed-effects models with random intercepts for each state (lmer function in R) to predict (1) suicide rates; (2) suicide rates for more populated counties at a population cut-off that minimizes the number of missing values; and (3) suicide rates with imputed values. We use a model selection approach to compare the fit of a mixed-effects model with random intercepts for US state with a multiple regression model that does not account for geographical clustering. A model is selected based on the Akaike information criterion (AIC), which calculates the fit of the model with a penalty for each additional parameter (Burnham and Anderson 2002). A comparison of AIC scores shows that mixed-effects models with random intercepts for US state are always a significant improvement over multiple regression models that do not account for geographical clustering (see Supplementary Materials Table S1). Our independent variable is age-specific sex ratio. Most of our variables are skewed, including suicide rate, unemployment rate, percent of veterans, median household income, population density, percent identifying as American Indian or Alaska Native, and percent identifying as white. All positively skewed variables were log transformed (base 10). The percent of people who identify as white is negatively skewed; therefore, we took the log transformation of 101 minus the value. This leads to a variable that indicates the percentage of people who identify as ‘not white’. The data were analyzed in R version 3.6.1.
2.4. Mediation Analyses
To better understand how sex ratio may influence suicide rates, we examine two potential mediators for our analyses of suicide rates. The first is the proportion of men who are married, calculated as number of married men divided by total number of men in each age range. The proportion of women who are married is also calculated. The second mediator is operational sex ratio, calculated as the number of unmarried males (never married, separated, divorced, widowed) divided by the total number of unmarried people (for each age range). The proportion of men (women) who are married and the operational sex ratio are both measured using the average of the five-year American Community Survey data from 2018 and 2010 (United States Census Bureau 2010e, 2018c), which represents summaries for the five years prior to the survey.
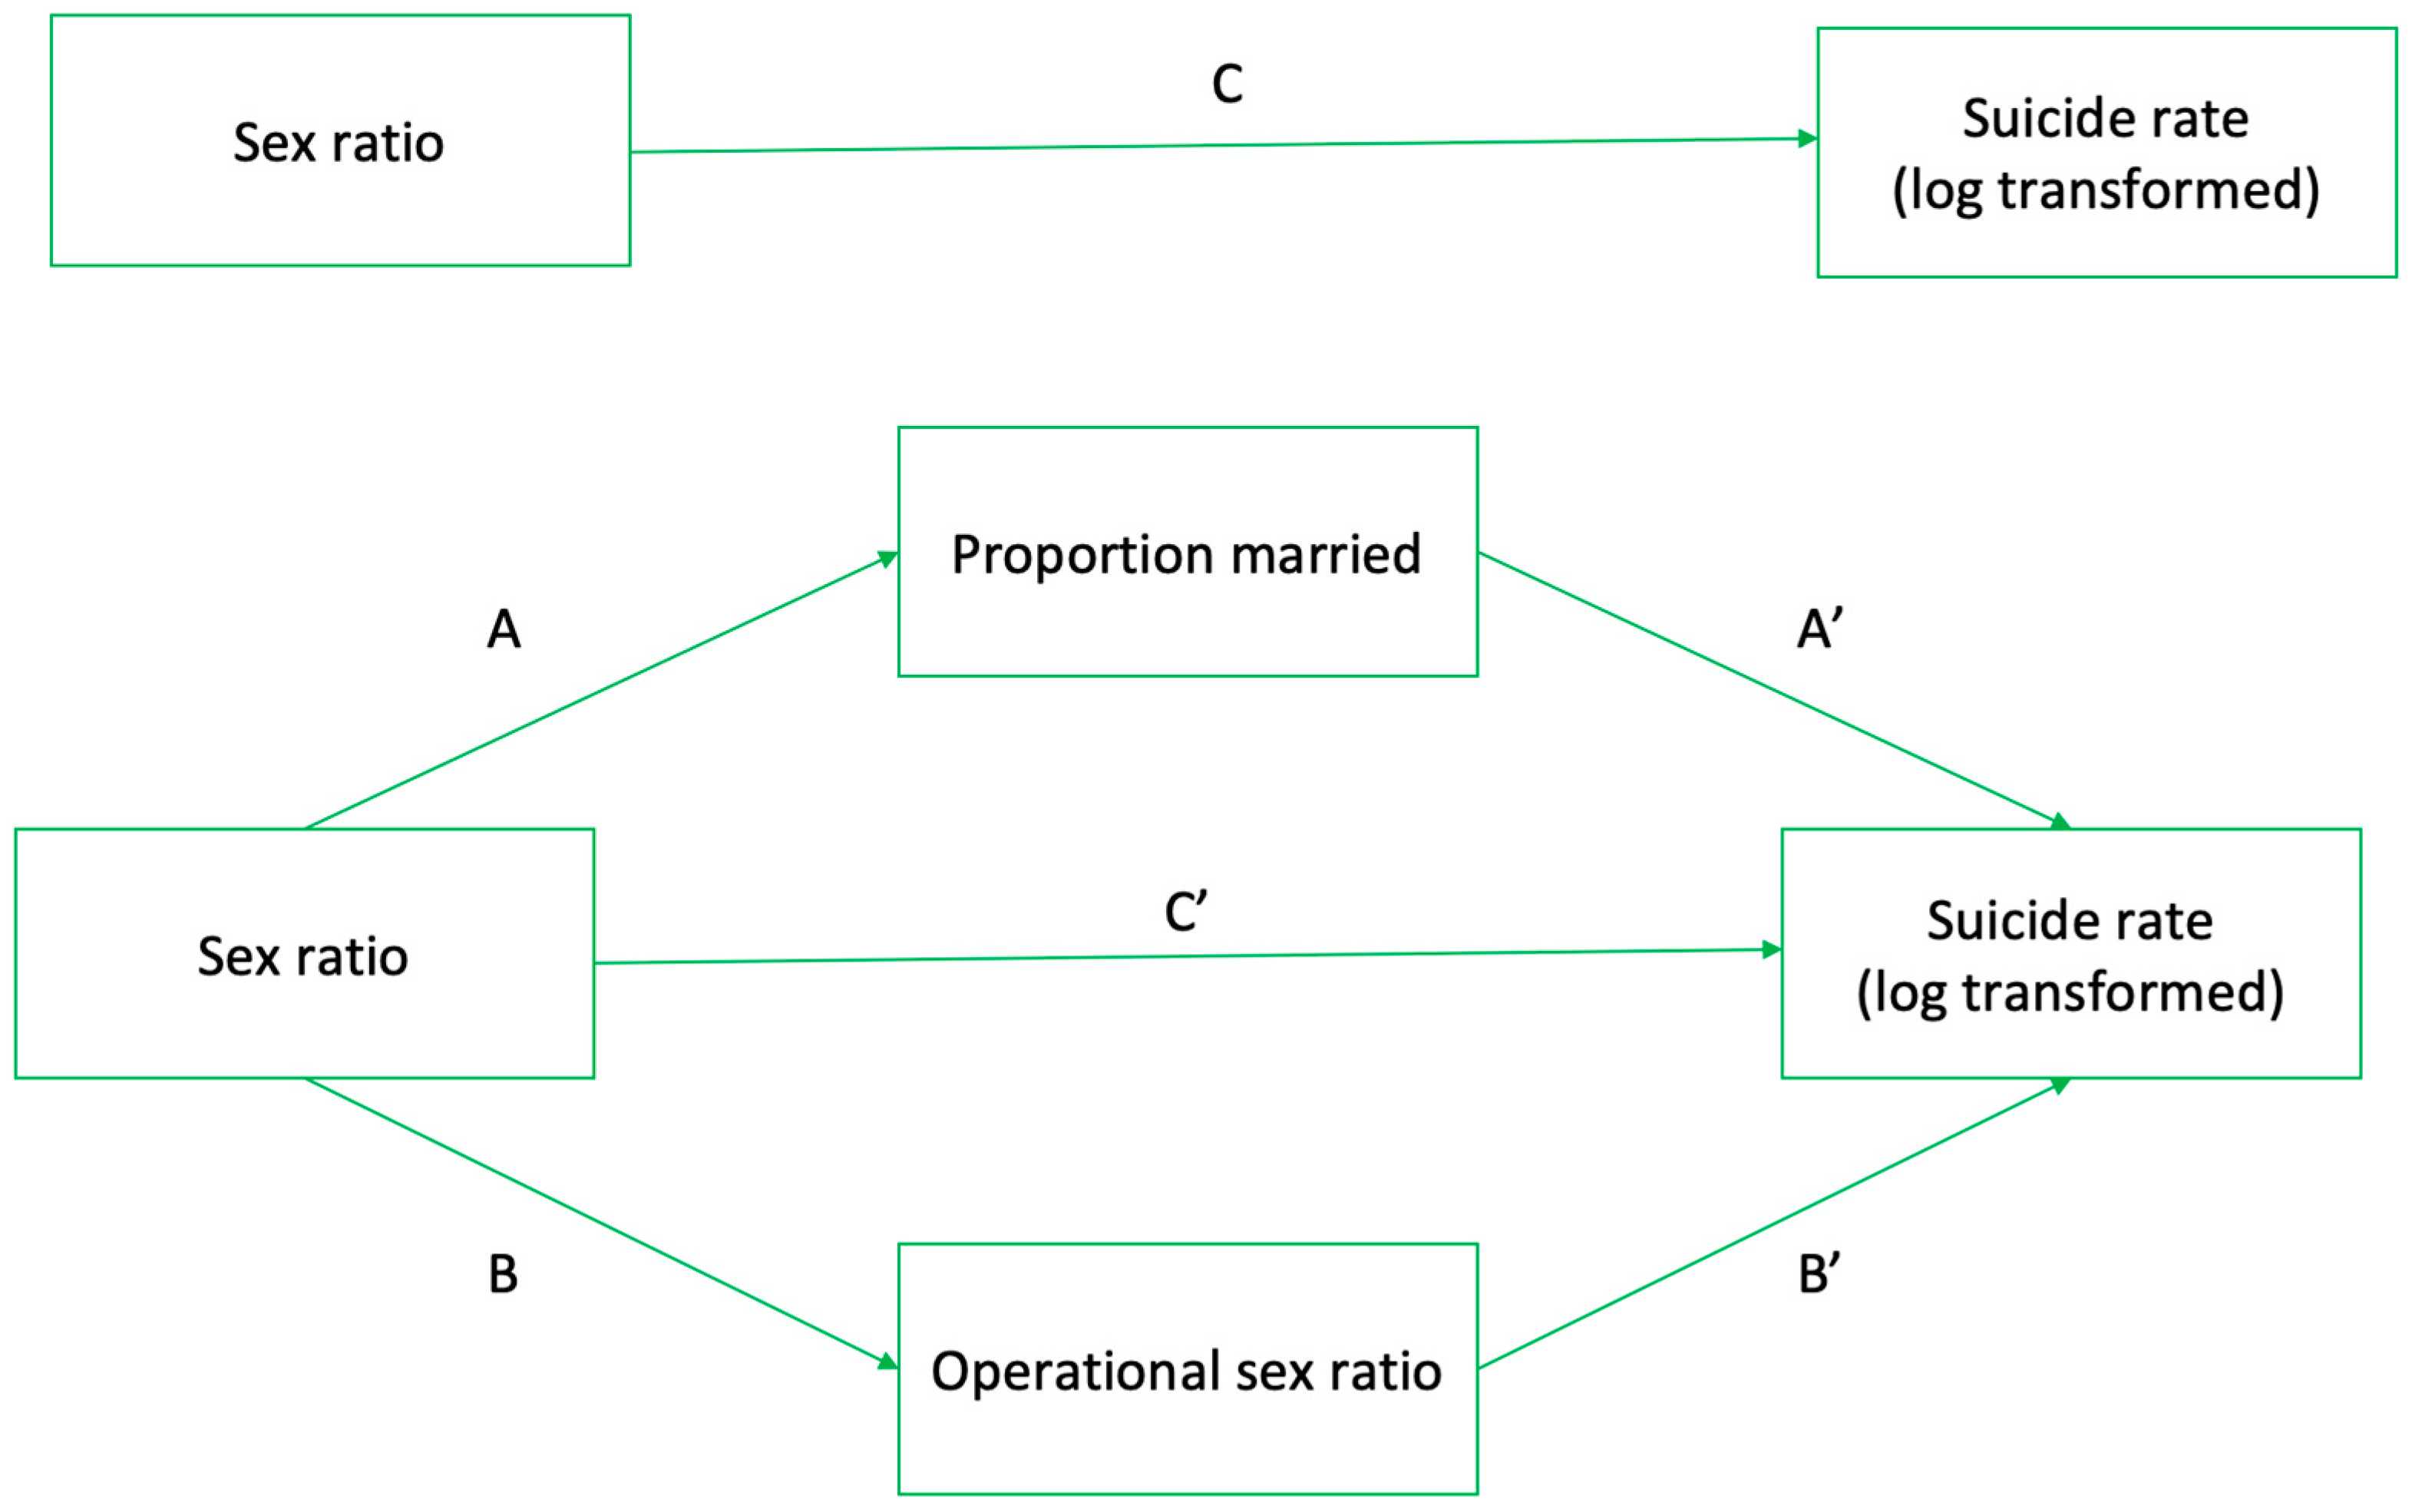
Our analyses utilize a parallel/multiple mediation model approach (Baron and Kenny 1986). Our models examine the pathway from sex ratio to suicide rates through our two mediating variables, proportion married and operational sex ratio (OSR), using four multilevel regression equations: (1) a model predicting suicide rates without mediators, same model as described in previous section (see Figure 1, line C); (2 and 3) models of sex ratio predicting the mediators (see Figure 1, lines A and B); and (4) a full model predicting suicide rates with mediators and sex ratio (see Figure 1, lines A’, B’, and C’). All models include a random intercept for US state and control variables listed above. The analyses were attempted utilizing generalized structural equation modeling; however, convergence could not be achieved with these models. We therefore utilize separate linear mixed-effects models with random intercepts.
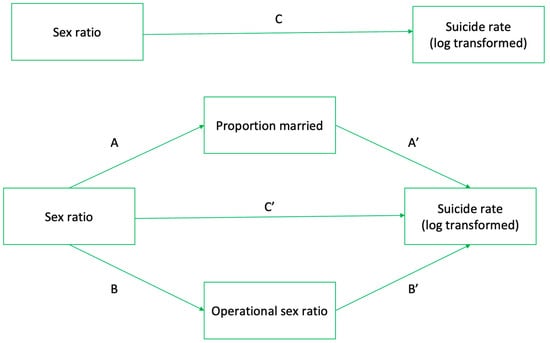
Figure 1.
Hypothesized mediation models. Analyses include control variables at each step and a random intercept for state.
To test the mediation effects, we utilize the method described by Baron and Kenny (1986). A hypothesized mediator would completely mediate the relationship between an independent and dependent variable if the following four conditions are met: (1) the relationship between the independent variable and mediator is significant (lines A and B in Figure 1); (2) the relationship between the mediator and the dependent variable is significant (lines A’ and B’ in Figure 1); (3) the relationship excluding the mediators is significant between the independent and dependent variable (line C in Figure 1); and (4) the relationship between the independent and dependent variable is not significant when the mediators are included (line C’ in Figure 1). If line C’ remains significant after including the mediators, then the relationship would be considered partially mediated.
3. Results
Table 1 presents the descriptive statistics of variables included in our analyses (density plots of dependent and independent variables can be found in Supplementary Materials Figures S1 and S2). Male suicide rates are substantially higher than female suicide rates. For males across all age ranges (15–34, 35–54, 55–74), the rate is approximately 30 per 100,000 males, while it is only 8 per 100,000 for females. We also see the predicted change across the age category, where the rate is slightly lower for younger people (age 15–34) and highest among people aged 35–54. The average sex ratio across counties is 0.5 (for people aged 15–74). If we examine the variation across age group, we see that younger age groups are more male-biased (0.51 for ages 15–34), but become more female-biased at older ages (0.49 for ages 55–74). This is to be expected given the higher male mortality throughout adulthood.

Table 1.
Descriptive statistics for cross-sectional and mediation analyses.
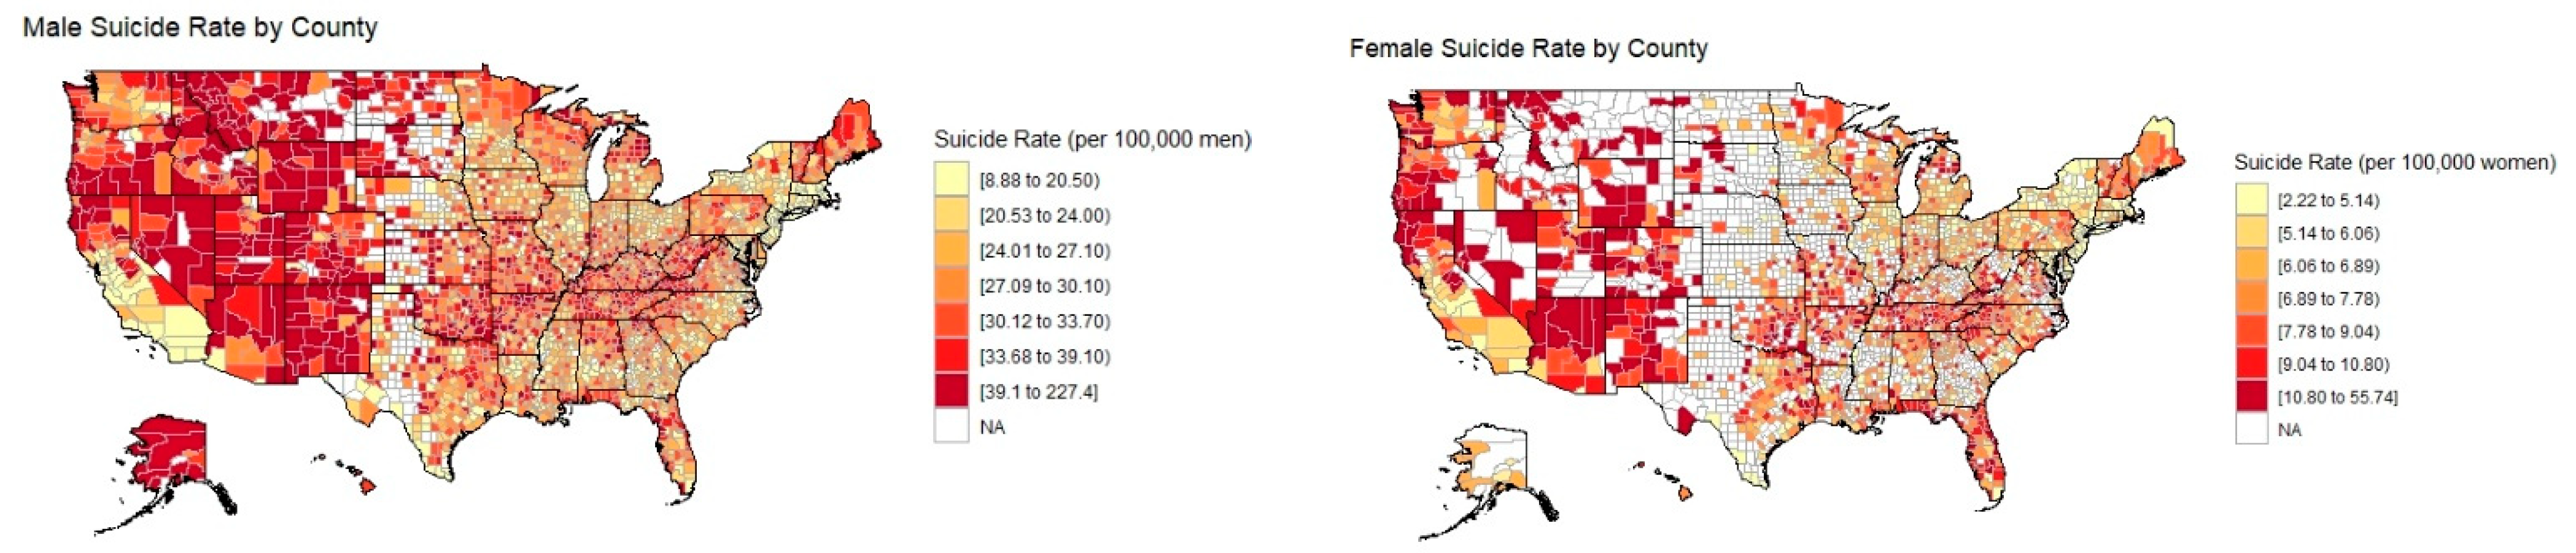
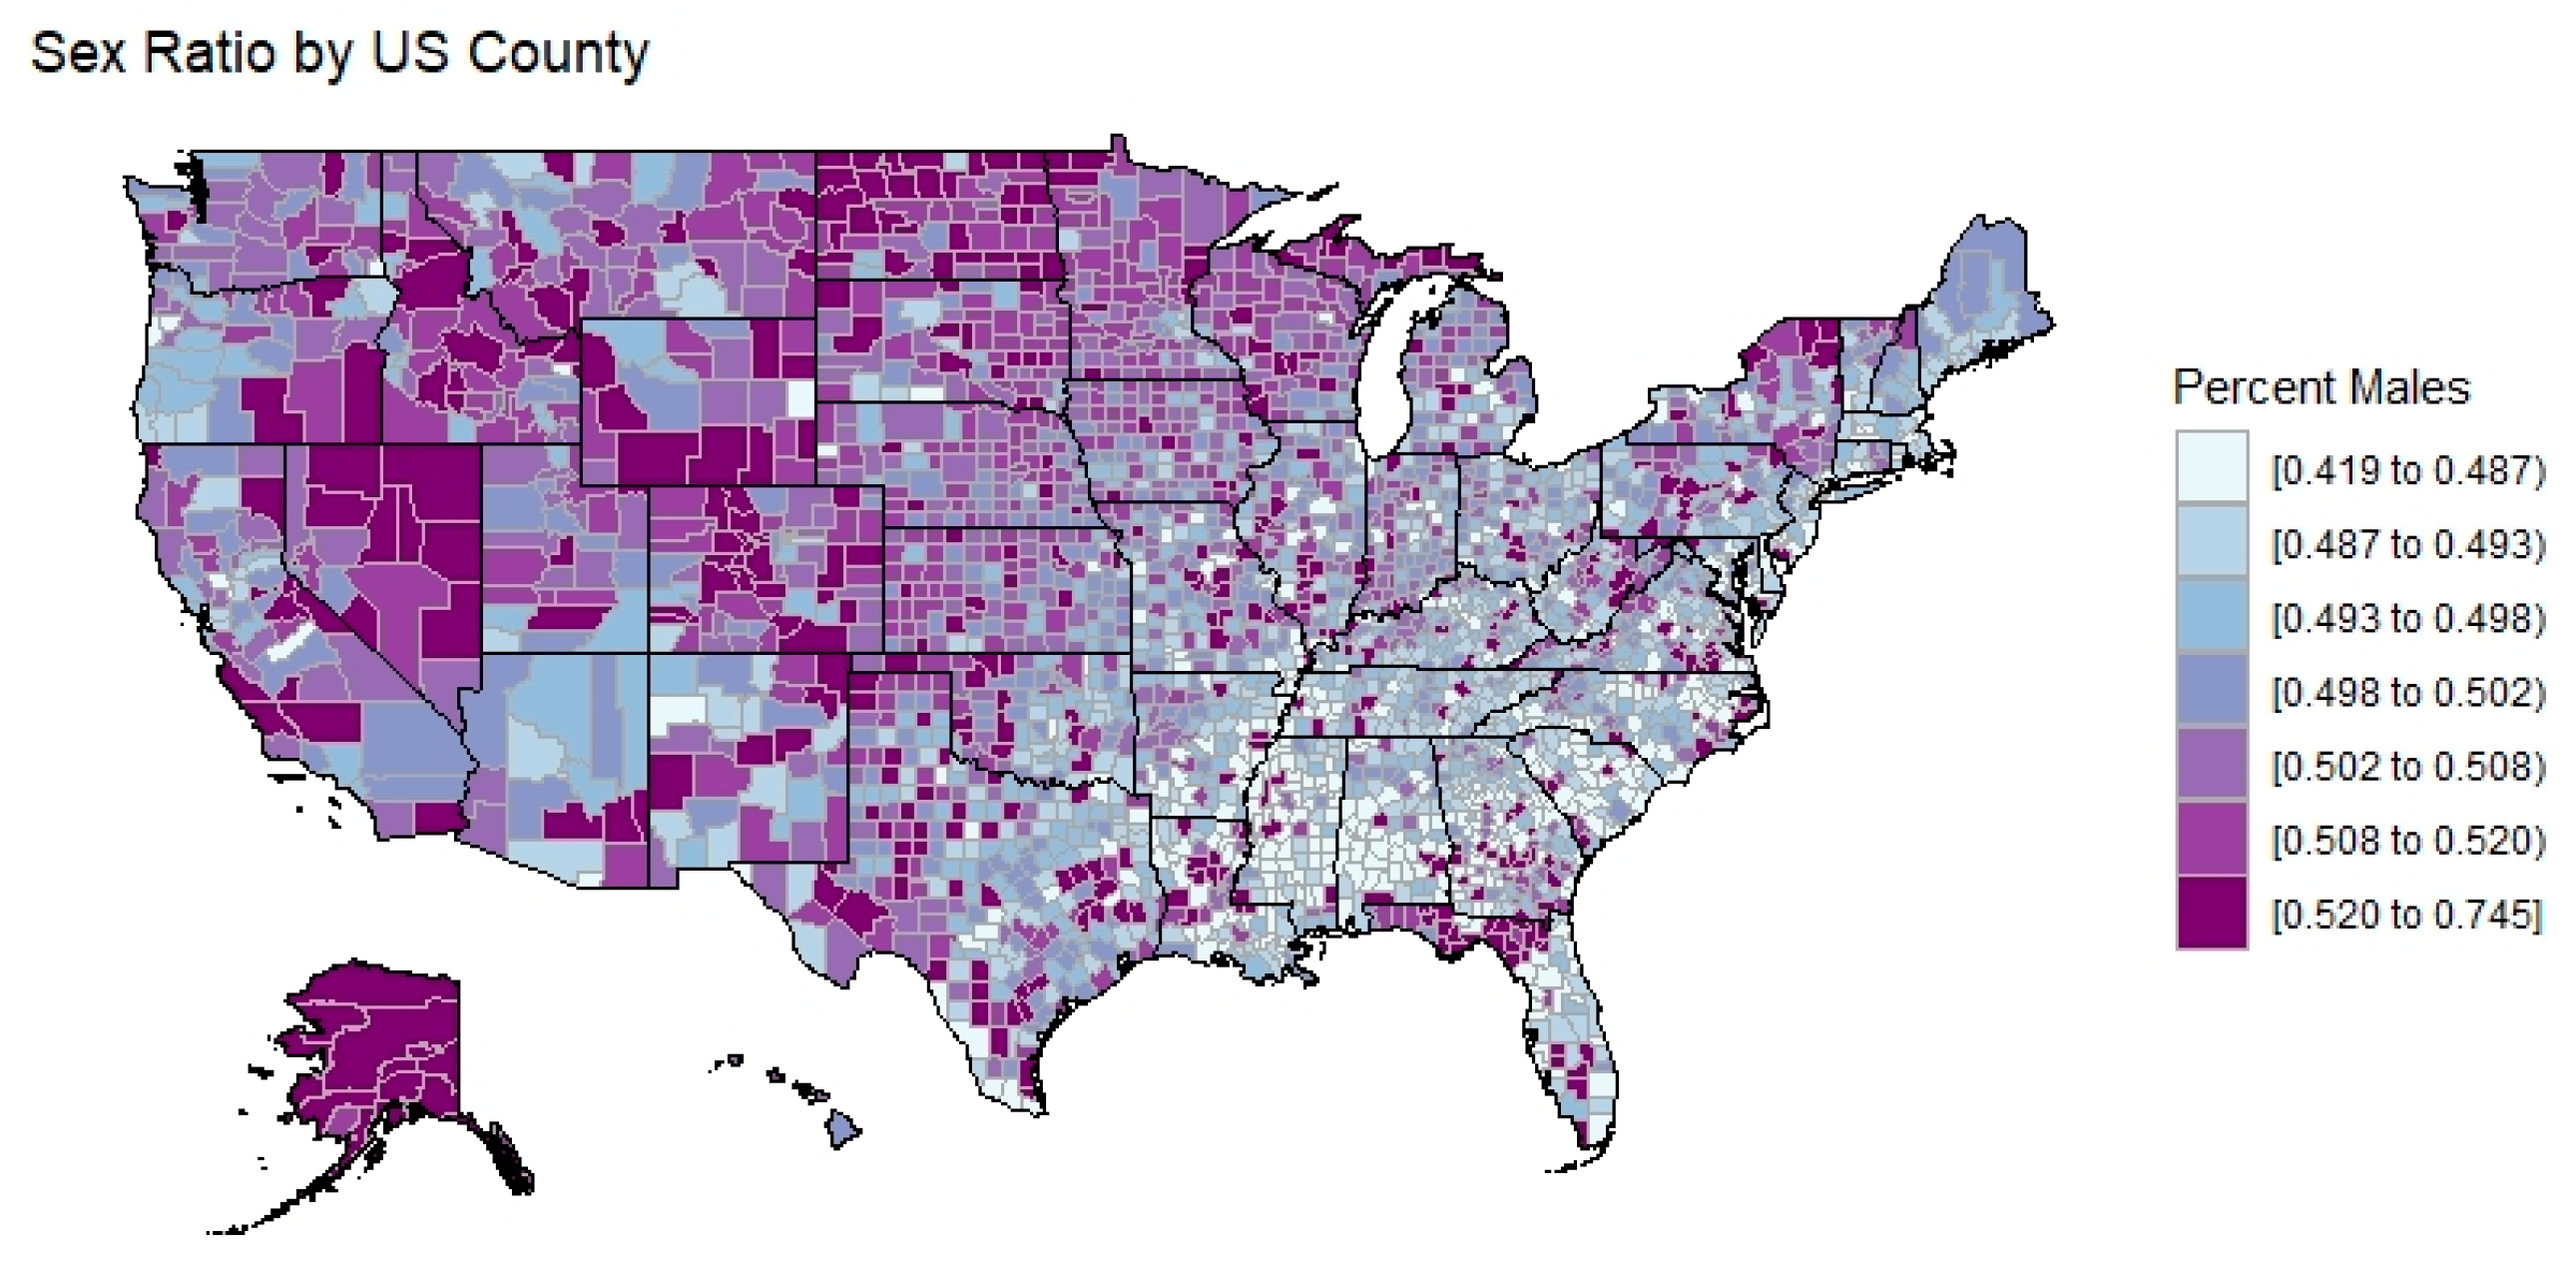
Figure 2 presents maps of suicide rates in US counties (ages 15–74). The map on the left represents male suicide rates, while the map on the right presents female suicide rates. In both maps, the counties indicated in white have missing data (less than ten suicides over twenty years). These figures show the geographical patterning of suicide rates, which are particularly high in western states. Figure 3 represents the sex ratio (defined as the proportion of males in the county, excluding imprisoned individuals) in each US county. Comparing Figure 2 and Figure 3 visually reveals the bivariate correlation between suicide rates (for both males and females) and sex ratio, where male-biased counties have higher suicide rates (see Supplementary Materials Table S2 for a correlation matrix of all variables). However, counties with high suicide rates and male-biased sex ratios are systematically different in a variety of other ways as well, such as having lower population densities.
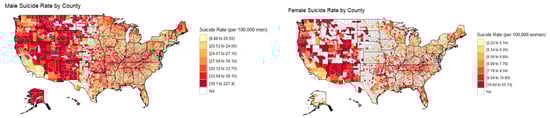
Figure 2.
Male (left) and female (right) suicide rate (ages 15–74) by US county. White blocks represent counties with missing data (fewer than ten suicides over a 20-year period).

Figure 3.
Sex ratio (ages 15–74) by US county. Sex ratio is defined as the proportion of men in the county (aged 15–74), excluding incarcerated individuals. Darker colors indicate a higher proportion of males, while lighter colors represent counties with more females.
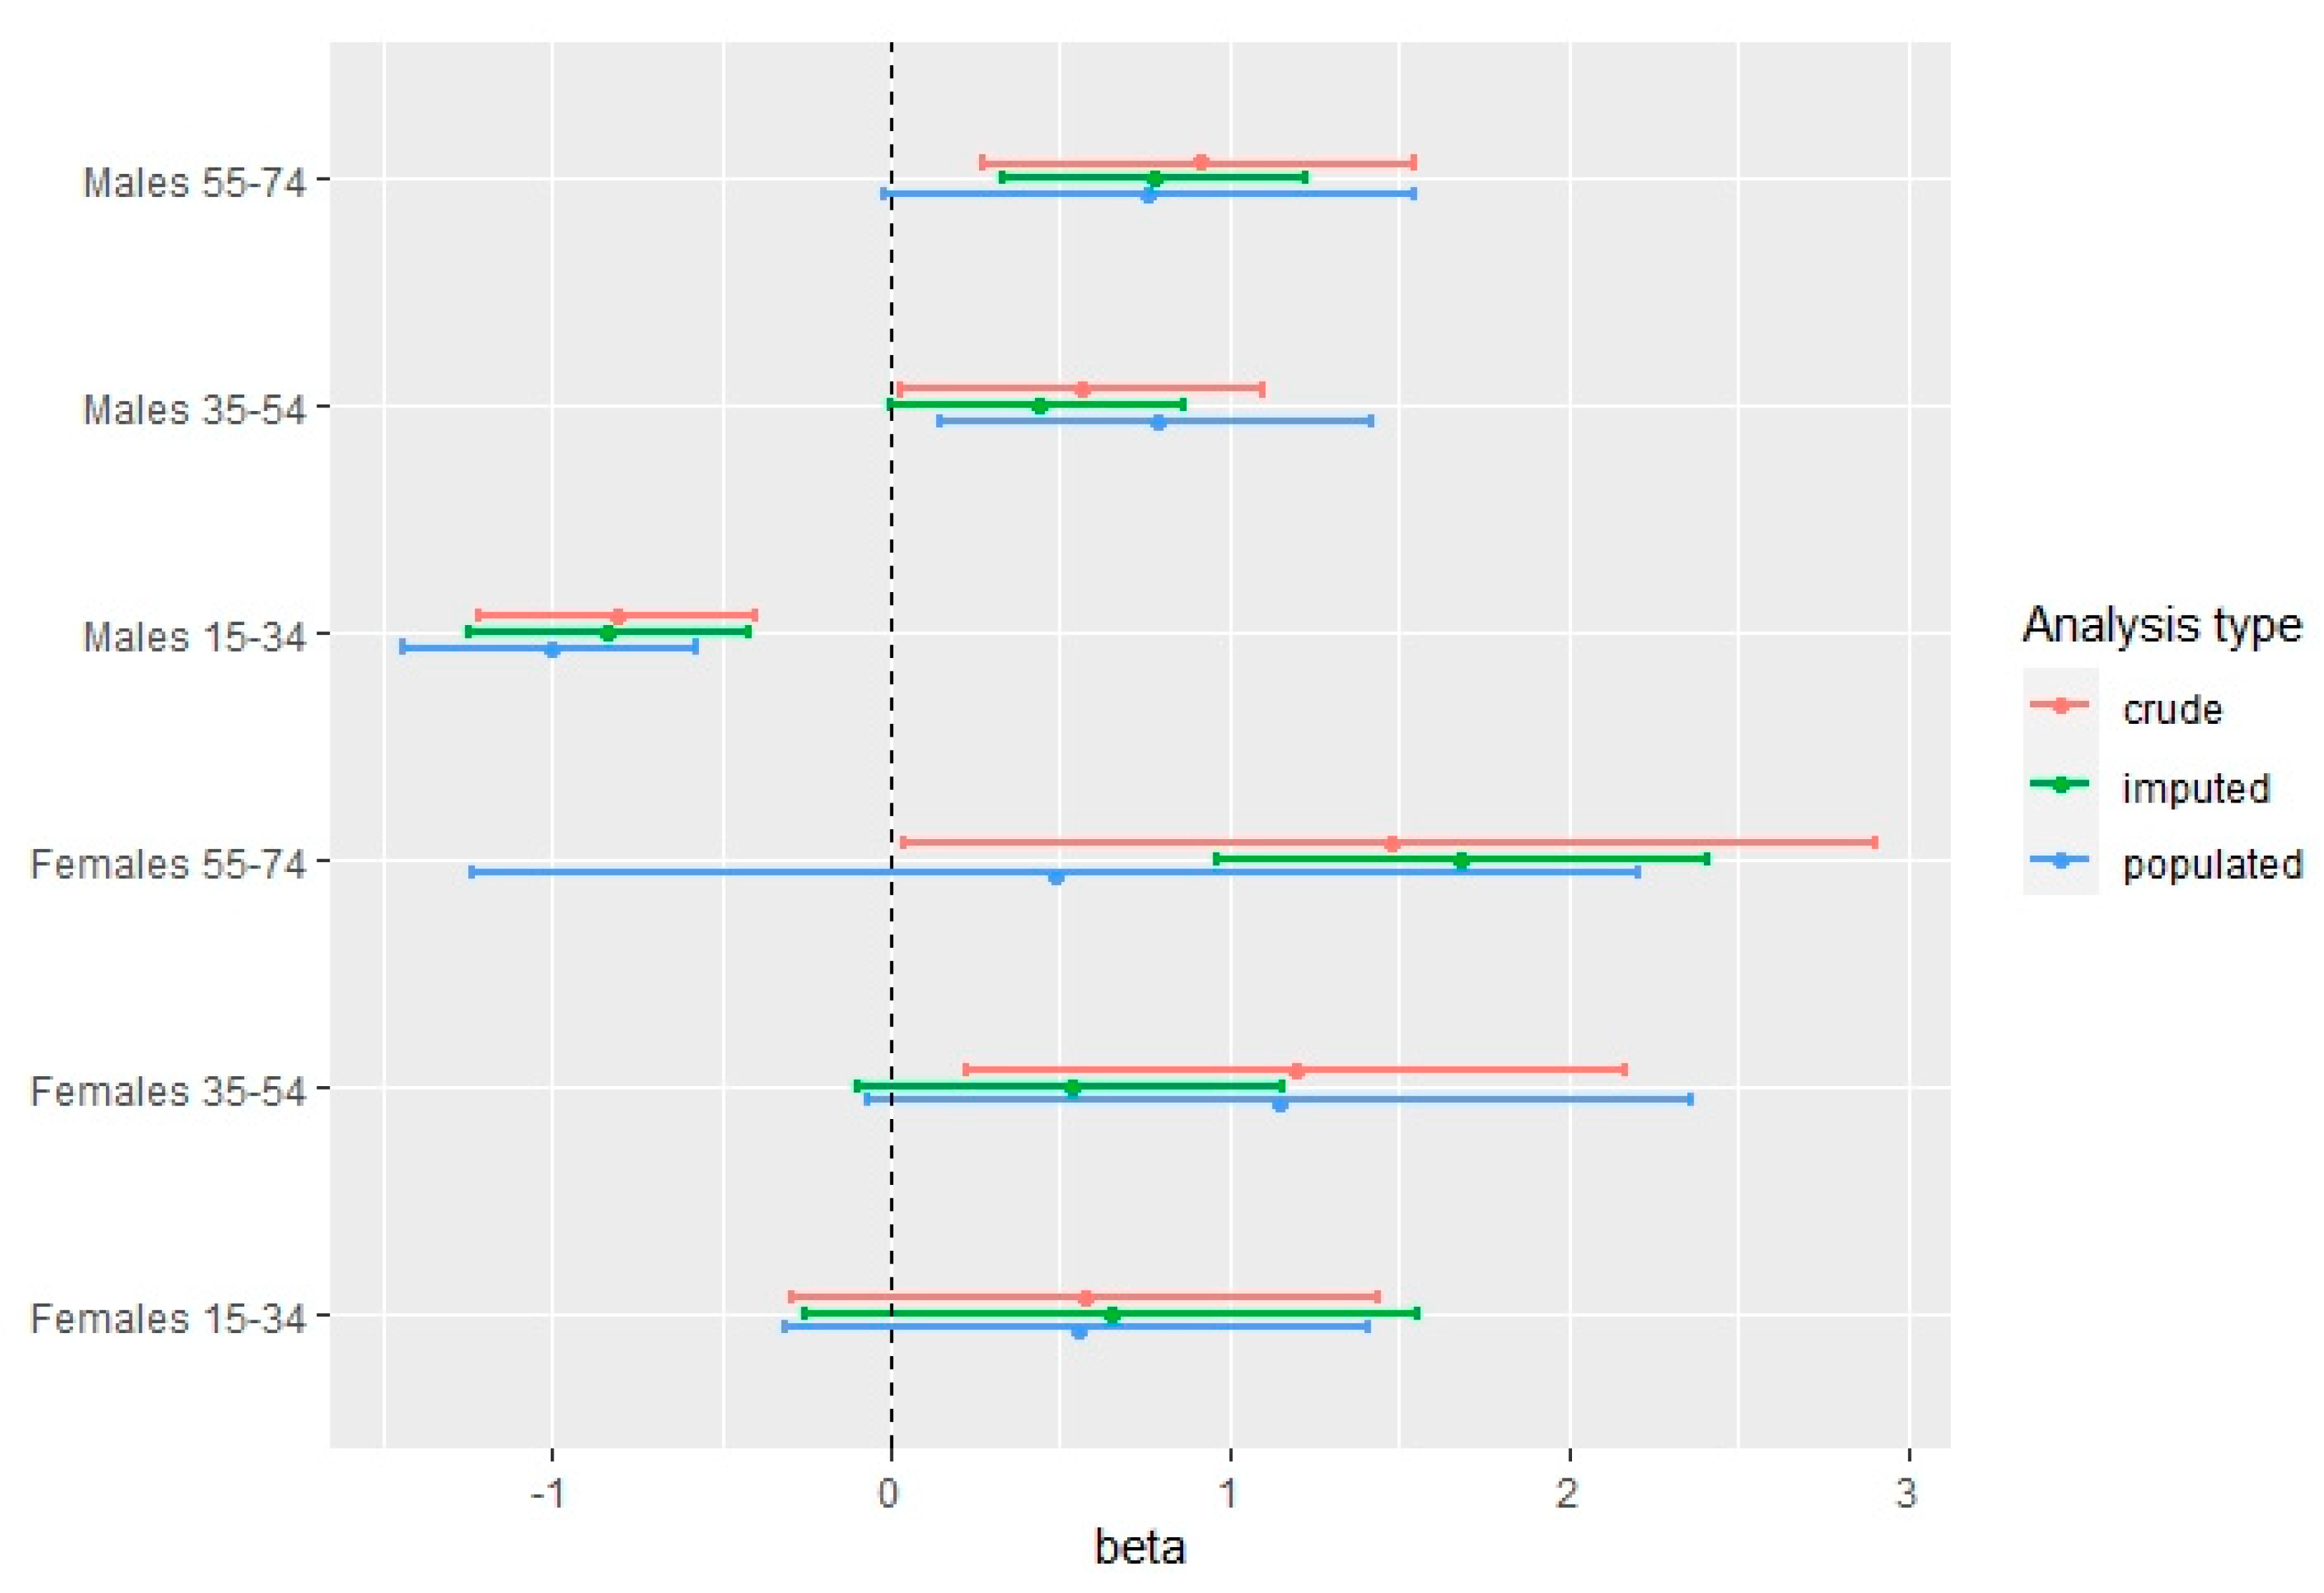
Figure 4 provides the fixed effect estimates of the linear mixed-effect models for male and female suicide rates in three age categories (15–34, 35–54, 55–74) for three models: a model predicting non-missing suicide rates (labeled: crude), a model which includes only those counties with a population cut-off that reduces the number of counties with missing suicide rates to five or less (labeled: populated), and finally, a model utilizing multiple imputation (labeled: imputed). The full results (including all covariates) can be found in Supplementary Materials Table S3 (a similar figure which uses sex ratio based on estimated non-imprisoned individuals can be found in the Supplementary Materials Figure S3). These results provide consistent findings for males 15–34, where we see a significant negative association between sex ratio and suicide rate, where more male-biased counties are associated with reduced male suicide rates after controlling for other covariates. In contrast, for males aged 35–54 and 55–74, the effect is positive (significant in most cases) where more male-biased counties are associated with higher male suicide rates after controlling for other covariates. The results for females show no significant effect at younger ages (15–34), but a positive association at older ages (35–54 and 55–74), where more male-biased counties are associated with a higher female suicide rate (significant in 50% of the analyses). The populated analyses find non-significant effects of sex ratio across all female age groups, which may be indicative of low power due to small sample sizes in these models (n = 430, n = 569, n = 395 moving from youngest to oldest age categories). A sensitivity analysis which included counties regardless of their imprisoned population, where we estimated the number of non-imprisoned individuals, shows broadly similar results (see Supplementary Materials Figure S3).
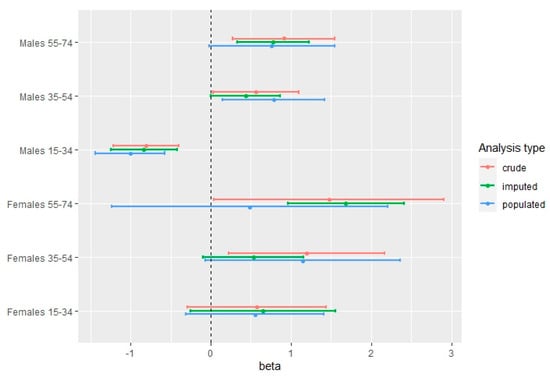
Figure 4.
Fixed effects (beta) values of sex ratio predicting suicide rate in US counties for different age-sex groups in a linear mixed-effects model with random intercepts for each state controlling for unemployment rate (log), percent veterans (log), percent of people identifying as American Indian or Alaskan Native (by itself, or with another ‘race’; log transformed), percent of people who do not identify as white (log), median household income (log), population density (log), and percent change in population from 2000 to 2010. Only counties with <1% of the population imprisoned are included. Analysis types include the following: ‘crude’ rates of suicide (red), ‘imputed’ rates of suicide (derived from a model with multiple imputation, green), and ‘populated’ representing a model that only includes more-heavily populated counties to reduce the bias of missingness (see Methods for more details). Error bars represent 95% confidence intervals. The vertical dotted line represents a beta = 0 (no effect).
Mediation Analyses
Table 2 presents the results of our mediation analyses (the coefficients for the control variables are excluded from the table but can be seen in Supplementary Materials Table S4). We have included all sex-age groups, except females aged 15–34 which did not have a significant effect of sex ratio on suicide rate (see Figure 4). The results show that for men aged 35–54 and 55–74, proportion married is a complete mediator, where counties with higher proportions of men have a smaller percentage of married men, and in turn, a higher suicide rate. Operational sex ratio is not a significant mediator for men in any age group.
Table 2.
Mediation analyses results.
For females in the 35–54 age range, the proportion of women married is significantly associated with both sex ratio and suicide rates. As the sex ratio increases (i.e., a higher proportion of men), the proportion of women who marry increases, and higher marriage rates are associated with a decline in suicide rates; thus, the route through proportion of women married suggests that male-biased sex ratio should have a negative effect on suicide rates (which is the opposite of our findings above). Since the mediated effect does not account for the original relationship, it is not a mediator.
Our other mediator, operational sex ratio, is significantly associated with both sex ratio and suicide rate for women aged 35–54 and 55–74, where a higher sex ratio (i.e., a higher proportion of men) is associated with a higher operational sex ratio (i.e., a higher proportion of unmarried men), and this is associated with an increase in suicide rates for women. Operational sex ratio completely mediates the relationship between sex ratio and suicide rate.
When considering the youngest age group, we find no significant mediators for men aged 15–34. For women aged 15–34, there is no relationship to mediate.
4. Discussion
Our results show that, as predicted, male-biased sex ratios are positively associated with suicide rates for older men aged 35–54 and 55–74 and these results are mediated by male marriage rates. This corresponds to an increased suicide rate of 2.25 per 100,000 men aged 35–54 and 3.2 per 100,000 men aged 55–74 as one goes from an equal sex ratio to 55% males, at the average value for all covariates. In counties with male-biased sex ratios, a smaller proportion of males are married (after controlling for other covariates), resulting in higher suicide rates. As the proportion of married men increases, there is an associated drop in suicide rates—as expected from prior research (Kposowa 2001, 2000). Our results are consistent with the findings by Zhou and Hesketh (2017) which showed that single men at ages 30–40 experienced greater depression and suicidal thoughts in male-biased regions of China compared to married men aged 30–40 or unmarried men aged 20–30. Prior research has shown that unmarried and divorced men are more likely to exhibit mental health problems, depression, alcohol and drug misuse, along with experiencing reduced social support and integration (Simon 2002; Horwitz et al. 1996; Umberson 1992), all of which have been linked to suicidal risk (Shaffer 1993; Denney et al. 2009; Stack 2000). Operational sex ratio is not a significant mediator of the relationship between sex ratio and suicide for older men, suggesting that an inability to partner (above and beyond simple marriage rates) is not driving these effects for men.
For females, we see a positive association between male-biased sex ratios and suicide rates for females aged 35–54 and 55–74, counter to predictions. The effect size suggests that an increase in sex ratio from balanced to 55% men (55 males for every 45 females) will contribute an additional 1.5 deaths per 100,000 females aged 55–74 and 0.83 deaths per 100,000 females aged 35–54. These effects may seem small, but the average rate of female suicide is approximately 8 per 100,000; therefore, a shift by one person is a substantial change when considering the large population size of the US. As expected, in more male-biased counties, the proportion of women married increases, confirming previous research (Angrist 2002). Additionally, as the proportion of married women increases, the rate of suicide decreases for women aged 35–54. This route suggests that male-biased sex ratios should reduce suicide rates for women, which would have supported our original hypothesis, but is counter to the overall relationship we found. In contrast, the positive relationship between male-biased sex ratio and female suicide rate is mediated through operational sex ratio. Counties with greater male-biased sex ratios tend to have greater male-biased operational sex ratios, and this is significantly associated with increased suicide rates for women. This is the opposite of what we predicted—that improved opportunities for partnership should decrease risk of suicide.
Why might this be? There are a variety of possibilities; evidence suggests that male-biased sex ratios may be associated with intimate partner violence (Alessio and Stolzenberg 2010; Bose et al. 2013) perhaps because men attempt to exert greater control over their partners when they experience greater competition for mates (Guttentag and Secord 1983). Intimate partner violence is, in turn, associated with increased suicidal behaviors among women (Seedat et al. 2005; Cavanaugh et al. 2011). Another possibility is that sex ratio may be associated with sexual assault or rape (O’Brien 1991; Trent and South 2012), increasing suicidal behavior among women (Dworkin et al. 2017); however, evidence for sex ratio effects on rape and sexual assault is disputed (O’Brien 1991). It is important to note that male-biased sex ratios do not necessarily predict increased violence against women (Schacht and Borgerhoff Mulder 2015). Prior research has shown that women with children are less likely to commit suicide (Høyer and Lund 1993); however, it is possible that under conditions of male-biased sex ratios where men invest more in their offspring, women may feel less needed by their children, reducing the protective effect of parity. In male-biased communities, there are lower rates of female labor-force participation (Grosjean and Brooks 2017; Guttentag and Secord 1983), and evidence suggests that being out of the labor market increases suicide risk, particularly for women (Kposowa et al. 2019). A final possibility is that there is some other variable that influences both sex ratio and suicidal behavior that we have been unable to account for. Given that the effect of marriage rates and operational sex ratio act in opposite directions, this may explain the non-significant relationship between sex ratio and female suicide rates documented in previous research (Lester 1999).
Finally, when we examine the effects of younger males and females, we see a non-significant effect of sex ratio on young female suicide rates and a negative effect on young male suicide rates, where male-biased counties tend to have reduced suicide rates, counter to predictions. When we examine the mediators, the results show that counties with more young people married have higher suicide rates (at ages 15–34). This is counter to the expectations and an analysis of individual-level death records shows that marriage is protective at the individual level—even among young adults aged 20–34 (Centers for Disease Control and Prevention 2018). For instance, in 2018, 26.1% of men aged 20–34 were married, but only 15.5% of those who committed suicide were. For women aged 20–34, 32.9% were married, but only 21.7% of those who committed suicide were. This result suggests that there is some other factor that is associated with the likelihood of early marriage in a county and suicide rates. Research has shown that communities with earlier marriage tend to be located in southern or rural regions of the United States (Uecker and Stokes 2008), which are geographical factors we attempt to control for in our analyses. Further analyses to verify whether these effects can be explained by other potential correlates of suicide risk, including educational success (Case and Deaton 2020) or the percentage of people who recently moved (Potter et al. 2001) finds that these two factors do not mediate these relationships (results not shown). It is possible that some other measure, such as firearm ownership, may mediate these relationships, but data are not available at the county-level for analysis. Sex ratio remains significant in our model of young male suicide, even after accounting for the mediators, suggesting that we have not yet identified how sex ratio is influencing suicide rates among young males.
These findings suggest that male-biased sex ratios may be more problematic for suicide rates than female-biased sex ratios for people over the age of 35. Under conditions of male-biased sex ratios, males aged 35–54 and 55–74 were less likely to marry, which associates with higher rates of suicide. We do not see the same effects for women under conditions of female-biased sex ratios. While male-biased sex ratios reduce suicidal rates for women through the association with higher female marriage rates, the operational sex ratio appears associated with increased suicide rates for women (an effect even larger than the protective effect of marriage). Understanding the connections between ecological sex ratio, mental health, and suicidal behavior is important for anticipating public health outcomes of changing sex ratios.
There are several limitations to this research. First, our analyses only examine correlations and we cannot make any claim that our relationships are causal. We should be weary of the ecological fallacy, where we incorrectly infer individual-level behavior from population-level statistics (Robinson 1950; Pollet et al. 2017). Second, we have tried to control for confounding factors, but there may be other factors that explain the correlation between sex ratio and suicide rates that we have failed to include here, particularly factors that are not measured at the county level, such as firearm ownership or the utilization of mental health services. People who receive a diagnosis of a terminal disease or cancer are at higher risk of suicide (Hu et al. 2023). While we have restricted our sample to those under age 75 due to this limitation, if diagnoses are geographically patterned, this may confound our study. Third, people can choose where to live, resulting in self-selection bias to live in particular areas. This means that sex ratio is not randomly assigned and there may be systematic differences among people who opt to live in male- or female-biased counties. The largest influence on county-level sex ratios is likely migration and incarceration. The disproportionate incarceration of African American men in the American prison system results in female-biased African American communities (Pouget et al. 2010; Pouget 2017). Further, young adults (aged 18–24) are more likely to move than any other group (Benetsky et al. 2015), and if that migration leads to sex-biased relocations, for instance, young women moving at higher rates to counties with large university populations and young men moving at higher rates to military facilities, then we expect to see biased sex-ratios due to migration. For instance, the county with the most male-biased sex ratio among people aged 15–34 is Chattahoochee County, GA with 76% men. It is home to the Fort Benning military base. In contrast, the county with the most female-biased sex ratio at ages 15–34 is Fredericksburg, VA, with 57% women, home to University of Mary Washington, whose student population is 64% women (College Factual n.d.). People who are unhappy about their opportunities for marriage and partnership may migrate to places with more favorable sex ratios, although it is those who are unable to relocate who may experience depression, hopelessness, and possibly suicidal behaviors.
One factor that is recognized as a risk factor for suicidal behavior is identifying as transgender, gender nonconforming, gay, lesbian, or bisexual (Haas et al. 2014; King et al. 2008). The data we utilized identified people as biologically male or female at their death, without regard for gender identity. Furthermore, our theoretical framework focuses on heterosexual mating markets, which are not relevant for people with same-sex sexual orientation. There may be similar mating market effects for homosexual relationships; however, we would need to collect data on gender identity and sexual orientation in order to ascertain this. This information is now being collected by the National Violent Death Reporting System (Haas and Lane 2015). Future research should explore how these demographic traits correlate with suicide rates.
5. Conclusions
In conclusion, suicide results in over 45,000 deaths in the United States each year, but a full understanding of suicide etiology is lacking. We examine whether county-level sex ratio is associated with suicide rates, after controlling for known confounds, and examine possible mediators. The results show that, as expected, male-biased sex ratios are associated with increased suicide rates for men aged 35–54 and 55–74 and this effect is mediated by marriage rates. Counter to predictions, male-biased sex ratios are also associated with higher female suicide rates at older ages, with operational sex ratio mediating the relationship for women 35–54 and 55–74. These results suggest that marriage reduces suicide rates for men, particularly after the age of 35. The effects for women show that higher proportions of unmarried men (compared to unmarried women) is associated with increased suicide rates for women. The mechanisms influencing these relationships should be explored in more detail in future research. Prior research has shown that marriage is protective against mental illness and suicidal behavior; however, recognizing that marriage opportunity is influenced by ecological factors allows researchers to understand the downstream effects of sex ratio on suicidal behavior.
Supplementary Materials
The following supporting information can be downloaded at: https://www.mdpi.com/article/10.3390/socsci12070388/s1, Table S1: AIC values for models with (lmer) and without (lm) random intercepts for US state. In all models, the model with a random intercept for state significantly improves the AIC score; Figure S1: Density Plots of Suicide Rates; Figure S2: Density Plots of Sex Ratio; Table S2: Correlation Matrix; Table S3: Linear mixed-effects models with random intercepts for each state for age-sex categories predicting (a) crude (non-missing) suicide rate, (b) rate for more populated counties and (c) multiple imputation for missing values; Figure S3: Beta values of sex ratio predicting suicide rate in US counties for different age-sex groups in a linear mixed-effects model with random intercepts for each state controlling for unemployment rate (log), percent veterans (log), percent of people identifying as American Indian or Alaskan Native (by itself, or with another ‘race’; log transformed), the percent of people who do not identify as white (log), median household income (log), population density (log), and percent change in population from 2000 to 2010. Sex ratio is calculated using estimates of the non-imprisoned population: non-imprisoned men divided by total non-imprisoned persons. Analysis types include: ‘crude’ (non-missing) rates of suicide (red), ‘imputed’ rates of suicide (derived from a model with multiple imputation, green), and ‘populated’ representing a model that only includes more-heavily populated counties to reduce the bias of missingness. Error bars represent 95% confidence intervals. The vertical dotted line represents a beta = 0 (no effect); Table S4: Results of Mediation Analyses (see Figure 1 in main text for visual depiction).
Author Contributions
Conceptualization, H.T. and K.S.; methodology, K.S.; formal analysis, K.S.; data curation, H.T. and K.S.; writing—original draft preparation, K.S. and H.T.; writing—review and editing, K.S. All authors have read and agreed to the published version of the manuscript.
Funding
This research received no external funding.
Institutional Review Board Statement
Ethical review and approval were waived for this study because the data was originally collected by the US government and the publicly available data that we utilize does not contain any personal identifiers.
Data Availability Statement
All links to data sources are provided in the text or the Supplementary Materials.
Acknowledgments
We thank the members of the Boise State Parenting, Reproduction, and Mating Strategies (PRaMS) lab group for their suggestions and feedback on an earlier draft of this research.
Conflicts of Interest
The authors declare no conflict of interest.
References
- Alcántara, Carmela, and Joseph P. Gone. 2007. Reviewing Suicide in Native American Communities: Situating Risk and Protective Factors within a Transactional–Ecological Framework. Death Studies 31: 427–77. [Google Scholar] [CrossRef]
- Alessio, Stewart J. D., and Lisa Stolzenberg. 2010. Journal of Criminal Justice The Sex Ratio and Male-on-Female Intimate Partner Violence. Journal of Criminal Justice 38: 555–61. [Google Scholar] [CrossRef]
- American Foundation for Suicide Prevention. 2021. Risk Factors and Warning Signs. Available online: https://afsp.org/risk-factors-and-warning-signs (accessed on 9 February 2021).
- Ancona, Sergio, Francisco V. Denes, Oliver Kruger, Tamas Szekely, and Steve R. Bissinger. 2017. Estimating Adult Sex Ratios in Nature. Philosophical Transactions B 372: 20160313. [Google Scholar] [CrossRef]
- Angrist, Josh. 2002. How Do Sex Ratios Affect Marriage and Labor Markets? Evidence from America’s Second Generation. Quarterly Journal of Economics 8042: 997–1038. [Google Scholar] [CrossRef]
- Baller, Robert D., and Kelly K. Richardson. 2002. Social Integration, Imitation, and the Geographic Patterning of Suicide. American Sociological Review 67: 873–88. [Google Scholar] [CrossRef]
- Baron, Reuben M., and David A. Kenny. 1986. The Moderator-Mediator Variable Distinction in Social Psychological Research. Conceptual, Strategic, and Statistical Considerations. Journal of Personality and Social Psychology 51: 1173–82. [Google Scholar] [CrossRef]
- Benetsky, Megan J., Charlynn A. Burd, and Melanie A. Rapino. 2015. Young Adult Migration: 2007–2009 to 2010–2012. Washington, DC: American Community Survey Reports. [Google Scholar]
- Bose, Sunita, Katherine Trent, and Scott J. South. 2013. The Effect of a Male Surplus on Intimate Partner Violence in India. Economics Political Weekly 48: 1–20. [Google Scholar]
- Brandner, Jordann L., Haley M. Dillon, and Gary L. Brase. 2020. Convergent Evidence for a Theory of Rapid, Automatic, and Accurate Sex Ratio Tracking. Acta Psychologica 210: 103161. [Google Scholar] [CrossRef] [PubMed]
- Brenner, Barry, David Cheng, Sunday Clark, and Carlos A. Camargo. 2011. Scientific Articles Positive Association between Altitude and Suicide in 2584 U.S. Counties. High Altitude Medicine & Biology 12: 31–35. [Google Scholar] [CrossRef]
- Burnham, Kenneth P., and David R. Anderson. 2002. Model Selection and Multi-Model Inference: A Practical Information-Theoretic Approach. New York: Springer. [Google Scholar]
- Carter, Gregory, Allison Milner, Katie McGill, Jane Pirkis, Nav Kapur, and Matthew J. Spittal. 2017. Predicting Suicidal Behaviours Using Clinical Instruments: Systematic Review and Meta-Analysis of Positive Predictive Values for Risk Scales. British Journal of Psychiatry 210: 387–95. [Google Scholar] [CrossRef]
- Case, Anne, and Angus Deaton. 2020. Deaths of Despair and the Future of Capitalism. Princeton and Oxford: Princeton University Press. [Google Scholar]
- Cavanaugh, Courteny E., Jill Theresa Messing, Melissa Del-Colle, Chris O’Sullivan, and Jacquelyn C. Campbell. 2011. Prevalence and Correlates of Suicidal Behavior among Adult Female Victims of Intimate Partner Violence. Suicide and Life-Threatening Behavior 41: 372–83. [Google Scholar] [CrossRef] [PubMed]
- Centers for Disease Control and Prevention. 2018. Mortality Multiple Cause Files. Vital Statistics Online Data Portal. Available online: https://www.cdc.gov/nchs/data_access/vitalstatsonline.htm (accessed on 22 February 2021).
- Centers for Disease Control and Prevention. 2020. CDC Wonder. Available online: http://wonder.cdc.gov/ (accessed on 3 September 2020).
- Chen, Wei-Jen, Shi-Sen Shyu, Guei-Ging Lin, Cheng-Chung Chen, Chi-Kung Ho, Ming-Been Lee, and Frank Huang-Chih Chou. 2013. The Predictors of Suicidality in Previous Suicide Attempters Following Case Management Services. Suicide and Life-Threatening Behavior 43: 469–78. [Google Scholar] [CrossRef] [PubMed]
- College Factual. n.d. UMW Diversity & Demographics. Available online: https://www.collegefactual.com/colleges/university-of-mary-washington/student-life/diversity/#:~:text=The%20undergraduate%20student%20body%20at,1%2C573%20males%20and%202%2C837%20females (accessed on 23 February 2021).
- Cutright, Phillips, Steven Stack, and Robert Fernquist. 2007. Marital Status Integration, Suicide Disapproval, and Societal Integration as Explanations of Marital Status Differences in Female Age-Specific Suicide Rates. Suicide and Life-Threatening Behavior 37: 715–24. [Google Scholar] [CrossRef] [PubMed]
- Darwin, Francis. 1887. The Life and Letters of Charles Darwin. New York: D. Appleton and Company. [Google Scholar]
- DeCatanzaro, Denys. 1980. Human Suicide: A Biological Perspective. Behavioral and Brain Sciences 3: 265–72. [Google Scholar] [CrossRef]
- Denney, Justin T., Richard G. Rogers, Patrick M. Krueger, and Tim Wadsworth. 2009. Adult Suicide Mortality in the United States: Marital Status, Family Size, Socioeconomic Status, and Differences by Sex. Social Science Quarterly 90: 1167–85. [Google Scholar] [CrossRef]
- Dixon, P. G., A. N. McDonald, K. N. Scheitlin, J. E. Stapleton, J. S. Allen, W. M. Carter, M. R. Holley, D. D. Inman, and J. B. Roberts. 2007. Effects of Temperature Variation on Suicide in Five U.S. Counties, 1991–2001. International Journal of Biometeorology 51: 395–403. [Google Scholar] [CrossRef]
- Durkheim, Emile. 1897. Suicide: A Study in Sociology. New York: Free Press. [Google Scholar]
- Dworkin, Emily R., Suvarna V. Menon, Jonathan Bystrynski, and Nicole E. Allen. 2017. Sexual Assault Victimization and Psychopathology: A Review and Meta-Analysis. Clinical Psychology Review 56: 65–81. [Google Scholar] [CrossRef]
- Franklin, Joseph C., Jessica D. Ribeiro, Kathryn R. Fox, Kate H. Bentley, Evan M. Kleiman, Xieyining Huang, Katherine M. Musacchio, Adam C. Jaroszewski, Bernard P. Chang, and Matthew K. Nock. 2017. Risk Factors for Suicidal Thoughts and Behaviors: A Meta-Analysis of 50 Years of Research. Psychological Bulletin 143: 187–232. [Google Scholar] [CrossRef]
- Garnett, Matthew F., and Sally C. Curtin. 2023. Suicide mortality in the United States, 2001–2021. In NCHS Data Brief, no 464; Hyattsville: National Center for Health Statistics. [Google Scholar] [CrossRef]
- Grosjean, Pauline, and Robert C. Brooks. 2017. Persistent Effect of Sex Ratios on Relationship Quality and Life Satisfaction. Philosophical Transactions of the Royal Society B: Biological Sciences 372: 20160315. [Google Scholar] [CrossRef]
- Guttentag, Marcia, and Paul F. Secord. 1983. Too Many Women? The Sex Ratio Question. Newbury Park: Sage. [Google Scholar]
- Haas, Ann P., and Andrew Lane. 2015. Collecting Sexual Orientation and Gender Identity Data in Suicide and Other Violent Deaths: A Step towards Identifying and Addressing LGBT Mortality Disparities. LGBT Health 2: 84–87. [Google Scholar] [CrossRef]
- Haas, Ann P., Philip L. Rodgers, and Jody L. Herman. 2014. Suicide Attempts among Transgender and Gender Non-Conforming Adults. American Foundation for Suicide Prevention 50: 59. [Google Scholar] [CrossRef]
- Hedegaard, Holly, Sally C. Curtin, and Margaret Warner. 2020. Increase in Suicide Mortality in the United States, 1999–2018. NCHS Data Brief 362: 1–8. [Google Scholar]
- Hirsch, Jameson K. 2006. A Review of the Literature on Rural Suicide: Risk and Protective Factors, Incidence, and Prevention. Crisis 27: 189–99. [Google Scholar] [CrossRef]
- Horwitz, Allan V., Helene Raskin White, and Sandra Howell-White. 1996. Becoming Married and Mental Health: A Longitudinal Study of a Cohort of Young Adults. Journal of Marriage and the Family 58: 895. [Google Scholar] [CrossRef]
- Høyer, Georg, and Eiliv Lund. 1993. Suicide Among Women Related to Number of Children in Marriage. Archives of General Psychiatry 50: 134–37. [Google Scholar] [CrossRef]
- Hu, Xin, Jiemin Ma, Ahmedin Jemal, Jingxuan Zhao, Leticia Nogueira, Xu Ji, K. Robin Yabroff, and Xuesong Han. 2023. Suicide Risk Among Individuals Diagnosed With Cancer in the US, 2000–2016. JAMA Network Open 6: e2251863. [Google Scholar] [CrossRef] [PubMed]
- Hurtado, A. Magdalena, and Kim R. Hill. 1992. Paternal Effect on Offspring Survivorship among Ache and Hiwi Hunter-Gatherers: Implications for Modeling Pair-Bond Stability. In Father-Child Relations: Cultural and Biosocial Contexts. Edited by Barry S. Hewlett. New York: Aldine de Gruyter, pp. 31–55. [Google Scholar]
- Ivey-Stephenson, Asha Z., Alex E. Crosby, Shane P. D. Jack, Tadesse Haileyesus, and Marcie-jo Kresnow-Sedacca. 2017. Suicide Trends Among and Within Urbanization Levels by Sex, Race/Ethnicity, Age Group and Mechanisms of Death-United States, 2001–2015. Morbidity and Mortality Weekly Report 66: 1. [Google Scholar] [CrossRef] [PubMed]
- Kaplan, Mark S., Bentson H. McFarland, Nathalie Huguet, and Marcia Valenstein. 2012. Suicide Risk and Precipitating Circumstances among Young, Middle-Aged, and Older Male Veterans. American Journal of Public Health 102: 131–37. [Google Scholar] [CrossRef]
- Kegler, Scott R., Deborah M. Stone, and Kristin M. Holland. 2017. Trends in Suicide by Level of Urbanization—United States, 1999–2015. Morbidity and Mortality Weekly Report 66: 2015–18. [Google Scholar] [CrossRef]
- Kendler, Kenneth S., Laura M. Karkowski, and Carol A. Prescott. 1998. Stressful Life Events and Major Depression: Long-Term Contextual Threat, and Diagnostic Specificity. The Journal of Nervous and Mental Disease 186: 661–69. [Google Scholar] [CrossRef] [PubMed]
- King, Michael, Joanna Semlyen, Sharon See Tai, Helen Killaspy, David Osborn, Dmitri Popelyuk, and Irwin Nazareth. 2008. A Systematic Review of Mental Disorder, Suicide, and Deliberate Self Harm in Lesbian, Gay and Bisexual People. BMC Psychiatry 8: 70. [Google Scholar] [CrossRef] [PubMed]
- Kposowa, Augustine J. 2000. Marital Status and Suicide in the National Longitudinal Mortality Study. Journal of Epidemiology and Community Health 54: 254–61. [Google Scholar] [CrossRef] [PubMed]
- Kposowa, Augustine J. 2001. Unemployment and Suicide: A Cohort Analysis of Social Factors Predicting Suicide in the US National Longitudinal Mortality Study. Psychological Medicine 31: 127–38. [Google Scholar] [CrossRef] [PubMed]
- Kposowa, Augustine J., Dina Aly Ezzat, and Kevin Breault. 2019. New Findings On Gender: The Effects Of Employment Status On Suicide. International Journal of Women’s Health 11: 569–75. [Google Scholar] [CrossRef]
- Kuehn, Bridget M. 2009. Soldier Suicide Rates Continue to Rise. JAMA The Journal of the American Medical Association 301: 1111–13. [Google Scholar] [CrossRef]
- Kuroki, Masanori. 2013. The Effect of Sex Ratios on Suicide. Health Economics Letter 23: 1502–10. [Google Scholar] [CrossRef]
- Lester, David. 1999. Implications of the Sex Ratio for Suicide and Homicide. Perceptual and Motor Skills 89: 222. [Google Scholar] [CrossRef]
- Luo, Feijun, Curtis S. Florence, Myriam Quispe-Agnoli, Lijing Ouyang, and Alexander E. Crosby. 2011. Impact of Business Cycles on US Suicide Rates, 1928–2007. American Journal of Public Health 101: 1139–46. [Google Scholar] [CrossRef]
- Martin, Joyce A., Brady E. Hamilton, Michelle J. K. Osterman, and Anne K. Driscoll. 2019. Births: Final Data for 2018. National Vital Statistics Reports Births 68: 1–47. [Google Scholar]
- McCleary, Richard, Kenneth S. Y. Chew, Vincent Merrill, and Carol Napolitano. 2002. Does Legalized Gambling Elevate the Risk of Suicide? An Analysis of U.S. Counties and Metropolitan Areas. Suicide and Life-Threatening Behavior 32: 209–21. [Google Scholar] [CrossRef] [PubMed]
- Meszaros, L. 2020. Top 10 Causes of Death in the US in 2020. MDLinx. Available online: https://www.mdlinx.com/article/top-10-causes-of-death-in-the-us-in-2020/MNpEowpA8DXKBUNcbmkpY (accessed on 29 September 2020).
- Moore, F. R., M. Macleod, C. Starkey, I. Krams, and T. Roy. 2020. Effects of the Sex Ratio and Socioeconomic Deprivation on Male Mortality. Archives of Suicide Research 24: 435–49. [Google Scholar] [CrossRef] [PubMed]
- Nesse, Randolph M. 2000. Is Depression an Adaptation? Archives of General Psychiatry 57: 14–20. [Google Scholar] [CrossRef]
- Nock, Matthew K., Jennifer M. Park, Christine T. Finn, Tara L. Deliberto, Halina J. Dour, and Mahzarin R. Banaji. 2010. Measuring the Suicidal Mind: Implicit Cognition Predicts Suicidal Behavior. Psychological Science 21: 511–17. [Google Scholar] [CrossRef]
- O’Brien, Robert M. 1991. Sex Ratio and Rape Rates: A Power-Control Theory. Criminology 29: 99–114. [Google Scholar] [CrossRef]
- O’Connor, Rory C., and Matthew K. Nock. 2014. The Psychology of Suicidal Behaviour. The Lancet Psychiatry 1: 73–85. [Google Scholar] [CrossRef]
- O’Neill, S., Edel Ennis, Colette Corry, and Brendan Bunting. 2018. Factors Associated with Suicide in Four Age Groups: A Population Based Study. Archives of Suicide Research 22: 128–38. [Google Scholar] [CrossRef]
- Pedersen, Frank A. 1991. Secular Trends in Human Sex Ratios: Their Influence on Individual and Family Behavior. Human Nature 2: 271–91. [Google Scholar] [CrossRef]
- Pinquart, Martin. 2003. Loneliness in Married, Widowed, Divorced, and Never-Married Older Adults. Journal of Social and Personal Relationships 20: 31–53. [Google Scholar] [CrossRef]
- Pollet, Thomas V., Andrea H. Stoevenbelt, and Toon Kuppens. 2017. The Potential Pitfalls of Studying Adult Sex Ratios at Aggregate Levels in Humans. Philosophical Transactions of the Royal Society B Biological Sciences 372: 20160317. [Google Scholar] [CrossRef]
- Potter, Lloyd B., Marcie-jo Kresnow, Kenneth E. Powell, Thomas R. Simon, James A. Mercy, Roberta K. Lee, Ralph F. Frankowski, Alan C. Swann, Timothy Bayer, and Patrick W. O’Carroll. 2001. The Influence of Geographic Mobility on Nearly Lethal Suicide Attempts. Suicide and Life-Threatening Behavior 32: 42–49. [Google Scholar] [CrossRef] [PubMed]
- Pouget, Enrique Rodriguez. 2017. Social Determinants of Adult Sex Ratios and Racial/Ethnic Disparities in Transmission of HIV and Other Sexually Transmitted Infections in the USA. Philosophical Transactions of the Royal Society B: Biological Sciences 372: 20160323. [Google Scholar] [CrossRef] [PubMed]
- Pouget, Enrique Rodriguez, Trace S. Kershaw, Linda M. Niccolai, Jeannette R. Ickovics, and Kim M. Blankenship. 2010. Associations of Sex Ratios and Male Incarceration Rates with Multiple Opposite-Sex Partners: Potential Social Determinants of HIV/STI Transmission. Public Health Reports 125: 70–80. [Google Scholar] [CrossRef] [PubMed]
- Robinson, William S. 1950. Ecological Correlations and the Behavior of Individuals. American Sociological Review 15: 351–57. [Google Scholar] [CrossRef]
- Rokach, Ami, Raan Matalon, Ben Rokach, and Artem Safarov. 2007. The Effects of Gender and Marital Status on Loneliness of the Aged. Social Behavior and Personality 35: 243–54. [Google Scholar] [CrossRef]
- Rubin, Donald B. 1987. Multiple Imputation for Nonresponse in Surveys. New York: John Wiley & Sons. [Google Scholar] [CrossRef]
- Schacht, Ryan, and Ken R. Smith. 2017. Causes and Consequences of Adult Sex Ratio Imbalance in a Historical U.S. Population. Philosophical Transactions B 372: 20160314. [Google Scholar] [CrossRef]
- Schacht, Ryan, and Monique Borgerhoff Mulder. 2015. Sex Ratio Effects on Reproductive Strategies in Humans. Royal Society Open Science 2: 140402. [Google Scholar] [CrossRef]
- Seedat, Soraya, Murray B. Stein, and David R. Forde. 2005. Association between Physical Partner Violence Posttraumatic Stress Childhood Trauma and Suicide Attempts in a Community Sample of Women.Pdf. Violence and Victims 20: 87–98. [Google Scholar] [CrossRef]
- Shaffer, David. 1993. Suicide: Risk Factors and the Public Health. American Journal of Public Health 83: 171–72. [Google Scholar] [CrossRef]
- Simon, Robin W. 2002. Revisiting the Relationships among Gender, Marital Status, and Mental Health. American Journal of Sociology 107: 1065–96. [Google Scholar] [CrossRef]
- Singh, Gopal K., and Mohammad Siahpush. 2002. Increasing Rural–Urban Gradients in US Suicide. American Journal of Public Health 92: 1161–67. [Google Scholar] [CrossRef] [PubMed]
- Soper, C. A. 2018. The Evolution of Suicide. Cham: Springer International. [Google Scholar]
- Spicer, Rebecca S., and Ted R. Miller. 2000. Suicide Acts in 8 States: Incidence and Case Fatality Rates by Demographics and Method. American Journal of Public Health 90: 1885–91. [Google Scholar] [CrossRef] [PubMed]
- Stack, Steven. 2000. Suicide: A 15-Year Review of the Sociological Literature. Part I: Cultural and Economic Factors. Suicide & Life-Threatening Behavior 30: 145–62. [Google Scholar] [CrossRef]
- Stack, Steven. 2021. Contributing Factors to Suicide: Political, Social, Cultural and Economic. Preventive Medicine 152: 106498. [Google Scholar] [CrossRef]
- Stieglitz, Jonathan, Eric Schniter, Christopher Von Rueden, Hillard Kaplan, and Michael Gurven. 2015. Functional Disability and Social Conflict Increase Risk of Depression in Older Adulthood Among Bolivian Forager-Farmers. Journals of Gerontology-Series B Psychological Sciences and Social Sciences 70: 948–56. [Google Scholar] [CrossRef]
- Syme, Kristen L., and Edward H. Hagen. 2019. When Saying ‘Sorry’ Isn’t Enough: Is Some Suicidal Behavior a Costly Signal of Apology? A Cross-Cultural Test. Human Nature 30: 117–41. [Google Scholar] [CrossRef]
- Syme, Kristen L., and Edward H. Hagen. 2020. Mental Health Is Biological Health: Why Tackling ‘Diseases of the Mind’ Is an Imperative for Biological Anthropology in the 21st Century. Yearbook of Physical Anthropology 171: 87–117. [Google Scholar] [CrossRef]
- Syme, Kristen L., Zachary H. Garfield, and Edward H. Hagen. 2016. Testing the Bargaining vs. Inclusive Fitness Models of Suicidal Behavior against the Ethnographic Record. Evolution and Human Behavior 37: 176–92. [Google Scholar] [CrossRef]
- Tello, Nina, Ghina Harika-Germaneau, Wilfried Serra, Nematollah Jaafari, and Armand Chatard. 2020. Forecasting a Fatal Decision: Direct Replication of the Predictive Validity of the Suicide–Implicit Association Test. Psychological Science 31: 65–74. [Google Scholar] [CrossRef]
- Ten Have, M., B. W. J. H. Penninx, M. Tuithof, S. A. F. M. Van Dorsselaer, M. Kleinjan, J. Spijker, and R. De Graaf. 2017. Duration of Major and Minor Depressive Episodes and Associated Risk Indicators in a Psychiatric Epidemiological Cohort Study of the General Population. Acta Psychiatrica Scandinavica1 136: 300–12. [Google Scholar] [CrossRef] [PubMed]
- Thomas, Kyla, and David Gunnell. 2010. Suicide in England and Wales 1861–2007: A Time-Trends Analysis. International Journal of Epidemiology 39: 1464–75. [Google Scholar] [CrossRef] [PubMed]
- Trent, Katherine, and Scott J. South. 2012. Mate Availability and Women’s Sexual Experiences in China. Journal of Marriage and Family 74: 201–14. [Google Scholar] [CrossRef] [PubMed]
- Uecker, Jeremy E., and Charles E. Stokes. 2008. Early Marriage in the United States. Journal of Marriage and Family 70: 835–46. [Google Scholar] [CrossRef] [PubMed]
- Uggla, Caroline, and Gunnar Andersson. 2018. Higher Divorce Risk When Mates Are Plentiful? Evidence from Denmark. Biology Lettters 14: 20180475. [Google Scholar] [CrossRef] [PubMed]
- Uggla, Caroline, and Ruth Mace. 2017. Adult Sex Ratio and Social Status Predict Mating and Parenting Strategies in Northern Ireland. Philosophical Transactions of the Royal Society B: Biological Sciences 372: 20160318. [Google Scholar] [CrossRef]
- Umberson, Debra. 1992. Gender, Marital Status and the Social Control of Health Behavior. Social Science and Medicine 34: 907–17. [Google Scholar] [CrossRef]
- United States Census Bureau. 2000. Race (Total Races Tallied). Available online: https://data.census.gov/table?q=P009&g=0100000US$050000_010XX00US$0500000&y=2000&tid=DECENNIALSF12000.P009 (accessed on 3 September 2020).
- United States Census Bureau. 2010a. Group Quarters Population by Sex by Age by Group Quarters Type. Available online: https://data.census.gov/cedsci/table?q=PCT39&g=0100000US.050000&tid=DECENNIALSF22010.PCT39&hidePreview=true (accessed on 3 September 2020).
- United States Census Bureau. 2010b. Employment Status. American Community Survey. Available online: https://data.census.gov/cedsci/table?q=unemployment&g=0100000US.050000&tid=ACSST5Y2010.S2301&hidePreview=true (accessed on 29 January 2021).
- United States Census Bureau. 2010c. Median Income in the Past 12 Months (in 2010 Inflation-Adjusted Dollars). American Community Survey. Available online: https://data.census.gov/cedsci/table?q=S1903&g=0100000US.050000&tid=ACSST5Y2010.S1903&hidePreview=true (accessed on 29 January 2021).
- United States Census Bureau. 2010d. Race (Total Races Tallied). Available online: https://data.census.gov/table?q=P6:+RACE+(TOTAL+RACES+TALLIED)&g=010XX00US$0500000&tid=DECENNIALDHC2020.P6 (accessed on 3 September 2020).
- United States Census Bureau. 2010e. Sex by Marital Status by Age for the Population 15 Years and Over. American Community Survey. Available online: https://data.census.gov/cedsci/table?q=B12002&g=0100000US.050000&tid=ACSDT5Y2010.B12002&hidePreview=true (accessed on 29 January 2021).
- United States Census Bureau. 2011. USA Counties: 2011. Available online: https://www.census.gov/library/publications/2011/compendia/usa-counties-2011.html#LND (accessed on 3 September 2020).
- United States Census Bureau. 2015. Veteran Status. American Community Survey. Available online: https://data.census.gov/cedsci/table?q=s2101&g=0100000US.050000&tid=ACSST5Y2015.S2101&hidePreview=true (accessed on 29 January 2021).
- United States Census Bureau. 2018a. Employment Status. American Community Survey. Available online: https://data.census.gov/cedsci/table?q=unemployment&g=0100000US.050000&tid=ACSST5Y2018.S2301&hidePreview=true (accessed on 29 January 2021).
- United States Census Bureau. 2018b. Income in the Past 12 Months (in 2010 Inflation-Adjusted Dollars). Available online: https://data.census.gov/table?q=s2301&g=0100000US$050000_010XX00US$0500000&tid=ACSST1Y2018.S2301 (accessed on 29 January 2021).
- United States Census Bureau. 2018c. Sex by Marital Status by Age for the Population 15 Years and Over. American Community Survey. Available online: https://data.census.gov/cedsci/table?q=B12002&g=0100000US.050000&tid=ACSDT5Y2018.B12002&hidePreview=true (accessed on 29 January 2021).
- United States Census Bureau. 2020. County Population Totals: 2010–2019. Available online: https://www.census.gov/data/tables/time-series/demo/popest/2010s-counties-total.html (accessed on 3 September 2020).
- United States Justice Department. 2018. National Corrections Reporting Program, 1991–2016: Selected Variables. Office of Justice Programs. Bureau of Justice Statistics. Inter-University Consortium for Political and Social Research. Available online: https://www.icpsr.umich.edu/web/NACJD/studies/37021/versions/V1 (accessed on 3 September 2020).
- Utsey, Shawn O., Joshua N. Hook, and Pia Stanard. 2007. A Re-Examination of Cultural Factors That Mitigate Risk and Promote Resilience in Relation to African American Suicide: A Review of the Literature and Recommendations for Future Research. Death Studies 31: 399–416. [Google Scholar] [CrossRef]
- Vanderwerker, Lauren C., Joyce H. Chen, Peter Charpentier, Mary Elizabeth Paulk, Marion Michalski, and Holly G. Prigerson. 2007. Differences in Risk Factors for Suicidality Between African American and White Patients Vulnerable to Suicide. Suicide and Life-Threatening Behavior 37: 1–9. [Google Scholar] [CrossRef]
- Wong, Y. Joel, Cara S. Maffini, and Minkyeong Shin. 2014. The Racial-Cultural Framework: A Framework for Addressing Suicide-Related Outcomes in Communities of Color. The Counseling Psychologist 42: 13–54. [Google Scholar] [CrossRef]
- Yang, Bijou, and David Lester. 1995. Suicide, Homicide and Unemployment. Applied Economics Letters 2: 278–79. [Google Scholar] [CrossRef]
- Zhou, Xudong, and Therese Hesketh. 2017. High Sex Ratios in Rural China: Declining Well-Being with Age in Never-Married Men. Philosophical Transactions of the Royal Society B: Biological Sciences 372: 20160324. [Google Scholar] [CrossRef] [PubMed]
- Zhou, Xudong, Lu Li, Zheng Yan, and Therese Hesketh. 2013. High Sex Ratio as a Correlate of Depression in Chinese Men. Journal of Affective Disorders 144: 79–86. [Google Scholar] [CrossRef]
- Ziker, John P., and Kristin Snopkowski. 2020. Life-History Factors Influence Teenagers’ Suicidal Ideation: A Model Selection Analysis of the Canadian National Longitudinal Survey of Children and Youth. Evolutionary Psychology 18: 1474704920939521. [Google Scholar] [CrossRef] [PubMed]
Disclaimer/Publisher’s Note: The statements, opinions and data contained in all publications are solely those of the individual author(s) and contributor(s) and not of MDPI and/or the editor(s). MDPI and/or the editor(s) disclaim responsibility for any injury to people or property resulting from any ideas, methods, instructions or products referred to in the content. |
© 2023 by the authors. Licensee MDPI, Basel, Switzerland. This article is an open access article distributed under the terms and conditions of the Creative Commons Attribution (CC BY) license (https://creativecommons.org/licenses/by/4.0/).