1. Introduction
Cities have become critical sites of enquiry like never before. Rapid urbanization alongside the growing challenges of social, economic and spatial inequalities greatly affect people’s physical and mental health (
Pickett and Wilkinson 2010) and have posed persistent challenges for health policy efforts (
Guillaume et al. 2016). Hence, it becomes essential to understand how the urban environment influences health and well-being for achieving national and global health goals. Within cities, well-being can be compromised on a daily basis through acute and sustained stressors, such as high population densities, feelings of anonymity, commuting pressures, noise or living in intense pockets of deprivation (
Krupat 1985). Well-being in cities is strongly linked to the various processes inherent in urbanization itself, to the distinctly local, social and systemic responses to these processes, and finally to the quality of the natural, built and social environments. In most well-being studies led by public health researchers, the importance of urban environment is largely limited to the benefits of green spaces (
Ward et al. 2016;
Maas et al. 2006) and on the physical environment characteristics hindering or fostering people’s physical activities (
McCormack et al. 2004;
Humpel et al. 2002). Often, this leads to a parochial approach that largely overlooks the significant and complex relationship between people and urban environments which is central for performing everyday social and spatial practices (
Simmel and Wolff 1950)—these practices have a dominant influence on people’s health and well-being. Several researchers have suggested that neighborhood population density and deprivation influence well-being in different ways, with little research examining the combination of these two variables considering peoples socio-spatial practices in physical settings.
The paper highlights the need for a deeper understanding of socio-spatial factors implicit within density and deprivation parameters in neighborhoods for facilitating innovative well-being related interventions in design, planning and policy. Discussions draw upon a research study which investigated the relationship between density/deprivation and well-being of people in Birmingham, UK. The study adopts the definition of health provided by The World Health Organization (WHO) in 1948 defined health as “a state of complete physical, mental and social well-being and not merely the absence of disease or infirmity” (
WHO 2006). This definition brings together three key factors, the physiological, psychological and social, and their interactions within the discourses and understanding of health and illness (
Martino 2017). And “well-being” in this study is understood “as how people feel and how they function, both on a personal and a social level, and how they evaluate their lives as a whole” (
New Economics Foundation 2012).
2. Urban Environment and Health and Well-Being Challenges
Over 68% of the world’s population will be living in urban areas by 2050 (
United Nations Report 2018). Due to prolific urbanization, health and well-being threats in cities are many; at a very obvious level, deteriorating environmental quality affects human health directly, for example, through air and water pollution, soil contamination and noise, and indirectly through climate change, decreasing biodiversity and increasingly common natural disasters, among other factors.
Bai et al. (
2012) classified at least five types of health threats: (1) infectious diseases that thrive when people are crowded together in substandard living conditions; (2) acute and chronic diseases such as respiratory disease and pulmonary cancer that are associated with industrial pollution; (3) chronic, non-communicable diseases that are on the rise with unhealthy urban lifestyles; (4) injuries resulting from motor vehicle collisions, violence and crime; and (5) climate change-related health risks, for example, heat stress and changed patterns of infectious disease (
Boyko et al. 2015). The changing lifestyle of people in cities and the increasingly mobile society, ties peoples’ health and well-being more closely to urban environments like never before. For instance, proper transport infrastructure, routes and facilities affect how people move and access places and amenities, which impacts both physical and mental satisfaction and/stress levels in everyday life, all of which are important factors on which good health is dependent.
Furthermore, the socio-political conditions in cities create new types of spatial dependencies. Social inequalities are formed between regions favored by the global economy (
Szirmai and Verspagen 2015). Inequality manifests at varying spatial scales within cities, and poor access to proper infrastructure, healthcare and information and knowledge networks lead to several health risks (
Vogli 2011;
Rowlingson 2011). These inequalities create several kinds of conflict and tension within urban areas, creating greater health risks and exacerbating existing risks. Examining and understanding people’s well-being requires disentangling the diverse factors caught in a labyrinth formed at the nexus of the multidimensional, complex and evolving nature of urban environments (
Bai et al. 2012) and the growing population and unequal geographies in cities.
The social and physical environments in which people live impact and influence their perceptions and experiences of health and well-being. Density and deprivation are two important parameters that can offer valuable insights and evidence into the important link between the urban environment and health impacts. Numerous studies have been conducted focusing on the impact of density and deprivation on peoples’ health and well-being (
Bécares et al. 2013;
Rocha et al. 2017). Yet, both density and deprivation, as concept and parameter, require a deeper understanding for delineating their relationship and impact on peoples’ perceptions and behavior in their everyday urban living. For instance, high density is often considered undesirable (
Boyko and Cooper 2011;
Lawson 2009) as it is linked with poor quality of life, crime, and lack of green spaces and public spaces for interaction and recreation (both active and passive).
Lawson (
2009) explains that it is more than the lack of amenities (functional) that is correlated with decrements in well-being; it is the lack of socio-spatial needs, such as privacy, that encourage negative behavior and perceptions in people in high density spaces. Similarly, deprivation takes a wide range of forms, such as income, employment, health, and barriers to housing and services (
Townsend 1987). Disentangling the relationship between the multilayered and multifaceted nature of deprivation in city living and peoples’ well-being is often challenging.
3. Case Study
Following
Yin (
2014), a case study method was adopted to examine the relationship between well-being and the physical environment, focusing on density and deprivation parameters. Birmingham city in the UK was selected as the case study mainly for its population and broad diversity of people and neighborhoods, which are important factors for understanding density and deprivation. The study first involved identifying four electoral wards in the city that differed along key dimensions (i.e., density and deprivation). Arguably, wards are larger than neighborhoods, but the former afforded an opportunity to obtain census data with clear spatial boundaries (
Hale et al. 2015). Once the wards were chosen, data collection was carried out using well-being questionnaires and through audits of street segments in the four wards around the notion of walkability.
Identifying Wards for Case Study
Wards are small geographical units in the UK, used during local government elections. As such, they are useful units of analysis, as differences in urban form may reflect broader differences between wards in terms of community priorities, political representation, levels of investment and ultimately individual well-being. In addition, a variety of statistical and census data is held at the ward scale. The aim was to undertake surveys in wards within Birmingham that are contrasted in their population density and levels of deprivation to ensure that these dimensions could be fully explored (i.e., that there was enough variability within our sample for these two measures). Specifically, the study used 2011 Census data to acquire population density figures and the 2010 estimated Index of Multiple Deprivation (IMD) scores for deprivation data in England. Both sets of data were obtained at the ward scale.
A list of the 40 Birmingham wards was entered into an Excel spreadsheet in one column alongside each ward’s population density and deprivation data in subsequent columns. Population density and deprivation data were divided into low and high (0–29 persons her hectare (pph) and 40–171 pph, respectively; <25 and >40, respectively), with those in the medium range discarded (i.e., 30–39 pph and 26–39, respectively). The values for low, medium and high density and deprivation were guided by what data was available in the wards. For example, all 2010 IMD scores for England ranged from 0.53 to 87.80, whereas the range of scores for all Birmingham wards was smaller, between 10.44 and 63.60. When choosing which wards to use for the research, therefore, the range of scores used to determine low, medium and high in terms of IMD was narrower than if Birmingham had a wider range of IMD scores.
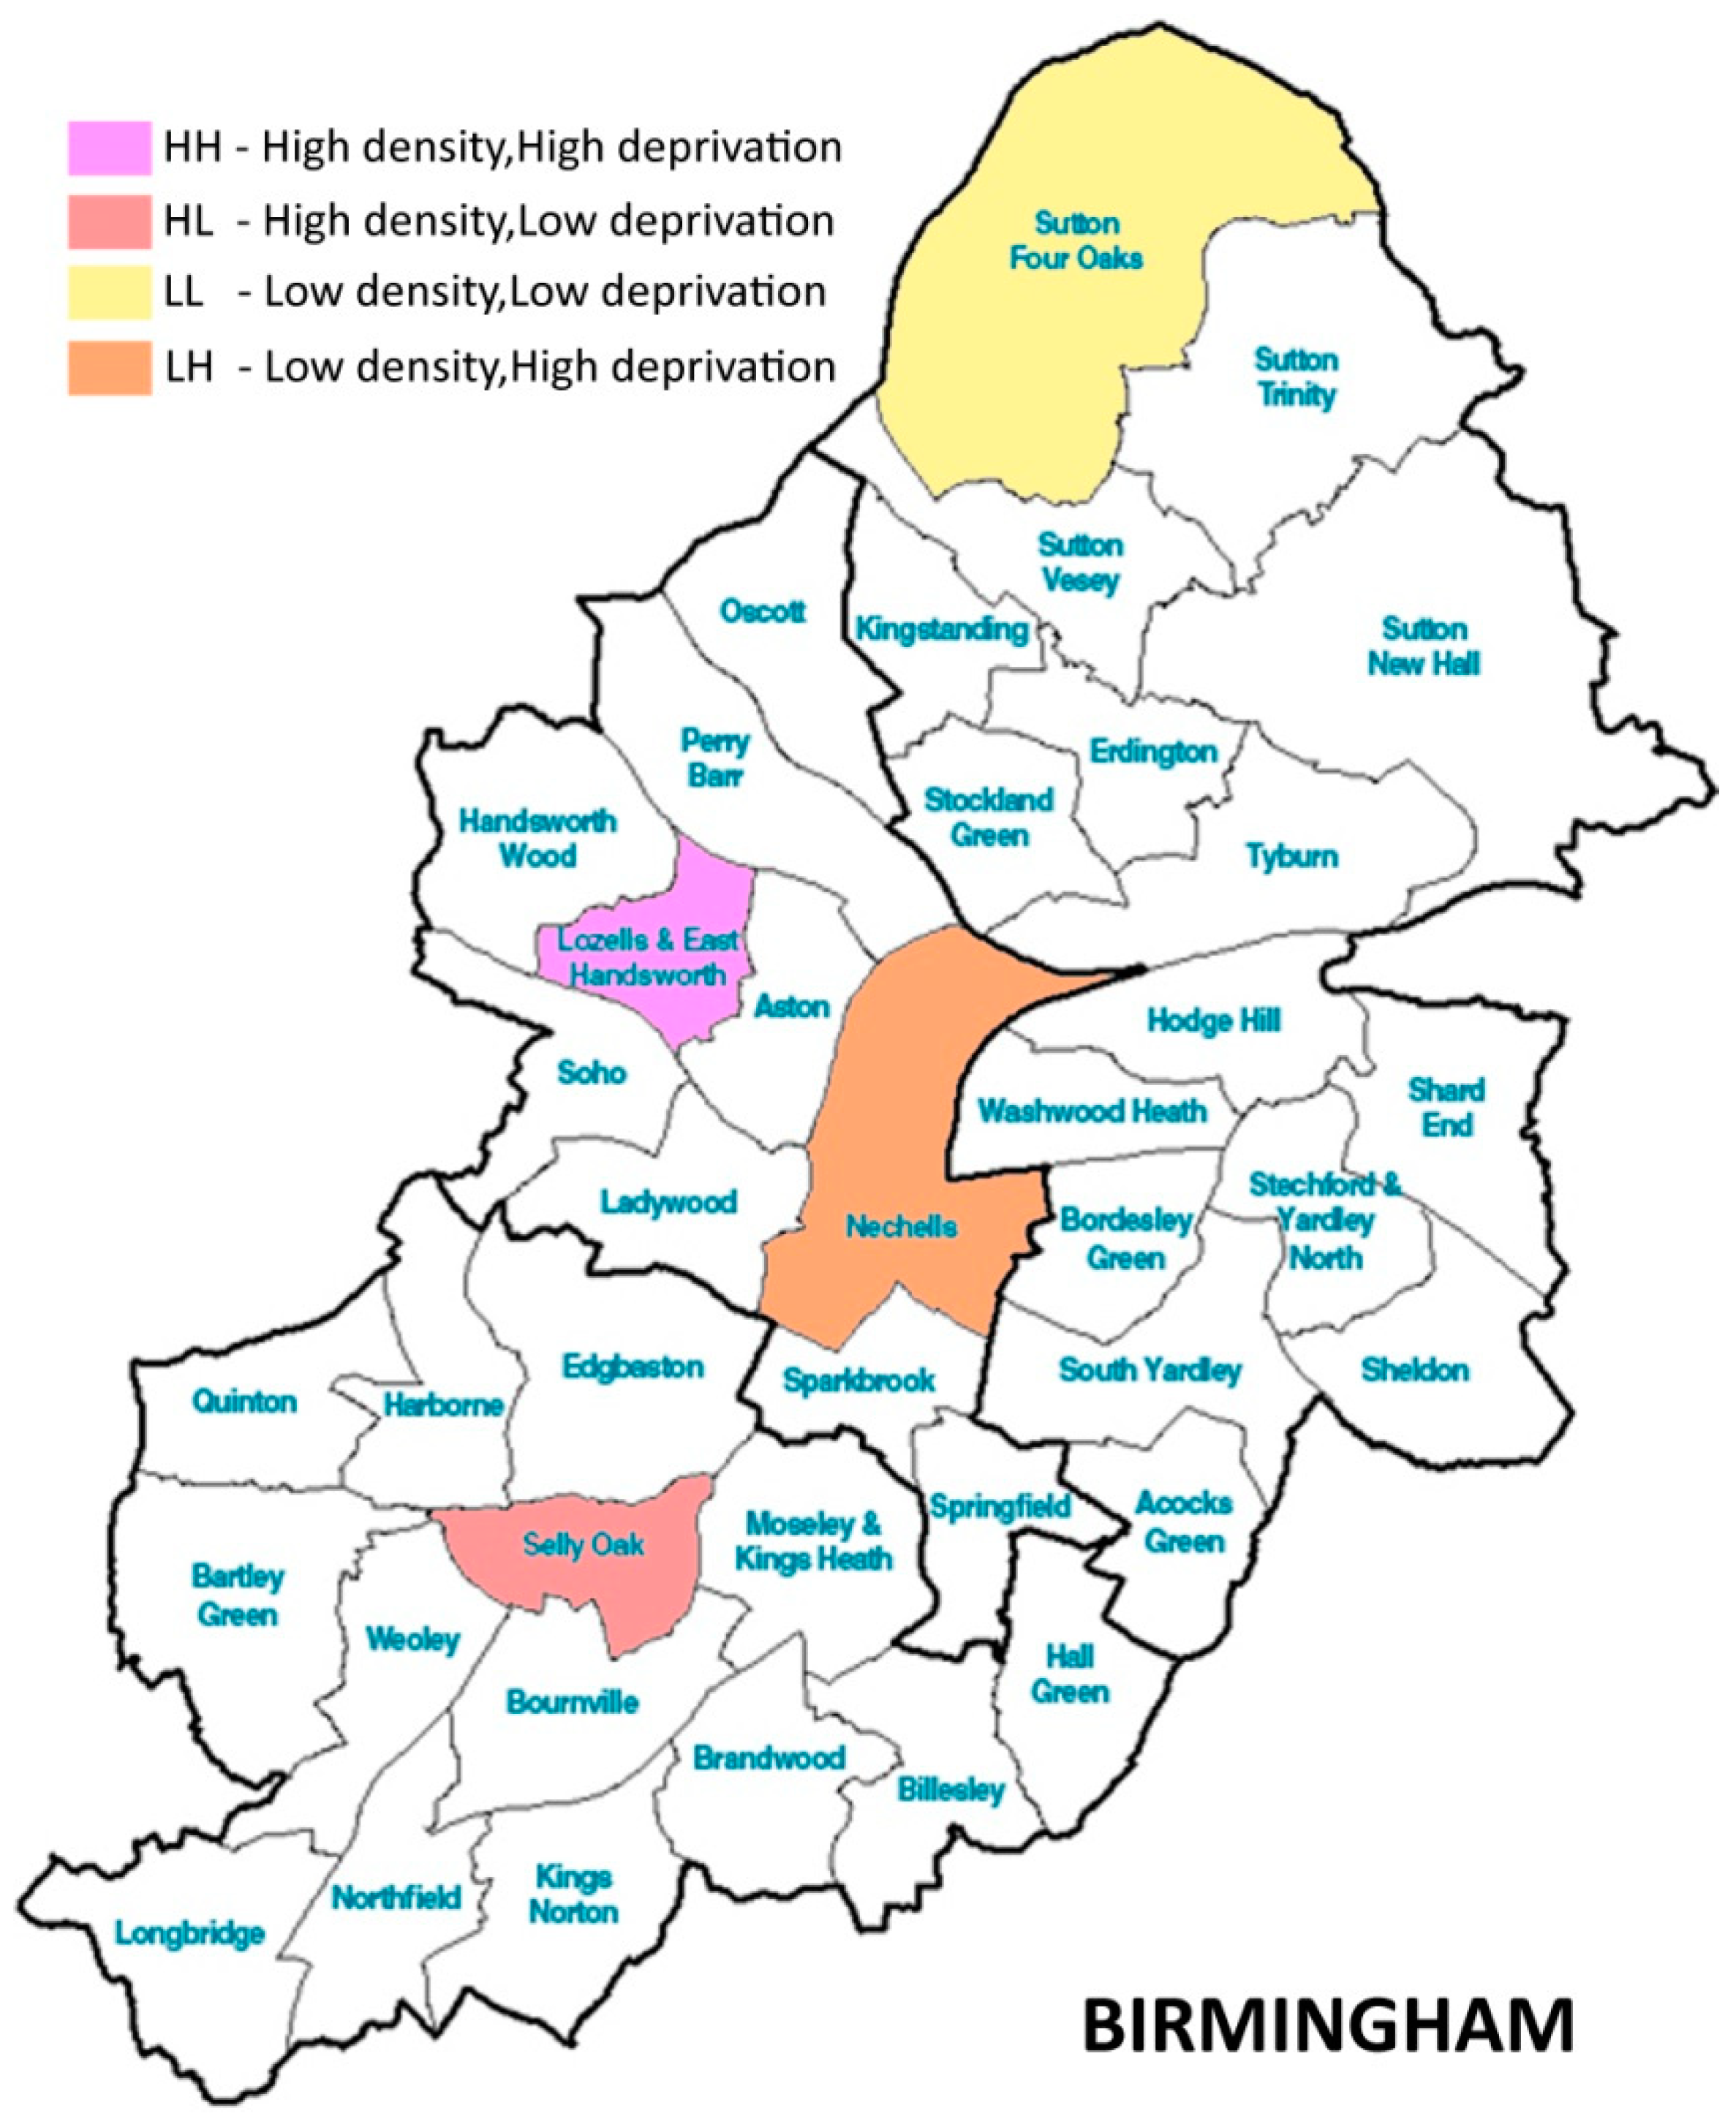
The team then displayed the candidate ward boundaries as polygons within ArcGIS 9.2 (ESRI Redlands, USA) and selected four wards whose boundaries did not touch each other. The team did this to ensure that the wards were as independent as possible from one another (i.e., not influenced by the urban form of an adjacent ward). The four possible combinations of low and high density and deprivation were chosen as follows (See
Figure 1):
Low density/low deprivation: Sutton Four Oaks;
Low density/high deprivation: Nechells;
High density/low deprivation: Selly Oak;
High density/high deprivation: Lozells and East Handsworth.
4. Data Collection
A 29-item well-being questionnaire was distributed to residents of each of the four wards between 2013 and 2015 (see
Cooper et al. 2015, for more information about questionnaire development).
The questionnaire comprised well-being indicators or measures across six headings: (1) Your local neighborhood; (2) Safety; (3) Your health and well-being; (4) Your environment and daily life; (5) Your utilities and daily life; and (6) Travel and public transport. No demographic variables were collected, other than postcodes, as the team wanted to keep the questionnaire short to maximize the number that were completed. Residents were asked to provide give a score of 0 to 5 where 0 meant extremely dissatisfied/unhappy or not at all anxious/worthwhile and 5 meant extremely satisfied/happy/anxious/worthwhile. The objective of the questionnaire was to obtain an understanding of residents’ perceptions of their individual and community well-being as well as of the area in which they lived. The questionnaire took between 5 and 10 min to complete.
The recruitment of participants for the questionnaire involved three different methods. Researchers contacted Ward Support Officers in each of the wards and asked them to suggest residents or groups whom they knew might be willing to fill in the well-being questionnaire.
1 In addition, researchers were present in specific locations within each of the wards (i.e., at a school fair in Sutton Four Oaks; at a local library and an adult learning center in Selly Oak; a community center in Nechells), usually for a morning or an afternoon, and asked passers-by and users of those facilities to complete questionnaires. In all instances, participants were asked whether they lived in the respective ward and were given an information sheet to read and a consent form to sign before they were given the questionnaire. Finally, an electronic version of the questionnaire was created using Qualtrics Survey Software, with emails, electronic newsletter announcements and social media postings made to attract potential participants.
Built Environment Audits (BEA)
Built environment audits (BEA) have been used in Australia, Belgium, Canada, Scotland and the US to measure a variety of environmental characteristics, particularly those around walkability. While assessment methods (e.g., focus groups, surveys, using GIS or Google Streetview, in situ evaluations) and measures (e.g., subjective, objective or a mixture of both) vary, built environment audits have been developed mainly due to scholars and practitioners wanting to link the design of neighborhoods with health outcomes and travel behavior (
Frank et al. 2010). For this case study, the team used an app-based version of the US Irvine Minnesota Inventory called State of Place (
www.stateofplace.co), a survey of approximately 280 questions that combines both subjective and objective measures of the built environment at the road segment scale (e.g., presence and quality of pavements; visual presence of air pollution). The questions fall into ten categories—form; density; proximity; connectivity; parks and public spaces; pedestrian amenities; personal safety; traffic safety; aesthetics; and recreational facilities—and combine to create a State of Place Index that allows the user to see how well neighborhood road segments perform in terms of walkability and against each other. The questions have been psychometrically tested for inter-rater reliability, which performed well in trials (
Boarnet et al. 2006;
Day et al. 2006).
Before using the app, the team converted each postcode collected from the well-being questionnaire surveys to an XY Ordnance Survey grid reference and displayed these as point features within a GIS map (ArcGIS 9.3). Circular buffers of 300 m then were drawn around each point, representing a more accurate portrayal of an individual’s spatial context than if using larger, irregular statistical units of analysis ((
Hale et al. 2015). The team chose 300 m for the buffer, as this has been adopted in the UK as the standard for the minimum distance people should live from an accessible natural green space (see
Natural England 2010). These buffer zones, along with the ward boundary polygons, then were used to clip a set of features representing roads. Within each ward, a sub-set of these roads was chosen for the built environment audits. The first audits were undertaken within the Selly Oak ward. A total of 2600 m of road was surveyed, representing 10% of the total road length within the ward. The length of each type of road class to be surveyed was selected to reflect the proportions found within the broader ward (i.e., the proportion of A roads, B roads, minor roads and local streets
2). Finally, road sections were selected to ensure an even spread throughout the buffer zones, yielding approximately 40 road segments per ward to audit.
3 Once tested within the Selly Oak ward, the same total length of road was audited in each of the remaining three wards, weighted to reflect the differing proportions of road type.
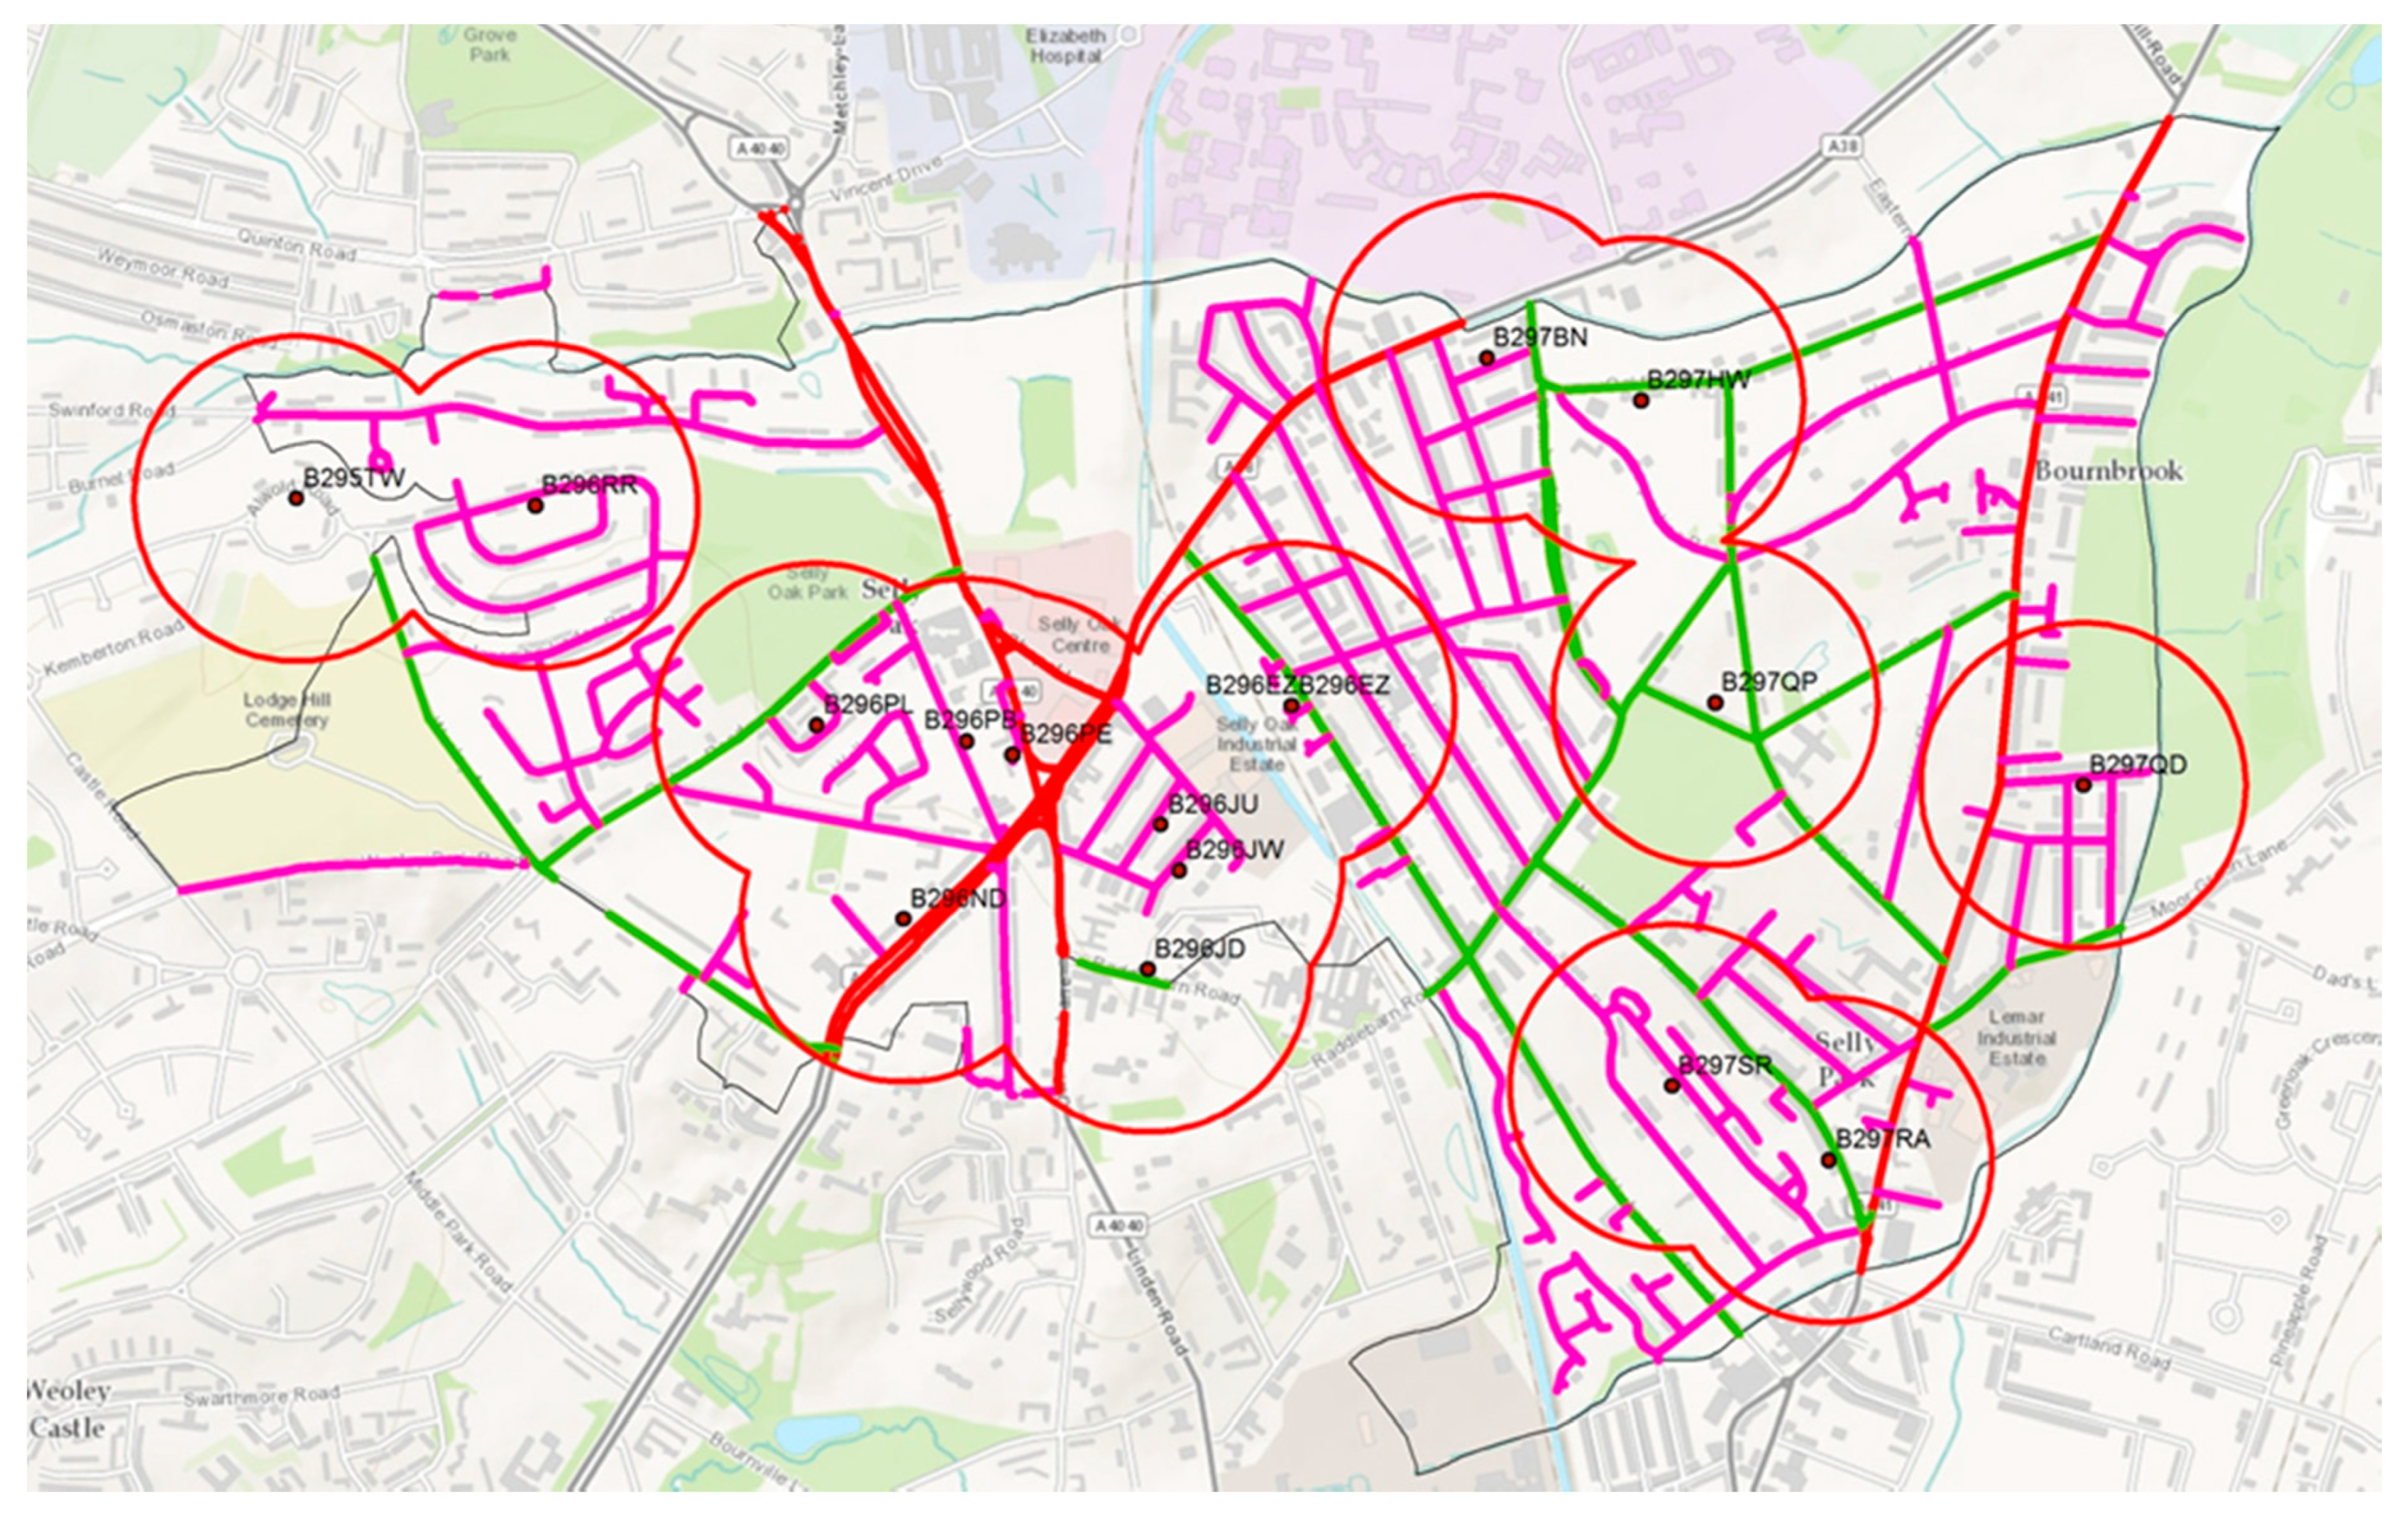
After the road segments were selected, two researchers divided the 40 road segments between them and used the app on their tablets to begin the audits (audits took place between 2013 and 2015). Audits started at the junction of the selected road and the intersecting road, and ended at the next junction. Each audit took between 10–25 min, depending on the complexity of the road (e.g., many mixed-use functions vs. residential only) (see
Figure 2).
5. Results
5.1. Well-Being Survey
A sample size of n = 96 included the four wards identified for the study. Multivariate analysis of variance (MANOVA) analysis was conducted to understand the well-being perception of residents based on the density and deprivation of the four wards. The analysis uncovered a statistically significant difference in well-being based on density and deprivation for the four wards in Birmingham, F (72, 189) = 2.183, p < 0.0005; Wilk’s Λ = 0.164, partial η2 = 0.453.
To understand further the actual difference in the mean score between the wards, post-hoc comparisons using Tukey HSD(honest significant difference) test were conducted (See
Table 1).
The analysis shows that low density/low deprivation participants perceived their ward to be more beautiful than did other participants. They also felt that the quality of green spaces in their ward—and to a lesser extent, access to green spaces—was better than did other participants. Regarding well-being (i.e., pertaining to happiness, optimism and satisfaction), low density/low deprivation and high density/high deprivation participants felt better than other participants, with high density/low deprivation participants feeling the worst about their well-being. With respect to the mental health pertaining to feeling of doing things that are worthwhile, low density/low deprivation participants fared well while high density/low deprivation participants felt the least worthwhile concerning the things they do in their life. In terms of public transport, low deprivation/low density participants used public transport less than other participants (although the significance of this relationship is not very strong). Finally, low density/high deprivation and high density/low deprivation participants strongly wished to have lived in a different house than did other participants.
5.2. Built Environment Audit
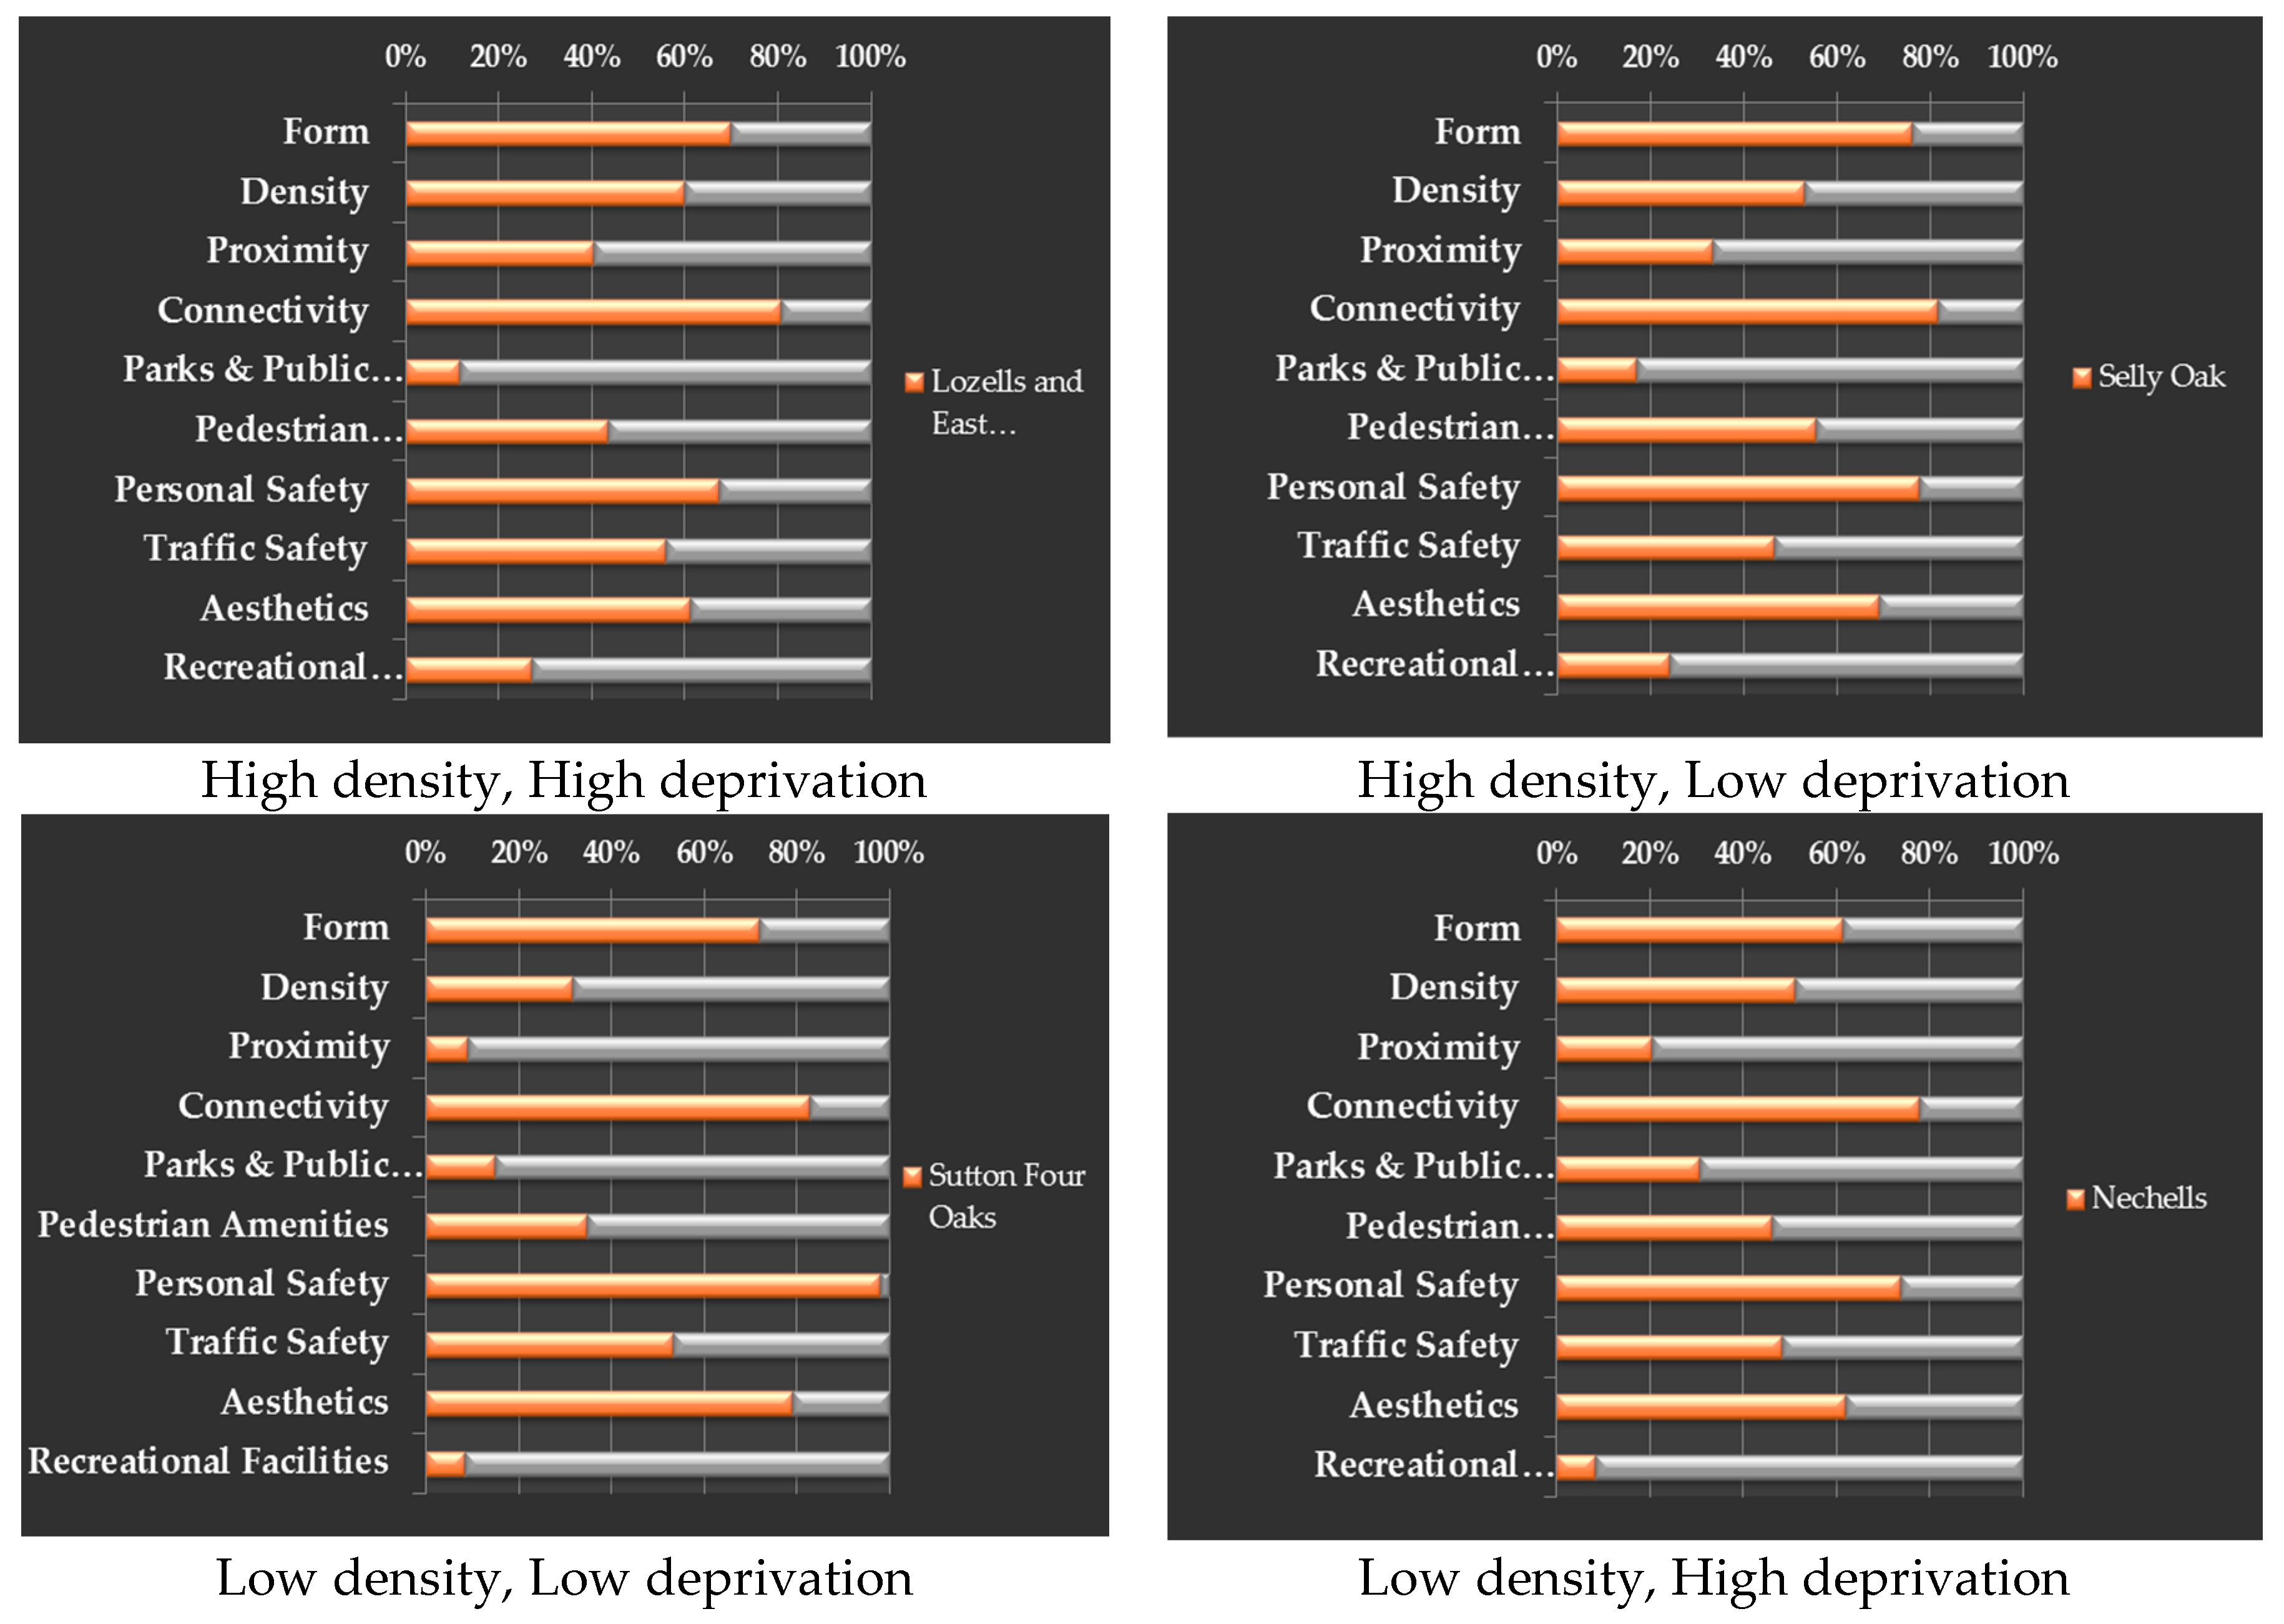
Table 2 shows the overall State of Place index score for the four wards and
Figure 3 shows the various scores in different aspects of BEA for the four wards.
The BEA shows that Selly Oak (HL) scored the highest, 57.7% in the overall State of Place index, with the highest score in terms of form (76.2%), pedestrian amenities (55.3%) and relatively higher scores in connectivity (81.7%), and recreational facilities (24.0 %). Nechells (LH) scored the lowest out of the four wards, with 48.3% in the overall State of Place index, with the lowest score in recreational facilities (8.2%), connectivity (77.8%), and relatively lower scores in personal safety (73.8%), traffic safety (48.3%) and aesthetics (62.0%).
Lozells and East Handsworth (HH) scored highest in terms of proximity (40.2%), traffic safety (56.0%) and recreation facilities (26.0%), and the lowest in terms of personal safety (67.3%) and parks and public spaces (11.7%).
Sutton Four Oaks (LL), which is second highest in the overall State of Place index, scored highest in terms of (82.7%), personal safety (98.0%), aesthetics (79.1%), and the lowest in terms of proximity (9.0 %), pedestrian amenities (34.5%), and recreational facilities (8.2%).
6. Analysis and Discussion
The well-being questionnaire analysis shows the following results.
In low density/low deprivation wards, residents were better off than others in terms of perceptions of exposure to favorable built environment features (i.e., neighborhood quality, quality and access to green spaces) and in terms of their health (i.e., happiness, satisfaction, optimism, feeling worthwhile). Perhaps such exposure leads these residents to like their homes and have a strong sense of pride in their city. While people living in high density/high deprivation areas perceive that they are not satisfied with the physical environment, they appear to have fairly good mental health in terms of happiness, satisfaction with their recent past and optimism for the recent future. People living in high density/low deprivation exhibited poor mental health (i.e., unhappy, pessimistic, not feeling worthwhile) and most wanted to live in a different house.
The BEA data tells a slightly different story.
6.1. Low Density/Low Deprivation Ward
Sutton Four Oaks showed relatively better environmental quality and its residents exhibited better health and well-being. Again, it is worthwhile to note that this neighborhood still performed poorly in the BEA in terms of proximity, parks and public spaces, recreational facilities, and pedestrian amenities. While scholars have suggested that people living in less deprived neighborhoods are able to find alternative options to overcome these drawbacks (e.g., traveling to other places, alternative mobility options) (
Jouffe et al. 2019;
Lang et al. 2008), potential health and well-being risks can occur due to lack of physical activity, lack of everyday social interactions facilitated by nearby parks/open spaces and so forth.
6.2. High Density/Low Deprivation Ward
Selly Oak had the highest State of Place score, reflecting the best walkability of the four wards. Examining the State of Place categories, this ward had good connectivity and pedestrian amenities, yet it also had relatively poor proximity to various facilities and places, which can have a considerable impact on residents’ everyday lives. Several studies show that good street design, offering better connectivity to amenities in the neighborhood, greatly influences travel practices and behavior that promote positive health benefits (
Ferreira et al. 2016). A lack of traffic safety also creates a sense of fear and anxiety in residents while navigating through the ward. Hence, while the State of Place index is seemingly good for the neighborhood, examining the inter-relationships between the various aspects of the BEA can be used to identify important links to health and well-being.
6.3. Low Density/High Deprivation Ward & High Density/High Deprivation Ward
Both these wards scored relatively poorly in the BEA yet exhibited better health and well-being among residents. Although these participants were not satisfied with the physical environment of their ward in terms of beauty, access and the quality of the parks, the ward environment seems to offer a better setting for developing positive health and well-being among its residents. The high density neighborhood shows increased proximity, connectivity and personal safety enabling residents to effectively perform their everyday social and work activities, which can positively influence their overall health and well-being (
Morrison et al. 2003). Such environments also allow residents to navigate and explore their neighborhood, developing familiarity and a sense of safety and security. It is also important to note that the BEA results for both these neighborhoods exhibit poor aesthetics in their physical settings, which can greatly influence individuals’ perceptions of their neighborhood, as residents might tend to lack a sense of belonging and pride in relation to their environment (
Leslie and Cerin 2008). The characteristic nature of high deprivation along with a negative perception of their neighborhoods can potentially develop negative impacts in their overall mental health. Similarly, another factor that can be identified as having a potential impact on the health and well-being of residents in the highly deprived neighborhood (Lozells and East Handsworth) is the lack of parks/open spaces and recreational facilities. Green and open spaces not only serve as places for relaxation, but also allow for social cohesion (
Groenewegen et al. 2012) and passive recreation among diverse user groups. The other highly deprived neighborhood, Nechells, reflects relatively poor connectivity that can tend to restrict peoples’ mobility patterns and practices, and reduces the overall efficiency in their everyday activities such as shopping, work and travel.
The analysis of built environment audit and well-being questionnaire data demonstrates the need to examine in detail the various factors of the physical environment that can offer critical insights in understanding well-being issues and also highlight impending health and well-being risks in diverse neighborhoods.
7. Findings
By comparing and correlating the well-being survey and built environment audit results, it can be understood that the wards with the lowest State of Place index do not necessarily reflect the poor health of the residents. It is equally important to note that there are significant relationships between residents’ health and well-being and certain aspects which determine the overall quality of streets and walkability in the neighborhoods. Examining density and deprivation parameters reveals the significance of the pertinent socio-spatial aspects in diverse neighborhoods that are embedded in the process of defining peoples’ perceptions and experiences of health and well-being (
Pearce et al. 2012). Also, it is worth noting the impact of citizen expectations, satisfaction and well-being in relation to the city on the socio-political institution and decision-making (
Yu 2019).
The case study demonstrated how, within different neighborhoods (varying in density and deprivation), looking into the multiple aspects of physical settings, in this case, mainly focusing on the green spaces, walkability and amenities, reveals the complex inter-relationship between the physical, environmental and social factors that plays a significant role in peoples’ perception and experience of well-being.
The Need for a Social Spatial Aproach to Health and Well-Bing
The inferences from the study interestingly also highlight that examining peoples’ practices and experiences using a socio-spatial lens can potentially explain the various factors that are embedded and linked to two parameters to peoples’ health and well-being. Traditionally, issues of well-being in cities have been largely investigated from more discipline-specific perspective and solutions are sought rather parochially. As social scientists focus on the economic and social impacts on well-being, health researchers largely explore factors of human psychological and the physical conditions affecting health and well-being, and planners and designers have been engaged in developing healthy cities through parks, green spaces and infrastructure development. Although today researchers and practitioners strive towards a holistic approach to well-being, there are studies which highlight the lack of a multidisciplinary approach to understanding and addressing the well-being challenges and complexities in cites (see, e.g.,
Freudenberg et al. 2009). While concepts of well-being involve positive physical, psychological and social states (
Huppert and Baylis 2004), most research rarely investigates the three states linked together. Many planning and public health policies that strive towards improving the overall quality of life and well-being of communities often fail due to a lack of a holistic approach to health and well-being.
With increasing inequalities in cities and associated complexities and challenges related to well-being, we suggest an integrated approach to health and well-being that can effectively address the challenges health inequalities and enable inclusive well-being. This approach focuses on the socio-spatial aspects in well-being which are largely neglected, often leading to a parochial understanding of various factors and issues of health and well-being.
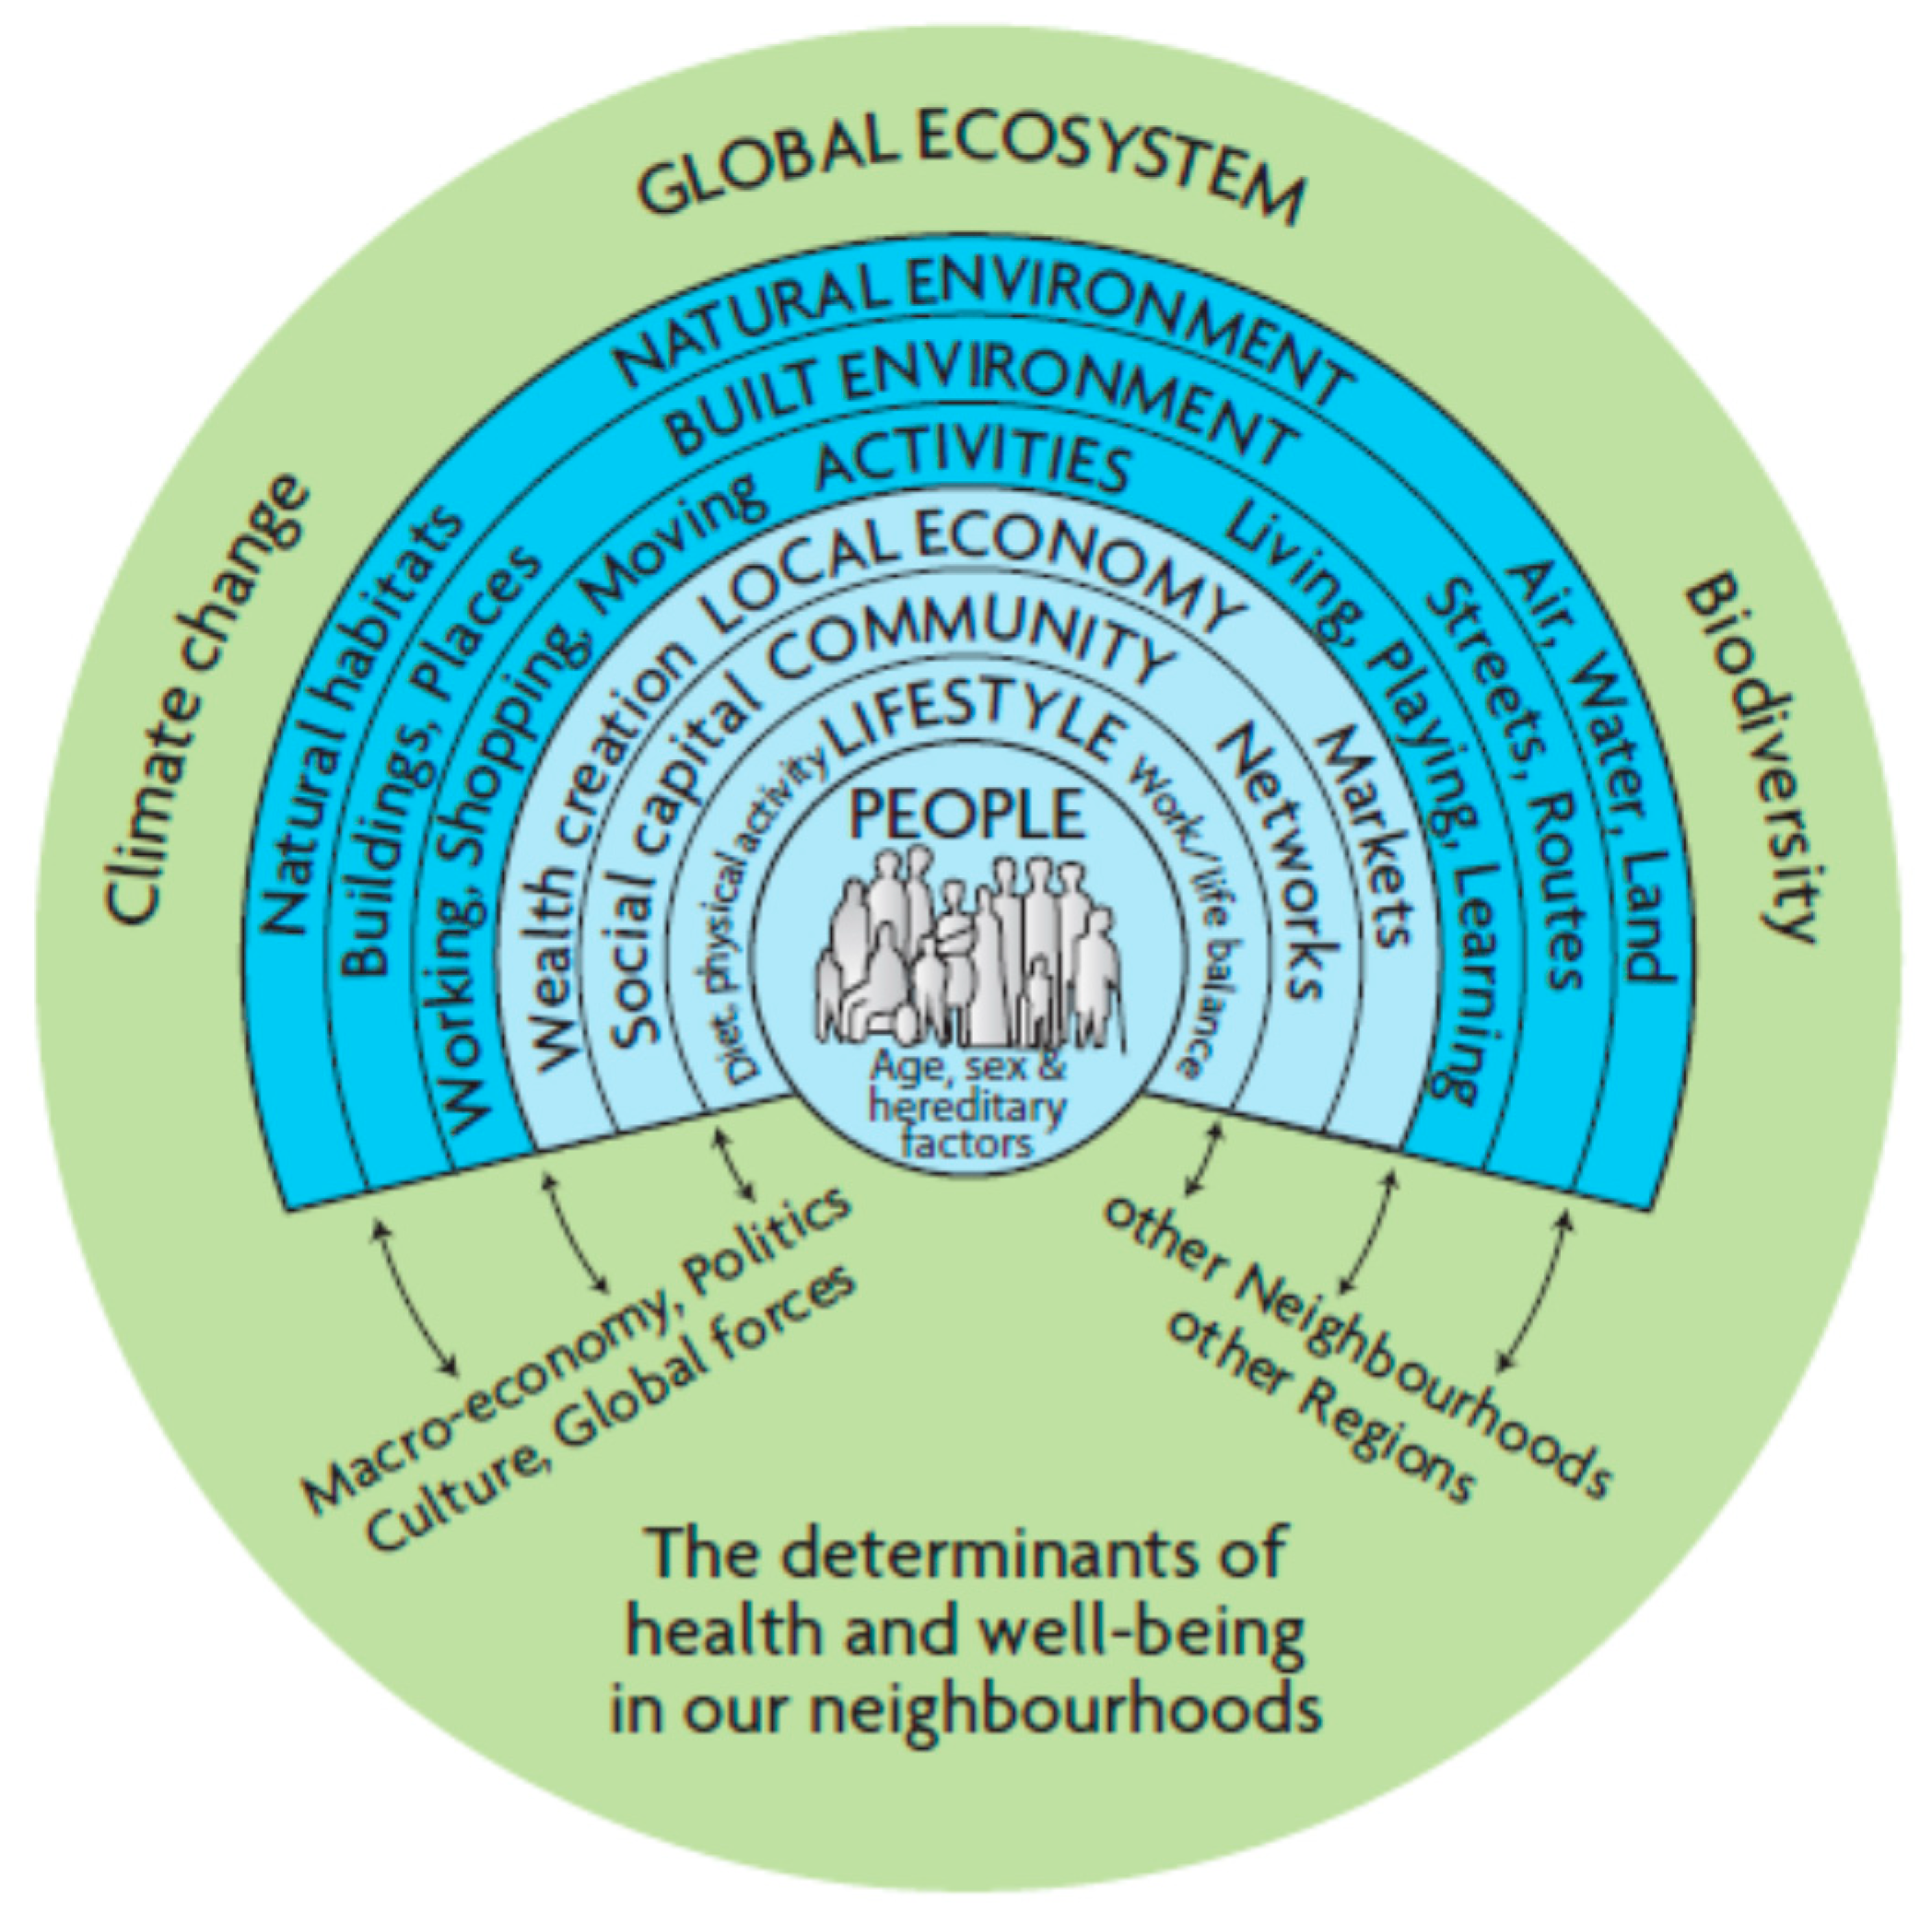
One of the comprehensive health determinant maps was produced by
Barton and Grant (
2006) (see
Figure 4). The different layers represent different levels of health and well-being determinants, particularly focusing on the neighborhood context. An important aspect while reading this health map is to understand that the relationship is bottom-up, and every ring proceeding inwards, with people at the core, needs to be understood both socially and spatially for effectively addressing various issues at each level: lifestyle, community, local economy, activities, built environment and natural environment. A socio-spatial view of Barton and Grant’s health and well-being determinant allows for human agency to be placed in its original contexts within its nested social system and nested physical environments which are crucial for understanding the impact of diverse factors influencing people satisfaction, experience and comfort (
Shin 2016).
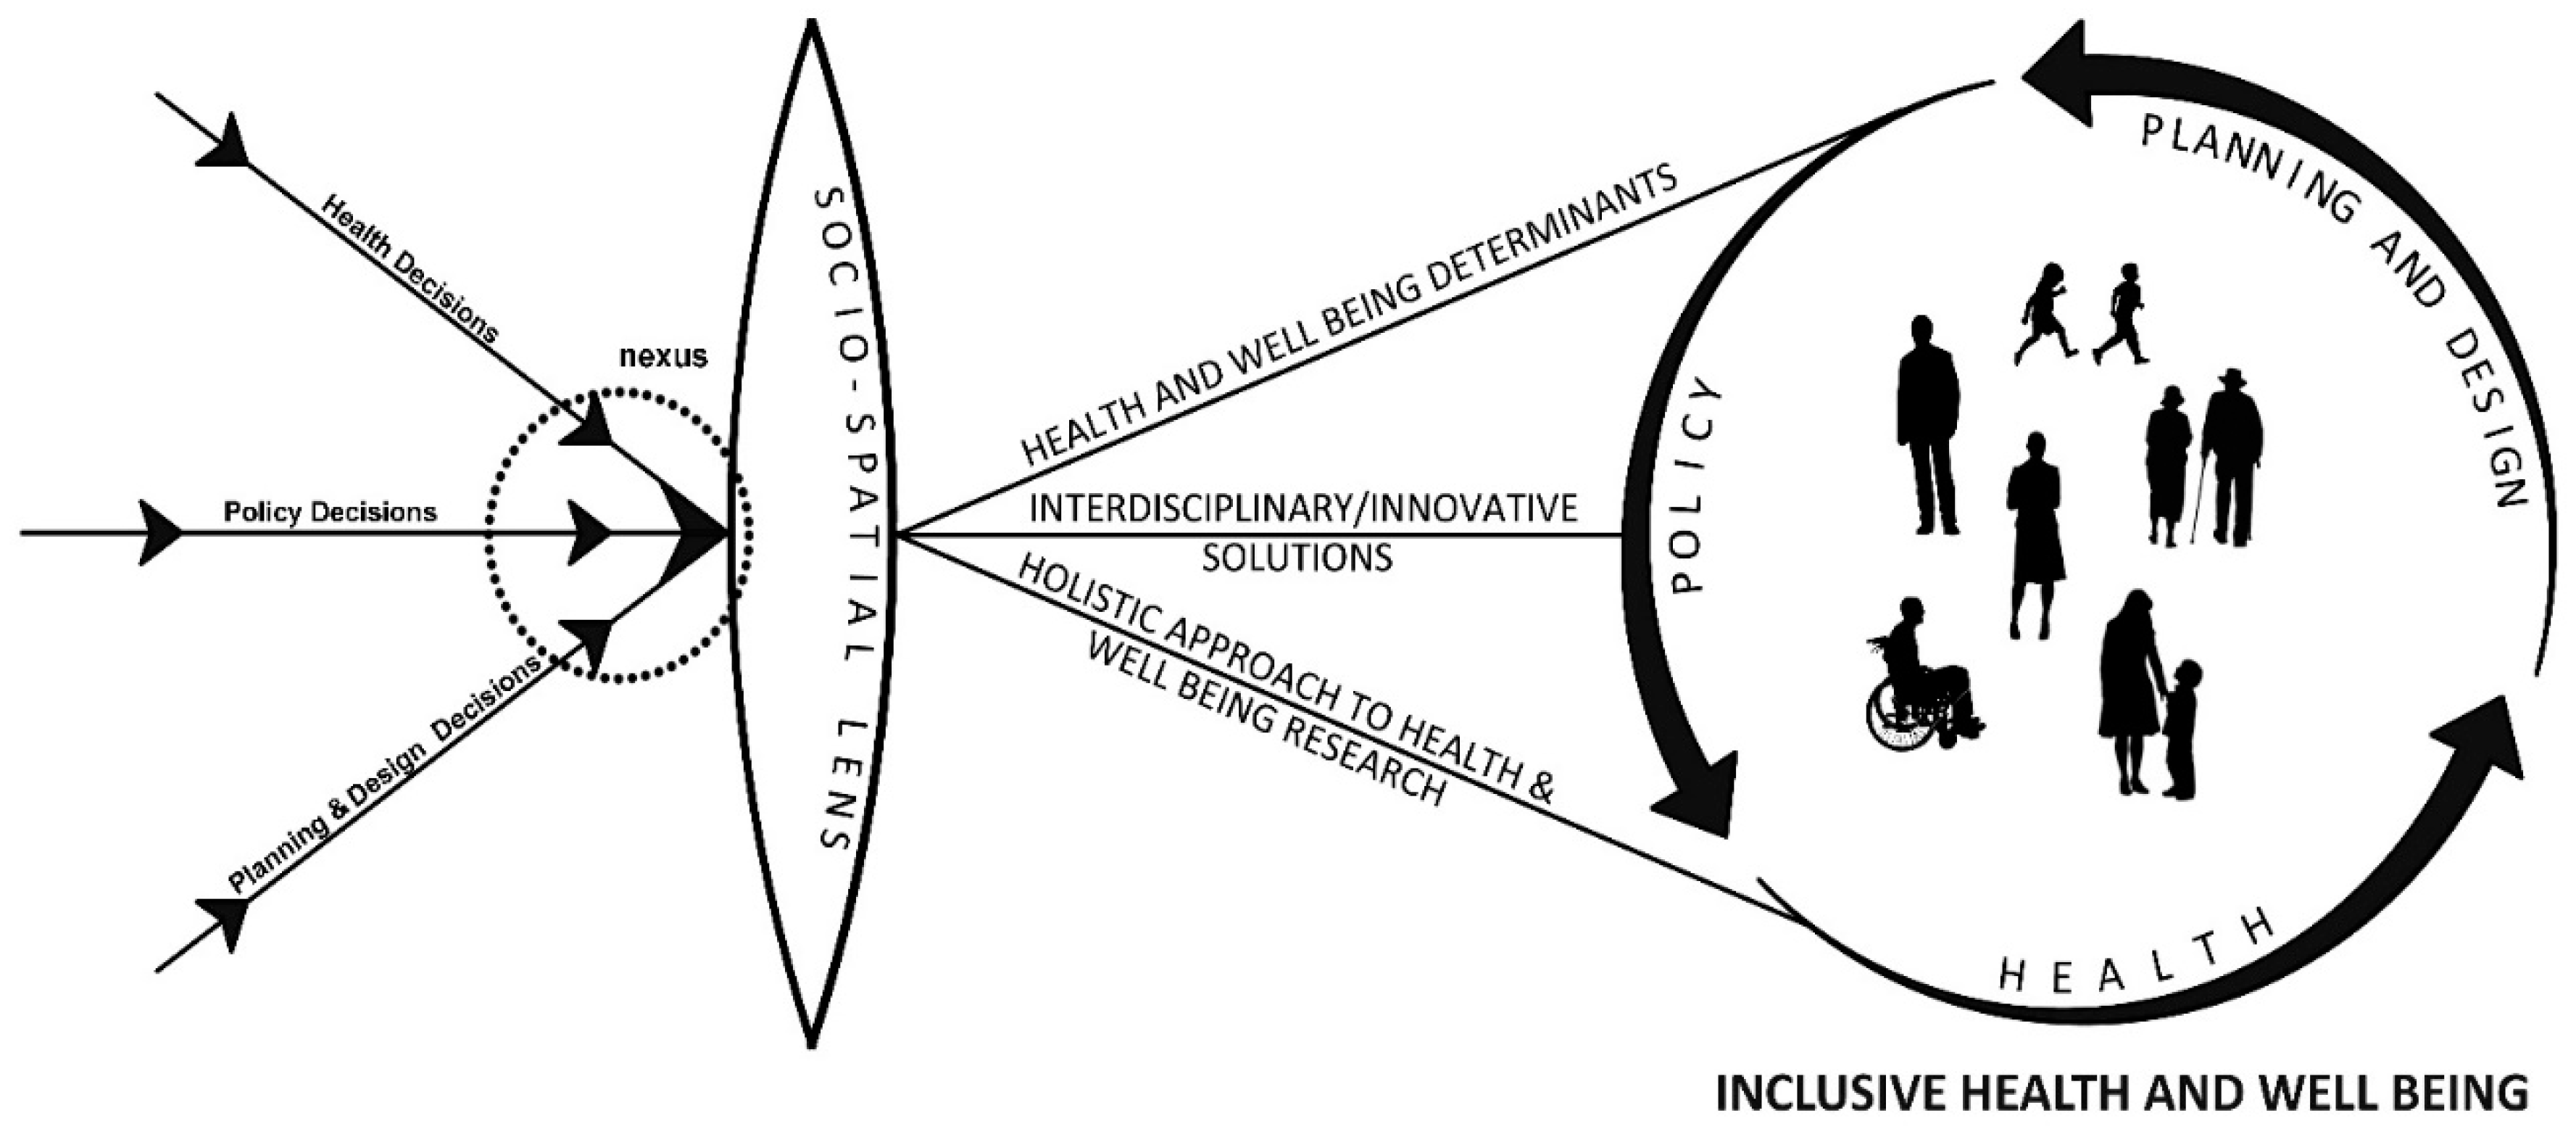
As increasing inequalities in cities are manifested through social and spatial structures within the urban environment, drawing from the case study inference we argue that a socio-spatial lens can potentially be the crux in health and well-being research. The proposed conceptual framework (See
Figure 5) suggests an interdisciplinary approach to enable inclusive well-being in cities. In this framework, health, policy, planning and design decisions for health and well-being can positively interact with one another when viewed through a socio-spatial lens. The framework considers urban well-being challenges at three different levels. First, at the design level via the development of a holistic approach that addresses the social, economic and environmental factors that impact and influence health and well-being in cities. Second, at the policy level through the formulation of an integrated policy framework for health and well-being. Third, at the implementation level via the coordination of various sectors and civic life that have a bearing on health outcomes. This conceptual framework for health and well-being research and decision-making will essentially include peoples’ social and spatial practices, perceptions and experiences of urban environments.
A nexus of health, policy and planning and design decisions, occurring by understanding the socio-spatial parameters, can lead to the three important outcomes stated below:
- -
It will help towards a comprehensive understanding of health and well-being determinants, including the natural environment, built environment, activities, economy, community, lifestyle and people (age, hereditary, sex) (
Barton and Grant 2006).
- -
It will bring together spatial, non-spatial and health disciplines to develop a more symbiotic relationship in research. As this will open new trajectories for interdisciplinary research, it can potentially offer innovative solutions/interventions to address the various challenges of health and well-being in cities.
- -
By embracing the social and spatial dimensions of health and well-being, the framework will encourage an integrated approach that can greatly facilitate and enable inclusive well-being in cities.
The framework can be used as a tool for understanding and approaching health and well-being research and issues in cities. For instance, the significance and complexity of Barton and Grant’s health map can be better understood using the proposed framework, as it reveals the interlacing of diverse determinants in each layer and also between layers at various levels at a neighborhood and city level. The framework enables researchers, practitioners and policy-makers to effectively contribute to addressing the well-being challenges at various scales with cities, such as the street, neighborhood and public space.
8. Conclusions
The case study used density and deprivation as parameters to understand health and well-being perceptions in diverse wards in Birmingham. The important role of street quality and walkability on residents’ well-being in the various wards was examined. The findings explained the significant inter-relationship between the socio-spatial practices, density and deprivation, and health and well-being of the residents in the case study areas. Drawing insights from the analysis and discussion, the article suggests an integrated conceptual framework for enabling inclusive health and well-being in cities. The proposed conceptual framework is developed as a tool that can potentially address the three-fold challenges of health and well-being at the design, policy and implemental levels. Although the proposed framework is conceptual, further qualitative and empirical data will be required to demonstrate how the framework can be used to delineate the interconnected and inter-related health and well-being factors, such as everyday practices, mobility, values, social and economic status, occupation, urban environment, perceptions, etc. This paper brings to light the complex and interrelated socio-spatial factors that are crucial in understanding and addressing health and well-being challenges in cities. The limitations of the study are its small sample specific to medium-sized wards, a need for rigorous statistical evaluations, and the lack of demographic and also qualitative data to delineate on the perceptions of people. Further research is needed to overcome these limitations which can facilitate exploring the reliability and transferability of the research findings. While the study has its limitations, it does demonstrate the significant interrelationship between various socio-spatial factors by focusing on density and deprivation parameters.
Author Contributions
R.F.D.C. conceived and designed the research; C.T.B. and C.J.C. designed the research and collected the data; Smith, J.D.H., contributed materials/analysis tools; L.P.R. and C.T.B. analyzed the data and wrote the paper. All authors have read and agreed to the published version of the manuscript.
Funding
This research was funded by the Engineering and Physical Sciences Research Council [EP/J017698/1].
Conflicts of Interest
The authors declare no conflict of interest. The funders had no role in the design of the study; in the collection, analyses, or interpretation of data; in the writing of the manuscript, or in the decision to publish the results.
References
- Bai, Xuemei, Indira Nath, Anthony Capon, Nordin Hasan, and Dov Jaron. 2012. Health and well-being in the changing urban environment: Complex challenges, scientific responses, and the way forward. Current Opinion in Environmental Sustainability 4: 465–72. [Google Scholar] [CrossRef]
- Barton, Hugh, and Marcus Grant. 2006. A health map for the local human habitat. The Journal of the Royal Society for the Promotion of Health 126: 252–53. [Google Scholar] [CrossRef]
- Bécares, Laia, Nna Cormack, and Ricci Harris. 2013. Ethnic density and area deprivation: Neighbourhood effects on Māori health and racial discrimination in Aotearoa/New Zealand. Social Science & Medicine (1982) 88: 76–82. [Google Scholar] [CrossRef]
- Boarnet, Marlon G., Kristen Day, Mariela Alfonzo, Ann Forsyth, and Michael Oakes. 2006. The Irvine-Minnesota Inventory to measure built environments: Reliability tests. American Journal of Preventive Medicine 30: 153–59. [Google Scholar] [CrossRef]
- Boyko, Christopher T., and Rachel Cooper. 2011. Clarifying and re-conceptualising density. Progress in Planning 76: 1–61. [Google Scholar] [CrossRef]
- Boyko, Christopher T., Rachel Cooper, and Cary Cooper. 2015. Measures to assess well-being in low-carbon-dioxide cities. Urban Design and Planning 168: 185–95. [Google Scholar] [CrossRef]
- Cooper, Rachel, Christopher T. Boyko, and Cary Cooper. 2015. Design for health: The relationship between design and noncommunicable diseases. Journal of Health Communication 16 Suppl. 2: 134–57. [Google Scholar] [CrossRef]
- Day, Kristen, Marlon Boarnet, Mariela Alfonzo, and Ann Forsyth. 2006. The Irvine-Minnesota Inventory to measure built environments: Development. American Journal of Preventive Medicine 30: 144–52. [Google Scholar] [CrossRef]
- Ferreira, Inês A., Maria Johansson, Catharina Sternudd, and Ferdinando Fornara. 2016. Transport walking in urban neighbourhoods—Impact of perceived neighbourhood qualities and emotional relationship. Landscape and Urban Planning 150: 60–69. [Google Scholar] [CrossRef]
- Frank, Lawrence D., James F. Sallis, Brian E. Saelens, Lauren Leary, Kelli Cain, Terry L. Conway, and Paul M. Hess. 2010. The development of a walkability index: Application to the neighbourhood quality of life study. British Journal of Sports Medicine 44: 924–33. [Google Scholar] [CrossRef]
- Freudenberg, Nicholas, Susan Klitzman, and Susan Saegert. 2009. Urban Health and Society: Interdisciplinary Approaches to Research and Practice. Hoboken: Wiley. [Google Scholar]
- Groenewegen, Pp, Agnes E. Van Den Berg, Jolanda Maas, Robert A. Verheij, and Sjerp De Vries. 2012. Is a Green Residential Environment Better for Health? If So, Why? Annals of the Association of American Geographers 102: 996–1003. [Google Scholar] [CrossRef]
- Guillaume, Elodie, Carole Pornet, Olivier Dejardin, Ludivine Launay, Roberto Lillini, Marina Vercelli, Marc Marí-Dell’Olmo, Amanda Fernandez-Fontelo, Carme Borrell, Ana Isabel Ribeiro, and et al. 2016. Development of a cross-cultural deprivation index in five European countries. Journal of Epidemiology and Community Health 70: 493–99. [Google Scholar] [CrossRef] [PubMed]
- Hale, James D., Alison J. Fairbrass, Thomas J. Matthews, Gemma Davies, and Jon P. Sadler. 2015. The ecological impact of city lighting scenarios: Exploring gap crossing thresholds for urban bats. Global Change Biology 21: 2467–78. [Google Scholar] [CrossRef] [PubMed]
- Humpel, Nancy, Neville Owen, and Eva Leslie. 2002. Environmental factors associated with adults’ participation in physical activity. A review. American Journal of Preventive Medicine 22: 188–99. [Google Scholar] [CrossRef]
- Huppert, Felicia, and Nick Baylis. 2004. Well-being: towards an integration of psychology, neurobiology and social science. Philosophical Transactions of the Royal Society B: Biological Sciences 359: 1447–51. [Google Scholar] [CrossRef]
- Jouffe, Yves, David Caubel, Sylvie Fol, and Benjamin Motte-Baumvol. 2019. Dealing with inequality in mobility: Tactics, strategies and projects for poor households on the outskirts of Paris. Cybergeo: European Journal of Geography [En ligne], Espace, Société, Territoire, document 708, mis en ligne le 15 Novembre 2019, consulté le 13 Juin 2020. Available online: http://journals.openedition.org/cybergeo/33479 (accessed on 2 June 2020). [CrossRef]
- Krupat, Edward. 1985. People in Cities: The Urban Environment and Its Effects. Cambridge: Cambridge University Press. [Google Scholar]
- Lang, Iain, David J. Llewellyn, Kenneth M. Langa, Robert B. Wallace, and David Melzer. 2008. Neighbourhood deprivation and incident mobility disability in older adults. Age and Ageing 37: 403–10. [Google Scholar] [CrossRef]
- Lawson, Bryan. 2009. The social and psychological issues of high-density city space. In Designing High-Density Cities: For Social and Environmental Sustainability. Edited by Edward Ng. London and Sterling: Routledge. [Google Scholar]
- Leslie, E., and Ester Cerin. 2008. Are perceptions of the local environment related to neighbourhood satisfaction and mental health in adults? Preventive Medicine 47: 273–78. [Google Scholar] [CrossRef]
- Maas, Jolanda, Robert A. Verheij, Peter P. Groenewegen, Sjerp De Vries, and Peter Spreeuwenberg. 2006. Green space, urbanity, and health: How strong is the relation? Journal of Epidemiology and Community Health 60: 587–92. [Google Scholar] [CrossRef]
- Martino, Lina. 2017. Concepts of Health, Wellbeing and Illness, and the Aetiology of Illness, Online Textbook Resource. Available online: https://www.healthknowledge.org.uk/public-health-textbook/medical-sociology-policy-economics/4a-concepts-health-illness (accessed on 2 June 2020).
- McCormack, Gavin, Billie Giles-Corti, Andrea Lange, T. Smith, K. Martin, and T. J. Pikora. 2004. An update of recent evidence of the relationship between objective and self-report measures of the physical environment and physical activity behaviours. Journal of Science and Medicine in Sport/Sports Medicine Australia 7 Suppl. 1: 81–92. [Google Scholar]
- Morrison, David S., Mark Petticrew, and Hilary Thomson. 2003. What are the most effective ways of improving population health through transport interventions? Evidence from systematic reviews. Journal of Epidemiology and Community Health 57: 327–33. [Google Scholar] [CrossRef]
- Natural England. 2010. Nature Nearby: Accessible Natural Greenspace Guidance. Sheffield: Natural England. [Google Scholar]
- New Economics Foundation. 2012. Measuring Wellbeing: A Guide for Practitioners. London: New Economics Foundation. [Google Scholar]
- Pearce, Jamie, Ross Barnett, and Graham Moon. 2012. Sociospatial inequalities in health-related behaviours Pathways linking place and smoking. Progress in Human Geography 36: 3–24. [Google Scholar] [CrossRef]
- Pickett, Kate, and Richard Wilkinson. 2010. The Spirit Level: Why Equality Is Better for Everyone, New Edition ed. London and New York: Penguin. [Google Scholar]
- Rocha, Vania, Ana Isabel Ribeiro, Milton Severo, Henrique Barros, and Sílvia Fraga. 2017. Neighborhood socioeconomic deprivation and health-related quality of life: A multilevel analysis. PLoS ONE 12. [Google Scholar] [CrossRef]
- Rowlingson, Karen. 2011. Does Income Inequality Cause Health and Social Problems? Available online: https://www.jrf.org.uk/report/does-income-inequality-cause-health-and-social-problems (accessed on 2 June 2020).
- Shin, Jung-Hye. 2016. Toward a theory of environmental satisfaction and human comfort: A process-oriented and contextually sensitive theoretical framework. Journal of Environmental Psychology 45: 11–21. [Google Scholar] [CrossRef]
- Simmel, Georg, and Kurt H. Wolff. 1950. The Sociology of Georg Simmel. New York: Simon and Schuster. [Google Scholar]
- Sizirmai, Adam, and Bart Verspagen. 2015. Manufacturing and economic growth in developing countries, 1950–2005. Structural Change and Economic Dynamics 34: 46–59. Available online: https://EconPapers.repec.org/RePEc:eee:streco:v:34:y:2015:i:c:p:46-59 (accessed on 2 June 2020). [CrossRef]
- Townsend, Peter. 1987. Deprivation. Journal of Social Policy 16: 125–46. [Google Scholar] [CrossRef]
- Vogli, Roberto De. 2011. Neoliberal globalisation and health in a time of economic crisis. Social Theory & Health 9: 311–25. [Google Scholar] [CrossRef]
- Ward, Jonathan S., Scott Duncan, Aaron Jarden, and Tom Stewart. 2016. The impact of children’s exposure to greenspace on physical activity, cognitive development, emotional well-being, and ability to appraise risk. Health & Place 40: 44–50. [Google Scholar] [CrossRef]
- WHO. 2006. Constitution of the World Health Organization. Available online: www.who.int/governance/eb/who_constitution_en.pdf (accessed on 2 June 2020).
- United Nations Report. 2018. World Urbanization Prospects. Available online: https://population.un.org/wup/Publications/Files/WUP2018-Report.pdf (accessed on 2 June 2020).
- Yin, Robert K. 2014. Case Study Research: Design and Methods. Los Angeles: Sage. [Google Scholar]
- Yu, Noda. 2019. Citizen expectations and satisfaction of service performance: Lessons from subnational governments in Japan. Asia Pacific Journal of Public Administration 41: 142–56. [Google Scholar]
| 1 | In two of the wards, Sutton Four Oaks and Lozells and East Handsworth, researchers worked with additional Liveable Cities researchers who were undertaking focus groups on mobilities in the wards. Participants who were recruited for the focus groups were given the well-being questionnaire to complete before each focus group began. |
| 2 | A Roads are public roads that connect areas of regional importance; B roads are public roads that connect areas of local importance; minor roads are public roads that connect to A or B roads and may be unclassified; local streets are public roads that provide access to land and/or dwellings and generally not intended for through traffic (Department for Transport n.d.). |
| 3 | Road segments refer to a portion of a total road that sits between junctions. For example, High Street is a total road; a road segment is the portion of High Street that is between High Street and Market Street, and between High Street and Dale Street. |
© 2020 by the authors. Licensee MDPI, Basel, Switzerland. This article is an open access article distributed under the terms and conditions of the Creative Commons Attribution (CC BY) license (http://creativecommons.org/licenses/by/4.0/).


 ,
, 


