Article

Intermediate Cluster Disinfection: Which Disinfection Solution Is Most Effective on Milking Liners? A Comparison of Microorganism Reduction on Liner Inner Surfaces Using Quantitative Swab Sampling Technique

1
Department of Microbiology, Faculty of Mechanical and Bioprocess Engineering, University of Applied Sciences and Arts, 30452 Hannover, Germany
2
Faculty Engineering and Health, University of Applied Sciences and Arts, 37085 Goettingen, Germany
3
Department of Veterinary and Animal Sciences, University of Copenhagen, 1870 Frederiksberg C, Denmark
*
Author to whom correspondence should be addressed.
Pathogens 2023, 12(4), 560; https://doi.org/10.3390/pathogens12040560
Submission received: 11 March 2023 / Revised: 29 March 2023 / Accepted: 3 April 2023 / Published: 6 April 2023
(This article belongs to the Special Issue Pathogens in Ruminant Mastitis)

Abstract

:
During machine milking, pathogenic microorganisms can be transmitted from cow to cow through liners. Therefore, in Germany, a spray method for the intermediate disinfection of the milking cluster is often used for prevention. This method of cluster disinfection is easy to perform, requires little time and no extra materials, and the disinfection solution is safe from outside contamination in the spray bottle. Since no data on a systematic efficacy trial are available, the aim of this study was to determine the microbial reduction effect of intermediate disinfection. Therefore, laboratory and field trials were conducted. In both trials, two sprays of 0.85 mL per burst of different disinfectant solutions were sprayed into the contaminated liners. For sampling, a quantitative swabbing method using a modified wet–dry swab (WDS) technique based on DIN 10113-1: 1997-07 was applied. Thus, the effectiveness of disinfectants based on Peracetic Acid, Hydrogen Peroxide and Plasma-Activated Buffered Solution (PABS) was compared. In the laboratory trial, the inner surfaces of liners were contaminated with pure cultures of Escherichia (E.) coli, Staphylococcus (S.) aureus, Streptococcus (Sc.) uberis and Sc. agalactiae. The disinfection of the contaminated liners with the disinfectants resulted in a significant reduction in bacteria with values averaging 1 log for E. coli, 0.7 log for S. aureus, 0.7 log for Sc. uberis and 0.8 log for Sc. agalactiae. The highest reduction was obtained for contamination with E. coli (1.3 log) and Sc. uberis (0.8 log) when PABS was applied and for contamination with S. aureus (1.1 log) and Sc. agalactiae (1 log) when Peracetic Acid Solution (PAS) was used. Treatment with sterile water only led to an average reduction of 0.4 log. In the field trial, after the milking of 575 cows, the liners were disinfected and the total microorganism count from the liner surface was performed. The reduction was measured against an untreated liner within the cluster. Although a reduction in microorganisms was achieved in the field trial, it was not significant. When using PAS, a log reduction of 0.3 was achieved; when using PABS, a log reduction of 0.2 was obtained. The difference between the two disinfection methods was also not significant. Treatment with sterile water only led to a reduction of 0.1 log. The results show that spray disinfection under these circumstances does result in a reduction in the bacteria on the milking liner surface, but for effective disinfection a higher reduction would be preferred.

1. Introduction

Mastitis is considered to be the most important disease in the dairy cattle sector from an economic point of view [1]. Due to the multifactorial nature of mastitis, it is necessary to prevent not only the transmission of pathogenic microorganisms from the environment, e.g., through the good cleanliness of the barn [2,3,4], but also the transmission of pathogens from cow to cow or quarter to quarter during milking. One possibility for the transmission of mastitis pathogens is the contamination of the teat skin and teat canal during milking [5,6]. In particular, cow-associated microorganisms are pathogens that are transmitted during milking via teat liners [7,8,9]. However, teat liners have also been shown in the past to be contaminated with environmental pathogens, such as Sc. uberis, after the milking of infected cows [10,11]. Thus, regardless of the pathogen group and species, the contamination of the liner, which is the direct connection between the udder and the milking machine, is possible [12].
As a preventive measure against the spread of mastitis pathogens during the milking process, the intermediate disinfection of the milking cluster is used and recommended in problem herds in Germany [12], as it is a way to prevent pathogen transmission [13,14]. On farms using automatic milking systems, without classical milking order as in conventionally milked herds and with considerably more cows using a milking cluster throughout the day, the intermediate disinfection of the milking clusters is essential [12,15,16].
Various methods are available for intermediate disinfection, such as dipping the cluster into a bucket, spraying the liners and various other commercially available disinfection systems such as backflush systems [17,18]. Köster et al. [19] showed that, out of 96 herds in Brandenburg, Germany, 65.1% of farms performed cluster disinfection after each cow and 3.8% of farms disinfectedthe cluster after the milking of mastitis cows. Different disinfection methods were used, the most common being disinfection performed by dipping the cluster inside of a bucket with a disinfectant. In most cases, a 0.1% Peracetic Acid Solution (PAS) was used as the solution for intermediate disinfection, when disinfection was carried out by hand. Preparations containing PAS show a good bactericidal effect, have a broad spectrum of activity and are effective over a wide temperature range [20,21,22]. Due to its rapid action and decomposition into acetic acid, water and oxygen, it is considered harmless from the point of view of residue hygiene, so that no withdrawal time results from its use [23,24]. In the case of a herd problem with cow-associated pathogens, such as S. aureus, for example, intermediate disinfection with PAS could lead to success [25]. Other disinfection solutions available on the market are ready-to-use mixtures containing hydrogen peroxide, peracetic acid and acetic acid, which are used for the standard disinfection of milking clusters, milking robot brushes and udder cloths. Like PAS, these must be diluted with water to an appropriate concentration before use. In an undiluted state, they can be irritating to the respiratory tract as well as to the eyes and skin [20,22].
As an environmentally friendly, non-thermal and non-toxic alternative to the conventional disinfectants, Plasma-Activated Liquids (PALs), such as Plasma-Activated Water and Plasma-Activated Buffered Solution (PABS), are described by many authors and increasingly being tested in the food industry [26,27,28]. Reactive oxygen and nitrogen species (RONS) are generated by the reaction of water or buffered solutions during plasma treatment, resulting in high biochemical activity. That is why they are used in biomedicine for various applications, for example, to remove biofilms, heal wounds, treat cancer and also inactivate bacteria [26,29]. For the wide use of PALs, especially in the inactivation of microorganisms, the transfer and solvation of RONS from the gas phase to the liquid phase is essential [30]. To these RONS belong long-lived species, such as nitrates, nitrites, hydrogen peroxide and ozone, but also short-lived radicals, such as hydroxyl radicals or atomic oxygen [26,31]. Thus, despite their fluctuating composition, the PALs produced can be used for several days depending on the storage temperature due to their remaining antimicrobial effect [32]. Even though it is already known that plasma-induced oxidative stress causes damage to the cell wall, proteins and DNA of bacteria [33,34], it is necessary to understand more precisely which RONS are involved crucially in the antimicrobial effect of PALs to improve the disinfection process [30].
Using the various intermediate disinfection methods, it is assumed that bacterial reduction will be achieved on the surface of the liners [5,18,35,36]. In former studies, it has already been shown, by means of swab samples, that pathogenic microorganisms could no longer be detected on the liner surface after disinfection [25,37]. However, the exact reduction in the surface microbial count on the liner is unknown, as a quantitative method is needed to determine it, which is mostly not used in practice. Therefore, in a previous study, a swab method was defined that is suitable for the quantitative detection of the surface bacterial count on the liner, using a modified wet–dry swab (WDS) technique in accordance to DIN 10113-1: 1997-07 [38]. This quantitative swab method on the liner can be used to measure the actual level of liner contamination and the reduction in the surface bacterial count due to disinfection with the various disinfectants available. For this purpose, both a laboratory trial and a field trial were carried out in this study to compare the microorganism reduction on liner inner surfaces after using different disinfection solutions using a quantitative swab sampling technique.

2. Materials and Methods

2.1. Laboratory Trial

In the laboratory trial, liners were contaminated with four different mastitis pathogens, by dipping them into contaminated milk for 5 s. After contamination and subsequent disinfection, the liners were sampled. For the contamination of the liners in the laboratory study, pathogen isolates of E. coli (DSMZ 1300), S. aureus (ATCC 700407), Sc. uberis (ATCC 12600) and Sc. agalactiae (wild isolate, Hanover University of Applied Sciences and Arts, St. No. 11881) were used. They were stored at −80 °C with the addition of glycerol until assayed, as is common practice for the long-term storage of bacteria [39]. The preculturing of each pathogen from the strain was performed for 24 h at 37 °C in brain–heart broth (Carl Roth GmbH & Co. KG, Karlsruhe, Germany). For the main culture, 10 µL of the preculture was incubated for 24 h at 37 °C in brain–heart broth again. Then, 40 µL of the different main cultures were each mixed with 399.96 mL of raw milk that had previously been thermized in a water bath at 60 °C for 50 min. Thus, a contaminated milk with a bacterial density of 104 colony-forming units/mL (cfu/mL) was prepared and enumerated by the plate count method (Plate Count Agar with Powdered Milk, Carl Roth GmbH & Co. KG, Karlsruhe, Germany). These bacterial concentrations in the inoculated milk are representative of concentrations that can be found in intramammary infections [40], but they do not definitely indicate the level of bacteria that adhere to the liner surface. Autoclaved liners out of nitrile butadiene rubber (NBR) (WS029U, Milkrite, Aulendorf, Germany), which had been used for 2000 times over a 7-month period on one farm, were immersed upside down to a depth of 9 cm in the contaminated milk for 5 s. After inoculation, the liners were turned upside down for 60 s to dry. Subsequently, the inner surfaces of the liners were disinfected with either PAS (APPLICHEM GmbH, Darmstadt, Germany) at a concentration of 0.1%, PABS or the ready-to-use mixture of hydrogen peroxide, peracetic acid and acetic acid (MS TMC Flush, Schippers Europe B.V, Kerken, Germany) at a concentration of 1.25% or sterile water. For disinfection, two sprays of 0.85 mL each of the solutions at room temperature were applied into the openings of the liners with spray bottles. After an exposure time of 30 s, the samples were collected by swabbing as described in the previous study [38] (see Figure 1). For the positive control, the samples were taken immediately after the drying time without applying any disinfectant solution. For the negative control, the liner was immersed in a non-contaminated milk and sampled after the drying time. A total of 64 samples were taken, 15 each with contamination by the different strains. Of these, 3 samples each were treated with the different disinfectants, as well as the sterile water. Further, 3 samples per pathogen were sampled as positive controls undisinfected. In addition, 4 negative controls, without contamination, were prepared.

2.2. Field Trial

Samples for the field trial were collected in July 2022 from a farm with 575 milking cows, after all animals had been milked and before the milking equipment was cleaned and disinfected. For this purpose, one of the liners of each cluster was disinfected with PAS at a concentration of 0.1% and one with PABS. The third liner was treated with sterile water, and the fourth was left untreated. The application of the disinfection solutions was carried out at an external temperature of 22 °C. The selection of the position of the different treatments was randomized by sticking a different colored tape to each liner of the milking cluster. Each color corresponded to the application of a different disinfectant. The selection was made randomly. To disinfect the liner, two spray shots of 0.85 mL were placed inside the liner held horizontally, using the same spray bottles as in the laboratory study (see Figure 1). During the exposure time of 30 s, the cluster was left hanging. A total of 160 swab samples were collected from 40 milking clusters using the same technique as in the laboratory experiment: 40 untreated samples, 40 samples with sterile water, 40 samples with PABS and 40 samples with PAS were taken. The samples were brought to the laboratory and refrigerated at 7 °C within two hours.

2.3. Sampling Technique

Samples were collected by a WDS method in accordance to DIN 10113-1: 1997-07 using cosmetic supply swabs with a bamboo handle and a tip made of bisphenol A (BPA)-free cotton (Outdoor Freakz GmbH, Zossen, Germany) that were heat-sterilized at 140 °C for 2 h to avoid contamination, as they were not sterile packaged (see Figure 1). The swab solution was a quarter-strength Ringer’s solution (Merck Kgaa, Darmstadt, Germany) to which 2.2% sodium thiosulfate (APPLICHEM GmbH, Darmstadt, Germany) and 0.2% catalase (Carl Roth GmbH & Co. KG, Karlsruhe, Germany) were added as disinhibitors. An amount of 3 mL of the solution was used as a swab medium. Two swabs were applied for one sample. The first swab was moistened with the solution by dipping it for 5 s, and excess liquid was squeezed out at the edge of the sample tube. After swabbing the surface, a second, dry swab was used on the same surface as the first swab. The sampling area was kept constant by taking all swab samples at a depth of 5 cm in a 360° rotation while the swab itself was rotated, passing the swab only once over the sampling area. The contact pressure applied to the cotton swab was sufficient to bend the wooden stick. After sampling, both swabs were placed in the same test tube. To avoid the contamination of the swab medium through the samplers, the bamboo handles of the swabs were broken off, when bringing them into the sample tube. The sampling was performed by 1 person in the laboratory trial and by 4 different persons in the field trial, with each person sampling 10 complete milking clusters.

2.4. Microbiological Analysis

Tubes with samples were vortexed for 60 s to transfer the pathogens adhering to the cotton tips of the swabs into the swab medium. Serial dilutions were plated on PCM Agar in duplicate (Carl Roth GmbH & Co. KG, Karlsruhe, Germany) in accordance with the §64 LFGB (German Food and Feed Code) method: L 00.00-54. For the lab trial, 1 mL and 0.1 mL of each sample were plated in duplicate. As the samples on the farm were assumed to be more contaminated, a further dilution step was made (10−2). The plates were counted after 72 h of incubation at 30 °C, using a colony counting method, considering all plates with growth between 10 and 300 colonies (see Figure 1). The weighted arithmetic mean in cfu/mL of all the evaluable dilution levels of a sample in accordance with §64 LFGB (German Food and Feed Code) method L 01.00-57 was converted to cfu per square centimeter (cfu/cm2) in adjustment to the swab area. For the calculation, the circumference of 7.85 cm of the inside of the liner at a depth of 5 cm was used and multiplied by the contact area of the swab tips to obtain a swab area of 6.28 cm2.

2.5. Statistical Analysis

The data obtained were collected in Microsoft Excel and analyzed using the SPSS 28.0 program, SPSS Inc. (Chicago, IL, USA). The outcome variable “cfu/cm2 of a pathogen” was transformed to approximate a normal distribution and tested with the Kolmogorov–Smirnov test. Since the data collected in the study did not show a normal distribution, they were normalized by adding 1 and applying the log10 transformation. Factors associated with the outcome variable were identified with an analysis of variance and post hoc analysis using the Bonferroni test to reveal significant differences between group means. Statistical significance was defined as p < 0.05.

2.6. Plasma Device and Production of PABS

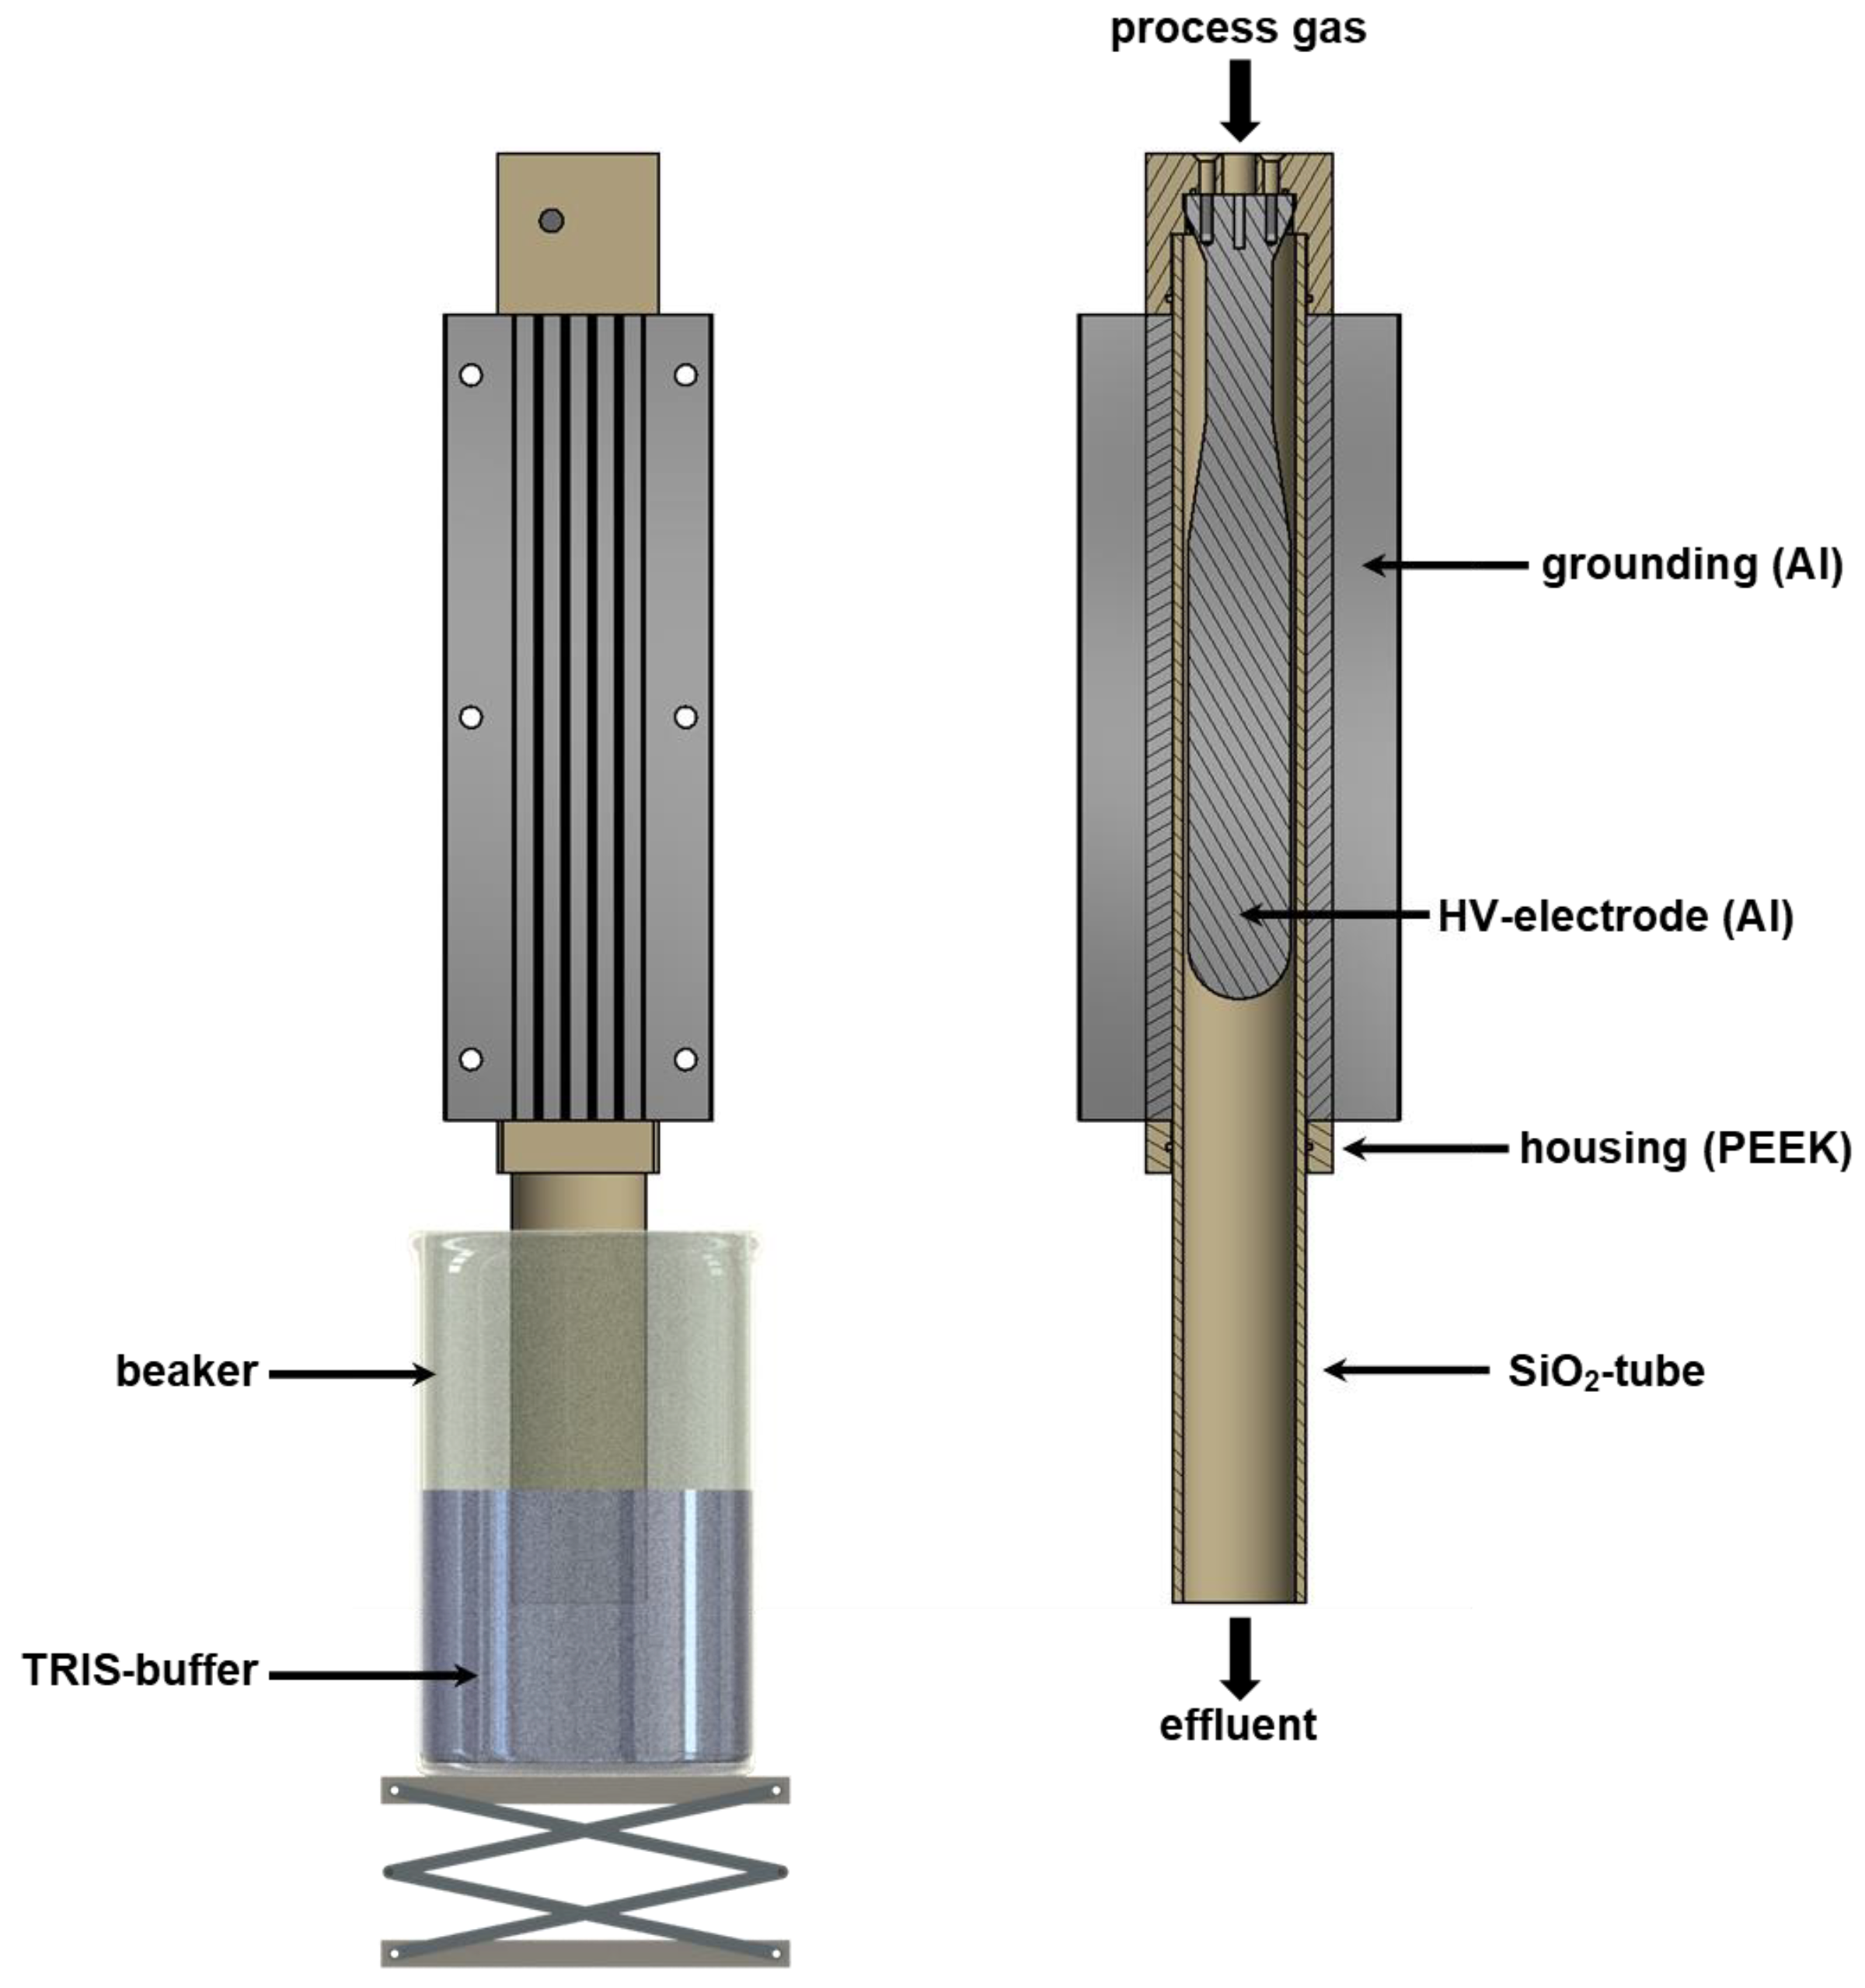
The PABS was produced using a plasma source developed by the faculty of engineering and health (HAWK, University of Applied Science and Arts, Göttingen, Germany) for the production of PABS based on the principle of a single-insulated dielectric barrier discharge (DBD). The complete setup for the generation of PABS consists of an outer radially symmetrical silica tube (total length: 300 mm, outer diameter: 46.7 mm, inner diameter: 43.3 mm) acting as insulator. A cooling unit consisting of an Al block with milled cooling fins, which also serves as the ground electrode (GND), surrounds the tube. Within the silica tube, an Al cylinder is centrally positioned acting as a high-voltage electrode (Figure 2). The Al cylinder has an outer diameter of 40 mm with a length of 400 mm. The geometry results in a discharge gap of approx. 1.7 mm, with a discharge length of approx. 200 mm (see Figure 2). The discharge gap is streamed with pressure air as it processes gas at a gas volume flow-rate of 50 L min−1. The quartz tube protrudes approx. 35 mm into a beaker filled with a 0.5 molar TRIS-buffer solution. The distance between the end of the discharge section and the water surface is approx. 190 mm, so that the plasma “exhaust” contacts water after approx. 0.4 s after exiting the plasma zone. The high-voltage power supply (Tantec HV-X20 Generator, transformer 13.5 kV, Denmark) provides sinusoidal waveform (U = 11.7 kV, peak-peak) with a repetition frequency of 17.2 kHz and an electrical power output of approx. 850 W. An amount of 0.25 L of TRIS-buffer (0.5 mol/L) out of TRIS(hydroxymethyl)aminomethan (TRIS, Trometamol, ≥99.8%, VWR International, Darmstadt, Germany) and TRIS-HCl (TRIS(hydroxymethyl)aminomethane hydrochlorid, ≥99.0%, VWR International, Darmstadt, Germany) was treated with the described plasma source for 40 min to obtain approx. 0.2 L PABS with a neutral pH value. According to Hoeben et al. [29], the determination of nitrate, nitrite and hydrogen peroxide is a quick way to conduct a basic characterization of PAL. A Reflectoquant (Merck KGaA, Darmstadt, Germany) was used to measure the concentrations of nitrate anions (NO3; approx. 7700 mg/L) and nitrite anions (NO2; approx. 1200 mg/L), as well as hydrogen peroxide (H2O2; approx. 2.7 mg/L) concentrations in the PABS. The PABS sample was transported at room temperature within 4 h after preparation to the Hanover University of Applied Sciences and Arts and stored at 7 °C for 12 h before performing the trials.

3. Results

3.1. Lab Trial

In the laboratory test, a total of 64 swab samples were collected from liners contaminated with the 4 different pathogens. The bacterial density in the milk was 2 × 10⁴ cfu/mL for E. coli, 1.5 × 10⁴ cfu/mL for S. aureus, 1 × 10⁴ cfu/mL for Sc. uberis and 2.4 × 10⁴ cfu/mL for Sc. agalactiae. Thus, for all different pathogens, the contamination on the liners was about 2.1 log10((cfu + 1)/cm2) (E. coli: 2.172 log10((cfu + 1)/cm2, S. aureus: 2.138 log10((cfu + 1)/cm2), Sc. uberis: 2.129 log10((cfu + 1)/cm2), Sc. agalactiae: 2.132 log10((cfu + 1)/cm2)).
The individual disinfectants achieved bacterial reductions of varying degrees for the different pathogens (Table 1). A reduction in pathogens also occurred when sterile water was used. Table 2 lists all multiple comparisons of the significant mean differences.
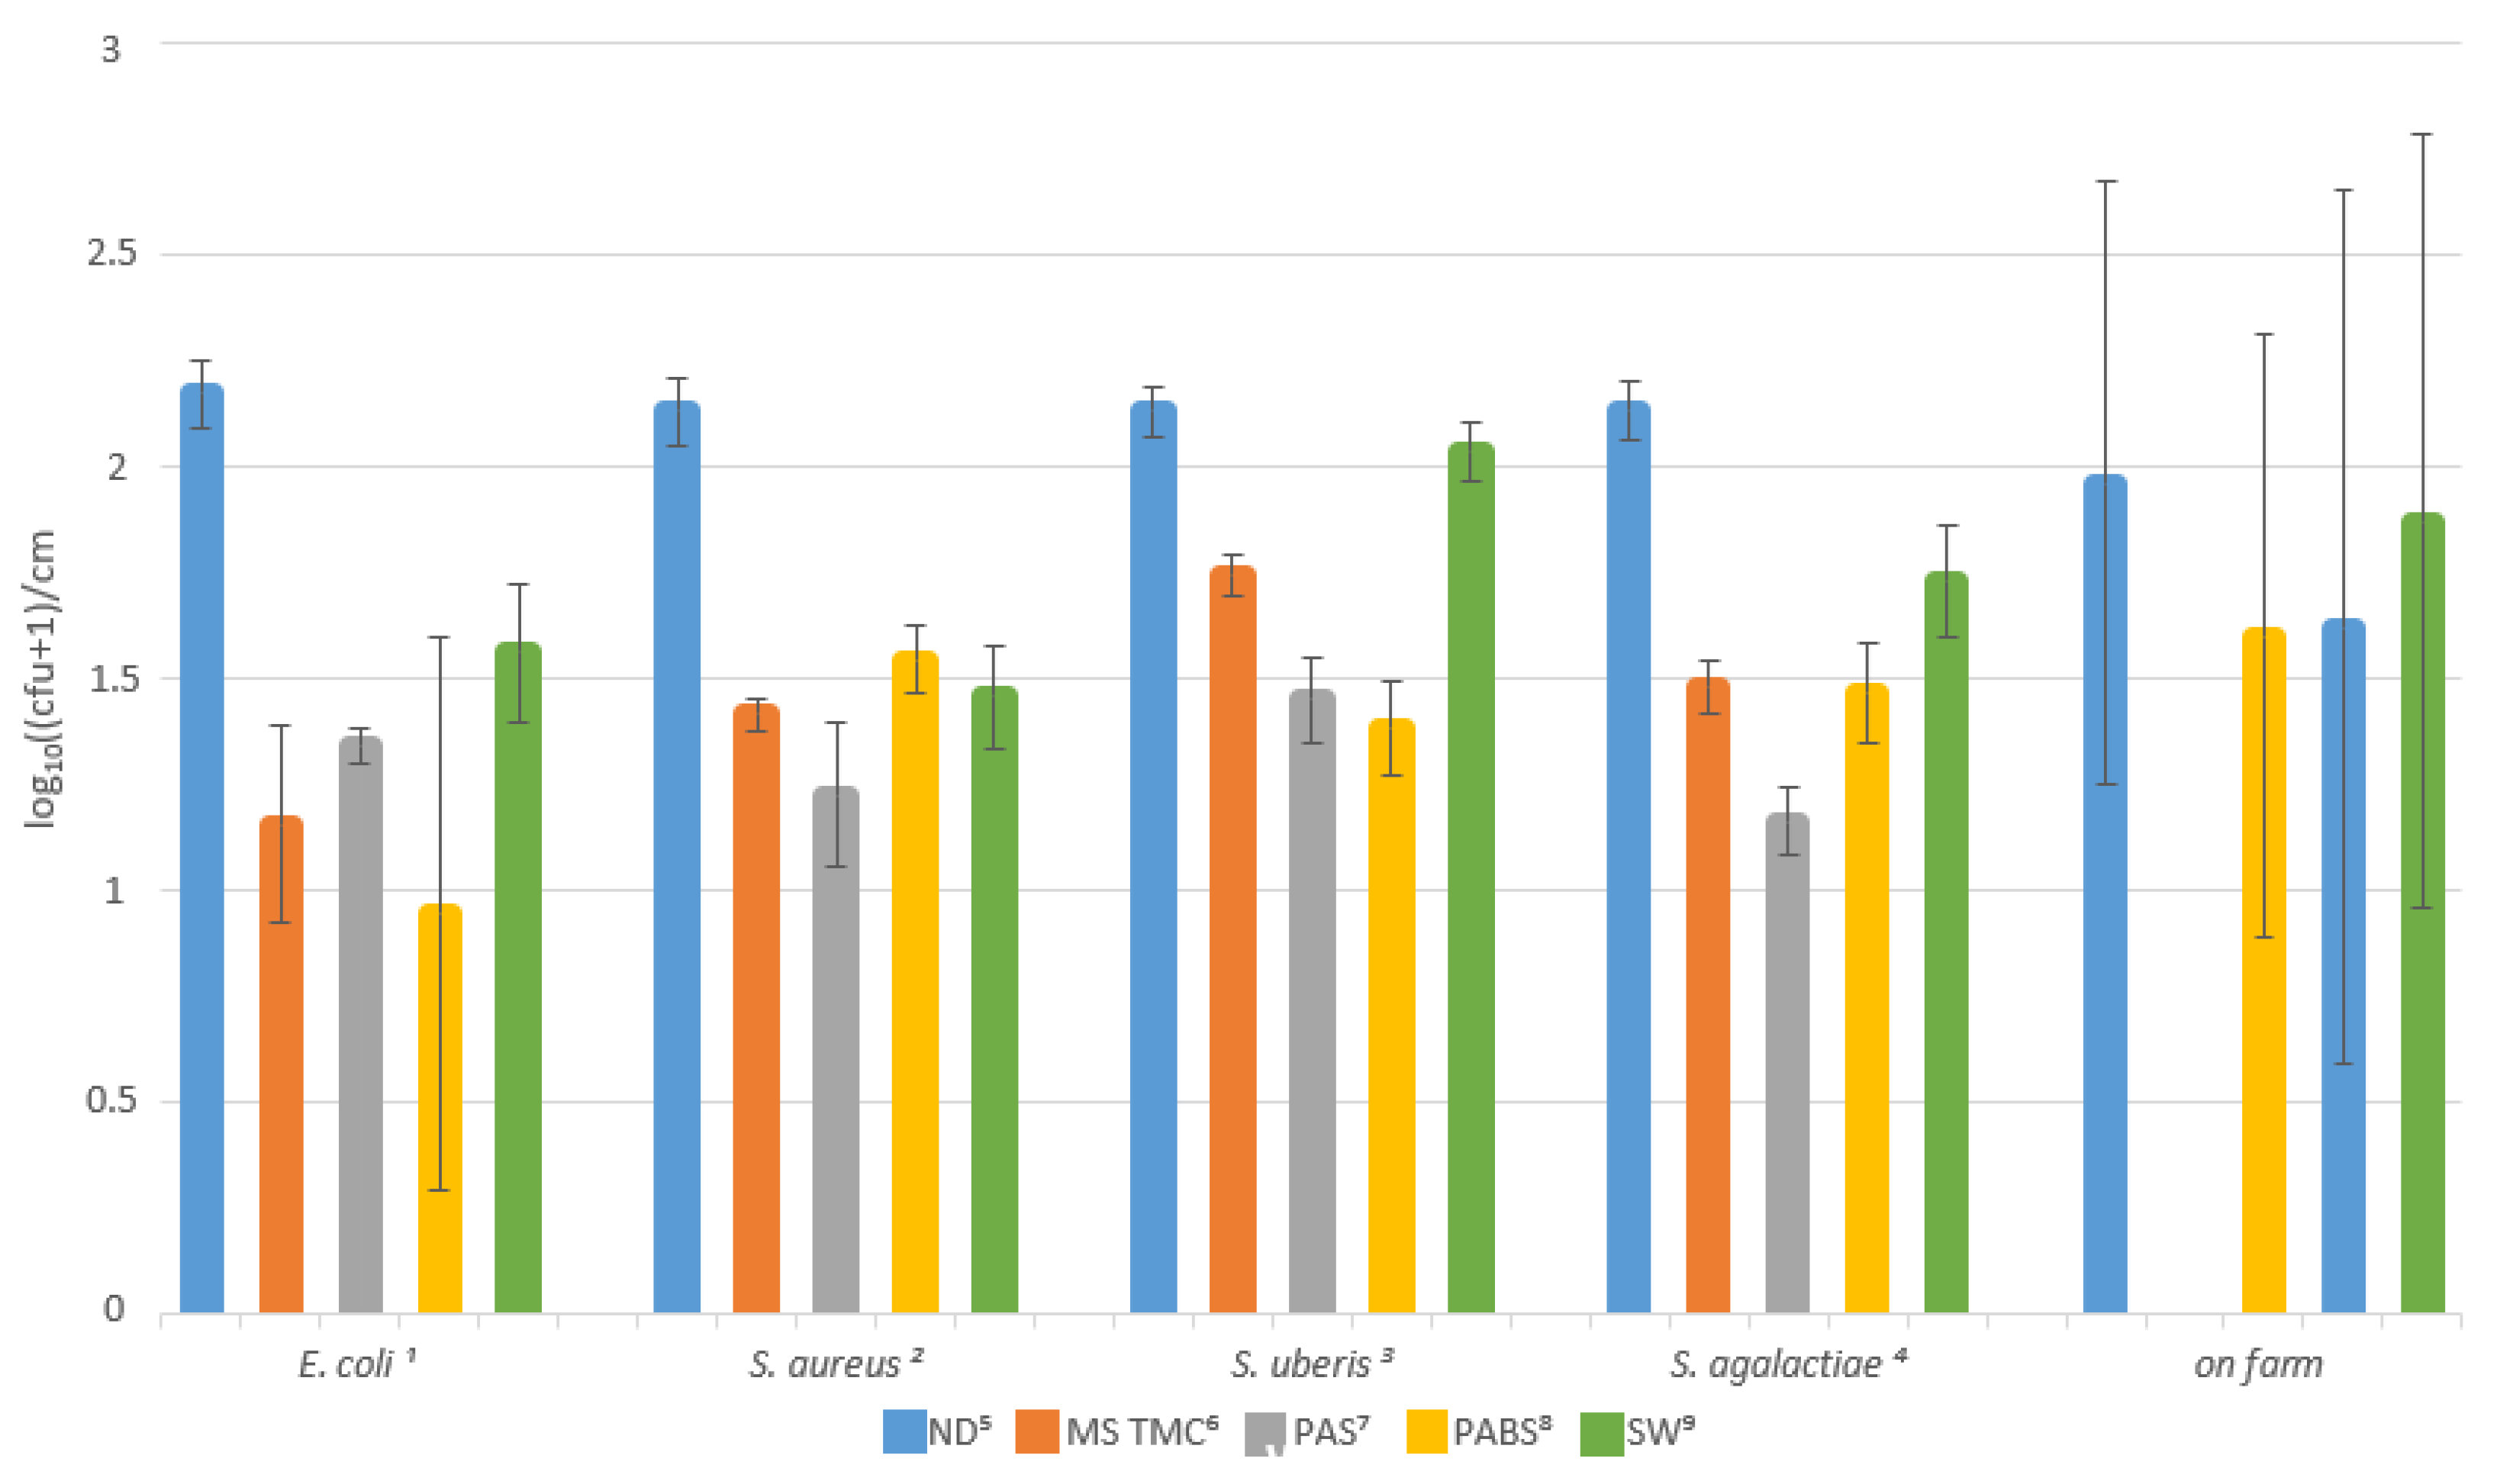
For all pathogens applied, a significant bacterial reduction was induced by the treatment of the liners with the disinfectants and the sterile water compared to the non-disinfected liners. Only for Sc. uberis did the sterile water show no significant effect (see Table 1). For E. coli, PABS reduced significantly more pathogens on the surface than sterile water. For S. aureus contamination, PAS achieved a significantly better reduction in bacteria than PABS (0.913 log10((cfu + 1)/cm2) vs. 0.595 log10((cfu + 1)/cm2)). Liners contaminated with Sc. uberis were best disinfected with PABS, achieving a reduction of 0.746 log10((cfu + 1)/cm2). All other disinfectants also achieved significant bacterial reductions, as well as significantly better reductions than when sterile water was used. Compared to PAS and PABS, the application of MS TMC Flush yielded insufficient pathogen reductions. On the liners contaminated with Sc. agalactiae, PAS achieved a reduction of 0.971 log10((cfu + 1)/cm2), a significantly better bacterial reduction than MS TMC Flush, PABS and sterile water. The bacterial reductions by each disinfection method are shown in Figure 3.

3.2. Field Trial

A total of 40 milking clusters were sampled and a mean contamination of the inner liner surfaces of 1.927 log10((cfu + 1)/cm2) was found. After disinfection with PAS, the surface bacterial count on the inner liner surfaces was 1.574 log10((cfu + 1)/cm2), after disinfection with PABS 1.774 log10((cfu + 1)/cm2). When the sterile water was applied, a surface bacterial count of 1.863 log10((cfu + 1)/cm2) was measured (Table 3).
When comparing the mean differences (Table 4), it is noticeable that neither the application of the disinfection solutions nor the sterile water resulted in a significant reduction in the bacterial density on the liners. A significant difference regarding sampler and udder quarter was also not found, when using tests of between-subjects effects. Figure 3 shows the reduction in the surface bacterial count by the individual disinfection solutions, also in comparison to the laboratory test.

4. Discussion

Intermediate disinfection is recommended as a measure to control the transmission of mastitis pathogens, especially on farms with problems with cow-associated pathogens, such as S. aureus, which are mainly transmitted during the milking process. Only by quantitatively detecting the surface microbial count on the liner surface it is possible to determine the level of the reduction in the bacteria on the liner surface by intermediate disinfection. A qualitative or semi-quantitative swab sample provides only unreliable information since no precise quantitative conclusion can be made about the surface bacterial count (DIN 10113-1:1997-07, Part 2). This study was a continuation of a previous experiment [38] that defined a modified WDS technique in accordance to DIN 10113-1: 1997-07, suitable for the quantitative swab sampling of milking liners. In the current study, by means of a laboratory trial and a field trial, the aim was to find out how different disinfectants act on certain bacterial species and how they reduce the bacterial count of the mixed flora on a teat cup liner. Even though there are already some studies dealing with bacterial reduction after intermediate disinfection, most of them lack standardized disinfection and sampling methods, as used in this study. For the laboratory trial, used liners made of NBR were deliberately chosen, because they favor pathogen deposition and thus transmission [40,41,42]. These were also installed on the farm where the field trial was performed. In the field trial, the samples were taken by four different samplers and not by one person as in the laboratory trial. All samplers swabbed the same number of clusters, so they each sampled the same number of differently disinfected and non-disinfected liners. There was no significant difference between the udder quarters or the samplers. Thus, the method used for sampling is sufficiently standardized to be used by different persons. To neutralize the bactericidal effect of disinfectant residues after sampling within the swab medium, a neutralizer additive consisting of sodium thiosulfate and catalase was added to the swab medium. This is important to determine the actual effect of the disinfectant on the surface of the liner and to avoid false-negative results [43,44,45,46]. Using this WDS technique, the effects of conventional disinfectants and PABS were compared within this study. To differentiate the extent to which the effect of rinsing by the liquid already on the liner surface alone leads to a reduction in the microorganisms on the surface, the liners were sprayed with sterile water in the study for comparison as is the case when the milking cluster is rinsed with cold water. Under controlled conditions in the laboratory, this reduction was notably lower than for most pathogen/disinfectant combinations. Under field conditions, the surface bacterial count was not significantly reduced by sterile water, nor by any of the tested disinfectants, so the risk of pathogen transmission is still present.
In the trials, a spray method was used to disinfect the liners. This method can be easily performed with minimal cost and material expenditure, which is why it is frequently used in Northern Germany for the intermediate disinfection of milking clusters. In addition, the disinfectant solution in the bottle is protected from contamination, unlike when using the immersion method, where protein fixation can occur due to milk residues on the milking cluster, which is minor but does occur when PAS is used [47]. Care must be taken to ensure that the insides of the liners are evenly wetted with the disinfection solution [22]. For the comparison of efficacy in the study, it was important to maintain both quantity and time exactly. Therefore, exactly 1.7 mL of the solutions was sprayed into the liners and the samples were taken after an exposure time of 30 s. This corresponds in application quantity and exposure time to the intermediate disinfection carried out in practice. However, the small amount of disinfectant and the short contact time are probably the reason for the low disinfection effects measured in the study [22,32,48].
The Robert Koch Institute’s definition of surface disinfection from 2022 calls for the destruction or inactivation of microorganisms to a level at which there is no longer any risk of infection. To achieve this, one would prefer a higher reduction in the bacteria on the inner surface of the liners in the laboratory trial, but it is especially important in the field trial. Although both PAS and MS TMC Flush reduce microorganisms on the liner surface, the average reductions in the microorganisms in the laboratory test were only 1 log for E. coli and 0.7 log, 0.7 log and 0.8 log for S. aureus, Sc. uberis and Sc. agalactiae, respectively. The different effects of the disinfectants on the bacteria probably arise from the different cell structures of Gram-positive and Gram-negative bacteria [49,50]. The higher resistance of S. aureus compared to E. coli regarding the oxidative effect of PAS was, for example, already presented by Kunigk and Almeida [21] and of PABS by Große Peclum et al. [31]. The best disinfection efficacy for E. coli and Sc. uberis in the laboratory study was obtained with PABS and for S. aureus and Sc. agalactiae with PAS. PABS achieved a reduction for E. coli by 1.3 log and for Sc. uberis by 0.8 log. PAS, however, achieved a reduction of 1.1 log in S. aureus and of 1 log in Sc. agalactiae.
Since the disinfection effect from the ready-to-use mix containing hydrogen peroxide, peracetic acid and acetic acid was worse than that of PAS and PABS in the laboratory trial, only the application of PAS and PABS on liners was compared with the rinsing effect of sterile water and non-disinfected liners in the field trial. The disinfectant efficacy trial under field conditions with liners contaminated with mixed flora resulted only in a 0.2 log reduction in bacteria and was thus much lower than in the laboratory. Zhang et al. [49] already described the effect of the lower efficacy of OH-based disinfectants with contamination by E. coli and S. aureus at the same time. Under field conditions, PAS and PABS did not lead to a significant reduction in the bacterial surface contamination of the milking liners, and there was also no significant difference between the two disinfection methods. An increase in the antimicrobial effect could probably be achieved by applying other PALs, since the pH value is kept neutral when using Buffered Solutions [32,51]. However, since PABS can be used for treatment on open wounds [31], it can be assumed that the sensitive teat skin is not stressed by PABS, making it particularly interesting for use on the liner. However, on the farm, none of the applied disinfectants showed a significant reduction in surface microbial counts. The low bacterial reductions contrast with the disinfection results obtained on the milking cluster by Skarbye et al. [36], who already achieved the bacterial elimination of S. aureus by rinsing with sterile water in a volume of 966 mL without the need to add PAS. So, in a further study on the milking cluster, it could be shown to what extent the disinfection effect of the various preparations’ changes with increased quantity and exposure time. Various laboratory studies already show that a higher microorganism reduction can be achieved with extended exposure time and that Gram-positive bacteria, such as S. aureus, then also show higher levels of destruction [20,24,31]. It can be assumed that conventional disinfectants, such as PAS and PABS, can then achieve good results, when used in the field.
Thus, PABS is called an environmentally friendly, non-toxic alternative to chemical disinfectants because the transfer of energy and chemical reactivity does not require any chemical additives [26] and it does not contain hazardous substances, unlike conventional disinfectants that must first be diluted before use. However, plasma activation requires a lot of electricity [30], which reduces the aspect of environmental friendliness. The disinfecting effect of PABS persists for 24 h when stored at 21 °C due to the long-lasting RONS [31,32], so PABS, like peracetic-acid-based disinfectants, must be prepared daily and applied after each milking [20]. However, the production of PABS is very power- and time-intensive and thus not yet possible on a widespread basis, but applications in further studies for disinfection purposes in the dairy industry are conceivable.

5. Conclusions

Both the conventional disinfectants based on peracetic acid and hydrogen peroxide and the PABS achieved a significant reduction in the surface microbial count on the liners in the laboratory test. In the field trial, the surface bacterial counts on the liners were reduced by PAS and PABS, but no significant difference was observed in liners that were not disinfected. This indicates that spray disinfection with the different solutions is able to reduce the contamination of milking liners, but a higher reduction in bacteria would be preferred for disinfection. In a subsequent study, both the amount of disinfectant solution applied and the exposure time of the disinfectants could be increased, to further reduce the microbial contamination of the liner and thus provide a more accurate conclusion about the effect of the different intermediate disinfectant solutions. Due to the lack of availability and the high costs of PABS, it is currently not an alternative to PAS in intermediate disinfection, despite the fact that it achieves comparable results.

Author Contributions

Conceptualization, V.K.; methodology, V.K., C.O., S.S. and S.L.; software, V.K.; validation, V.K.; formal analysis, V.K.; investigation, S.S., N.W., Y.Z., A.T., J.N., S.L. and V.K.; resources, M.B., C.O., Y.Z. and N.W.; data curation, V.K.; writing—original draft preparation, S.S.; writing—review and editing, J.N., N.W., S.L., G.A. and V.K.; visualization, S.S.; supervision, V.K.; project administration, W.V. and V.K.; funding acquisition, G.A., W.V., S.L. and V.K. All authors have read and agreed to the published version of the manuscript.

Funding

This work was supported by the European Innovation Partnership (EIP-AGRI) project “Plasmadip” and funded by the European Agricultural Fund for Rural Development (EAFRD) and the Steinbeis Research Center for Milk Science (4-21).

Institutional Review Board Statement

The animal study protocol was approved by the Institutional Review Board of Stiftung Tierärztliche Hochschule Hanover (TVO-2021-V-56, date of approval 19.08.2021).

Informed Consent Statement

Not applicable.

Data Availability Statement

The data presented in this study are available on request from the corresponding author. The data are not publicly available due to privacy.

Acknowledgments

The authors would like to thank the Microbiology Working Group of the University of Applied Sciences and Arts, Hannover, Germany.

Conflicts of Interest

The authors declare no conflict of interest.

References

  1. Seegers, H.; Fourichon, C.; Beaudeau, F. Production effects related to mastitis and mastitis economics in dairy cattle herds. Vet. Res. 2003, 34, 475–491. [Google Scholar] [CrossRef] [Green Version]
  2. Ruegg, P.L. A 100-Year Review: Mastitis detection, management, and prevention. J. Dairy Sci. 2017, 100, 10381–10397. [Google Scholar] [CrossRef] [Green Version]
  3. Le Blanc, S.J.; Lissemore, K.D.; Kelton, D.F.; Duffield, T.F.; Leslie, K.E. Major Advances in Disease Prevention in Dairy Cattle. J. Dairy Sci. 2006, 89, 1267–1279. [Google Scholar] [CrossRef] [Green Version]
  4. Barkema, H.W.; Schukken, Y.H.; Lam, T.J.G.M.; Beiboer, M.L.; Benedictus, G.; Brand, A. Management Practices Associated with the Incidence Rate of Clinical Mastitis. J. Dairy Sci. 1999, 82, 1643–1654. [Google Scholar] [CrossRef] [PubMed]
  5. Sigrist, S.M. The Role of Bacterial Contamination of Milking Utensils and Disinfecting Solutions in the Pathogenesis of Clinical Mastitis in Dairy Cows. [Bakteriell Kontaminierte Desinfektionsmittel und Gerätschaften Beim Melkakt Als Mögliche Quelle Für Mastitiden]. Ph.D. Thesis, University of Zurich, Vetsuisse Faculty, Zurich, Switzerland, 2010. [Google Scholar]
  6. Feldmann, M.; Zimmermann, A.; Hoedemaker, M. Influence of milking technique, milking hygiene and environmental hygiene parameters on the microbial contamination of milking machines. Dtsch. Tierarztl. Wochenschr. 2006, 113, 274–281. [Google Scholar]
  7. Garcia, A. Contagious vs. Environmental Mastitis. SDSU Ext. Extra Arch. 2004, 126, 1–4. [Google Scholar]
  8. Krömker, V. Udder health and machine milking-pathogen transfer via direct mechanisms. Arch. Lebensmittelhyg. 2014, 64, 95–97. [Google Scholar]
  9. Besier, J.; Lind, O.; Bruckmaier, R.M. Dynamics of teat-end vacuum during machine milking: Types, causes and impacts on teat condition and udder health—A literature review. J. Appl. Anim. Res. 2016, 44, 263–272. [Google Scholar] [CrossRef] [Green Version]
  10. Zadoks, R.N.; Allore, H.G.; Barkema, H.W.; Sampimon, O.C.; Gröhn, Y.T.; Schukken, Y.H. Analysis of an Outbreak of Streptococcus uberis Mastitis. J. Dairy Sci. 2001, 84, 590–599. [Google Scholar] [CrossRef]
  11. Zadoks, R.N.; Gillespie, B.E.; Barkema, H.W.; Sampimon, O.C.; Oliver, S.P.; Schukken, Y.H. Clinical, epidemiological and molecular characteristics of Streptococcus uberis infections in dairy herds. Epidemiol. Infect. 2003, 130, 335–349. [Google Scholar] [CrossRef]
  12. German Veterinary Association. Leitlinien Bekämpfung der Mastitis des Rindes als Bestandsproblem, 5th ed.; Verlag der DVG: Gießen, Germany, 2012; pp. 24–36. [Google Scholar]
  13. Newbould, F.H.S.; Barnum, D.A. The reduction of the microflora of milking machine inflations by teat dipping and teat cup pasteurization. J. Milk Food Technol. 1960, 23, 374–376. [Google Scholar] [CrossRef]
  14. Newbould, F.H.S. Disinfection in the prevention of udder infections: A review. Can. Vet. J. 1965, 6, 29–37. [Google Scholar]
  15. Hovinen, M.; Pyörälä, S. Invited review: Udder health of dairy cows in automatic milking. J. Dairy Sci. 2011, 94, 547–562. [Google Scholar] [CrossRef] [Green Version]
  16. Svennesen, L.; Nielsen, S.; Mahmmod, Y.; Krömker, V.; Pederen, K.; Klaas, I. Association between teat skin colonization and intramammary infection with Staphylococcus aureus and Streptococcus agalactiae in herds with automatic milking systems. J. Dairy Sci. 2019, 102, 629–639. [Google Scholar] [CrossRef] [PubMed] [Green Version]
  17. Krömker, V. Short textbook dairy science and milky hygiene. In Kurzes Lehrbuch Milchkunde und Milchhygiene, 1st ed.; Verlag Parey: Stuttgart, Germany, 2006; pp. 38–41. [Google Scholar]
  18. Zimmermann, A. Comparison of Different Techniques for the Determination of Bacteriological Contamination of the Milking Equipment and Possible Interactions with Milking Procedures and Udder-Health. [Vergleich Verschiedener Verfahren zur Beurteilung der Mikrobiellen Kontamination der Melkzeuge Bzw. der Melkanlage und Mögliche Beziehungen zur Melktechnik und Eutergesundheit]. Ph.D. Thesis, Stiftung Tierärztliche Hochschule Hannover, Hannover, Germany, 2003. [Google Scholar]
  19. Köster, G.; Tenhagen, B.-A.; Scheibe, N.; Heuwieser, W. Factors associated with High Milk Test Day Somatic Cell Counts in Large Dairy Herds in Brandenburg. II. Milking Practices. J. Vet. Med. A 2006, 53, 209–214. [Google Scholar] [CrossRef]
  20. Bützner, P. Peroxyacetic acid: Simple, but effective (Peroxyessigsäure: Einfach, aber wirksam). CLB Chem. Lab. Biotechn. 2012, 62, 96–115. [Google Scholar]
  21. Kunigk, L.; Almeida, M.C.B. Action of peracetic acid on Escherichia coli and Staphylococcus aureus in suspension or settled on stainless steel surface. Braz. J. Microbiol. 2001, 32, 38–41. [Google Scholar] [CrossRef] [Green Version]
  22. Robert Koch-Institute (RKI): Anforderungen an die Hygiene bei der Reinigung und Desinfektion von Flächen. Empfehlung der Kommission für Krankenhaushygiene und Infektionsprävention (KRINKO) beim Robert Koch-Institut. Bundesgesundheitsblatt 2022, 65, 1074–1115. [Google Scholar] [CrossRef]
  23. Mitsching, M.; Schwabe, H. Anwendungsmöglichkeiten von Peressigsäurepräparaten zur Prophylaxe und Therapie infektiöser Erkrankungen bei landwirtschaftlichen Nutztieren. Prakt. Tierarzt 1999, 80, 547–562. [Google Scholar]
  24. Fröhling, A.; Wienke, M.; Rose-Meierhöfer, S.; Schlüter, O. Improved Method for Mastitis Detection and Evaluation of Disinfectant Efficiency During Milking Process. Food Bioprocess Technol. 2010, 3, 892–900. [Google Scholar] [CrossRef]
  25. Ruf, J.; Johler, S.; Merz, A.; Stalder, U.; Hässig, M. Success of interventions in mastitis problems with Staphylococcus aureus after the introduction of an automatic milking system. Schweiz. Arch. Tierheilkd. 2015, 157, 153–156. [Google Scholar] [CrossRef] [PubMed] [Green Version]
  26. Zhou, R.; Zhou, R.; Wang, P.; Xian, Y.; Mai-Prochnow, A.; Lu, X.; Cullen, P.J.; Ostrikov, K.; Bazaka, K. Plasma activated water (PAW): Generation, origin of reactive species and biological applications. J. Phys. D Appl. Phys. 2020, 53, 303001. [Google Scholar] [CrossRef]
  27. Rahman, M.; Hasan, M.S.; Islam, R.; Rana, R.; Sayem, A.; Sad, M.A.A.; Matin, A.; Raposo, A.; Zandonadi, R.P.; Han, H.; et al. Plasma-Activated Water for Food Safety and Quality: A Review of Recent Developments. Int. J. Environ. Res. Public Health 2022, 19, 6630. [Google Scholar] [CrossRef]
  28. Soni, A.; Choi, J.; Brightwell, G. Plasma-Activated Water (PAW) as a Disinfection Technology for Bacterial Inactivation with a Focus on Fruit and Vegetables. Foods 2021, 10, 166. [Google Scholar] [CrossRef]
  29. Hoeben, W.F.L.M.; van Ooij, P.P.; Schram, D.C.; Huiskamp, T.; Pemen, A.J.M.; Lukeš, P. On the Possibilities of Straightforward Characterization of Plasma Activated Water. Plasma Chem. Plasma Process. 2019, 39, 597–626. [Google Scholar] [CrossRef] [Green Version]
  30. Laroussi, M.; Bekeschus, S.; Keidar, M.; Bogaerts, A.; Fridmann, A.; Lu, X.; Ostrikov, K.; Hori, M.; Stapelmann, K.; Miller, V.; et al. Low-Temperature Plasma for Biology, Hygiene, and Medicine: Perspective and Roadmap. IEEE Trans. Radiat. Plasma Med. Sci. 2022, 6, 127–157. [Google Scholar] [CrossRef]
  31. Große-Peclum, V.; Siekmann, L.; Krischek, C.; Avramidis, G.; ten Bosch, L.; Harms, M.; Ochs, C.; Ortmann, R.; Hoedemaker, M.; Ahlfeld, B.; et al. An In Vitro Model Using TRIS-Buffered Plasma-Activated Water to Reduce Pathogenic Microorganisms Involved in Digital Dermatitis Infection in Dairy Cattle. Appl. Sci. 2022, 12, 12325. [Google Scholar] [CrossRef]
  32. Traylor, M.J.; Pavlovich, M.J.; Karim, S.; Hait, P.; Sakiyama, Y.; Clark, D.S.; Graves, D.B. Long-term antibacterial efficacy of air plasma-activated water. J. Phys. D Appl. Phys. 2011, 44, 472001. [Google Scholar] [CrossRef] [Green Version]
  33. Chen, H.; Bai, F.; Xiu, Z. Oxidative Stress Induced in Saccharomyces Cerevisiae Exposed to Dielectric Barrier Discharge Plasma in Air at Atmospheric Pressure. IEEE Trans. Plasma Sci. 2010, 38, 1885–1891. [Google Scholar] [CrossRef]
  34. Yusupov, M.; Bogaerts, A.; Huygh, S.; Snoeckx, R.; van Duin, A.C.T.; Neyts, E.C. Plasma-Induced Destruction of Bacterial Cell Wall Components: A Reactive Molecular Dynamics Stimulation. J. Phys. Chem. C 2013, 117, 5993–5998. [Google Scholar] [CrossRef]
  35. Smith, T.W.; Eberhart, R.J.; Spencer, S.B.; Kesler, E.M.; Hargrove, G.L.; Wilson, R.W.; Heald, C.W. Effect of Automatic Backflushing on Number of New Intramammary Infections, Bacteria on Teatcup Liners, and Milk Iodine. J. Dairy Sci. 1985, 68, 424–432. [Google Scholar] [CrossRef]
  36. Skarbye, A.P.; Thomsen, P.T.; Krogh, M.A.; Svennesen, L.; Østergaard, S. Effect of automatic cluster flushing on the concentration of Staphylococcus aureus in teat cup liners. J. Dairy Sci. 2020, 103, 5431–5439. [Google Scholar] [CrossRef]
  37. Hay, J.R. The bacterial flora and disinfection of teat cups. Am. J. Vet. Res. 1941, 2, 297–304. [Google Scholar]
  38. Scheib, S.; Wente, N.; Leimbach, S.; Krömker, V. Comparison of different swab techniques for the quantitative analysis of mastitis relevant pathogens on liner surfaces. Milk Sci. Int. 2023, 76, 1–7. [Google Scholar] [CrossRef]
  39. De Paoli, P. Bio-banking in microbiology: From sample collection to epidemiology, diagnosis and research. FEMS Microbiol. Rev. 2005, 29, 897–910. [Google Scholar] [CrossRef] [Green Version]
  40. Hamel, J.; Zhang, Y.; Wente, N.; Krömker, V. Heat stress and cow factors affect bacteria shedding pattern from naturally infected mammary gland quarters in dairy cattle. J. Dairy Sci. 2021, 104, 786–794. [Google Scholar] [CrossRef] [PubMed]
  41. Pfannenschmidt, F. Qualification of the Wet-Dry-Swab-Technique DIN 10113; 1997-07 for the Determination of the Hygienic Status in Milking Machines. [Eignung des Nass-Trockentupfer Verfahrens (NTT) DIN 10113; 1997-07 zur Bestimmung des Hygienestatus in Melkanlagen]. Ph.D. Thesis, Stiftung Tierärztliche Hochschule Hannover, Hannover, Germany, 2003. [Google Scholar]
  42. Noorlander, D.O.; Heckmann, R. Scanning Electron Microscopy, A Technique for Evaluating Milking Machine Inflations and Tubes. J. Dairy Sci. 1980, 63, 991–1005. [Google Scholar] [CrossRef]
  43. Rockhoff, V. Vergleichende Untersuchung von Agarplatten-Oberflächen-Verfahren und Most-Probable-Number-Methode zur Desinfektionsmittelprüfung Gemäß der CEN-Normen EN 1656 und EN 1657. Ph.D. Thesis, Universität Leipzig, Leipzig, Germany, 2008. [Google Scholar]
  44. Reybrouck, G. The testing of disinfectants. Intern. Biodeterior. Biodegrad. 1998, 41, 269–272. [Google Scholar] [CrossRef]
  45. Borneff, J.; Werner, H.; Van de Voorde, H.; Reybrouck, G. Critical assessment of methods for testing chemical disinfectants and disinfection procedures. [Kritische Beurteilung der Prüfmethoden für chemische Desinfektionsmittel und -verfahren]. Zentralbl. Bakteriol. Parasitenkd, Infektionskr. Hyg. 1975, 160, 590–600. [Google Scholar]
  46. Mac Kinnon, I.H. The use of inactivators in the evaluation of disinfectants. J. Hyg. 1974, 73, 189–195. [Google Scholar] [CrossRef] [Green Version]
  47. Pineau, L.; Desbuquois, C.; Marchetti, B.; Luu Duc, D. Comparison of the fixative properties of five disinfectant solutions. J. Hosp. Infect. 2008, 68, 171–177. [Google Scholar] [CrossRef] [PubMed]
  48. Rathore, V.; Patel, D.; Butani, S.; Nema, S.K. Investigation of Physicochemical Properties of Plasma Activated Water and its Bactericidal Efficacy. Plasma Chem. Plasma Process. 2021, 41, 871–902. [Google Scholar] [CrossRef]
  49. Zhang, J.; Su, P.; Chen, H.; Qiao, M.; Yang, B.; Zhao, X. Impact of reactive oxygen species on cell activity and structural integrity of Gram-positive and Gram-negative bacteria in electrochemical disinfection system. Chem. Eng. J. 2023, 451, 138879. [Google Scholar] [CrossRef]
  50. Ursache, M.; Moraru, R.; Eugen, H.; Nâstasâ, V.; Mares, M. Comparative assessment of the relation between energy consumption and bacterial burden reduction using plasma activated water. In Proceedings of the 2014 International Conference on Optimization of Electrical and Electronic Equipment (OPTIM), Bran Romania 2014, Piscataway, NJ, USA, 22–24 May 2014; pp. 1036–1041. [Google Scholar] [CrossRef]
  51. Joshi, I.; Salvi, D.; Schaffner, D.W.; Karwe, M.V. Characterization of Microbial Inactivation Using Plasma-Activated Water and Plasma-Activated Acidified Buffer. J. Food Prot. 2018, 81, 1472–1480. [Google Scholar] [CrossRef]
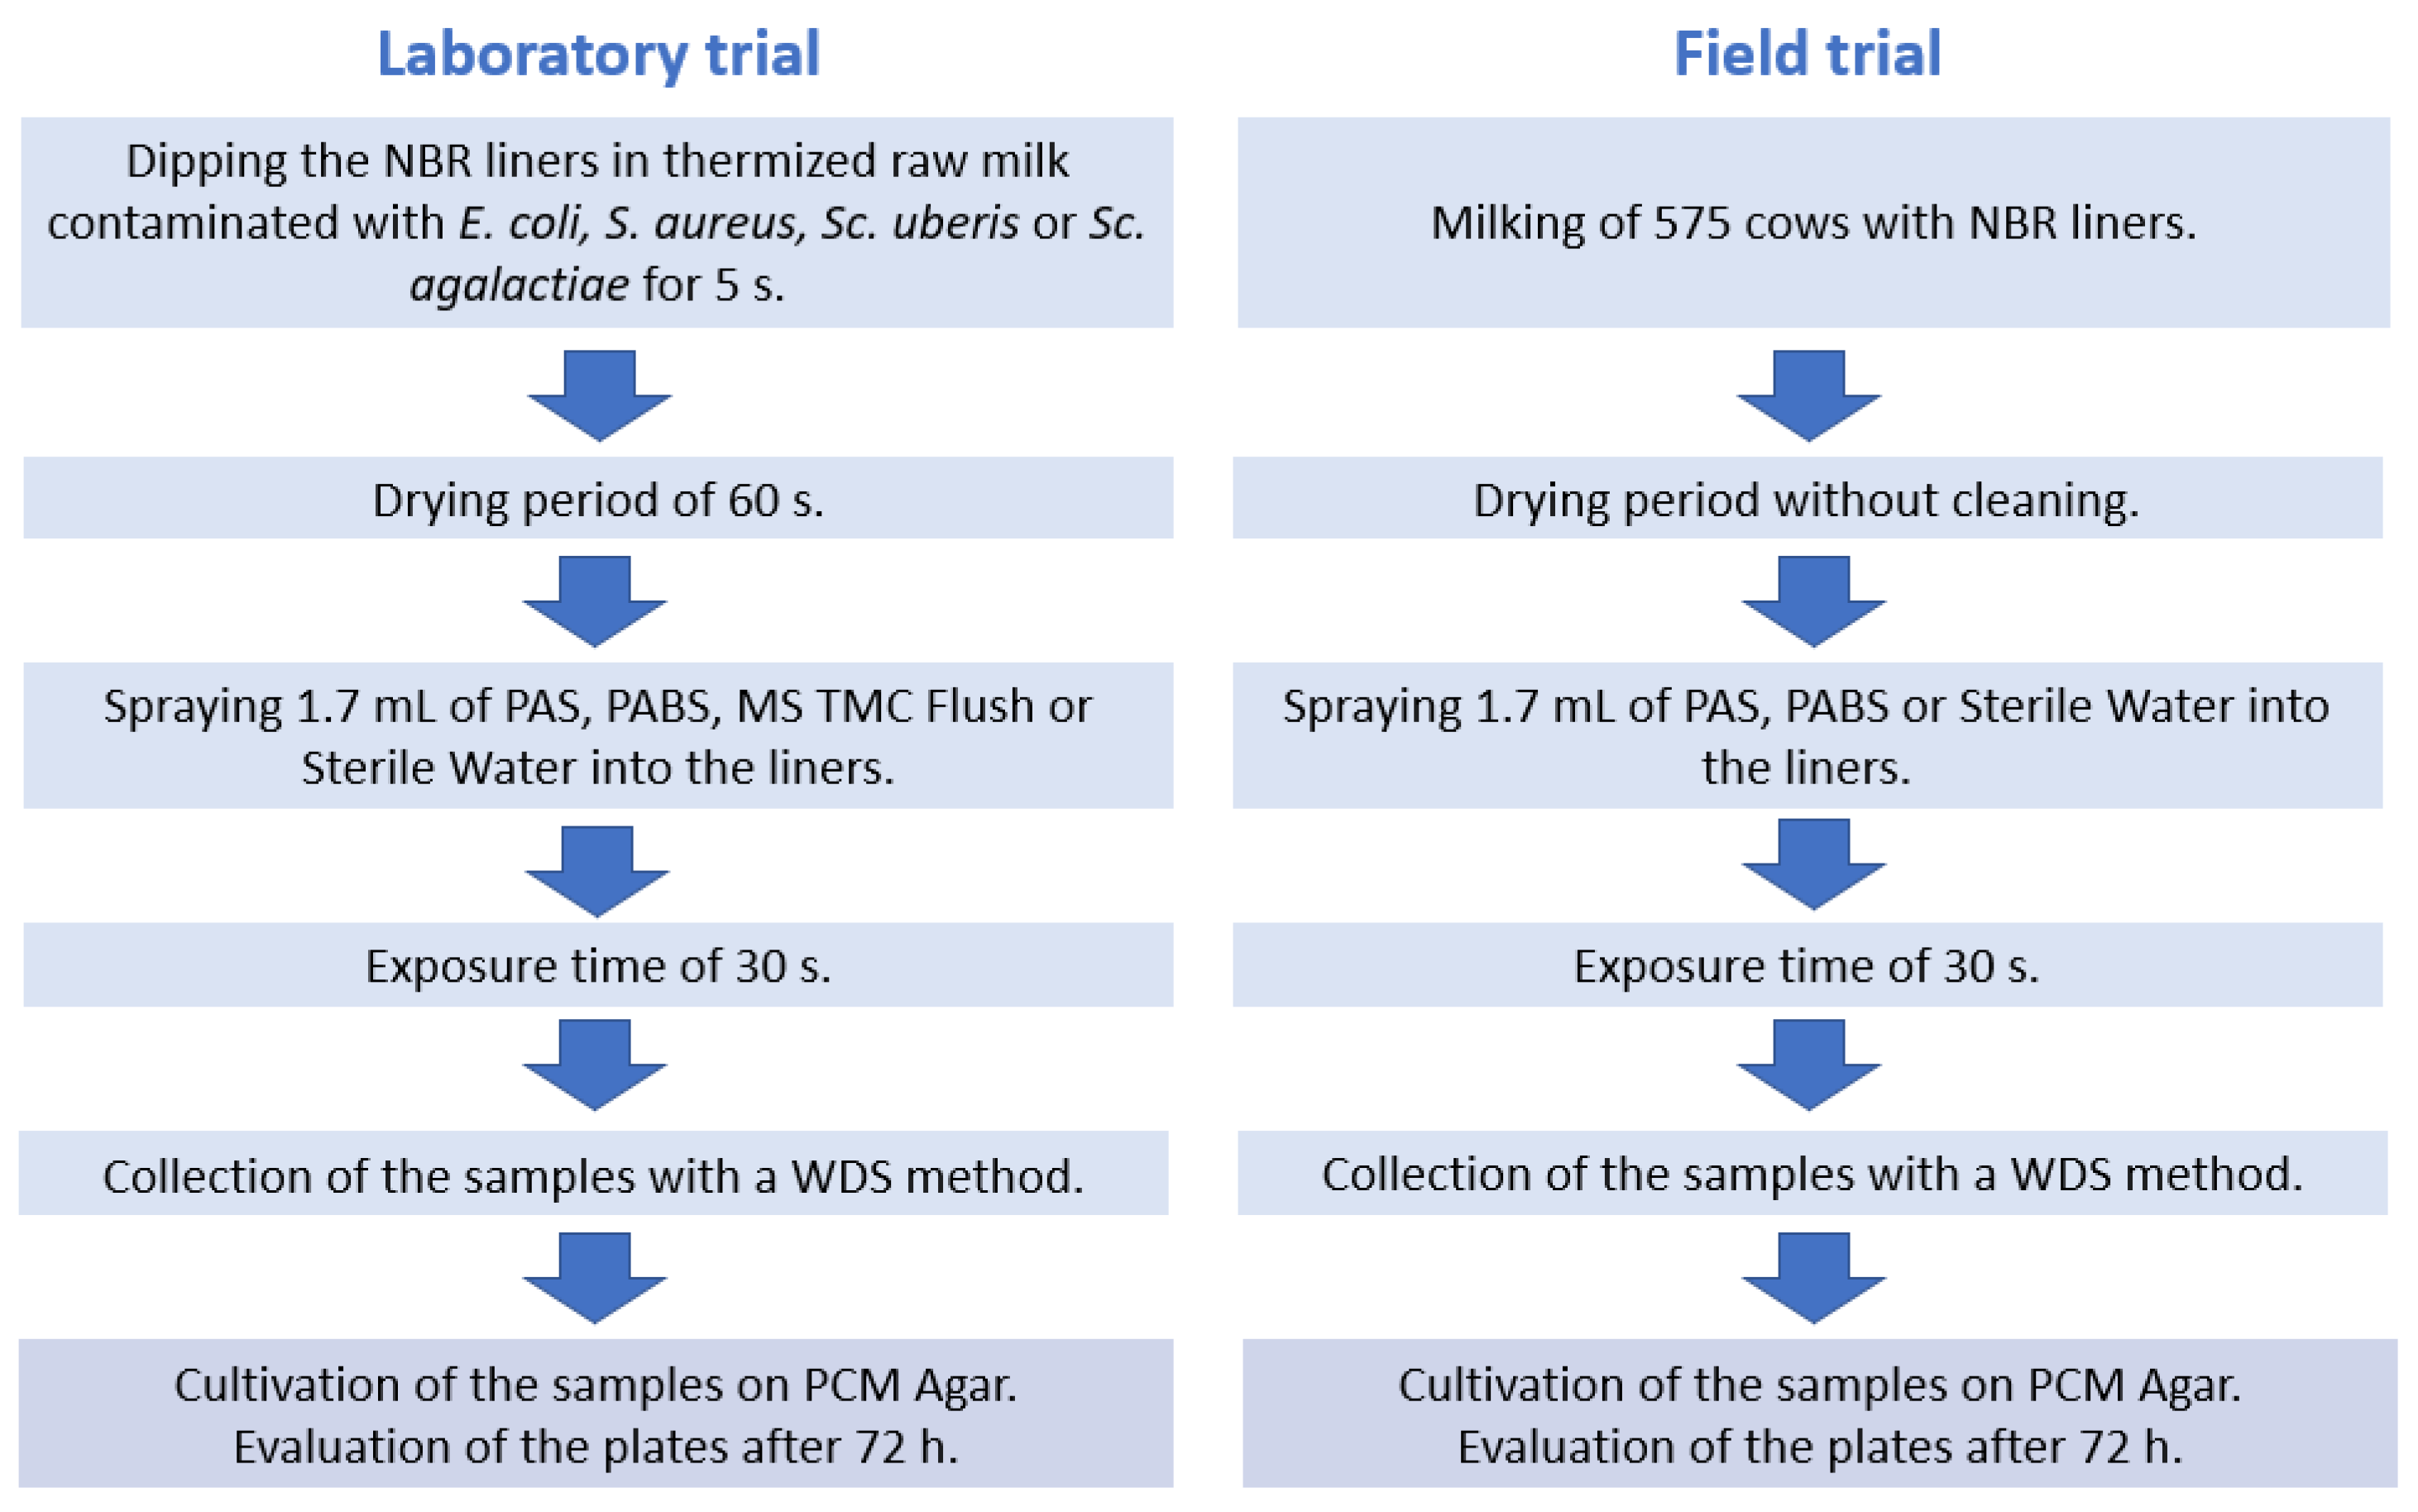
Figure 1. Diagram of the experimental setup. PAS: Peracetic Acid Solution, PABS: Plasma-Activated Buffered Solution, WDS: wet–dry swab.
Pathogens 12 00560 g001
Figure 2. Scheme of the plasma device to generate PABS: (left), total view of the PAL device; (right), sectional view of the plasma source.
Pathogens 12 00560 g002
Figure 3. Comparison of surface microbial counts of liners not disinfected, and liners disinfected by the various methods with standard deviation in log10((cfu + 1)/cm2). 1 Escherichia coli. 2 Staphylococcus aureus. 3 Streptococcus uberis. 4 Streptococcus agalactiae. 5 Not disinfected. 6 MS TMC Flush. 7 Peracetic Acid Solution. 8 Plasma-Activated Buffered Solution. 9 Sterile water.
Pathogens 12 00560 g003
Table 1. Estimated marginal means for the pathogen density on the liners after disinfection in the laboratory study in log10((cfu + 1)/cm2).
PathogenDisinfectantMean (log10((cfu + 1)/cm2)) 195% CI 2 Lower Bound95% CI 2 Upper Bound
E. coli 3ND 72.1721.9922.412
MS TMC 81.156 a,b0.9071.406
PAS 91.341 a1.0921.591
PABS 100.944 a,b,c0.6951.194
SW 111.559 a1.3091.808
S. aureus 4ND 72.1381.9982.277
MS TMC 81.414 a1.2741.553
PAS 91.225 a,b,d1.0861.365
PABS 101.543 a1.4031.683
SW 111.456 a1.3161.595
Sc. uberis 5ND 72.1292.0322.236
MS TMC 81.741 a,b1.6351.848
PAS 91.450 a,b,e1.3431.556
PABS 101.383 a,b,e1.2771.489
SW 112.0361.9302.142
Sc. agalactiae 6ND 72.1322.0072.258
MS TMC 81.479 a,b1.3531.605
PAS 91.162 a,b,d,e1.0361.288
PABS 101.466 a,b1.3411.592
SW 111.730 a1.6041.856
1 Logarithmized colony-forming units per square centimeter. 2 Confidence Interval. 3 Escherichia coli. 4 Staphylococcus aureus. 5 Streptococcus uberis. 6 Streptococcus agalactiae. 7 Not disinfected. 8 MS TMC Flush. 9 Peracetic Acid Solution. 10 Plasma-Activated Buffered Solution. 11 Sterile water. a Significant reduction in microorganisms. b Significant better reduction than SW. c Significant better reduction than PAS. d Significant better reduction than PABS. e Significant better reduction than MS TMC.
Table 2. All significant mean differences in surface bacterial counts in relation to the different disinfection methods for pathogens in the laboratory study in log10((cfu + 1)/cm2).
PathogenDM1 1DM2 1Mean Difference (log10((cfu + 1)/cm2)) 2 (DM1–DM2)p-Value95% CI 3 Lower Bound95% CI 3 Upper Bound
E. coli 4ND 8MS TMC 91.015<0.0010.4481.582
PAS 100.8300.0040.2641.397
PABS 111.227<0.0010.6611.794
SW 120.6130.0310.4591.180
SW 12PABS 110.6150.0030.2620.967
S. aureus 5ND 8MS TMC 90.724<0.0010.4071.041
PAS 100.913<0.0010.5951.229
PABS 110.595<0.0010.2770.912
SW 120.682<0.0010.3650.999
PABS 11PAS 100.3180.0490.0010.635
Sc. uberis 6ND 8MS TMC 90.3880.0020.1460.630
PAS 100.680<0.0010.4380.921
PABS 110.746<0.0010.5050.988
MS TMC 9PAS 100.2920.0150.0500.533
PABS 110.3580.0030.1170.600
SW 12MS TMC 90.2950.0140.0530.536
PAS 100.587<0.0010.3450.828
PABS 110.653<0.0010.4120.895
Sc. agalactiae 7ND 8MS TMC 90.654<0.0010.3680.940
PAS 100.971<0.0010.6851.257
PABS 110.666<0.0010.3800.952
SW 120.4030.0050.1170.689
MS TMC 9PAS 100.3170.0270.3080.603
PABS 11PAS 100.3050.0340.1850.591
SW 12PAS 100.568<0.0010.2820.854
1 Disinfection method. 2 Logarithmized colony-forming units per square centimeter. 3 Confidence Interval. 4 Escherichia coli. 5 Staphylococcus aureus. 6 Streptococcus uberis. 7 Streptococcus agalactiae. 8 Not disinfected. 9 MS TMC Flush. 10 Peracetic Acid Solution. 11 Plasma-Activated Buffered Solution. 12 Sterile water.
Table 3. Estimated marginal means for the pathogen density on the liners after disinfection in the field trial in log10((cfu + 1)/cm2).
DisinfectantMean (log10((cfu + 1)/cm2)) 195% CI 2
Lower Bound
95% CI 2
Upper Bound
ND 31.9271.6392.214
PAS 41.5741.3011.847
PABS 51.7741.4822.066
SW 61.8631.5752.150
1 Logarithmized colony-forming units per square centimeter. 2 Confidence Interval. 3 Not disinfected. 4 Peracetic Acid Solution. 5 Plasma-Activated Buffered Solution. 6 Sterile water.
Table 4. Mean differences in surface bacterial counts in relation to the different disinfection methods for pathogens in the field trial in log10((cfu + 1)/cm2).
DM1 1DM2 1Mean Difference (log10((cfu + 1)/cm2)) 2 (DM1–DM2)p-Value95 % CI 3
Lower Bound
95 % CI 3 Upper Bound
ND 4PAS 50.3530.483−0.1850.891
PABS 60.1531.000−0.4030.709
SW 70.0641.000−0.4870.615
1 Disinfection method. 2 Logarithmized colony-forming units per square centimeter. 3 Confidence Interval. 4 Not disinfected. 5 Peracetic Acid Solution. 6 Plasma-Activated Buffered Solution. 7 Sterile water.
Disclaimer/Publisher’s Note: The statements, opinions and data contained in all publications are solely those of the individual author(s) and contributor(s) and not of MDPI and/or the editor(s). MDPI and/or the editor(s) disclaim responsibility for any injury to people or property resulting from any ideas, methods, instructions or products referred to in the content.