Article

The Antibacterial Efficacy of Far-UVC Light: A Combined-Method Study Exploring the Effects of Experimental and Bacterial Variables on Dose–Response

by
David T. Griffin
1,2,
Terence Gourlay
1 and
Michelle Maclean
1,2,*
1
Department of Biomedical Engineering, University of Strathclyde, Wolfson Building, 106 Rottenrow, Glasgow G4 0NW, UK
2
The Robertson Trust Laboratory for Electronic Sterilisation Technologies (ROLEST), Department of Electronic & Electrical Engineering, University of Strathclyde, Royal College Building, 204 George St, Glasgow G1 1XW, UK
*
Author to whom correspondence should be addressed.
Pathogens 2024, 13(8), 698; https://doi.org/10.3390/pathogens13080698
Submission received: 24 July 2024 / Revised: 7 August 2024 / Accepted: 8 August 2024 / Published: 19 August 2024
(This article belongs to the Section Epidemiology of Infectious Diseases)

Abstract

:
Far-ultraviolet C light, with a wavelength of 200–230 nm, has demonstrated broad-spectrum germicidal efficacy. However, due to increased interest in its use as an alternative antimicrobial, further knowledge about its fundamental bactericidal efficacy is required. This study had two objectives. Firstly, it investigated experimentally the Far-UVC dose–response of common bacteria suspended at various cell densities in transparent buffer, ensuring no influence from photosensitive suspending media. Increasing doses of Far-UVC were delivered to Enterococcus faecium, Escherichia coli, Pseudomonas aeruginosa and Staphylococcus aureus in PBS at 101, 102, 103, 105 and 107 CFU·mL−1, with surviving colony-forming units enumerated (n ≥ 3). Secondly, through a systematised literature review, this work sought to explore the impact of genus/species, Gram type, cell form, cell density and irradiance on dose–response. The screening of 483 publications was performed with 25 included in the study. Data for 30 species were collated, analysed and compared with the experimental results. Overall, Gram-positive species showed greater resilience to Far-UVC than Gram-negative; some inter-species and inter-genera differences in resilience were identified; endospores were more resilient than vegetative cells; the results suggested that inactivation efficiency may decrease as cell density increases; and no significant correlation was identified between irradiance and bactericidal dose effect. In conclusion, this study has shown Far-UVC light to be an effective decontamination tool against a vast range of bacterial vegetative cells and endospores.

1. Introduction

Far ultraviolet C (Far-UVC) describes wavelengths between 200 and 230 nm [1,2], a range with proven germicidal efficacy against a wide range of pathogens including bacteria [3,4], viruses [5,6] and fungi [4,7]. In recent years, interest in the use of antimicrobial Far-UVC for a diverse range of applications has grown, including the decontamination of healthcare facilities and equipment [8,9], drinking water [10,11,12] and indoor air [1,13,14]. This growth has coincided with increased evidence indicating its superior safety for mammalian cell exposure over alternative UVC wavelengths [15,16,17,18,19], a result of its attenuation before reaching the cell nucleus [20]. It has also coincided with the ongoing severe acute coronavirus (SARS-CoV-2) pandemic [21], which has renewed focus on the need for effective environmental decontamination technologies [1,22,23,24].
While the concerns presented by the SARS-CoV-2 pandemic continue, so too does the burden presented by bacterial pathogens. As the pathogen form responsible for most hospital-associated infections [25] and between approximately 60 and 90% of sepsis infections [26,27,28,29], bacteria present a considerable drain on global healthcare resources. Furthermore, the growing concern of antimicrobial resistance (AMR) amplifies the existing threat from bacteria. For example, through a systematic review, Murray et al. [30] estimated that 1.27 million deaths globally could be attributed to bacterial AMR in 2019 alone. Given the threat to life, as well as the limiting effect AMR could have on the development of new therapeutic and diagnostic practises due to fears of infectious complications [31], novel bactericidal technologies as alternatives to antibiotics are paramount to continued medical progress. Consequently, it is likely that Far-UVC use in the fields of environmental and biomedical decontamination will continue to grow.
Practical decontamination applications involve the inactivation of pathogens in a variety of situations. Suspending media can range from transparent or semi-transparent liquids to more complex biological or organic matrices. These include environmental treatment applications, such as drinking and wastewater decontamination [10,12,32] as well as biomedical applications requiring the decontamination of bodily fluid, e.g., blood plasma in transfusion medicine [33]; saliva in endotracheal intubation [34]; and urine in urethral catheters [35]. However, since Far-UVC light technologies are in their relative infancy, few comparative data exist on bacterial inactivation using these wavelengths.
In response to this gap in knowledge, this study had two overarching objectives. Firstly, it investigated experimentally the Far-UVC dose–response of some common pathogenic bacterial species, suspended at a range of densities, in phosphate-buffered saline (PBS), a common transparent and minimal medium. The use of this minimal medium enabled the fundamental antibacterial efficacy of Far-UVC light without influence from photosensitive components in the suspending medium to be determined. The second objective was to perform a thorough comparison of the experimental findings with all relevant published data on the topic. To do this, a systematised review of the existing literature was conducted, allowing the effect on dose–response of bacterial variables (genus/species, Gram type and cell form) and experimental variables (cell density and irradiance) to be determined. Furthermore, this study is intended to aid other researchers by providing a basic hierarchical reference index of fundamental bacterial inactivation by species using Far-UVC light.

2. Materials and Methods

2.1. Experimental Methods

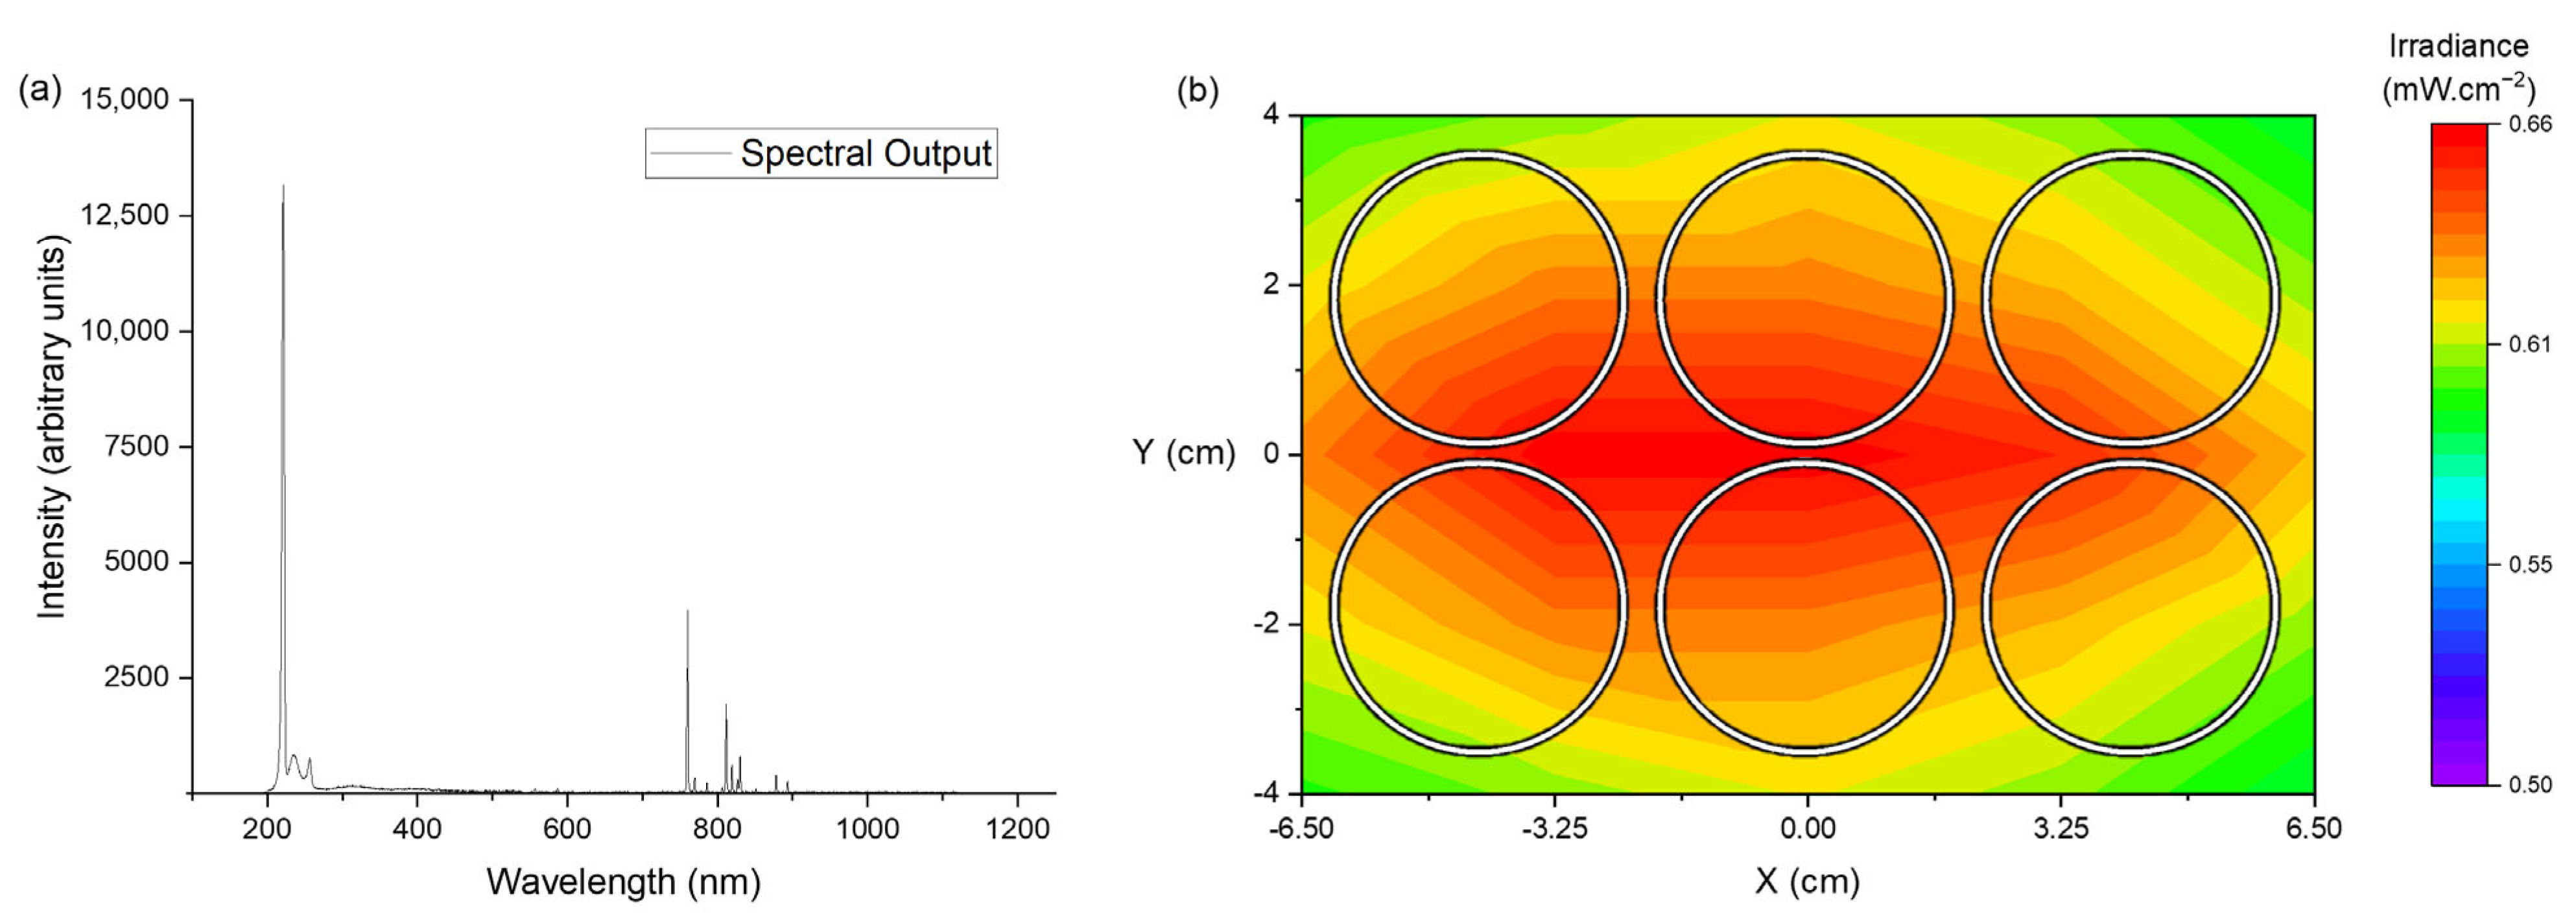
2.1.1. Far-UVC Light Source

A single krypton-chloride (Kr-Cl) excimer lamp and power supply, with an input voltage of 180 V, was used (EX 240S10-222 and PS-EX0K35/EAI/P/DI-F, respectively; Unilam Co. Ltd., Ulsan, Republic of Korea). The peak emission wavelength was 220.97 nm (Figure 1a) with a bandwidth of 3.66 nm at full width half maximum, recorded using an HR4000 spectrometer (Ocean Optics, Ostfildern, Germany) and Spectra Suite (v. 2.0.151) software. The experimental setup was housed in a fume cupboard due to the potential for ozone generation [36]. The lamp was clamped in position 35 cm above the irradiated sample surface, and the optical irradiance profile was mapped over a surface area of 13 × 8 cm, using a Nova power meter (Ophir Spiricon Europe GmbH, Darmstadt, Germany). The mean irradiance over the irradiated area (Figure 1b) was 0.62 ± 0.04 mW·cm−2, which includes an 8.6% loss in irradiance due to a quartz window used to cover the sample plates during irradiation. The applied dose was then calculated according to Equation (1):
D o s e   ( m J · c m 2 ) = T i m e s × I r r a d i a n c e   ( m W · c m 2 )

2.1.2. Preparation of Bacterial Suspensions

Four bacterial strains were used experimentally in this study: Enterococcus faecium LMG 11423, Escherichia coli NCTC 9001, Pseudomonas aeruginosa NCTC 9009 and Staphylococcus aureus NCTC 4135. Bacteria were cultured under rotary conditions (37 °C; 18–24 h; 120 rpm) in 100 mL nutrient broth (Oxoid Ltd., Basingstoke, UK), with the exception of E. faecium, which was cultured in tryptone soya broth (Oxoid Ltd., Basingstoke, UK). Broths were centrifuged (10 min at 3939× g), with the cell pellet then resuspended in 100 mL phosphate-buffered saline (PBS), and serially diluted in PBS to the required cell densities for Far-UVC exposure.

2.1.3. Far-UVC Irradiation of Bacteria in Liquid Suspension

Bacterial suspensions of 1.4 mL volume were transferred into the wells of a 6-well plate, providing a depth of ≈1.5 mm. The sample plate was covered with a quartz window and placed on an orbital shaker (100 rpm) positioned 35 cm below the Kr-Cl lamp. The orbital shaker ensured the constant mixing of the sample while also minimising the variance in irradiance across the irradiated wells. Samples were then irradiated for increasing time periods/doses (n = 3). A FLIR ONE Pro thermal imaging camera (Teledyne Flir, Kent, UK) was periodically used to ensure irradiated samples did not exceed room temperature during irradiation.
Following light exposure, samples (n ≥ 3) were plated onto nutrient agar (or tryptone soya agar for E. faecium; Oxoid Ltd., Basingstoke, UK), using standard microbiological plating techniques. If counts were expected to be ≥103 colony forming units per millilitre (CFU·mL−1), samples were serially diluted and spread-plated (50 or 100 µL volumes, giving a detection limit of 20 or 10 CFU·mL−1, respectively); if counts were expected to be ≤102 CFU·mL−1, samples were pour-plated (one millilitre volumes, giving a detection limit of one CFU·mL−1).
Sample plates were incubated for 18–24 h at 37 °C before manual counting on a colony counter (Stuart SC6 Plus Colony Counter; Cole-Palmer, Cambridgeshire, UK). Results were recorded in CFU·mL−1. To enable an effective comparison of Far-UVC dose–responses, the 1-Log10 inactivation dose (1-Log10 ID) (mJ·cm−2) was calculated for all dose–response curves using Equation (2). This was carried out following the method outlined by Tomb et al. [37] in which the highest reported dose for the greatest significant inactivation was recorded. Where there was evidence of a prominent tailing of inactivation as the dose increased, the dose and relative inactivation prior to this tailing was recorded instead.
1 L o g 10 I D = a p p l i e d   d o s e m e a n   L o g 10   i n a c t i v a t i o n   a t   a p p l i e d   d o s e

2.2. Literature Review

Three databases were selected for searching as part of the systematised literature review: Scopus, Pubmed (which includes Medline) and Compendex. A single research question was then composed: ‘How has Far-UVC light been used in the inactivation of bacteria in transparent suspension?’. The research question was divided into three primary constituent terms, Far-UVC light, Inactivation and Bacteria, with an extensive list of synonyms created for each term. These synonyms were then combined to create search strings for input in the selected databases using Boolean searching. All searching was performed on 23rd February 2024. All search terms and strings are outlined in Tables S1 and S2 of the Supplementary Materials.
A total of 483 studies met the initial inclusion criteria across the three databases after duplicates and non-English language publications were discounted. The screening of studies through their titles, abstracts and full contents where necessary yielded 25 studies for inclusion, as outlined in the flowchart presented in Figure 2. Excluded studies included those using light sources beyond the Far-UVC range, those in which bacteria were irradiated after spreading on surfaces and those which employed nutritious or opaque suspending media. All specific inclusion and exclusion criteria are detailed in Table 1.
Data were manually collected from studies, whether documented in text or presented in tables or graphs, following the method outlined by Tomb, et al. [37]. In short, from each paper, the highest reported dose for the greatest statistically significant inactivation was recorded. In the case of data provided only graphically, pixels were digitally counted to ensure the recorded data were as accurate as possible. In the case of data with evidence of a prominent tailing of inactivation as the dose increased, the dose and relative inactivation prior to this tailing was recorded instead.
As earlier outlined, data were gathered with the goal of exploring the effects of a range of variables on Far-UVC dose–response. These variables included bacterial variables (genus/species, Gram type and cell form) and experimental variables (cell density and irradiance). Values for the experimental variables were not present in all publications intended for inclusion. Consequently, studies were included only in the categories for which all data were specified. Furthermore, to enable an effective comparison of dose–responses, the 1-Log10 ID value, where not specified in a publication, was calculated as outlined in the previous section, using Equation (2). For both the variables of cell density and irradiance, only species for which experimental data relating to three or more unique cell densities/irradiances were available were included. All calculations were rounded to two significant figures.
In total, data relating to the inactivation of 30 different bacterial species was extracted from 25 studies, with 322 unique data values. These data related to 10 Gram-negative and 20 Gram-positive species, three species with data for both their endospore and vegetative cell forms, seven species with data for their endospore form alone and 20 species with data for vegetative cells alone.
Data were gathered according to bacterial species; one species category could include multiple individual strains. In the case of species for which there were multiple data points retrieved for a single variable (e.g., cell density), the median value was calculated and used to limit the effect of potential outliers, as carried out by Hessling et al. [2]. Data for uncommon or genetically modified mutant strains were excluded due to the potential for unexpected results.

2.3. Statistical Analysis

For all experimental work described, a paired t-test was used to compare surviving bacterial populations at each dose point with their respective starting cell density to determine statistical significance. Pearson correlation values were also calculated between the surviving bacterial population and applied dose. For systematised review data, Pearson correlation values were calculated between two variables where three or more unique data points were available.
All statistical calculations were performed at the 95% confidence level using Minitab (v18) software (Minitab LLC, State College, PA, USA). All graphs were created using Origin (v2019b) software (OriginLab Corp, Northampton, MA, USA). The Pearson correlation coefficient value designations, as outlined by Mukaka [38] and shown in Table 2, were used in all cases when describing the relationship between variables.
When describing some values, the term mean* has been used. This term describes the mean of a collection of median values for a specific variable for a collective group. For example, the mean* Far-UVC 1-Log10 ID for Gram-negative vegetative cells was calculated by determining the average of the median 1-Log10 ID values for the vegetative cells of all Gram-negative species for which data were available.

3. Results

3.1. Experimental Analysis of the Germicidal Efficacy of Far-UVC Light

The following sections detail the experimental results for the inactivation of E. coli, E. faecium, P. aeruginosa and S. aureus while suspended in PBS at a range of cell densities (101 to 107 CFU·mL−1), using Far-UVC light at a single irradiance of 0.62 mW·cm−2 (Figure 3).

3.1.1. Effect of Cell Density on Far-UVC Bactericidal Efficacy

In cell densities of 101, 102 and 103 CFU·mL−1, there was a notable reduction in the number of viable bacteria for all four species with exposure to the minimum dose of 4.99 mJ·cm−2 (Figure 3a–c). This reduction was most pronounced in P. aeruginosa, with this minimum dose achieving ≥98.65% inactivation from all three cell densities (p ≤ 0.021). This reduction reached statistical significance by a dose of 9.99 mJ·cm−2 for E. coli, P. aeruginosa and S. aureus (p ≤ 0.021), with ≥94.70% inactivation achieved in all three species. However, for a statistically significant reduction to be achieved in E. faecium across all three cell densities, a dose of 14.98 mJ·cm−2 was required, achieving ≥76.68% inactivation (p ≤ 0.003).
Enterococcus faecium was consistently the most challenging species to inactivate across all three cell densities. For example, in a cell density of 101 CFU·mL−1, complete measurable inactivation was achieved at or below 14.98 mJ·cm−2 in all other species. However, in E. faecium, this dose only achieved 80.49% (p = 0.003) inactivation, with a dose of 29.96 mJ·cm−2 needed to achieve complete measurable inactivation (p = 0.008).
Generally, as the cell density increased, so too did the dose required to achieve complete or near complete measurable inactivation (Figure 3f). For example, in a cell density of 101 CFU·mL−1, P. aeruginosa had reached complete measurable inactivation by the minimum dose of 4.99 mJ·cm−2. In a cell density of 103 CFU·mL−1, however, this was not achieved until 9.99 mJ·cm−2. Similarly for S. aureus, in a cell density of 101 CFU·mL−1, complete measurable inactivation was achieved at a dose of 9.99 mJ·cm−2 (p = 0.015), but 14.98 mJ·cm−2 was required to achieve this in a cell density of 103 CFU·mL−1 (p < 0.001).
In the higher cell densities of both 105 and 107 CFU·mL−1 (Figure 3d,e), reductions in viable bacteria were achieved at the minimum dose of 9.99 mJ·cm−2 for all four species. This was statistically significant (p < 0.001) for all species, except E. faecium, which required a dose of 19.97 mJ·cm−2 in a cell density of 105 CFU·mL−1 to reach significant inactivation (74.11% inactivation; p < 0.001).
While relatively similar dose–responses were recorded for E. coli, P. aeruginosa and S. aureus, E. faecium was again the most resilient species to inactivate overall. At the minimum dose of 9.99 mJ·cm−2, ≥98.58% inactivation was achieved in E. coli, P. aeruginosa and S. aureus (p ≤ 0.001) in cell densities of 105 and 107 CFU·mL−1, yet only 48.52% inactivation was achieved in E. faecium in 107 CFU·mL−1 (p = 0.001) and an insignificant 5.81% inactivation in 105 CFU·mL−1 (p = 0.505).
Similarly, a dose of 29.96 mJ·cm−2 achieved complete measurable inactivation in all species in a cell density of 105 CFU·mL−1, except E. faecium, which failed to achieve this even at the maximum dose of 39.94 mJ·cm−2. At the highest cell density of 107 CFU·mL−1, complete measurable inactivation was achieved in all species by the 79.88 mJ·cm−2 dose point (p < 0.001).

3.1.2. Far-UVC 1-Log10 Inactivation Dose (ID) for Differing Cell Densities

The calculated Far-UVC 1-Log10 ID for each species and cell density are presented in Table 3. Across all five cell densities of 101 to 107 CFU·mL−1, the mean 1-Log10 ID calculated for E. coli. E. faecium, P. aeruginosa and S. aureus were 4.63, 11.03, 3.96 and 6.30 mJ·cm−2, respectively. When grouped according to Gram type, the Gram-positive bacteria had a mean 1-Log10 ID of 8.67 mJ·cm−2 and the Gram-negative species had a mean value of 4.29 mJ·cm−2.
For all four species, the identified relationships between cell density and Far-UVC 1-Log10 ID using the Pearson correlation are presented in Figure 4 and varied from strong negative correlation for E. coli to a very strong positive correlation for S. aureus. This relationship was statistically significant only for S. aureus (p = 0.032).

3.2. Literature Review

The results from analysis of the data collected through systematised literature review are detailed in the following paragraphs, according to Far-UVC 1-Log10 ID, cell density and irradiance.

3.2.1. Comparison of Far-UVC 1-Log10 Inactivation Dose

The results for the median Far-UVC 1-Log10 ID for all bacterial species are presented in Figure 5 and Table 4. Clear from the data presented in Figure 5 is the considerable impact made by the number of data sources available for a given species. For example, the interquartile range (IQR) and number of outliers was substantially greater for many of the species with a higher number of data points and source publications (e.g., vegetative cells of Bacillus cereus, Escherichia coli and Staphylococcus aureus). This is likely due to variability in study-to-study parameters, e.g., the spectral output of the light source used; the presence or absence of optical filters; differing strains of bacterial species; the specific optical properties and depth of the suspending liquid, etc.
Considering the data for vegetative cells (Figure 5a), median values ranged from a minimum 1.02 mJ·cm−2 for Campylobacter jejuni to a maximum 49.31 mJ·cm−2 for Bacillus cereus. Vegetative cells of Gram-positive species were more challenging to inactivate than Gram-negative, with a mean* 1-Log10 ID of 10.60 mJ·cm−2 for all Gram-positive species (59 data points). By comparison, for Gram-negative species, this mean* value was 2.73 mJ·cm−2 (40 data points). Therefore, based on the data collected, Gram-positive bacteria required 388.28% of the dose required to achieve the same level of inactivation as Gram-negative species. Within this dataset of vegetative cells alone, of the seven bacterial species with the lowest median 1-Log10 ID, six were Gram-negative. By contrast, the nine bacterial species with the highest median 1-Log10 ID were Gram-positive.
Considering the data for endospores (Figure 5b), B. cereus spores had the highest median 1-Log10 ID at 20.86 mJ·cm−2 (three data points). The endospores of Clostridium pasteurianum had the lowest median 1-Log10 ID at 2.40 mJ·cm−2 (one data point).
When the mean* 1-Log10 ID for all vegetative cells and all endospores was calculated, the values were found to be 7.18 mJ·cm−2 (99 data points) and 10.74 mJ·cm−2 (17 data points), respectively. Therefore, on average, endospores required 149.58% of the dose required by vegetative cells to achieve the same inactivation.
Within the review criteria, three species capable of forming endospores had data available for both their vegetative cell and endospore forms: Bacillus cereus, Bacillus subtilis and Clostridium sporogenes. Of these three, B. cereus alone was more resilient as vegetative cells than as endospores; vegetative cells of this species required 236.39% the dose required by the endospores to achieve the same 1-Log10 inactivation. This seeming superior Far-UVC resilience of the vegetative cell form of B. cereus over the endospore form is discussed at length in Section 4. For B. subtilis and C. sporogenes, by comparison, their endospore form proved more resilient to Far-UVC inactivation. Endospores of B. subtilis required 199.36% the dose required by their vegetative cell form to achieve the same inactivation. Endospores of C. sporogenes required 277.16% the dose required by their vegetative cell form to achieve the same inactivation.

3.2.2. Effect of Bacterial Cell Density on Far-UVC 1-Log10 Inactivation Dose

For the variable of cell density, all data are presented in Figure 6a. Specifically, the effect of this variable on the Far-UVC 1-Log10 ID was considered.
For vegetative cells, those species that met the criteria were the five Gram-positive B. cereus, B. subtilis, L. monocytogenes, S. aureus and S. pyogenes and the three Gram-negative E. coli, P. aeruginosa and S. enterica. There were insufficient data to explore this relationship with endospores. All correlation data are presented in Figure 6b and Table 5.
For the majority of species, there was a positive correlation between cell density and 1-Log10 ID. This correlation was significant in half of the cases. For four of the eight species, B. cereus, L. monocytogenes, S. pyogenes and P. aeruginosa, there was a strong or very strong positive correlation between the two variables (p = 0.015, 0.367, 0.001, <0.001, respectively). In all remaining cases, the correlation was also positive, except in the case of S. enterica (r = −0.430; p = 0.717). It must be noted that although the Pearson correlation was employed to analyse the relationship between the two variables, this is recommended for variables for which there are at least 30 samples; here, it has been employed for some with as few as 3 samples.

3.2.3. Effect of Irradiance on Far-UVC 1-Log10 Inactivation Dose

For the variable of irradiance, all data are presented in Figure 7a. Specifically, the effect of this variable on the Far-UVC 1-Log10 ID was considered.
Across both vegetative cells and endospores, there were seven species in total, with B. cereus being the only species to feature in both categories. The other vegetative cells were the three Gram-positive species B. subtilis, L. monocytogenes and S. aureus and the three Gram-negative species E. coli, P. aeruginosa and S. enterica.
Data for this variable are outlined in Figure 7b and Table 6. When the correlation between 1-Log10 ID and the irradiance used was explored, there was no obvious relationship for most species. In seven of the eight cases, there was either a negligible or weak positive correlation between the two variables. A strong positive relationship was identified only for S. enterica. Significance (p < 0.05) was not reached in any of the eight cases.

4. Discussion

This study had two overarching goals. Firstly, we sought to investigate experimentally the Far-UVC dose–response of common pathogenic bacterial species from a range of cell densities suspended in a minimal medium. This would establish the fundamental efficacy of Far-UVC for bacterial inactivation. Secondly, we aimed to perform a thorough comparison of the experimental findings with all relevant published data and, in doing so, to determine how bacterial variables (genus/species, Gram type and cell form) and experimental variables (irradiance and cell density) affect that dose–response. Furthermore, this study was intended to act as a useful reference for other researchers on the topic of Far-UVC-based bacterial inactivation. The following paragraphs discuss the experimental and systematised review findings according to each of the variables involved.

4.1. Influence of Gram Type on Susceptibility to Far-UVC Inactivation

One common grouping method when assessing bacterial susceptibility to inactivation is Gram type. However, from an initial scoping search, the uncertainty of a Gram-type effect on Far-UVC bactericidal efficiency was evident.
In their work with foodborne pathogens, Kang et al. [43] compared the Far-UVC inactivation of two Gram-positive (S. aureus and L. monocytogenes) and two Gram-negative (S. typhimurium and E. coli) bacteria, finding the Gram-positive species to be more resistant to inactivation. Similarly, when data from Narita et al. [4] was examined, which explored the inactivation of seven Gram-positive and -negative species as vegetative cells, the two most resilient species were Gram-positive B. cereus and C. sporogenes. Yet, the second-to-least resilient species identified was the Gram-positive S. aureus. Furthermore, the 1-Log10 ID for S. aureus was lower than that of the Gram-negative species S. enterica, E. coli and P. aeruginosa. Gierke and Hessling [39] explored the use of non-pathogenic surrogates for ESKAPE pathogens with Gram-positive E. mundtii and S. carnosus and Gram-negative A. kookii, P. fluorescens and E. coli. They found Gram-negative E. coli to be the most resilient of the five species to Far-UVC inactivation, with the second and third most resilient being the Gram-positive E. mundtii and S. carnosus.
While these examples provide only a brief overview of the published data, they highlight the absence of an obvious Gram-type effect on Far-UVC inactivation. Through the combination of experimental work and a systematised review of the existing work on the topic, it was hoped that this effect could be irrefutably proved or disproved.
From the experimental work with E. coli, E. faecium, P. aeruginosa and S. aureus, there appeared to be a clear Gram-type effect. The mean 1-Log10 ID values for the Gram-positive and -negative species were 8.67 mJ·cm−2 and 4.30 mJ·cm−2, respectively (Table 3). From the systematised review data, for vegetative cells considered in isolation, it was found that the mean* 1-Log10 ID for Gram-positive species was 10.60 mJ·cm−2 compared with 2.73 mJ·cm−2 for Gram-negative species (Figure 5). As such, both result sets provide considerable evidence in favour of a Gram-type effect on Far-UVC resilience, with Gram-negative species more susceptible to inactivation.

4.2. Influence of Genus/Species on Susceptibility to Far-UVC Inactivation

In the experimental work, there was some variance in 1-Log10 ID between the four species used. While the dose–response of E. coli, P. aeruginosa and S. aureus was relatively similar in all experimental work, the behaviour of E. faecium differed considerably. Across all cell densities, E. faecium consistently required higher Far-UVC doses to achieve similar levels of inactivation to the other bacteria (Figure 3 and Table 3). This has also been noted in other studies where Enterococcus spp. have proven resilient to decontamination [61,62]. Unfortunately, the experimental work performed did not include multiple species from any single genus, excluding the possibility of any intra-genus comparison.
However, within the collected systematised review data, this was possible, and some variance in 1-Log10 ID was recorded (Table 4). For example, S. epidermidis and S. aureus had median 1-Log10 ID values of 5.14 mJ·cm−2 (3 data points) and 4.31 mJ·cm−2 (20 data points), a 16.15% reduction in the required dose to achieve the same outcome. More surprisingly, the median 1-Log10 ID for vegetative cells of B. cereus was 49.31 mJ·cm−2 (eight data points). However, a 90.51% reduction in dose to 4.68 mJ·cm−2 (10 data points) achieved the same level of inactivation in B. subtilis, suggesting that for some genera, a large inter-species effect may be observed.
The mean 1-Log10 ID values for individual species measured in the experimental work were generally comparable to the median values calculated through the systematised review (Table 3 and Table 4). For E. coli, the experimentally recorded mean 1-Log10 ID value was 4.63 mJ·cm−2 and the collected data median was 4.32 mJ·cm−2; for P. aeruginosa, the experimentally recorded mean value was 3.96 mJ·cm−2 and the collected data median was 3.43 mJ·cm−2; for S. aureus, the experimentally recorded mean value was 6.30 mJ·cm−2 and the collected data median was 4.31 mJ·cm−2. Unfortunately, E. faecium was not represented in the data collected within the confines of the systematised review. The closest related species with collected data was Enterococcus mundtii, a species from the same genus as E. faecium. For E. faecium, the experimentally recorded mean value was 11.03 mJ·cm−2 and the collected data median value for E. mundtii was 6.90 mJ·cm−2. In the collected data, E. mundtii showed the fourth highest median 1-Log10 ID of 23 species of vegetative cells after Bacillus cereus, Streptococcus pyogenes and Mycobacterium smegmatis.
These results demonstrate that some inter-genera and inter-species differences exist in bacterial response to Far-UVC irradiation. This is unsurprising, given the morphological and biochemical variation across genera and species [63]. However, they also demonstrate that the majority of species can be effectively inactivated by relatively low, common Far-UVC doses: for all vegetative cells, the mean* 1-Log ID of 7.18 mJ·cm−2 would achieve ≥1-Log10 inactivation in 87% of the species included in this review; similarly for endospores, the mean* 1-Log10 ID of 10.74 mJ·cm−2 would achieve ≥1-Log10 inactivation in 60% of all species included.

4.3. Influence of Cell Form on Susceptibility to Far-UVC Inactivation

With regard to cell form, the experimental work involved only vegetative cells and no endospores. However, both forms were included in the systematised review of literature. Rather unsurprisingly, endospores prove challenging to inactivate using Far-UVC. For example, when both vegetative cells and endospores were considered side by side by Narita et al. [4], they found B. cereus and C. sporogenes endospores to be the most resilient of 10 cell and endospore types tested. In fact, when ranked in terms of inactivation resilience, three of the top four places were occupied by endospores, with only the vegetative form of B. cereus displacing endospores of C. difficile from the third position. Similarly, when data from Taylor et al. [3] was scrutinised, of the nine cell and endospore types included, the four highest 1-Log10 IDs were for endospores.
The data from the systematised review broadly supported this conclusion, with the mean* 1-Log10 ID for endospores 149.58% that of the vegetative cells. This generally held true also for species for which the data were collected for both the endospore and vegetative cell form, with two of the three species proving more resilient as an endospore than a vegetative cell.
However, notably for B. cereus, the vegetative cell form was found to be substantially more resilient than its endospore form, with median 1-Log10 ID values of 49.31 and 20.86 mJ·cm−2, respectively. This was a very surprising result, given that previous research has found spores of Bacillus species to be between 5 and 50 times more resilient to UV radiation than their vegetative counterparts [64]. However, when the contributing papers were scrutinised further, it was discovered that one publication in particular had a substantial impact on this median value. Matafonova et al. [40], using vegetative cells of B. cereus, B. subtilis, E. coli, S. aureus and S. pyogenes at a range of cell densities from 102 to 107 CFU·mL−1, found that cell densities at 106 and 107 CFU·mL−1 resulted ‘in a higher tailing plateau and nonlinear survival curves’ [40] (p. 512). That is, the rate of inactivation was particularly low and, in some cases, ≥102 CFU·mL−1 surviving bacteria remained, even at doses approximating 585 mJ·cm−2. Moreover, in some cases, the doses required by Matafonova et al. [40] at lower cell densities were considerably higher than those published elsewhere to achieve comparable inactivation. While the work of Matafonova et al. [40] met all inclusion criteria, it had a substantial effect on the 1-Log10 ID value for vegetative cells of B. cereus in particular, supplying six of the eight data points used to calculate it. As such, this may explain why the endospores of B. cereus were found to be less resilient to Far-UVC inactivation than their vegetative cell counterparts. Furthermore, this highlights challenges with the collation and comparison of data generated using similar experimental methods and the potential for a single publication to dramatically impact outcomes and conclusions. Worthy of note is that all publications included in the systematised review which tested the Far-UVC inactivation of vegetative cell and endospore forms within a single study found the endospore forms to be more resilient (B. cereus: [4,7]; C. sporogenes: [4]; B. subtilis: [3]).

4.4. Influence of Bacterial Cell Density on Susceptibility to Far-UVC Inactivation

Intuitively, the higher the cell density, the greater the resulting Far-UVC dose required to achieve complete inactivation. This has been demonstrated within the reviewed publications [40] and the presented experimental results (Figure 3). However, the potential effects of cell density on the efficiency of inactivation are less clear.
In higher cell densities, a decrease in bactericidal efficiency has been identified for other UVC light sources with peak outputs around 254 nm [65,66]. As of yet, however, little research has investigated this for Far-UVC light. Furthermore, given the differing bactericidal mechanisms employed by 254 nm and Far-UVC, the dose–response curves and their typical phenomena (e.g., lagging and tailing) may also differ.
The reduced bactericidal efficiency of light-based inactivation at higher cell densities has historically been attributed to the shielding or shadowing of cells [65,67,68]. Within the context of the systematised review, this phenomenon was referenced by Matafonova et al. [40]. In the experimental work, the effect of cell density on 1-Log10 ID produced largely inconclusive results, ranging from a strong negative correlation for E. coli (r = −0.701; p = 0.187) to a very strong positive correlation for S. aureus (r = 0.910; p = 0.032) (Figure 4). As such, based on the experimental work, no clear relationship between 1-Log ID and cell density was identified.
To examine the same relationship for data collected through the systematised review, the Pearson correlation was again used (Figure 6, Table 5). Only vegetative cells met the inclusion criteria. For four of the eight species (B. cereus, L. monocytogenes, S. pyogenes and P. aeruginosa), there was a strong or very strong positive correlation between the two variables. In all remaining cases the correlation was also positive, except in the case of S. enterica (r = −0.430; p = 0.717). The identified correlation reached statistical significance for half of the species. For all those that reached statistical significance, the correlations were moderately positive to very strong positive. These results suggest that efficiency of inactivation may decrease as cell density increases. Furthermore, of the eight species included here, five were assessed within the single study conducted by Matafonova et al. [40]. The authors concluded too that, for the numbers and species used, inactivation efficiency decreased with increased cell density and dramatically so at densities ≥106 CFU·mL−1.
Regarding dose–response phenomena, the two focused on here were lagging and tailing. The presence of a shoulder in a dose–response curve has been considered the result of one of two possibilities: either a lag dose or lag time. In the case of the former, it is proposed that a threshold dose to initiate inactivation must be reached, before which little inactivation occurs; the latter proposes that there is a lag in time between initiation of irradiation and the resulting inactivation [69]. Tailing in bacterial inactivation is thought to result from several factors: the most resistant survivors requiring higher doses to achieve the same inactivation as the bacterial cells surrounding them [69]; the tendency of some cells and spores to form aggregates [70]; and the shadowing or shielding of cells by others overlying them [68].
Within the experimental results, a shoulder and tailing were most evident for E. faecium (Figure 3). This is likely due to its relative increased resistance to inactivation and, consequently, the greater observable detail afforded by its slower inactivation relative to dose. It is likely too, that, with sufficiently small dose intervals, such detail would also have been observed in the other species.
There was also some evidence of tailing in the experimental data. This was most obvious at higher cell densities. For example, for E. faecium in a cell density of 107 CFU·mL−1, increasing the dose from 19.97 to 39.94 mJ·cm−2 increased the mean inactivation from 2.21-Log10 to 4.91-Log10. Yet, a further dose increase to 59.91 mJ·cm−2 only achieved a further 0.03-Log10 inactivation. Similarly, in a cell density of 105 CFU·mL−1 for S. aureus, a dose of 9.99 mJ·cm−2 achieved a mean 3.18-Log10 inactivation, yet doubling that dose to 19.97 mJ·cm−2 only increased that mean inactivation by 0.82-Log10, without achieving complete measurable inactivation.
Yet, obvious tailing was not generally observed. Therefore, it can be concluded from the experimental work that although there is some evidence of tailing in the Far-UVC dose–response, it is not a dramatic feature of the results using the experimental setup employed here. Moreover, like the presence of a shoulder, it too appears to be more obviously present at higher cell densities. As previously highlighted, within the systematised review, Matafonova et al. [40] observed tailing in inactivation curves and also noted that this phenomena was accentuated by higher cell densities.

4.5. Influence of Irradiance on Susceptibility to Far-UVC Inactivation

The Bunsen–Roscoe law of reciprocity maintains that the photochemical reaction induced by irradiation is based solely on dose and is independent of irradiance and time [71]. Little practical research has been performed using UVC or Far-UVC specifically to test this theory. Furthermore, for other UV light sources, there are both supporting and dissenting accounts. Pousty et al. [72] found while using a wavelength of 265 nm to inactivate E. coli, that inactivation was independent of irradiance. However, they also found inactivation was irradiance-dependent for wavelengths of 285 and 295 nm. Yet, at 265 nm, Matsumoto et al. [73] recorded a bactericidal efficacy difference of an order of magnitude at a single dose by reducing the irradiance by 2–3 orders of magnitude. Contrary to the findings of Pousty et al. [72] at 285 and 295 nm, Matsumoto et al. [73] also found that inactivation was independent of the dose for a similar wavelength of 308 nm.
The experimental work performed in this study involved only a single irradiance and therefore could not be included in this section. Within the inclusion criteria of the systematised review, only a single publication employed more than one irradiance. Sugihara et al. [56] placed samples at two locations in a room at different distances from a Far-UVC light source, resulting in irradiance values of 0.001 and 0.0015 mW·cm−2. Consequently, there was insufficient review data collected from a single research study to gain proper insight into the effect of irradiance on the 1-Log10 ID.
However, when all systematised review literature was considered, seven species met the inclusion criteria, with B. cereus meeting it as both an endospore and vegetative cell. As such, there were three Gram-negative species and four Gram-positive species represented. In all but one case, there was a weak or negligible correlation between irradiance and the 1-Log10 ID. The exception was S. enterica, which had a strong positive correlation (r = 0.729) based on four data points. However, in none of the eight cases did the correlation reach statistical significance (p ≥ 0.148 for all).
These results suggest that the 1-Log10 ID and therefore inactivation efficiency for a species is independent of the irradiance used. While it is possible that this is true only over the irradiance range employed by the studies included here, the range was substantial, stretching from 0.001 to 5 mW·cm−2.

5. Conclusions

Several conclusions can be drawn from this study investigating the fundamental efficacy of Far-UVC bacterial inactivation in transparent minimal media. From both the experimental and systematised review work, a Gram-type effect on Far-UVC resilience was evident, with Gram-positive species generally requiring higher Far-UVC doses than Gram-negative species to achieve a similar level of inactivation. Although some inter-species and inter-genus differences in Far-UVC resilience were observed, the calculated mean* Far-UVC 1-Log ID was relatively low for both vegetative cell and endospores at 7.18 and 10.74 mJ·cm−2, respectively. Furthermore, it was shown that these doses are sufficient to achieve ≥1-Log10 inactivation in the majority of species included in this study. Regarding cell form, endospores in general displayed higher resilience to Far-UVC light than vegetative cells, as expected. Although there was some suggestion from the systematised review data that the efficiency of inactivation may decrease with increased cell density, this was not generally observed experimentally; further experimental work is required to accurately define this relationship. Finally, the Far-UVC dose–response curves from the experimental work generally displayed the typical phenomena seen in other UV dose–response curves of a shoulder and tailing. However, this was most evident at higher cell densities; smaller dose intervals than those employed here would likely accentuate these features.
In conclusion, this study has shown Far-UVC light to be an effective decontamination tool against a range of bacterial vegetative cells and endospores. Consequently, this technology may offer a valuable tool in the fight against AMR and hospital-associated infections. Furthermore, this study will act as a useful reference index for other researchers.

Supplementary Materials

The following supporting information can be downloaded at: https://www.mdpi.com/article/10.3390/pathogens13080698/s1, Table S1: Database information and search fields used in systematised literature review; Table S2: The search terms and Boolean operators used in the systematised literature review.

Author Contributions

Conceptualization, D.T.G., T.G. and M.M.; data curation, D.T.G.; formal analysis, D.T.G.; funding acquisition, D.T.G. and T.G.; methodology, D.T.G. and M.M.; project administration, D.T.G.; resources, T.G. and M.M.; supervision, T.G. and M.M.; writing—original draft, D.T.G.; writing—review and editing, T.G. and M.M. All authors have read and agreed to the published version of the manuscript.

Funding

This work was supported by a University of Strathclyde PhD Studentship award to D.T.G. and TSI Technology Limited (2020–2023).

Institutional Review Board Statement

Not applicable.

Informed Consent Statement

Not applicable.

Data Availability Statement

Data supporting this publication are stored by the University of Strathclyde. Details of the data and how they can be accessed are available from the University of Strathclyde KnowledgeBase at https://doi.org/10.15129/60aba21d-b58e-4617-baf4-79f48ebdb26d (accessed 24 July 2024).

Acknowledgments

The authors wish to acknowledge the technical support from Frank Cox at the Department of EEE, the University of Strathclyde, for his work in initial setup of the light source.

Conflicts of Interest

The authors declare no conflicts of interest.

References

  1. Eadie, E.; Hiwar, W.; Fletcher, L.; Tidswell, E.; O’Mahoney, P.; Buonanno, M.; Welch, D.; Adamson, C.S.; Brenner, D.J.; Noakes, C.; et al. Far-UVC (222 nm) Efficiently Inactivates an Airborne Pathogen in a Room-sized Chamber. Sci. Rep. 2022, 12, 4373. [Google Scholar] [CrossRef]
  2. Hessling, M.; Haag, R.; Sicks, B. Review of Microbial Touchscreen Contamination for the Determination of Reasonable Ultraviolet Disinfection Doses. GMS Hyg. Infect. Control 2021, 16, Doc30. [Google Scholar] [CrossRef]
  3. Taylor, W.; Camilleri, E.; Craft, D.L.; Korza, G.; Granados, M.R.; Peterson, J.; Szczpaniak, R.; Weller, S.K.; Moeller, R.; Douki, T.; et al. DNA Damage Kills Bacterial Spores and Cells Exposed to 222-Nanometer UV Radiation. Appl. Environ. Microbiol. 2020, 86, e03039-19. [Google Scholar] [CrossRef]
  4. Narita, K.; Asano, K.; Naito, K.; Ohashi, H.; Sasaki, M.; Morimoto, Y.; Igarashi, T.; Nakane, A. Ultraviolet C Light with Wavelength of 222 nm Inactivates a Wide Spectrum of Microbial Pathogens. J. Hosp. Infect. 2020, 105, 459–467. [Google Scholar] [CrossRef] [PubMed]
  5. Kitagawa, H.; Nomura, T.; Nazmul, T.; Omori, K.; Shigemoto, N.; Sakaguchi, T.; Ohge, H. Effectiveness of 222-nm Ultraviolet Light on Disinfecting SARS-CoV-2 Surface Contamination. Am. J. Infect. Control 2021, 49, 299–301. [Google Scholar] [CrossRef]
  6. Oh, C.; Sun, P.P.; Araud, E.; Nguyen, T.H. Mechanism and Efficacy of Virus Inactivation by a Microplasma UV Lamp Generating Monochromatic UV Irradiation at 222 nm. Water Res. 2020, 186, 116386. [Google Scholar] [CrossRef] [PubMed]
  7. Clauß, M. Higher Effectiveness of Photoinactivation of Bacterial Spores, UV Resistant Vegetative Bacteria and Mold Spores with 222 nm Compared to 254 nm Wavelength. Acta Hydrochim. Hydrobiol. 2006, 34, 525–532. [Google Scholar] [CrossRef]
  8. Navarathna, T.; Jinadatha, C.; Corona, B.A.; Coppin, J.D.; Choi, H.; Bennett, M.R.; Ghamande, G.S.; Williams, M.D.; Keene, R.E.; Chatterjee, P. Efficacy of a Filtered Far-UVC Handheld Disinfection Device in Reducing the Microbial Bioburden of Hospital Surfaces. Am. J. Infect. Control. 2023, 51, 1406–1410. [Google Scholar] [CrossRef]
  9. Hessling, M.; Sicks, B.; Lau, B. Far-UVC Radiation for Disinfecting Hands or Gloves? Pathogens 2023, 12, 213. [Google Scholar] [CrossRef]
  10. Yin, R.; Anderson, C.E.; Zhao, J.; Boehm, A.B.; Mitch, W.A. Controlling Contaminants Using a Far-UVC-based Advanced Oxidation Process for Potable Reuse. Nat. Water 2023, 1, 555–562. [Google Scholar] [CrossRef]
  11. Zhao, J.; Payne, E.M.; Liu, B.; Shang, C.; Blatchley, E.R.; Mitch, W.A.; Yin, R. Making Waves: Opportunities and Challenges of Applying Far-UVC Radiation in Controlling Micropollutants in Water. Water Res. 2023, 241, 120169. [Google Scholar] [CrossRef] [PubMed]
  12. Wang, Y.; Ma, B.; Zhao, J.; Tang, Z.; Li, W.; He, C.; Xia, D.; Linden, K.G.; Yin, R. Rapid Inactivation of Fungal Spores in Drinking Water by Far-UVC Photolysis of Free Chlorine. Environ. Sci. Technol. 2023, 57, 21876–21887. [Google Scholar] [CrossRef]
  13. Mesquita, P.J.B.d.; Sokas, R.K.; Rice, M.B.; Nardell, E.A. Far-UVC: Technology Update with an Untapped Potential to Mitigate Airborne Infections. Ann. Am. Thorac. Soc. 2023, 20, 1700–1702. [Google Scholar] [CrossRef]
  14. Wang, M.; Lai, A.C.K. Experimental Study on Enhancing Single-pass Air Disinfection Efficacy for Portable Disinfection Systems with Different Far-UVC Sources. Build Environ. 2024, 261, 111742. [Google Scholar] [CrossRef]
  15. Buonanno, M.; Ponnaiya, B.; Welch, D.; Stanislauskas, M.; Randers-Pehrson, G.; Smilenov, L.; Lowy, F.D.; Owens, D.M.; Brenner, D.J. Germicidal Efficacy and Mammalian Skin Safety of 222-nm UV Light. Radiat. Res. 2017, 187, 483–491. [Google Scholar] [CrossRef]
  16. Tavares, R.S.N.; Adamoski, D.; Girasole, A.; Lima, E.N.; da Silva Justo-Junior, A.; Domingues, R.; Silveira, A.C.C.; Marques, R.E.; de Carvalho, M.; Ambrosio, A.L.B.; et al. Different Biological Effects of Exposure to Far-UVC (222 nm) and Near-UVC (254 nm) Irradiation. J. Photochem. Photobiol. B 2023, 243, 112713. [Google Scholar] [CrossRef] [PubMed]
  17. Narita, K.; Asano, K.; Morimoto, Y.; Igarashi, T.; Nakane, A. Chronic Irradiation with 222-nm UVC Light Induces Neither DNA Damage nor Epidermal Lesions in Mouse Skin, Even at High Doses. PLoS ONE 2018, 13, e0201259. [Google Scholar] [CrossRef] [PubMed]
  18. Narita, K.; Asano, K.; Morimoto, Y.; Igarashi, T.; Hamblin, M.R.; Dai, T.; Nakane, A. Disinfection and Healing Effects of 222-nm UVC Light on Methicillin-resistant Staphylococcus aureus Infection in Mouse Wounds. J. Photochem. Photobiol. B 2018, 178, 10–18. [Google Scholar] [CrossRef]
  19. Kaidzu, S.; Sugihara, K.; Sasaki, M.; Nishiaki, A.; Igarashi, T.; Tanito, M. Evaluation of Acute Corneal Damage Induced by 222-nm and 254-nm Ultraviolet Light in Sprague–Dawley Rats. Free Radic. Res. 2019, 53, 611–617. [Google Scholar] [CrossRef]
  20. Coohill, T.P. Virus-Cell Interactions as Probes for Vacuum-Ultraviolet Radiation Damage and Repair. Photochem. Photobiol. 1986, 44, 359–363. [Google Scholar] [CrossRef]
  21. Scarpa, F.; Branda, F.; Petrosillo, N.; Ciccozzi, M. On the SARS-CoV-2 Variants. Infect. Dis. Rep. 2024, 16, 289–297. [Google Scholar] [CrossRef] [PubMed]
  22. Buonanno, M.; Kleiman, N.J.; Welch, D.; Hashmi, R.; Shuryak, I.; Brenner, D.J. 222 nm Far-UVC Light Markedly Reduces the Level of Infectious Airborne Virus in an Occupied Room. Sci. Rep. 2024, 14, 6722. [Google Scholar] [CrossRef] [PubMed]
  23. Buonanno, M.; Welch, D.; Shuryak, I.; Brenner, D.J. Far-UVC Light (222 nm) Efficiently and Safely Inactivates Airborne Human Coronaviruses. Sci. Rep. 2020, 10, 10285. [Google Scholar] [CrossRef] [PubMed]
  24. Song, B.M.; Lee, G.H.; Han, H.J.; Yang, J.H.; Lee, E.G.; Gu, H.; Park, H.K.; Ryu, K.; Kim, J.; Kang, S.M.; et al. Ultraviolet-C Light at 222 nm Has a High Disinfecting Spectrum in Environments Contaminated by Infectious Pathogens, Including SARS-CoV-2. PLoS ONE 2023, 18, e0294427. [Google Scholar] [CrossRef] [PubMed]
  25. Khan, H.A.; Baig, F.K.; Mehboob, R. Nosocomial Infections: Epidemiology, Prevention, Control and Surveillance. Asian Pac. J. Trop. Biomed 2017, 7, 478–482. [Google Scholar] [CrossRef]
  26. Opal, S.M.; Garber, G.E.; LaRosa, S.P.; Maki, D.G.; Freebairn, R.C.; Kinasewitz, G.T.; Dhainaut, J.-F.; Yan, S.B.; Williams, M.D.; Graham, D.E.; et al. Systemic Host Responses in Severe Sepsis Analyzed by Causative Microorganism and Treatment Effects of Drotrecogin Alfa (Activated). Clin. Infect. Dis. 2003, 37, 50–58. [Google Scholar] [CrossRef]
  27. Blanco, J.; Muriel-Bombín, A.; Sagredo, V.; Taboada, F.; Gandía, F.; Tamayo, L.; Collado, J.; García-Labattut, Á.; Carriedo, D.; Valledor, M.; et al. Incidence, Organ Dysfunction and Mortality in Severe Sepsis: A Spanish Multicentre Study. Crit. Care 2008, 12, R158. [Google Scholar] [CrossRef]
  28. Treacher, D.F.; Brown, K.A. The Basic Science of Sepsis. Surgery 2009, 27, 465–469. [Google Scholar] [CrossRef]
  29. Phua, J.; Ngerng, W.J.; See, K.C.; Tay, C.K.; Kiong, T.; Lim, H.F.; Chew, M.Y.; Yip, H.S.; Tan, A.; Khalizah, H.J.; et al. Characteristics and Outcomes of Culture-negative versus Culture-positive Severe Sepsis. Crit. Care 2013, 17, R202. [Google Scholar] [CrossRef]
  30. Murray, C.J.; Ikuta, K.S.; Sharara, F.; Swetschinski, L.; Aguilar, G.R.; Gray, A.; Han, C.; Bisignano, C.; Rao, P.; Wool, E.; et al. Global Burden of Bacterial Antimicrobial Resistance in 2019: A Systematic Analysis. Lancet 2022, 399, 629–655. [Google Scholar] [CrossRef]
  31. Kolář, M. Bacterial Infections, Antimicrobial Resistance and Antibiotic Therapy. Life 2022, 12, 468. [Google Scholar] [CrossRef] [PubMed]
  32. MacIsaac, S.A.; Rauch, K.D.; Prest, T.; Simons, R.M.; Gagnon, G.A.; Stoddart, A.K. Improved Disinfection Performance for 280 nm LEDs Over 254 nm Low-pressure UV Lamps in Community Wastewater. Sci. Rep. 2023, 13, 7576. [Google Scholar] [CrossRef]
  33. Stewart, C.F.; Tomb, R.M.; Ralston, H.J.; Armstrong, J.; Anderson, J.G.; MacGregor, S.J.; Atreya, C.D.; Maclean, M. Violet-blue 405-nm Light-based Photoinactivation for Pathogen Reduction of Human Plasma Provides Broad Antibacterial Efficacy Without Visible Degradation of Plasma Proteins. Photochem. Photobiol. 2022, 98, 504–512. [Google Scholar] [CrossRef]
  34. Meurle, T.; Knaus, J.; Barbano, A.; Hoenes, K.; Spellerberg, B.; Hessling, M. Photoinactivation of Staphylococci with 405 nm Light in a Trachea Model with Saliva Substitute at 37 °C. Healthcare 2021, 9, 310. [Google Scholar] [CrossRef] [PubMed]
  35. Vollmerhausen, T.L.; Conneely, A.; Bennett, C.; Wagner, V.E.; Victor, J.C.; O’Byrne, C.P. Visible and UVA Light as a Potential Means of Preventing Escherichia coli Biofilm Formation in Urine and on Materials Used in Urethral Catheters. J. Photochem. Photobiol. B 2017, 170, 295–303. [Google Scholar] [CrossRef]
  36. Claus, H. Ozone Generation by Ultraviolet Lamps. Photochem. Photobiol. 2021, 97, 471–476. [Google Scholar] [CrossRef]
  37. Tomb, R.M.; White, T.A.; Coia, J.E.; Anderson, J.G.; MacGregor, S.J.; Maclean, M. Review of the Comparative Susceptibility of Microbial Species to Photoinactivation Using 380-480 nm Violet-Blue Light. Photochem. Photobiol. 2018, 94, 445–458. [Google Scholar] [CrossRef] [PubMed]
  38. Mukaka, M.M. Statistics Corner: A Guide to Appropriate Use of Correlation Coefficient in Medical Research. Malawi Med. J. 2012, 24, 69–71. [Google Scholar] [PubMed]
  39. Gierke, A.M.; Hessling, M. Investigation on Potential ESKAPE Surrogates for 222 and 254 nm Irradiation Experiments. Front. Microbiol. 2022, 13, 942708. [Google Scholar] [CrossRef]
  40. Matafonova, G.G.; Batoev, V.B.; Astakhova, S.A.; Gómez, M.; Christofi, N. Efficiency of KrCl Excilamp (222 nm) for Inactivation of Bacteria in Suspension. Lett. Appl. Microbiol. 2008, 47, 508–513. [Google Scholar] [CrossRef]
  41. Sun, W.; Jing, Z.; Zhao, Z.; Yin, R.; Santoro, D.; Mao, T.; Lu, Z. Dose–Response Behavior of Pathogens and Surrogate Microorganisms Across the Ultraviolet-C Spectrum: Inactivation Efficiencies, Action Spectra, and Mechanisms. Environ. Sci. Technol. 2023, 57, 10891–10900. [Google Scholar] [CrossRef]
  42. Jing, Z.; Lu, Z.; Santoro, D.; Zhao, Z.; Huang, Y.; Ke, Y.; Wang, X.; Sun, W. Which UV Wavelength is the Most Effective for Chlorine-Resistant Bacteria in Terms of the Impact of Activity, Cell Membrane and DNA? Chem. Eng. J. 2022, 447, 137584. [Google Scholar] [CrossRef]
  43. Kang, J.W.; Kim, S.S.; Kang, D.H. Inactivation Dynamics of 222 nm Krypton-Chlorine Excilamp Irradiation on Gram-positive and Gram-negative Foodborne Pathogenic Bacteria. Food Res. Int. 2018, 109, 325–333. [Google Scholar] [CrossRef] [PubMed]
  44. Ahlawat, K.; Jangra, R.; Ish, A.; Jain, N.; Prakash, R. A Dielectric Barrier Discharge Based Low Pressure Narrow Band Far UV-C 222 nm Excimer Lamp and its Efficiency Analysis. Phys. Scr. 2024, 99, 025018. [Google Scholar] [CrossRef]
  45. Matsumoto, T.; Hoshiai, T.; Tatsuno, I.; Hasegawa, T. Action Spectra of Bacteria and Purification of Pollutant Water at Faucets Using a Water Waveguide Method. Water 2022, 14, 1394. [Google Scholar] [CrossRef]
  46. Chen, H.; Moraru, C.I. Exposure to 222 nm Far UV-C Effectively Inactivates Planktonic Foodborne Pathogens and Inhibits Biofilm Formation. Innov. Food Sci. Emerg. Technol. 2023, 87, 103411. [Google Scholar] [CrossRef]
  47. Rufyikiri, A.S.; Martinez, R.; Addo, P.W.; Wu, B.-S.; Yousefi, M.; Malo, D.; Orsat, V.; Vidal, S.M.; Fritz, J.H.; MacPherson, S.; et al. Germicidal Efficacy of Continuous and Pulsed Ultraviolet-C Radiation on Pathogen Models and SARS-CoV-2. Photochem. Photobiol. Sci. 2024, 23, 339–354. [Google Scholar] [CrossRef]
  48. Ivanova, I.; Svilenska, T.; Kurz, B.; Grobecker, S.; Maisch, T.; Berneburg, M.; Kamenisch, Y. Improved Spectral Purity of 222-nm Irradiation Eliminates Detectable Cyclobutylpyrimidine Dimers Formation in Skin Reconstructs even at High and Repetitive Disinfecting Doses. Photochem. Photobiol. 2022, 98, 1149–1156. [Google Scholar] [CrossRef]
  49. Wang, Y.; Ma, B.; He, C.; Xia, D.; Yin, R. Nitrate Protects Microorganisms and Promotes Formation of Toxic Nitrogenous Byproducts during Water Disinfection by Far-UVC Radiation. Environ. Sci. Technol. 2023, 57, 9064–9074. [Google Scholar] [CrossRef]
  50. Clauß, M.; Mannesmann, R.; Kolch, A. Photoreactivation of Escherichia coli and Yersinia enterolytica after Irradiation with a 222 nm Excimer Lamp Compared to a 254 nm Low-pressure Mercury Lamp. Acta Hydrochim. Hydrobiol. 2005, 33, 579–584. [Google Scholar] [CrossRef]
  51. Neo, Y.; Hashimoto, G.; Koike, R.; Ohhara, T.; Matsumoto, T. Solid-State Far-Ultraviolet C Light Sources for the Disinfection of Pathogenic Microorganisms Using Graphene Nanostructure Field Emitters. Global Chall 2023, 7, 2200236. [Google Scholar] [CrossRef] [PubMed]
  52. Li, T.; Zhang, Y.; Gan, J.; Yu, X.; Wang, L. Superiority of UV222 Radiation by in Situ Aquatic Electrode KrCl Excimer in Disinfecting Waterborne Pathogens: Mechanism and Efficacy. J. Hazard Mater. 2023, 452, 131292. [Google Scholar] [CrossRef]
  53. Kang, J.W.; Kang, D.H. The Synergistic Bactericidal Mechanism of Simultaneous Treatment with a 222-nanometer Krypton-Chlorine Excilamp and a 254- nanometer Low-pressure Mercury Lamp. Appl. Environ. Microbiol. 2019, 85, e01952-18. [Google Scholar] [CrossRef] [PubMed]
  54. Ma, B.; Bright, K.; Ikner, L.; Ley, C.; Seyedi, S.; Gerba, C.P.; Sobsey, M.D.; Piper, P.; Linden, K.G. UV Inactivation of Common Pathogens and Surrogates Under 222 nm Irradiation from KrCl* Excimer Lamps. Photochem. Photobiol. 2023, 99, 975–982. [Google Scholar] [CrossRef] [PubMed]
  55. Bohrerova, Z.; Linden, K.G. Assessment of DNA Damage and Repair in Mycobacterium terrae after Exposure to UV Irradiation. J. Appl. Microbiol. 2006, 101, 995–1001. [Google Scholar] [CrossRef] [PubMed]
  56. Sugihara, K.; Kaidzu, S.; Sasaki, M.; Ichioka, S.; Takayanagi, Y.; Shimizu, H.; Sano, I.; Hara, K.; Tanito, M. One-year Ocular Safety Observation of Workers and Estimations of Microorganism Inactivation Efficacy in the Room Irradiated with 222-nm Far Ultraviolet-C Lamps. Photochem. Photobiol. 2023, 99, 967–974. [Google Scholar] [CrossRef]
  57. Aquino de Muro, M.; Shuryak, I.; Uhlemann, A.C.; Tillman, A.; Seeram, D.; Zakaria, J.; Welch, D.; Erde, S.M.; Brenner, D.J. The Abundance of the Potential Pathogen Staphylococcus hominis in the Air Microbiome in a Dental Clinic and its Susceptibility to Far-UVC Light. MicrobiologyOpen 2023, 12, e1348. [Google Scholar] [CrossRef] [PubMed]
  58. Kang, J.W.; Hong, H.N.; Kang, D.H. Application of a Krypton-Chlorine Excilamp to Control Alicyclobacillus acidoterrestris Spores in Apple Juice and Identification of its Sporicidal Mechanism. Appl. Environ. Microbiol. 2020, 86, e00159-20. [Google Scholar] [CrossRef]
  59. Beck, S.E.; Wright, H.B.; Hargy, T.M.; Larason, T.C.; Linden, K.G. Action Spectra for Validation of Pathogen Disinfection in Medium-pressure Ultraviolet (UV) Systems. Water Res. 2015, 70, 27–37. [Google Scholar] [CrossRef]
  60. Wang, D.; Oppenländer, T.; El-Din, M.G.; Bolton, J.R. Comparison of the Disinfection Effects of Vacuum-UV (VUV) and UV Light on Bacillus subtilis Spores in Aqueous Suspensions at 172, 222 and 254 nm. Photochem. Photobiol. 2010, 86, 176–181. [Google Scholar] [CrossRef]
  61. Cetinkaya, Y.; Falk, P.; Mayhall, C.G. Vancomycin-resistant Enterococci. Clin. Microbiol. Rev. 2000, 13, 686–707. [Google Scholar] [CrossRef]
  62. García-Solache, M.; Rice, L.B. The Enterococcus: A Model of Adaptability to Its Environment. Clin. Microbiol. Rev. 2019, 32, 10–1128. [Google Scholar] [CrossRef]
  63. Baron, E.J. Classification. In Medical Microbiology, 4th ed.; University of Texas Medical Branch at Galveston: Galveston, TX, USA, 1996. [Google Scholar]
  64. Setlow, P. Resistance of Spores of Bacillus Species to Ultraviolet Light. Environ. Mol. Mutagen. 2001, 38, 97–104. [Google Scholar] [CrossRef]
  65. Abshire, R.L.; Dunton, H. Resistance of Selected Strains of Pseudomonas aeruginosa to Low-density Ultraviolet Radiation. Appl. Environ. Microbiol. 1981, 41, 1419–1423. [Google Scholar] [CrossRef]
  66. Chatzisymeon, E. Inactivation of Bacteria in Seafood Processing Water by Means of UV Treatment. J. Food Eng. 2016, 173, 1–7. [Google Scholar] [CrossRef]
  67. Muranyi, P.; Wunderlich, J.; Heise, M. Sterilization Efficiency of a Cascaded Dielectric Barrier Discharge. J. Appl. Microbiol. 2007, 103, 1535–1544. [Google Scholar] [CrossRef] [PubMed]
  68. Coohill, T.P.; Sagripanti, J.-L. Overview of the Inactivation by 254 nm Ultraviolet Radiation of Bacteria with Particular Relevance to Biodefense. Photochem. Photobiol. 2008, 84, 1084–1090. [Google Scholar] [CrossRef] [PubMed]
  69. Peleg, M. Microbial Dose-Response Curves and Disinfection Efficacy Models Revisited. Food Eng. Rev. 2021, 13, 305–321. [Google Scholar] [CrossRef]
  70. Blatchley, E., III.; Meeusen, A.; Aronson, A. Inactivation of Bacillus Spores by Ultraviolet or Gamma Radiation. J. Environ. Eng. 2005, 131, 1245–1252. [Google Scholar] [CrossRef]
  71. Wells, W.F. Airborne Contagion and Air Hygiene; Harvard University Press: Cambridge, MA, USA, 1955. [Google Scholar]
  72. Pousty, D.; Hofmann, R.; Gerchman, Y.; Mamane, H. Wavelength-dependent Time–dose Reciprocity and Stress Mechanism for UV-LED Disinfection of Escherichia coli. J. Photochem. Photobiol. B 2021, 217, 112129. [Google Scholar] [CrossRef]
  73. Matsumoto, T.; Tatsuno, I.; Yoshida, Y.; Tomita, M.; Hasegawa, T. Time-dose Reciprocity Mechanism for the Inactivation of Escherichia coli Explained by a Stochastic Process with Two Inactivation Effects. Sci. Rep. 2022, 12, 22588. [Google Scholar] [CrossRef] [PubMed]
Figure 1. Optical profile of the Unilam Kr-Cl excimer lamp. (a) Emission spectrum from the lamp with the power supply set to 180 V, captured using HR4000 spectrometer. Peak emission at 220.97 nm. (b) Irradiance map at 35 cm from Kr-Cl surface over the surface area of a 6-well plate (with the plate outline superimposed on the irradiance map). Irradiance values account for a reduction in transmission caused by a quartz window which covered sample plates during irradiation.
Pathogens 13 00698 g001
Figure 2. Flowchart outlining the publication selection process and the number of publications at each stage in the systematised review, based on the inclusion and exclusion criteria.
Pathogens 13 00698 g002
Figure 3. Bacterial inactivation of E. coli, E. faecium, P. aeruginosa and S. aureus suspended in PBS in cell densities of (a) 101, (b) 102, (c) 103, (d) 105 and (e) 107 CFU·mL−1, using increasing doses of Far-UVC light and an irradiance of 0.62 mW·cm−2 (n ≥ 3 ± SD; detection limit ≤20 CFU·mL−1); * denotes significant inactivation compared with its respective starting population (paired t-test, p < 0.05). (f) Comparison of the dose required to achieve near complete inactivation (<20 CFU·mL−1 surviving) for each bacterial species for each cell density.
Pathogens 13 00698 g003
Figure 4. Bacterial cell density (Log10 CFU·mL−1) versus measured Far-UVC 1-Log10 ID for (a) E. coli, (b) E. faecium, (c) P. aeruginosa and (d) S. aureus. 1-Log10 ID calculated by dividing the dose (mJ·cm−2) at which the greatest statistically significant inactivation was achieved prior to tailing by the corresponding mean inactivation (Log10 CFU·mL−1) (based on the inactivation kinetics presented in Figure 3). Pearson correlation and p-values calculated using Minitab (v18); linear fit performed using Origin (v2019b).
Pathogens 13 00698 g004
Figure 5. Far-UVC inactivation data collected through the systematised literature review showing 1-Log10 ID value (mJ·cm−2) for (a) vegetative cells and (b) endospores. Where 1-Log10 ID is needed to be calculated for an individual species, the dose (mJ·cm−2) at which the greatest statistically significant inactivation was achieved prior to tailing was divided by the corresponding inactivation (Log10 CFU·mL−1).
Pathogens 13 00698 g005
Figure 6. Graphs displaying data collected through systematised review for (a) bacterial cell density versus Far-UVC 1-Log10 ID for all bacterial species, with data pertaining to at least three unique cell densities; (b) straight lines fitted using Origin (v2019b) to demonstrate relationship between cell density and Far-UVC 1-Log10 ID for each individual bacterial species. * denotes significant Pearson correlation (p < 0.05). All bacteria are in vegetative cell form.
Pathogens 13 00698 g006
Figure 7. Graphs displaying data collected through systematised review for (a) irradiance versus Far-UVC 1-Log10 ID for all bacterial species with data pertaining to at least three unique irradiances; (b) straight lines fitted using Origin (v2019b) to demonstrate relationship between irradiance and 1-Log10 ID for each individual bacterial species. Significant Pearson Correlation did not result in any case (p < 0.05). All bacteria are in vegetative cell form unless specified otherwise.
Pathogens 13 00698 g007
Table 1. Inclusion and exclusion criteria employed in systematised review of literature.
Inclusion CriteriaExclusion Criteria
Wavelengths ≥ 200, ≤230 nmWavelengths ≤ 199, ≥231 nm
Transparent liquid suspensionMultiple wavelengths used in combination
Opaque or nutritious liquid suspension
Bacteria on surfaces
Bacteria in aerosols
Pulsed light sources
Cocktails of multiple bacteria
Uncommon or genetically modified mutant strains
Note: Studies were included only in the categories for which all data were specified (i.e., if a publication included information on the irradiance employed experimentally but omitted the cell density, that paper was included only in the irradiance category).
Table 2. Relationship designation method followed for Pearson correlation coefficients, according to values outlined by Mukaka [38].
Pearson Correlation CoefficientRelationship Designation
0.00 to 0.30Negligible correlation
0.30 to 0.50Weak positive or negative
0.50 to 0.70Moderate positive or negative
0.70 to 0.90Strong positive or negative
0.90 to 1.00Very strong positive or negative
Table 3. Dose required for a 1-Log10 inactivation of bacterial species suspended in PBS at a range of cell densities, from 101 to 107 CFU·mL−1, using Far-UVC light at a delivered irradiance of 0.62 mW·cm−2. 1-Log10 ID value was calculated by dividing the dose (mJ·cm−2), at which the greatest statistically significant inactivation was achieved prior to tailing by the corresponding mean inactivation (Log10 CFU·mL−1) (based on the inactivation kinetics presented in Figure 3). From these experimental values, mean 1-Log10 ID values for Gram-positive and -negative species of 8.67 mJ·cm−2 and 4.30 mJ·cm−2 were calculated, respectively.
Far-UVC 1-Log10 Inactivation Dose (mJ·cm−2)
101 CFU·mL−1102 CFU·mL−1103 CFU·mL−1105 CFU·mL−1107 CFU·mL−1Mean ± SD
E. coli6.384.804.953.913.094.63 ± 1.23
E. faecium17.1610.887.957.8711.3011.03 ± 3.78
P. aeruginosa3.112.053.095.905.663.96 ± 1.72
S. aureus6.914.034.135.5510.916.30 ± 2.83
Table 4. Far-UVC 1-Log10 ID value (mJ·cm−2) for all vegetative cells and endospores for which data were collected through systematised review. Where 1-Log10 ID needed to be calculated for an individual species, the dose (mJ·cm−2) at which the greatest statistically significant inactivation was achieved prior to tailing was divided by the corresponding inactivation (Log10 CFU·mL−1). For all data used to calculate median values, references are included; in some cases, multiple values were taken from a single publication.
Bacterial SpeciesGram TypeCell FormMedian Far-UVC 1-log10 ID
(mJ·cm−2)
No. of Data Points
(from One of More Studies)
References
A. kookiiNegativeVeg. cells2.931[39]
B. cereusPositiveVeg. cells49.318[4,7,40]
B. subtilisPositiveVeg. cells4.6810[3,40,41,42]
C. jejuniNegativeVeg. cells1.021[4]
C. sporogenesPositiveVeg. cells5.561[4]
E. mundtiiPositiveVeg. cells6.901[39]
E. coliNegativeVeg. cells4.3222[4,39,40,41,43,44,45,46,47,48,49,50,51,52,53,54]
L. pneumophilaNegativeVeg. cells1.671[54]
L. monocytogenesPositiveVeg. cells1.714[43,46,53,54]
M. fortuitumPositiveVeg. cells3.182[41,42]
M. smegmatisPositiveVeg. cells10.451[54]
M. terraePositiveVeg. cells5.251[55]
Pantoea spp.NegativeVeg. cells3.731[42]
P. aeruginosaNegativeVeg. cells3.437[4,7,41,42,45,46]
P. fluorescensNegativeVeg. cells2.011[39]
S. entericaNegativeVeg. cells2.274[4,43,53,54]
S. aureusPositiveVeg. cells4.3120[3,4,7,40,41,43,44,46,48,52,54,56]
S. carnosusPositiveVeg. cells3.281[39]
S. epidermidisPositiveVeg. cells5.143[45,57]
S. hominisPositiveVeg. cells4.851[57]
Stenotrophomonas spp.NegativeVeg. cells3.731[42]
S. pyogenesPositiveVeg. cells33.146[40]
Y. enterolyticaNegativeVeg. cells2.201[50]
A. acidoterrestrisPositiveEndospores6.971[58]
B. cereusPositiveEndospores20.863[3,4,7]
B. pumilusPositiveEndospores12.112[59]
B. subtilisPositiveEndospores9.333[3,47,60]
B. thuringiensis Al HakamPositiveEndospores10.571[3]
C. difficilePositiveEndospores9.623[3,4]
C. pasteurianumPositiveEndospores2.401[7]
C. sporogenesPositiveEndospores15.411[4]
S. griseusPositiveEndospores6.381[7]
T. vulgarisPositiveEndospores13.751[7]
Table 5. Data describing the Pearson correlation between bacterial cell density and Far-UVC 1-Log10 ID for all bacterial species for which three or more different cell density values were available in the collected systematised review data. All bacteria are in vegetative cell form. Calculations performed using Minitab (v18) software (Minitab LLC, State College, PA, USA). * denotes significant p-value (p < 0.05).
Bacterial SpeciesNo. of Data PointsNo. of Contributing Papersr-ValueRelationshipp-Value
B. cereus830.807Strong Positive Correlation0.015 *
B. subtilis830.529Moderate Positive Correlation0.177
L. monocytogenes330.838Strong Positive Correlation0.367
S. aureus16100.491Weak Positive Correlation0.054
S. pyogenes610.976Very Strong Positive Correlation0.001 *
E. coli21150.658Moderate Positive Correlation0.001 *
P. aeruginosa760.989Very Strong Positive Correlation<0.001 *
S. enterica33−0.430Weak Negative Correlation0.717
Table 6. Data describing the Pearson correlation between irradiance and Far-UVC 1-Log10 ID for all bacterial species for which three or more irradiance values were available in the collected systematised review data. All bacteria are in vegetative cell form unless specified otherwise. Calculations were performed using Minitab (v18) software (Minitab LLC, State College, PA, USA). Significant Pearson Correlation did not result in any case (p < 0.05).
SpeciesNo. of Data PointsNo. of Contributing Papersr-ValueRelationshipp-Value
B. cereus83−0.131Negligible Correlation0.757
B. cereus (endospores)330.451Weak Positive Correlation0.702
B. subtilis1040.492Weak Positive Correlation0.148
L. monocytogenes440.245Negligible Correlation0.755
S. aureus19110.097Negligible Correlation0.692
E. coli2115−0.020Negligible Correlation0.930
P. aeruginosa76−0.181Negligible Correlation0.697
S. enterica440.729Strong Positive Correlation0.271
Disclaimer/Publisher’s Note: The statements, opinions and data contained in all publications are solely those of the individual author(s) and contributor(s) and not of MDPI and/or the editor(s). MDPI and/or the editor(s) disclaim responsibility for any injury to people or property resulting from any ideas, methods, instructions or products referred to in the content.

