Article

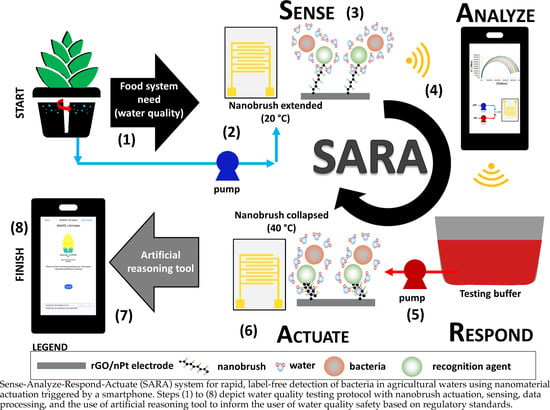
Sense–Analyze–Respond–Actuate (SARA) Paradigm: Proof of Concept System Spanning Nanoscale and Macroscale Actuation for Detection of Escherichia coli in Aqueous Media

by
Cassie A. Giacobassi
1,
Daniela A. Oliveira
1,
Cicero C. Pola
2,
Dong Xiang
3,4,
Yifan Tang
3,
Shoumen Palit Austin Datta
3,5,6,7,
Eric S. McLamore
3,* and
Carmen L. Gomes
2,*
1
Department of Biological and Agricultural Engineering, Texas A&M University, College Station, TX 77843, USA
2
Department of Mechanical Engineering, Iowa State University, Ames, IA 50011, USA
3
Agricultural and Biological Engineering, Institute of Food and Agricultural Sciences, University of Florida, Gainesville, FL 32611, USA
4
Centre for Life Sciences, School of Integrative Sciences and Engineering, National University Singapore, Singapore 119077, Singapore
5
MIT Auto-ID Labs, Department of Mechanical Engineering, Massachusetts Institute of Technology, Cambridge, MA 02139, USA
6
MDPnP Labs, Biomedical Engineering Program, Department of Anesthesiology, Massachusetts General Hospital, Harvard Medical School, Cambridge, MA 02139, USA
7
NSF Center for Robots and Sensors for Human Well-Being (RoSeHuB), Collaborative Robotics Lab, 193 Knoy Hall, Purdue University, West Lafayette, IN 47907, USA
*
Authors to whom correspondence should be addressed.
Actuators 2021, 10(1), 2; https://doi.org/10.3390/act10010002
Submission received: 28 October 2020 / Revised: 10 December 2020 / Accepted: 19 December 2020 / Published: 23 December 2020
(This article belongs to the Special Issue Miniature and Micro-Actuators)

Abstract

:
Foodborne pathogens are a major concern for public health. We demonstrate for the first time a partially automated sensing system for rapid (~17 min), label-free impedimetric detection of Escherichia coli spp. in food samples (vegetable broth) and hydroponic media (aeroponic lettuce system) based on temperature-responsive poly(N-isopropylacrylamide) (PNIPAAm) nanobrushes. This proof of concept (PoC) for the Sense-Analyze-Respond-Actuate (SARA) paradigm uses a biomimetic nanostructure that is analyzed and actuated with a smartphone. The bio-inspired soft material and sensing mechanism is inspired by binary symbiotic systems found in nature, where low concentrations of bacteria are captured from complex matrices by brush actuation driven by concentration gradients at the tissue surface. To mimic this natural actuation system, carbon-metal nanohybrid sensors were fabricated as the transducer layer, and coated with PNIPAAm nanobrushes. The most effective coating and actuation protocol for E. coli detection at various temperatures above/below the critical solution temperature of PNIPAAm was determined using a series of electrochemical experiments. After analyzing nanobrush actuation in stagnant media, we developed a flow through system using a series of pumps that are triggered by electrochemical events at the surface of the biosensor. SARA PoC may be viewed as a cyber-physical system that actuates nanomaterials using smartphone-based electroanalytical testing of samples. This study demonstrates thermal actuation of polymer nanobrushes to detect (sense) bacteria using a cyber-physical systems (CPS) approach. This PoC may catalyze the development of smart sensors capable of actuation at the nanoscale (stimulus-response polymer) and macroscale (non-microfluidic pumping).

Graphical Abstract

1. Introduction

Foodborne pathogens in the global food supply chain increase the risk of mortality and morbidity. Reducing the resulting economic and public health burden calls for new technologies to prevent disease outbreaks; see critical reviews [1,2,3,4]. According to the National Outbreak Reporting System (NORS), an annual average of 15,332 illnesses, 879 hospitalizations, and 22 deaths caused by foodborne diseases were reported from 2008 to 2017 [5]. Additionally, the U.S. Centers of Disease Control and Prevention (CDC) [6] estimates that around 48 million people get sick, 128,000 are hospitalized, and 3000 deaths occur in the U.S. each year from foodborne diseases. Such discrepancy emphasizes the limitations of data collection correlated with misinformation, misreport, and lack of accessible diagnostic tools. Among the food products commonly associated with outbreaks, fresh produce is one of the leading causes of foodborne illnesses [7], with 377 outbreaks reported by the CDC from 2004 to 2012 [8]. The bacteria commonly associated with foodborne outbreaks include Salmonella spp., Listeria monocytogenes, and pathogenic Escherichia coli.
The presence of E. coli in water, food, and food contact surfaces is used as evidence for fecal contamination. Among the hundreds of E. coli strains, pathogens are commonly classified as either verotoxigenic E. coli (VTEC) or Shiga-toxin-producing E. coli (STEC) [9]. Toxins produced by VTEC and STEC are known to cause damage to the intestinal lining, disrupts the homeostasis of the gastrointestinal tract microbiota, and are responsible for symptoms such as hemorrhagic colitis, renal failure, and hemolytic anemia. The most common pathogenic strain is E. coli O157:H7, which has an infectious dose of 10-100 cells [10,11]. The U.S. Food and Drug Administration (FDA) identified six serogroups of pathogenic E. coli commonly referred to as the “big six”: E. coli O26, O45, O103, O111, O121, and O145. Each of these serogroups differs in terms of the O-antigen surface structure, which is a critical lipopolysaccharide found on the outer membrane of Gram-negative bacteria [12].
Recent multistate outbreaks of E. coli O157:H7 infections linked to romaine lettuce demonstrate the need for improved monitoring methods and management strategies [13]. The Food Safety Modernization Act (FSMA) addressed this issue with a series of directives released between 2015 and 2020. In general, the directives were intended to change the U.S. food systems focus from a reactive or responsive safety paradigm to a preventative safety paradigm [14,15,16,17]. The role of sensors/detectors within the modern food supply chain has been reviewed by several groups [18,19,20,21].
For irrigation water, the E. coli concentration (both pathogenic strains and non-pathogenic strains) must not exceed 126 CFU/100 mL (geometric mean) without triggering a responsive action [22]. Several recent reviews have addressed the technological challenges of implementing these federal guidelines for the specific case of alternative water sources (e.g., treated wastewater, brackish water) [23,24]. For postharvest, in general, there is a requirement of no detectable generic E. coli in 100 mL of water used on food contact surfaces or in direct contact with produce [22]. The implementation of a “hold and test” policy in 2012 by the U.S. Department of Agriculture (USDA) significantly reduced the risk of consumer exposure to unsafe products via food recalls [25]. However, food recalls are onerous for food companies, cause significant economic loss [26], and exacerbate food waste [27]. Keener et al. [28] promoted food safety paradigms that blend regulation and legislation, a notion that is only possible if data-informed decision support tools are actively used [19,29].
The current standard methods used by the food industry include culture and colony counting, polymerase chain reaction (PCR), and enzyme-linked immunosorbent assay (ELISA) to detect foodborne pathogens [2,3]. These diagnostic tools require several hours to days to provide a result, which exacerbates problems associated with the current test and hold policies. As food safety regulations become stricter, there is a pressing need for improved tools to ensure food safety without asphyxiating the economic needs of the food industry. Rapid (<1 h) and accurate detection methods for foodborne pathogens that provide high-throughput screening capability and inform decision support systems are pivotal across the food supply chain, from production to processing and distribution (i.e., from “farm to fork”) [30,31,32]. To meet this need, a plethora of different biosensors have been developed. Tools using the CRISPR system [33] are expected in the future.

Pathogen Biosensors in Food Systems

Biosensors to detect bacteria in the food supply chain are ideal if designed to serve as rapid, portable devices that can be used for screening food products, either targeting unique extracellular structures or proteins, peptides, glycans, and genetic material. The most common approaches for biosensors targeting extracellular structures use either fluorescent, colorimetric, or electrochemical sensing modalities. Comprehensive reviews on the topic summarize recent developments in culture-independent techniques [3], commercially available sensor systems [1], and emerging materials for biosensor development [2]. Electrochemical biosensors are generally unaffected by optically dense fluids, and the transduced signal is directly correlated with analyte concentration without an additional signal conversion technology such as a photodiode. These features are important when considering the analysis of food samples where simple hardware systems and detection protocols are necessary [19,34,35,36,37]. To improve the performance of biosensors in complex food matrices, biorecognition agents (e.g., antibodies, aptamers, lectins, peptides) are commonly immobilized on transducer nanomaterials such as nanometals (palladium, platinum, gold, nickel, copper) and nanocarbon (graphene, carbon nanotubes, carbon nanodots) [38,39,40,41,42]. Among these hybrid nanomaterials, metallic-nanocarbon composites have demonstrated improved electron transport and stability, consequently enhancing sensitivity, response time, and limit of detection [43,44,45,46,47,48].
Hills et al. [49] recently developed a pathogen biosensor using stimulus-response polymer nanobrushes conjugated to a platinum-nanocarbon electrode. The technique was used to measure Listeria using a DNA aptamer conjugated to the terminal group on a chitosan nanobrush. The work showed that by controlling nanobrush actuation at the microscale, bacteria can be captured with the brush in the extended state, and subsequent collapse of the nanobrush improves signal transduction (actuation was controlled via solution pH). The ability to induce structural changes on the biosensor surface facilitates dynamic control over the Debye layer and therefore signal transduction. The major advantage relative to the use of passive sensor materials is an increase in the probability of target–receptor interactions due to micron scale structural changes. To date, this approach has not been demonstrated in samples larger than 20 mL, which is critically important for application in food production systems. The use of chitosan nanobrush sensors may not be viable for large sample volumes due to the need for large volumes of acid/base to modulate pH.
Poly(N-isopropylacrylamide) (PNIPAAm) is a stimulus-response polymer that expands at temperatures below the lower critical solution temperature (LCST) and collapses at temperatures above the LCST, which is around 32–35 °C [50]. This behavior, which is observed above and below the LCST, is fully reversible in aqueous solution due to the changes in the hydrogen-bonding interfaces of the amide group [51]. PNIPAAm is also a beneficial polymer for biosensing as different terminal groups can be added (e.g., carboxyl or amine), facilitating the conjugation of a receptor [52]. Previous works with PNIPAAm stimulus-response behavior focused on fundamental studies of bioreceptor loading [41] or electronic behavior [53].
This study demonstrates for the first time the development of partially automated system for rapid (~17 min), label-free impedimetric biosensor for real-time detection of E. coli spp. in food samples (i.e., vegetable broth) and hydroponic media (aeroponic lettuce system) based on stimulus-response of PNIPAAm nanobrushes. Additionally, the semi-automated system demonstrated herein allows for continuous detection of E. coli and potentially other foodborne pathogens in aqueous media reducing sample handling problems, and consequently helping mitigating disease outbreaks. Two well-known bioreceptors, namely antibodies and lectins, were tested as bioreceptors. The biomaterial was tested on two different metal-nanocarbon hybrid electrodes. Furthermore, we show that actuation of PNIPAAm nanobrushes leads to enhanced bacteria capture and controllable electrochemical transduction based on an external stimulus (i.e., temperature) in laboratory studies. Finally, we demonstrate a proof of concept Sense-Analyze-Respond-Actuate (SARA) system based on actuation and analysis using a remote device (smartphone) (see supplemental materials Figure S1).

2. Materials and Methods

2.1. Materials and Bacteria Cultures

Lead acetate, chloroplatinic acid, 2-aminoethanethiol hydrochloride (AESH), ascorbic acid, potassium phosphate monobasic, Concanavalin A (ConA) from Canavalia ensiformis (Jack bean), sodium chloride, sodium phosphate dibasic, 11-mercaptoundecanoic acid (11-MUA), Anti-GroEL antibody (Ab) produced in rabbit, and potassium chloride were purchased from Sigma-Aldrich (St. Louis, MO, USA). Calcium chloride, sodium persulfate (Na2S2O8), sodium nitrate (NaNO3), 1-ethyl-3-(3-dimethylaminopropyl) carbodiimide HCl (EDC), and manganese chloride were obtained from Thermo Fisher Scientific (Waltham, MA, USA). Sulfuric acid (H2SO4) was purchased from Fisher Scientific (Potassium ferrocyanide trihydrate was purchased from Ward’s Science (Rochester, NY, USA). N-Hydroxysuccinimide (NHS), potassium nitrate, 2-(morpholino) ethanesulfonic acid (MES) buffer, glutaraldehyde, and platinum wire (99.95% Pt, 0.5 mm dia.) were obtained from Alfa Aesar (Ward Hill, MA, USA). Single-layered graphene oxide (GO) was purchased from ACS Material (Medford, MA, USA). N-Isopropylacrylamide (NIPAAm) was obtained from Tokyo Chemical Industry Co. (Portland, OR, USA). Buffered peptone water (BPW) and tryptic soy broth (TSB) were acquired from Becton, Dickson and Company (Sparks, MD, USA). Petrifilm-Aerobic Count Plates were purchased from 3M (St. Paul, MN, USA). Platinum/iridium (Pt/Ir) electrodes, reference electrodes (Ag/AgCl) and Pt auxiliary electrodes were purchased from BASi, Inc. (West Lafayette, IN, USA). Gold interdigitated electrodes (3 mm × 5 mm; 100 μm gap spacing) were purchased from DropSens (Asturias, Spain). Screen printed carbon electrodes (SPC, 5 mm diameter) were purchased from Zensor (model SE100, Zensor USA, Katy, TX, USA).
Sensitivity and selectivity were tested using Escherichia coli (ATCC 35218, Manassas, VA, USA) in phosphate buffer saline (PBS, pH 7.4). For selectivity testing, Salmonella enterica serovar Enteritidis (ATCC BAA-1045, Manassas, VA, USA) was used in PBS. Escherichia coli O157:H7 (ATCC 43895, Manassas, VA, USA) was used for testing in vegetable broth and hydroponic systems. All bacteria initially stored at −80 °C were replicated by identical duplicate transfers and incubated under aerobic conditions for 24 h at 35 °C. The bacterial cultures were maintained on TSA (tryptic soy agar) slants at 4 °C. Transfers from slants were conducted to prepare microorganisms for analysis. Bacteria samples were serially diluted in BPW and enumerated on Petrifilm™ aerobic count plates (3M, Saint Paul, MN, USA) after 48 h at 35 °C; results are reported as CFU/mL.

2.2. Image Analysis

Electrode morphology was imaged using field emission scanning electron microscopy (SEM) with a FEI Quanta 600 FEG (Hillsboro, OR, USA). All electrodes were first coated with a 10 nm thick layer of platinum using a Cressington sputter coater 208 HR (Watford, United Kingdom). Electrodes were retrieved from the sputter coater and allowed to ventilate for 30 min prior to imaging. Images were obtained at magnifications of 5000× and 10,000× and 5 kV. Field SEM images were used to determine average particle size based on post-measurement analysis with ImageJ.
Scanning white light interferometry (SWLI) was used to determine the average roughness profile of each material using an Alicona Infinite Focus Microscope (G4 Optical 3D Surface Profiler). A 20× objective with a focus-variation system and a lateral resolution of 0.88 μm was used for all scans (Bartlett, IL). SWLI was used to determine profile average roughness as well as contour topology.

2.3. Nanomaterial Deposition and Electrode Biofunctionalization

Prior to use, all Pt/Ir electrodes were polished and cleaned according to previously reported methods [41]. Pt/Ir electrodes were modified through the application of a graphene-platinum nanocomposite layer following procedures adapted from Vanegas et al. [42] and Hills et al. [49]. Briefly, a first layer of nanoplatinum (nPt) was formed on the surface of each electrode via sonoelectrodeposition at 10 V for 90 s in a solution of 1.44% (w/v) chloroplatinic acid and 0.002% (w/v) lead acetate. Next, a reduced graphene oxide (rGO) layer (2 mg/mL in DI) was drop coated onto the surface of the nPt-modified electrode and dried for 30 s at 40 °C with an 1875 W heat gun (Revlon, New York, NY). The semi-dried electrode was then spun in the spin coater for 30 s at 1700 rpm and then for 60 s at 3500 rpm. Lastly, a second layer of nPt was electrodeposited onto the surface to complete the “sandwich” structure using the same methods as above. The SPC electrodes used for the SARA proof of concept in hydroponic system were also initially cleaned using cyclic voltammetry (see Supplementary Materials).
PNIPAAm nanobrushes were deposited on both electrodes (Pt/Ir and SPC) based on Zhao et al. [54]; in our study a potentiostat from CH Instruments (Model 600 E Series) was used throughout. Briefly, 1 M NIPAAm, 0.2 M NaNO3, 0.01 M Na2S2O8, and 4.85 mM AESH were suspended in 20 mL RO water to prepare the NIPAAm solution. The AESH serves as a chain transfer agent to have the amine end group required for subsequent attachment of bioreceptors, namely lectin (ConA) or antibody (Ab) [52]. Polymerization of PNIPAAm-NH2 onto the electrode was achieved at room temperature using cyclic voltammetry (CV) with the following settings: potential range from −0.35 V to −1.35 V and a scan rate of 100 mV/s for 60 cycles [54].
To conjugate ConA or anti-GroEL antibody to PNIPAAm nanobrushes, nPt-rGO-PNIPAAm-modified electrodes were incubated with an aqueous solution containing glutaraldehyde in a 2:1 molar ratio to AESH and allowed to react under agitation for 2 h at room temperature (resulting in amine-amine bonds). Electrodes were then exposed to ConA or anti-GroEL antibody suspensions at either 50 nM, 100 nM, or 200 nM. Ca2+ and Mn2+ ions were added to the PBS solution to promote carbohydrate binding and achieve optimum ConA activity [55,56]. After all conjugation steps, the unbound recognition agents were washed off with 100 μL of 1× PBS thrice. For the attachment of ConA and anti-GroEL antibodies to nPt-rGO-modified electrodes, the surface was initially carboxylated with a self-assembled monolayer (SAM) using 11-MUA, followed by amine-carboxyl conjugation chemistry (see Supplementary Materials). All modified electrodes were stored in PBS (pH 7.4) at 4 °C until further analysis. The conjugation of ConA to the SPC-PNIPAAm nanobrushes electrodes was performed similarly. After 2 h incubation with the glutaraldehyde/AESH solution, ConA suspension, in the presence of Ca2+ and Mn2+, was applied to the SPC electrodes for 2 h under agitation. Then, functionalized SPC electrodes were freeze-dried (see Supplementary Materials) and stored at −20 °C until use for testing in the hydroponic system.

2.4. Electrochemical Analysis

Laboratory electrochemical characterization was performed using a three electrodes cell stand according to previous work [42,49,57]. Cyclic voltammetry (CV) was carried out in 4 mM Fe(CN)63−/Fe(CN)64− (1:1) redox probe with 1 mM KNO3 solution at a switching potential of 650 mV versus a Ag/AgCl reference electrode with 30 s quiet time at scan rates of 50, 100, 150, and 200 mV/s. The electroactive surface area (ESA) was determined using the Randles-Sevcik equation by plotting the current (I) versus the square root of scan rate (v1/2), as described previously [40,42,58].
Electrochemical impedance spectroscopy (EIS) tests were conducted in a solution of 4 mM Fe(CN)63−/Fe(CN)64− in 1 M KCl with an AC amplitude of 0.1 V. An initial DC potential of 0.25 V was applied with a frequency range of 1–100,000 Hz [41,49,59]. Complex plane diagrams (Nyquist plots) were used to determine the charge transfer resistance (Rct) based on equivalent circuit analysis (Randles-Sevcik circuit).
PNIPAAm nanobrush actuation was evaluated through CV and EIS. These tests were carried out at temperatures above and below PNIPAAm’s LCST, namely 40 °C and 20 °C, respectively. A water bath was used to control the temperature throughout the measurements. The PNIPAAm nanobrushes’ response to change in stimuli was used to determine the most efficient conditions for bacteria capture and sensing was based on the protocol for brush actuation by Hills et al. [49], which was based on analyzing ESA and Rct results for each nanobrush-receptor material.

2.5. Biosensor Performance Testing

EIS was used to determine the limit of detection (LOD), range, sensitivity, and selectivity of each biosensor when exposed to bacteria at concentrations varying from 10–108 CFU/mL. Bode plots were used to determine the impedance at a fixed cutoff frequency, which is 1 Hz. Where noted, the change in impedance ( Δ Z = Z b a c t e r i a Z n o   b a c t e r i a ) was determined from the Bode plots. Sensitivity to the target bacterium was determined by the slope of the linear portion of the calibration curve consisting of the change in impedance (Ω) vs. the concentration of cells (log CFU/mL) [49,60]. Sensitivity testing with the optimized ConA and antibody sensors was performed in PBS, sterile vegetable broth (purchased from a local market), and hydroponic media. Selectivity to E. coli O157:H7 was measured by determining sensitivity, LOD, and range in the presence of Gram-negative bacteria in PBS (E. coli 35218, E. coli 43895, and Salmonella Typhimurium) [60]. The LOD was calculated using the 3σ method, and the range was calculated as the linear portion of the calibration curve (R2 > 0.98).

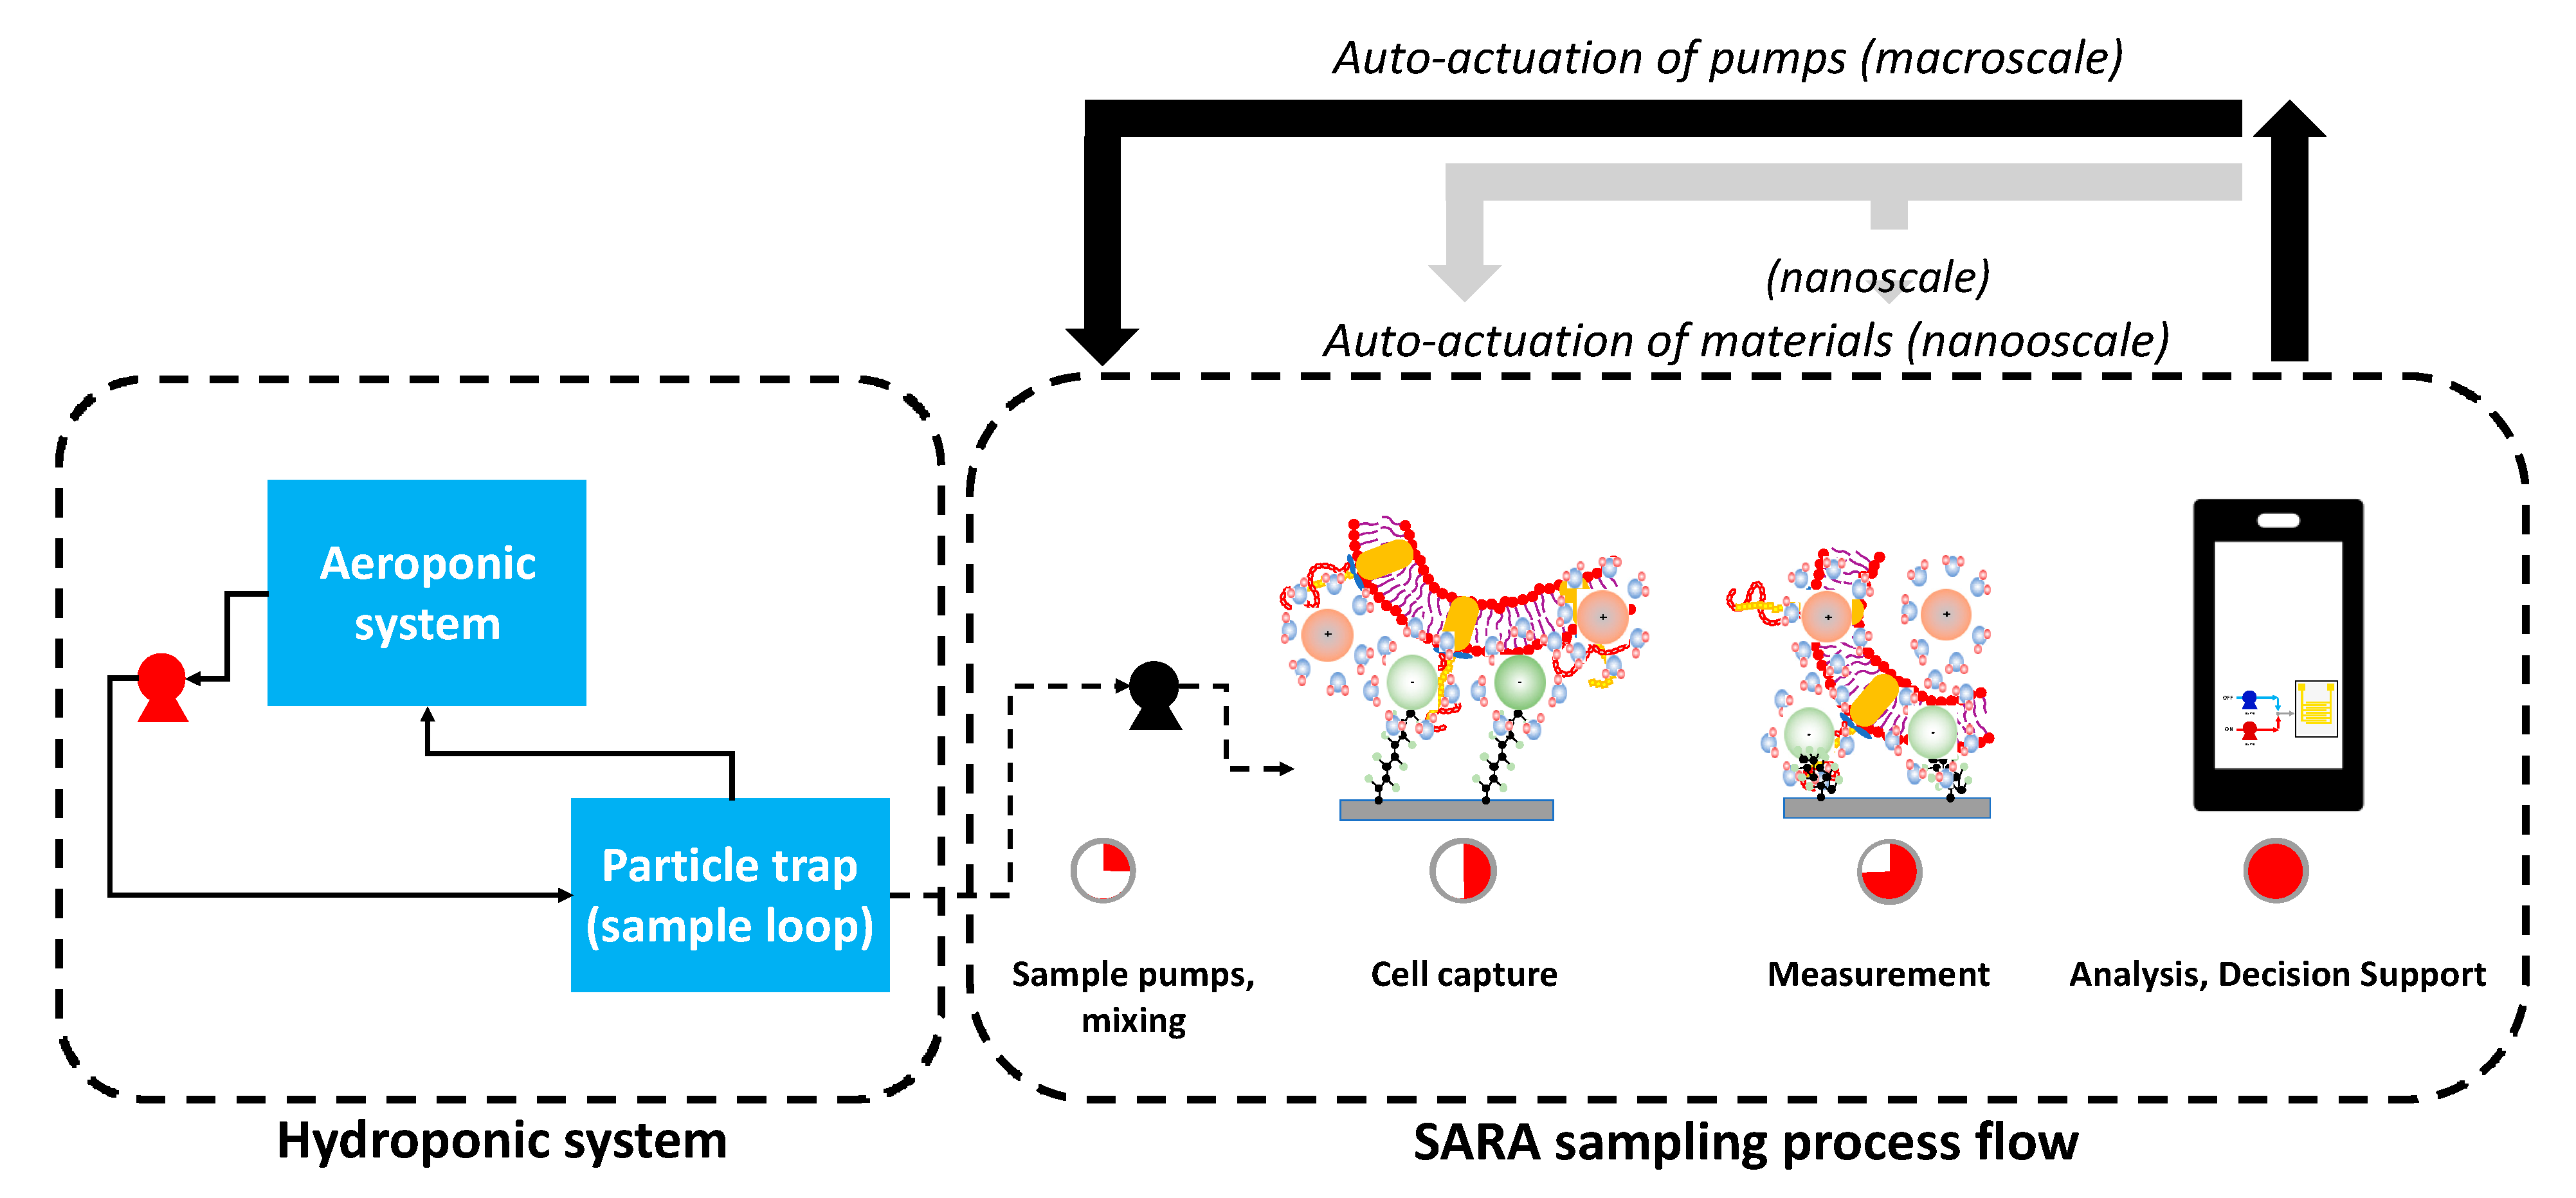
2.6. SARA Paradigm Proof of Concept in Hydroponic System

SPC biosensors with a handheld potentiostat [37] were used to construct a proof of concept SARA system for hydroponic lettuce. Hydroponic sensing experiments were performed using a similar setup as described by Sidhu et al. [61]. A RainForest modular 318 aeroponic system with Vortex sprayer was used to grow lettuce based on Marhaenanto et al. [62]. The main reservoir of the hydroponic system was 50 L and the conical vortex sprayer was operated at 1200 rpm. Hydroponic lettuce (Lactuca saliva) was cultivated using 7.6-cm-diameter plastic seed cups with CocoTek liners and expanded clay pellets (Mr. Stacky Hydroponic Center, Lake City, FL, USA). Full spectrum LED grow lights (75 W equivalent) were used (photoperiod of 8 h). Nutrient solution (Liquid Plant Food Big Bloom, Fox Farm Organic Gardening, Arcata, CA, USA) was replaced every 7 days based on manufacturer’s recommendations. Growth media was sterilized according to our previous methods [63].
A particle trap was spliced into a ¾″ OD Tygon tube and attached to a submersible pump for biosensor measurements. The particle trap had a stainless-steel mesh (#50; 300 μm mesh) within the inner chamber, and the biosensor was fixed within this mesh strain for direct contact with the water prior to filtration in the particle trap. The trap was customized for biosensor analysis by drilling two small holes on the top of the plastic housing and threading male-male Dupont Wire (Arduino) through the hole. The holes in the plastic body were sealed with rubber sealant (FlexSeal, Weston, FL, USA) and the inner pins were soldered to the sensor bonding pads. Lastly, the lead wires were insulated with nail polish and dried overnight, and then the trap was fixed to the housing and sealed via the threaded fitting.
A schematic diagram of the hydroponic system with the SARA sampling loop is shown in supplemental Figure S3. The hydroponic system contained a sampling loop with the trap, and a micropump was used to manually extract samples from the main 50-L reservoir at a rate of 10 mL/min. The sampling loop for SARA included a micropump connected to a stock sample of E. coli (105 CFU/mL) at 20 ± 5 °C. The SARA loop also included a PBS buffer reservoir on a hot plate maintained at 40 ± 1 °C and a micropump connected to a waste tank. The operating temperature in the hydroponic system was 20 ± 3 °C, which is within the range causing the PNIPAAm nanobrush to extend. The 40 °C PBS buffer was used to actuate nanobrush collapse for measurement.
Upon initiation of the SARA workflow (see supplemental Figure S4), the recirculation pump between the hydroponic tank and the particle trap was turned off. For testing system performance, 10 mL of E. coli (ATCC 35218) suspension was injected into a T-junction placed upstream of the particle trap/biosensor apparatus using a microcontroller-operated pump. The concentration of E. coli is noted for each addition; stock concentration was 105 CFU/mL. An impedance test was conducted at 20 ± 3 °C, and then the program triggered a second pump to rinse the sample with testing buffer at 40 °C (causing the nanobrush to collapse). A second impedance test was triggered by the program, and the data for pre/post actuation is recorded and analyzed. All impedance analysis used a custom handheld potentiostat [19,37]. The code is available by request and was based on two existing codes: ShotBot (https://www.instructables.com/id/ShotBot-Arduino-Powered-Pump-Project/) and AirPiano (https://drive.google.com/file/d/1-E0i1CWxxHpTxtieTizCmZC6Bq6q8Tlc/view).

2.7. Decision Support Application

An artificial reasoning tool (ART) informs the user of the water quality safety according to regulatory standards based on the SARA concept. The decision tree for development of the Thunkable application is shown in supplemental Figure S5. The app design includes screens that contain various functions written in Block code (Scratch). The Thunkable app is publicly available in the searchable open access database (SARA: FC Hydro), or can be provided upon request.

2.8. Statistical Analysis

For all analyses, determinations were made at least in triplicate as independent experiments based on a completely randomized design with equal replications and results were expressed as mean ± standard deviation. Statistical analysis was performed using SPSS PASW Statistics, version 23. Results from the different electrode treatments were tested for significance by analysis of variance (ANOVA) and Tukey’s test to separate means at 95% confidence interval (p < 0.05).

3. Results

3.1. Electrochemical Characterization

Cyclic voltammograms in 4 mM Fe(CN)63−/Fe(CN)64− + 1 M KNO3 (pH = 7.1, T = 25 °C) displayed quasi-reversible redox peaks for all nanomaterials tested, with peak potential separations in the 70 to 80 mV range. Figure 1a shows representative CV curves for bare Pt/Ir electrodes, Pt/Ir electrode after coating with the metal/carbon nanohybrid (nPt-rGO), and the nanohybrid electrode after deposition of nanobrushes (PNIPAAm). Figure 1b was used to calculate the ESA for each electrode. As shown in Figure 1c, the average ESA for nanohybrid electrodes coated with PNIPAAm (0.03 ± 0.004 cm2) was equivalent to nanohybrid electrodes (0.028 ± 0.002 cm2), and significantly higher than bare Pt/Ir electrodes (0.018 ± 0.0001 cm2; p < 0.05), similar to the findings reported by Burrs et al. [41].

3.2. Nanobrush Morphology

Electron microscopy and white light interferometry images for the nanocomposite before and after brush deposition are shown in Figure 2. Based on SEM image analysis (Figure 2a), the average particle size for nPt-rGO nanohybrid electrodes was 310 ± 25 nm. SWLI scans over a range of 1 mm × 1 mm show that a homogenous coating was present on the electrode, with heterogeneous nodes that ranged in height from 100 nm to 1 μm. The average profile roughness (Ra) was 166 nm; abrasions on the electrode surface were removed when calculating feature roughness, as these artifacts are a result of repeated polishing with nanodiamond solution during sensor reuse. SEM of the material after nanobrush deposition (Figure 2c) shows terminal nodes of PNIPAAm nanobrushes ranging from 220 to 1300 nm (average node diameter was 910 ± 305 nm). Hills et al. [49] reported the average size of chitosan nanobrush borders contained both terminal nodes (200–300 nm) and longitudinal shafts (100 nm in width and 800 nm in length). However, the shaft structures were not visible in PNIPAAm nanobrushes studied here (Figure 2c, see supplementary Figure S6 for details). This was likely due to the abundance of homogenous terminal nodes on the electrode surface, with shafts forming beneath the nodes (shaft structures are visible in supplementary Figure S6). Electropolymerization of NIPAAM monomers leads to homogeneous nanobrush and formation of uniform shaft and node sizes distribution on the electrode surface. This structure is more of a “brush border” than the chitosan structures by Hills et al. [49], which had a highly heterogenous brush/chain size distribution that likely results from the top-down extraction process (i.e., deacetylation reaction). SWLI (Figure 2d) confirms that PNIPAAm brushes form a homogenous electrode coating at the scale of 800 μm × 800 μm, with an average Ra (201.4 ± 57.2 nm) that was lower than the nPt-rGO hybrid (Ra = 310.2 ± 24.5 nm) material (t-test show the reduction in Ra is significant; p < 0.05). This reduction in Ra confirms that the PNIPAAm brush structure produces a homogenous electrode coating and provides an excellent platform for conjugation of bioreceptor(s), and many previous papers have shown functionalization of PNIPAAm with a variety of materials [41,50,51,52,53]. While we did not test the effect of polymer thickness on performance, the 500–1000 nm thick structures here could be extended to other applications. For example, Zhao et al. [54] developed PNIPAAm-nanocarbon electrodes with thicknesses greater than 5 μm that exhibited high conductivity and electrocatalytic activity but no actuation tests were demonstrated.
In the next section, we test nanobrush actuation in the presence/absence of E. coli and establish optimum conditions for cell capture/impedance testing.

3.3. Nanobrush Actuation and E. coli Capture

The ability to actuate the surface of the sensor with an externally modulated signal (such as local thermodynamic change) is an extremely important property for developing smart sensors that are capable of demonstrating sense-analyze-response-actuate (SARA) behavior. First, ConA and antiGroEL loading onto PNIPAAm nanObrushes was optimized based on ESA calculated from voltammograms in 4 mM K4FeCN6 (pH = 7.0, T = 25 °C, see supplementary Figure S7). Protein concentrations between 50–200 nM were tested, and in both experiments the signal saturated for protein concentration of 100 nM (3.2 μM-protein/cm2), indicating saturation of surface binding sites. Thus, 100 nM was used for all studies in E. coli capture.
After conjugation of bioreceptor, the nanobrush detection system was tested using the actuation protocol developed by Hills et al. [49] with some alterations. The original work by Hills et al. [49] targeted Listeria spp. using aptamers and antibodies conjugated to chitosan nanobrushes, while in this work E. coli is targeted using lectins or antibodies conjugated to PNIPAAm nanobrushes. In addition to the different bioreceptors used in these studies, the mechanism of actuation for chitosan (a pH-sensitive polymer) is fundamentally different than PNIPAAm (a temperature-sensitive polymer). Thus, E. coli capture efficacy was tested above and below the LCST, which is the temperature at which the polymer undergoes a structural change from collapsed (T > LCST) to swollen (T < LCST); the LCST for PNIPAAm is 32–35 °C [50]. The optimum capture strategy was established by analyzing ESA and Rct results for each nanobrush-receptor material.
Figure 3a shows representative CV curves and Figure 3b shows the average charge transfer resistance (Rct) and ESA for nanobrush electrodes at 20 °C and 40 °C using ConA as a receptor (in absence of E. coli). The highest redox peaks (Figure 3a) and lowest Rct (Figure 3b) were measured when nanobrushes were collapsed (T = 40 °C > LCST). In the collapsed state, the diffusion layer and the Debye layer are reduced, facilitating higher mass transfer of the electroactive species (Fe(CN)63−/Fe(CN)64−) in this study). This result is similar to the study by Hills et al. [49], where the collapsed state of chitosan led to higher ESA. This clearly shows that PNIPAAm nanobrush actuation is reversible, and changing the polymer from expanded to collapsed is a reliable mechanism for smart sensing.
The maximum impedance values were observed at a cutoff frequency of 1 Hz; analysis considered frequencies from 1 to 50 Hz, which falls within the alpha dispersion domain [64]. No significant difference (p > 0.05) was observed between the different temperatures of actuation (Figure 3c). The data in Figure 3c indicate some degree of hysteresis after repeated actuation of bioreceptor-PNIPAAm nanobrushes. After repetitive actuation, peak current changed by 4.0 ± 1.5%, while Rct varied by 13 ± 4%. Repetitive actuation of bioreceptor-nanobrush structures has not been reported previously, and warrants further study to determine the best mechanism for actuation.
Two distinguished capture strategies were evaluated using PBS with E. coli K12 at a concentration of 1.3 × 10⁴ CFU/mL (Figure 3d). First, E. coli capture was tested with the nanobrush in the extended state at 20 °C, and impedance measurement was initiated while the brush was in the collapsed state at 40 °C (the opposite condition was also tested). The capture efficiency and signal-to-noise ratio were higher when E. coli capture occurred in the extended state (20 °C), followed by brush collapse and subsequent measurement at 40 °C. This finding is consistent with the results reported by Hills et al. [49] and is likely due to higher probability of receptor–E. coli interactions when the nanobrush is in an extended state, compared to the collapsed condition where receptor binding site(s) may be inaccessible. Compared to nanobrush actuation without cells (Figure 3a–c), the inverse trend is observed with cell capture followed by sensing (see supplementary Figure S1). During sensing, the nanobrush is collapsed, and the change in signal is likely due to physical crowding of the surface and limited diffusion of redox probes/electrolyte to the surface (a form of Debye shielding).
The concept of material actuation for bacteria capture has also been achieved with magnetically actuated cilia [65,66,67]. Cilia actuation is used to promote active mixing of bacteria within the unstirred layer, and is not directly involved in the capture mechanism. In the next section, we challenge the biosensor in mixtures of bacteria and establish key performance indicators (KPI) related to sensor engineering.

3.4. Nanobrush Sensing in Buffer

Figure 4 shows PNIPAAm-ConA nanohybrid electrodes calibrated for E. coli K12 and in the presence of Salmonella. All tests used the actuation protocol previously established (see Figure 3), with capture in the extended state at 20 °C and sensing in the collapsed state at 40 °C. Bode plots are shown over a frequency range of 1 Hz to 100 kHz at varying bacteria concentrations (102–107 CFU/mL); insets are a zoomed in view of the lower frequency range (1–5 Hz). Based on a frequency analysis using the procedure by Hills et al. [49] and presented in Figure 3c, all calibration curves were developed using data from Bode plots for a cutoff frequency of 1 Hz. The total test time was 17 min, which included 15 min for bacteria capture and 2 min for the EIS measurement.
Figure 4a and supplemental Figure S8a show Bode and Nyquist plots, respectively, for ConA-coated nanobrush sensors targeting E. coli K12 in PBS buffer. The average sensitivity toward E. coli K12 was 2068.2 ± 346.62 Ω/log(CFU/mL). The LOD (3 sigma; 99.5% confidence interval) for E. coli K12 was 5.0 ± 2.9 CFU/mL, and the linear range was 3.0 × 10² to 3.0 × 10⁵ CFU/mL. The selectivity of the ConA-nanobrush sensor was tested against Salmonella Enteritidis (102 CFU/mL to 107 CFU/mL) in PBS. Salmonella Enteritidis was the bacteria chosen for specificity testing due to its similarity to E. coli with both being Gram-negative and both being a known foodborne pathogen. For a cutoff frequency of 1 Hz, the ConA-nanobrush showed a linear impedance increase for both E. coli K12 and Salmonella Enteritidis (Figure 4b and supplementary materials Figure S8b, respectively). The average sensitivity toward the mixture of E. coli K12 with Salmonella Enteritidis was 3800.9 ± 911.2 Ω/log(CFU/mL). The LOD for the mixture was 2.3 ± 0.8 CFU/mL with a linear range from 3.0 × 10² to 3.0 × 10⁵ CFU/mL.
Figure 4c presents the linear portion of the calibration curves for ConA biosensors after exposure to E. coli or mixtures of E. coli with Salmonella. ConA biosensors response was similar when exposed to E. coli K12 or to mixtures of E. coli K12 with Salmonella Enteritidis. No significant difference was observed in sensitivity nor LOD for sensors exposed to E. coli K12 or mixtures of E. coli K12 with Salmonella Enteritidis. E. coli and Salmonella are both Gram-negative enterobacteria, but differ in sugar combining sites on the cell surface and LPS (lipopolyssacharides) structures, each affected by growth state [68,69,70]. E. coli K12 LPS is terminated by O-antigen, which contains glucose that has a high affinity for ConA [71]. The specific binding site for ConA on E. coli is thought to be GM1 ganglioside [72], while the specific binding site on Salmonella varies since Salmonella express a range of LPS with dynamic numbers of terminal O antigen [73].
The presence of Salmonella Enteritidis in the testing solution did not show significant interference (p > 0.05) on the slope of the calibration curve (Figure 4c), indicating no cross-reaction between the PNIPAAm-ConA sensor and the Salmonella Enteritidis. E. coli and Salmonella both have lipopolysaccharides on their cell membranes that are terminated with carbohydrates that may bind ConA. The established theory is that the carbohydrate-recognition domain of ConA forms an association with the terminal sugar of microbial LPS structures through an interaction with both the 3- and 4-OH groups of the sugar. As reviewed by Vanegas et al. [2], the molecular interaction is more complex than a simple protein–ligand interaction. The terminal sugar does not always determine ConA binding, and the lectin is somewhat promiscuous and can recognize branch sugars deeper within the LPS. This is an important feature when considering the actuation of ConA-nanobrushes for improving capture of Gram-negative bacteria, as the three-dimensional structure may be crucial to binding, also reaffirmed by the Spike protein of SARS-CoV-2 [74,75,76].
In the next section, we challenge the biosensor against the pathogen E. coli O157:H7 in food samples for both lectin-terminated nanobrushes and antibody-terminated brushes.

3.5. Nanobrush Sensing in Food Samples

ConA-nanobrush and Ab-nanobrush (Anti-GroEL) biosensors were tested with E. coli O157:H7 at concentrations ranging from 102 to 108 CFU/mL in sterile vegetable broth using the actuation protocol described above. Figure 5a,b present Bode plots over a frequency range of 1 Hz to 100 kHz for ConA-nanobrush and Ab-nanobrush biosensors, respectively (see supplementary Figure S9 for Nyquist plots).
Figure 5c shows the calibration curves for each receptor in vegetable broth based on net impedance. Range and lower LOD obtained from the linear portions of the calibration curves for PNIPAAm-ConA and PNIPAAm-antibody sensors are shown in Table 1. The sensitivity (slope of the calibration curves in Figure 5c) of both nPt-rGO-PNIPAAm-ConA (1915.0 ± 1070.1 Ω/log(CFU/mL)) and nPt-rGO-PNIPAAm-Anti-GroEL antibody (2004 ± 253.6 Ω/log(CFU/mL)) sensors exposed to E. coli O157:H7 is similar (p > 0.05), indicating the potential of both in the detection of E. coli O157:H7 in a complex system. The LOD for the PNIPAAm-antibody (249.3 ± 51.3 CFU/mL) was significantly lower (p < 0.05) than the PNIPAAm-ConA (1560 ± 202.3 CFU/mL); however, the coefficient of variation (CV) for PNIPAAm-ConA (0.13) was lower than the PNIPAAm-antibody (0.21), indicating less variability in the results obtained for the former sensor. However, both sensitivity values were on the same order of magnitude and the linear ranges were similar, which supports the hypothesis that both are capable of E. coli O157:H7 detection.
Table 1 contains a compilation of current biosensors for the detection of E. coli in various food samples, or buffers. The detection time for our actuating nanobrush sensor was shorter than all times found in the literature, except for the sensor used by Radke and Alocilja [77], who reported a 10 min detection time. The LOD of the nanobrush sensors for E. coli K12 in PBS (5.0 ± 2.9 CFU/mL) was lower than all biosensors shown in the table. Although the LODs of the nanobrush sensors for E. coli O157:H7 were significantly higher (1560 ± 202.3 CFU/mL for ConA and 249.3 ± 51.3 CFU/mL for antibody), these LODs are within the same order of magnitude of previous studies. Additionally, their sensitivity in vegetable broth (1915.0 ± 1070.1 Ω/log(CFU/mL)) was comparable to the test in PBS for E. coli K12 (2068.2 ± 346.62 Ω/log(CFU/mL)). The complex composition of vegetable broth can promote non-specific interactions and influence the electrochemical response Hills et al. [49]. Complex media, including whole milk, lettuce wash water, and ground beef, are usually used to measure the performance of sensors in real food samples [18,35,41,78]. In this study, vegetable broth was chosen, as it is composed of food ingredients with the potential for contamination by foodborne pathogens, namely E. coli O157:H7. The performance of the PNIPAAm nanobrush biosensors indicates that the devices have potential to be used in similar complex solutions, such as fresh produce wash water and other aqueous media. A significant advantage of the biosensors in this work is the lack of bacteria purification or concentration steps—see, for example, Chowdhury et al. [79]—that require label addition and incubation. This is a critically important feature for SARA biosensors, as real time analysis using remote system actuation is a defining feature of the tool. In the next section, we show how this nanobrush biosensor can be used to create a SARA system for rapid analysis of lettuce irrigation water.
Table 1. Biosensor performance comparison to other devices in the literature used in the detection of E. coli O157:H7.
Sensing Platform/Biorecognition AgentMediaBacteriaDetection Time (min)Range (CFU/mL)LOD (CFU/mL)Reference
PNIPAAm-ConAPBSE. coli K12173 × 102 to 3 × 1055.0 ± 2.9This work
PNIPAAm-ConAPBSE. coli K12 and Salmonella Enteritidis173 × 102 to 3 × 1052.3 ± 0.8This work
PNIPAAm-ConAVegetable brothE. coli O157:H7172.6 × 102 to 2.6 × 1061560.0 ± 202.3This work
PNIPAAm-AntibodyVegetable brothE. coli O157:H7171.5 × 102 to 1.5 × 106249.3 ± 51.3This work
Polyanilyne-AntibodyPhosphate Citrate BufferE. coli O157:H7NR102 to 107102Chowdhury et al. [80]
11-MUA SAM-ConA *Carrier bufferE. coli<2012 to 1.2 × 10612Jantra et al. [81]
Hyaluronic acid-AntibodyPBSE. coli O157:H7NR10 to 10510Joung et al. [78]
Hyaluronic acid-AntibodyWhole milkE. coli O157:H7NRNR83Joung et al. [78]
CHIT-MWNTs-SiO2@THI **PBSE. coli O157:H7<454.1 × 10² to 12 × 105250Li et al. [82]
Bayhydrol 110-Mannose-ConA ***WaterE. coli O157:H71806 to 60 × 10960Lu et al. [83]
Gold electrode array-AntibodyLettuce Wash WaterE. coli O157:H710104 to 107104Radke & Alocilja [77]
Values provided are means of three replicates ± standard deviations. Means that are not followed by a common superscript letter are significantly different (p < 0.05). NR denotes values not reported. * E. coli strain not specified in literature. ** Chitosan-multiwalled carbon nanotubes-SiO2/thionine. *** Mannose immobilized onto the polymer and ConA added on sample solution for the biorecognition process.

3.6. SARA: Sense-Analyze-Respond-Actuate

Figure 6 shows the system used for a proof of concept SARA demonstration, highlighting actuation at the macroscale (pump state switching via microcontrollers), and actuation at the nanoscale (polymer swelling/contraction for bacteria capture). Detailed schematics may be found in the Supplementary Section.
Figure 7 shows the average data from repetitive tests of the SARA system (raw impedance data are available upon request). Figure 7a shows the average data for all tests, with colored bar charts indicating equivalent bacteria concentration. The three successive values represent impedance data obtained at 20 °C (extended nanobrush), 40 °C (collapsed nanobrush), and return to 20 °C (extended brush + bacteria). In the absence of bacteria, the Rct decreased when nanobrushes were in the collapsed state, while in the presence of bacteria, this trend was reversed. These system-scale measurements with a handheld potentiostat confirm the bench scale measurement in Figure 3. For all bacteria concentrations, the percent change in Rct during actuation (18.4 ± 6.3%) was significantly higher than the tests without bacteria (13 ± 4%). Interestingly, the percent change in Rct decreased with increasing E. coli concentration, which was counter-intuitive when comparing data to baseline measurements, see supplementary Figure S11. Figure 7b shows the average sensor calibration using an extend–capture, collapse–measure scheme.
The average sensitivity toward E. coli was 366 ± 81 Ω/log(CFU/mL), which is lower than the laboratory assay by nearly two-fold. However, SARA is an in situ system and does not require sample extraction and transport to an analytical laboratory. Furthermore, the acquisition system is based on an open source smartphone tool [37] and enables access to users who do not have specialty equipment. The LOD (3 sigma; 99.5% confidence interval) for E. coli was 57.6 ± 13.4 CFU/mL, and the linear range was 50 to 200 CFU/mL. In the next section, we show development and use of a smartphone application for providing on site decision support, closing the analysis loop for SARA.

3.7. Decision Support Application

A decision support app was developed for iOS using Thunkable (block coding). The aim was to provide meaningful information from the real-time analysis of sensor data that meets statistical thresholds, and subsequently uses guidance from PSR to determine whether the sample meets regulatory compliance. Figure 8 shows select screenshots from the app, which is a tool within the SNAPS (sensor analytic point solutions) portfolio, which uses ART (artificial reasoning tools) [19]. After two-factor authentication and authorization via DUO [84], the welcome screen contains an option for enabling GPS (location accuracy), which is an important step if location-specific decision support is desired. The first-generation application uses the federal guidance for water quality from the PSR, but the application can be expanded to produce locally relevant guidance, if required. The REST architecture [85] facilitates expansion for linking to other regulatory databases through open RESTful APIs (in synchronous or asynchronous mode). When available, batch calibration may be enabled using QR codes embedded with calibration data (the app also contains an option for manual calibration). Error due to batch calibration can be as high as 5% due to batch-to-batch variation. Screen number 5 provides the option to connect to a sensor reader via Bluetooth (or WiFi, WiMax), or enter data manually (may be error prone). A decision support option screen can provide location-specific decision support (if GPS is enabled and databases are available), or generic decision support. The final screen provides basic information regarding the functionality of the decision support and disclaimers as relevant. The protocol for development of the app can be found in the supplemental section. Use of Block Coding, originally developed as Scratch coding [75], and the open-source platform Thunkable ensure that others may replicate the tool.

3.8. Decision Support Application—Cybersecurity

Any discussion of actuation or automation, even if it is partial, must recognize the possibility of cyberthreats. Cybersecurity, by design, is required for implementing the SARA paradigm. SNAPS LM Hydro decision support system (DSS) depends on connectivity using open tools such as IFTTT [86] (if this, then, that) or may integrate with time sensitive networking [87], which creates opportunities for cyber-disruption. Digital by design embraces the concept of IoT [88], and elements of cybersecurity [89] are essential to its core design rather than an “after-thought” in the execution layer. The design of cybersecurity is beyond the scope of this paper. We touch upon a few common cyberthreat scenarios and suggest commercial tools to mitigate risks. Cybercrimes may involve: (i) time alteration, (ii) GPS spoofing, (iii) intruders, and iv) embedded systems.
(i) Time alteration: Elementary cyberthreat which may precipitate discord simply by altering the time when an action is performed (actuated).
Time jamming targets the network time protocol (NTP) by amplifying [90] requests to a NTP server (distributed denial of service [91] or DDoS attack) which makes time “unavailable” to the command execution layer. Internet Engineering Task Force’s (IETF) manufacturer usage description (MUD) architecture is “supposed” to enable (IoT [92]) devices to send and receive only the traffic they require to perform as intended (network will prohibit other communication with the devices).
Time spoofing works by providing the wrong time, for example, changing the time in reverse such that an event can be accomplished in that interval or execute an event using an expired (timestamp) authorization key or code which can be reused if the system accepts it as “valid” because the “spoofed” time is still within the valid time window. Problems with time are compounded in software-driven commands to execute physical processes (cyberphysical systems, programmable logic controllers) not only due to engineering constraints [93] (bandwidth, latency, jitter) but because the semantics of time and the physical notion of “timeliness” is still not a part of software architecture [94]. Perhaps this dysfunctional gap in time is due to intrinsic human inability to grasp the epistemology of temporal semantics. To deploy SARA, we have to address cyberthreats in the context of the SNAPS LM Hydro DSS because delayed actuation could change system performance. Vendors provide a variety of tools which may be integrated with SNAPS DSS cloud as a risk mitigation strategy (in consultation with customers/users).
(ii) GPS spoofing: Incorrect location (GPS spoofing [95]) of sensor data could destabilize food safety and security. For example, SARA-induced auto-actuation may release contaminated wastewater to flood an already moist (water saturated) field growing produce or redirect a false alarm about pathogens (causing humans in the loop to discard food or produce). With increasing adoption of SARA/SNAPS, the risks [96] for open-source CPS [97] projects due to Global Navigation Satellite System (GNSS) spoofing may result in fake position, navigation, and time (PNT) information. The latter may cause economic loss and social unrest.
The relative ease [98] of GPS spoofing with software-defined radio (SDR) is due to the fact that GPS transmits an open signal without any encryption, which can be recorded, manipulated and transmitted. GPS location spoofing often converges with time spoofing (PNT [99]) because the GPS network of satellites broadcast time-stamped messages continually. The hacker may alter how long (time) it takes for the signals from each satellite to reach the receiver (multiplying this time by the speed of light gives the distance between the receiver and each satellite). Interference detection and mitigation (IDM) tools may be integrated with SARA/SNAPS to protect [100] against overt and covert [101] GPS spoofing, according to project requirements.
(iii) Intruders: Security of applications against intruders and intruder detection [102] is an immense and dynamic problem in several domains including IoT scenarios. In the context of SARA/SNAPS, it is important to strike an operational balance between the infinite breadth of this problem versus a feasible inclusion of a verification system which can authenticate and authorize users accessing various parts of the SNAPS network/application. We propose using multi-factor authentication [103] (MFA) as a tool to verify the identity of users using a code, token or certificate usually linked via a mobile app to doubly authenticate the user during the sign-in process. In addition, MFA may also use a re-validation step using a remotely stored certificate [104] in a home institution [105] or on a trusted third-party server, or use biometrics, such as a fingerprint or retina scan.
(iv) Embedded systems: Emergence of the networked physical world made it clear that any form of identification [106] (objects, processes, humans) must address security [107] implications. Extending the IoT metaphor to SARA/SNAPS implies that the nature of messaging between components (sensors, devices, gateways) is vulnerable to intrusion. Enhancing security [108] within the SARA/SNAPS ecosystem may avoid commercial excesses but explore whether tools like MAM [109] or masked (encrypted) authenticated (device verification) messaging (data) may be feasible for deployment. Thus, in combination, MFA and MAM provide authentication, at least partially, for users, data and devices, in our attempt to address a basic layer of cybersecurity.

4. Conclusions

Current standard methods of foodborne pathogen detection including culture and colony counting, ELISA, and PCR require training and are time consuming. As foodborne pathogens are a persistent concern in the food industry, there is a demand for a rapid, reliable, and cost-effective detection method. The biosensors developed here using 100 nM of Concanavalin A (ConA) lectin or antibody in a PNIPAAm nanobrush sensing platform achieved a rapid detection (17 min total) of Escherichia coli in a buffer solution (PBS), as well as in a real-world scenario simulated by a complex vegetable broth. The use of thermo-responsive polymer brush interfaces in combination with hybrid nPt-rGO nanostructures were shown to enhance the capture of target E. coli bacteria and transduction of electrochemical outputs as the acquisition signal. The optimum conditions were to capture bacteria at 20 °C when PNIPAAm nanobrushes were expanded, and initiate the test sequence at 40 °C when the brushes were collapsed. Expanded brushes permitted biorecognition agents to more easily attach to bacteria, while the collapsed state assisted in electrochemical response. The nPt-rGO-PNIPAAm-ConA sensor presented significantly low LOD (LOD of 5.0 ± 2.9 CFU/mL), high sensitivity (2068.2 ± 346.6 Ω/log(CFU/mL) and selectivity (LOD of 2.3 ± 0.8 CFU/mL) to E. coli on the performance tests with E. coli K12 alone and also with E. coli K12 and Salmonella Enteritidis in the PBS, respectively. Selectivity to E. coli in the presence of Salmonella was important in evaluating the success of the sensor and comparison to preexisting sensors. On the tests in vegetable broth inoculated with E. coli O157:H7 to mimic a real-world, complex sample in the presence of a foodborne pathogen, the PNIPAAm-ConA sensor showed sensitivity (1915.0 ± 1070.1 Ω/log(CFU/mL)) similar (p > 0.05) to the PNIPAAm-antibody sensor (2004 ± 253.6 Ω/log(CFU/mL)). Hence, the application of the nPt-rGO-PNIPAAm as a platform for both ConA and antibodies provided superior performance results when detecting E. coli in pristine media such as PBS, as well as in a complex system such as vegetable broth compared to the literature. The advantages of ConA over antibodies in terms of production, cost, and shelf-life combined with comparable results to other biosensors make nPt-rGO-PNIPAAm-ConA a potential alternative to current detection methods for testing food samples.
Extending this biosensor application and potential adoption, SARA represents a rapid, label-free bacteria detection system for use in agricultural waters where nanomaterial actuation is triggered by a smartphone. Actuation of the nanobrush takes place without requiring the user to perform any additional tasks. The decision support tool (ART) is embedded in the smartphone used for signal acquisition. Our use of polymer nanobrushes in biosensing significantly advances the field by developing a new cyber-physical tool which is amenable to direct control over the brush border structure, rather than relying on specialty equipment within a laboratory. SARA extends the spatial resolution in processing facilities to contain the spread of contamination. Such detection methods raise even more interest when the economic losses due to recalls of contaminated food or the extra time to release the product are considered.

Supplementary Materials

The following are available online at https://www.mdpi.com/2076-0825/10/1/2/s1: Figure S1. Time course of SARA testing system. Sample pumps provide mixing, sampling, and temperature control. Figure S2. Cyclic voltammetry of the SPC functionalized electrodes before and after freeze-drying process. Figure S3. Simplified process flow diagram showing semi-closed loop batch aeroponic system and SARA biosensor loop. Figure S4. SARA workflow for programming the microcontroller. Figure S5. Decision tree for design of decision support application. Figure S6. SEM images of nPt-rGO electrodes with PNIPAAM nanobrushes. (a) top view and (b,c) cross-sectional view at 10 kV and 25,000, 10,000, and 29,000 times magnification, respectively. Figure S7. Comparison of ESA in cm2 and representative CV curves at 100 mV/s for nPt-rGO coated electrodes at different (a,b) antibody concentrations; and (c,d) ConA concentrations. Figure S8. Representative Nyquist plots for PNIPAAm brush sensors decorated with ConA over the frequency range of 1–100,000 Hz exposed to (a) E. coli K12 (CFU/mL), and (b) equal concentrations of E. coli K12 and Salmonella Enteritidis (CFU/mL) in PBS. Figure S9. Representative Nyquist plots over the frequency range of 1–100,00 Hz for PNIPAAm brush sensors decorated with (a) ConA; and (b) Anti-GroEL antibody exposed to various concentrations of E. coli O157:H7 (CFU/mL) in vegetable broth. Figure S10. Representative Bode plots over the frequency range of 1–100,000 Hz for (a) nPt-rGO-ConA and (b) nPt-rGO-Anti-GroEL antibody modified electrodes exposed to various concentrations of E. coli K12 (CFU/mL) in PBS. Figure S11. Percent change in Rct during SARA system testing. The percent change decreased significantly with increasing E. coli concentration.

Author Contributions

Conceptualization, S.P.A.D., E.S.M. and C.L.G.; methodology, C.A.G., D.A.O., C.C.P., D.X., Y.T., E.S.M. and C.L.G.; software, D.X., S.P.A.D., E.S.M.; validation, C.A.G., D.A.O., D.X., Y.T. and E.S.M.; formal analysis, C.A.G., D.A.O., C.C.P, E.S.M. and C.L.G.; resources, E.S.M. and C.L.G.; data curation, E.S.M. and C.L.G.; writing—original draft preparation, C.A.G., E.S.M. and C.L.G.; writing—review and editing, D.A.O., C.C.P., S.P.A.D., E.S.M. and C.L.G.; visualization, D.A.O., C.C.P., S.P.A.D., E.S.M. and C.L.G.; supervision, E.S.M. and C.L.G.; funding acquisition, E.S.M. and C.L.G. All authors have read and agreed to the published version of the manuscript.

Funding

This project was supported by Agriculture and Food Research Initiative (AFRI) Competitive Grant no. 2018-67016-27578 awarded as a Center of Excellence from the USDA National Institute of Food and Agriculture, the National Science Foundation Nanobiosensors program (Grants No. CBET-1511953/1512659), and USDA-AFRI project number 2017-08795. The authors also acknowledge support from the UF IFAS Equipment Grant (ESM). A pre-print of this paper is in the MIT Library and may be downloaded using this URL: https://dspace.mit.edu/handle/1721.1/123983.

Institutional Review Board Statement

Not applicable.

Informed Consent Statement

Not applicable.

Data Availability Statement

The data presented in this study are available on request from the corresponding author.

Conflicts of Interest

The authors declare no conflict of interest.

References

  1. Valderrama, W.B.; Dudley, E.G.; Doores, S.; Cutter, C.N. Commercially Available Rapid Methods for Detection of Selected Food-borne Pathogens. Crit. Rev. Food Sci. Nutr. 2016, 56, 1519–1531. [Google Scholar] [CrossRef]
  2. Vanegas, D.C.; Gomes, C.L.; Cavallaro, N.D.; Giraldo-Escobar, D.; McLamore, E.S. Emerging Biorecognition and Transduction Schemes for Rapid Detection of Pathogenic Bacteria in Food. Compr. Rev. Food Sci. Food Saf. 2017, 16, 1188–1205. [Google Scholar] [CrossRef] [Green Version]
  3. Wang, Y.; Salazar, J.K. Culture-Independent Rapid Detection Methods for Bacterial Pathogens and Toxins in Food Matrices. Compr. Rev. Food Sci. Food Saf. 2016, 15, 183–205. [Google Scholar] [CrossRef]
  4. Umesha, S.; Manukumar, H.M. Advanced molecular diagnostic techniques for detection of food-borne pathogens: Current applications and future challenges. Crit. Rev. Food Sci. Nutr. 2018, 58, 84–104. [Google Scholar] [CrossRef]
  5. Centers for Disease Control and Prevention (CDC). National Outbreak Reporting System (NORS). 2020. Available online: https://wwwn.cdc.gov/norsdashboard/ (accessed on 14 October 2020).
  6. Centers for Disease Control and Prevention (CDC). Estimates of Foodborne Illness in the United States. 2018. Available online: https://www.cdc.gov/foodborneburden/2011-foodborne-estimates.html (accessed on 27 July 2020).
  7. Rai, P.K.; Tripathi, B.D. Microbial contamination in vegetables due to irrigation with partially treated municipal wastewater in a tropical city. Int. J. Environ. Health Res. 2007, 17, 389–395. [Google Scholar] [CrossRef]
  8. Callejón, R.M.; Rodríguez-Naranjo, M.I.; Ubeda, C.; Hornedo-Ortega, R.; Garcia-Parrilla, M.C.; Troncoso, A.M. Reported Foodborne Outbreaks Due to Fresh Produce in the United States and European Union: Trends and Causes. Foodborne Pathog. Dis. 2015, 12, 32–38. [Google Scholar] [CrossRef]
  9. Odonkor, S.T.; Ampofo, J.K. Escherichia coli as an indicator of bacteriological quality of water: An overview. Microbiol. Res. 2013, 4, e2. [Google Scholar] [CrossRef]
  10. Feng, P.; Weagant, S. Chapter 4A: Diarrheagenic Escherichia coli. U.S. Food & Drug Administration (FDA). Bacteriological Analytical Manual. 2011. Available online: https://www.fda.gov/food/laboratory-methods-food/bam-chapter-4a-diarrheagenic-escherichia-coli (accessed on 24 June 2020).
  11. Walker, C.L.F.; Applegate, J.A.; Black, R.E. Haemolytic-uraemic syndrome as a sequela of diarrhoeal disease. J. Health Popul. Nutr. 2012, 30, 257–261. [Google Scholar] [CrossRef] [PubMed] [Green Version]
  12. Rasko, D.A.; Rosovitz, M.J.; Myers, G.S.A.; Mongodin, E.F.; Fricke, W.F.; Gajer, P.; Crabtree, J.; Sebaihia, M.; Thomson, N.R.; Chaudhuri, R.; et al. The Pangenome Structure of Escherichia coli: Comparative Genomic Analysis of E. coli Commensal and Pathogenic Isolates. J. Bacteriol. 2008, 190, 6881–6893. [Google Scholar] [CrossRef] [PubMed] [Green Version]
  13. Centers for Disease Control and Prevention (CDC). Multistate Outbreak of E. coli O157:H7 Infections Linked to Romaine Lettuce. 2018. Available online: https://www.cdc.gov/ecoli/2018/o157h7-04-18/index.html (accessed on 24 July 2020).
  14. Allende, A.; Datta, A.R.; Smith, W.A.; Adonis, R.; MacKay, A.; Adell, A.D. Implications of new legislation (US FSMA) and guidelines (EC) on the establishment of management systems for agricultural water. Food Microbiol. 2018, 75, 119–125. [Google Scholar] [CrossRef]
  15. U.S. Food and Drug Administration (FDA). FSMA Final Rule on Produce Safety; FDA: Silver Spring, MD, USA, 2020.
  16. U.S. Food and Drug Administration (FDA). FSMA Rules & Guidance for Industry. 2020. Available online: https://www.fda.gov/food/food-safety-modernization-act-fsma/fsma-rules-guidance-industry (accessed on 24 July 2020).
  17. Rezaei, A. Food safety: The farmer first health paradigm. One Health 2018, 5, 69–73. [Google Scholar] [CrossRef] [PubMed]
  18. Ahearn, M.C.; Armbruster, W.; Young, R. Big Data’s Portential to Improve Food Supply Chain Environmental Sustainability and Food Safety. Int. Food Agribus. Manag. Rev. 2016, 19, 155–171. [Google Scholar]
  19. McLamore, E.S.; Palit Austin Datta, S.; Morgan, V.; Cavallaro, N.; Kiker, G.; Jenkins, D.M.; Rong, Y.; Gomes, C.; Claussen, J.; Vanegas, D.; et al. SNAPS: Sensor Analytics Point Solutions for Detection and Decision Support Systems. Sensors 2019, 19, 4935. [Google Scholar] [CrossRef] [PubMed] [Green Version]
  20. Armbruster, W.; MacDonell, M.M. Informatics to Support International Food Safety. In Proceedings of the 28th EnviroInfo 2014 Conference, Oldenburg, Germany, 10–12 September 2014. [Google Scholar]
  21. Marvin, H.J.P.; Janssen, E.M.; Bouzembrak, Y.; Hendriksen, P.J.M.; Staats, M. Big data in food safety: An overview. Crit. Rev. Food Sci. Nutr. 2017, 57, 2286–2295. [Google Scholar] [CrossRef] [PubMed] [Green Version]
  22. Food and Drug Administration (FDA). Standards for the Growing, Harvesting, Packing, and Holding of Produce for Human Consumption: What You Need to Know About the FDA Regulation: Guidance for Industry Small Entity Compliance Guide. 2017. Available online: https://www.fda.gov/media/107298/download (accessed on 24 July 2020).
  23. Rock, C.M.; Brassill, N.; Dery, J.L.; Carr, D.; McLain, J.E.; Bright, K.R.; Gerba, C.P. Review of water quality criteria for water reuse and risk-based implications for irrigated produce under the FDA Food Safety Modernization Act, produce safety rule. Environ. Res. 2019, 172, 616–629. [Google Scholar] [CrossRef]
  24. Markland, S.M.; Ingram, D.; Kniel, K.E.; Sharma, M. Water for Agriculture: The Convergence of Sustainability and Safety. Microbiol. Spectr. 2017, 5. [Google Scholar] [CrossRef] [Green Version]
  25. United States Department of Agriculture Food Safety and Inspection Services (USDA FSIS). FSIS Compliance Guideline for Controlling Meat and Poultry Products Pending FSIS Test Results. 2013. Available online: https://www.fsis.usda.gov/wps/wcm/connect/6b7b5a65-9ad3-4f89-927d-078e564aca24/Compliance_Guide_Test_Hold_020113.pdf?MOD=AJPERES (accessed on 24 July 2020).
  26. Pozo, V.F.; Schroeder, T.C. Evaluating the costs of meat and poultry recalls to food firms using stock returns. Food Policy 2016, 59, 66–77. [Google Scholar] [CrossRef]
  27. Castell-Perez, E.; Gomes, C.; Tahtouh, J.; Moreira, R.; McLamore, E.S.; Knowles, H.S. Food Processing and Waste Within the Nexus Framework. Curr. Sustain. Renew. Energy Rep. 2017, 4, 99–108. [Google Scholar] [CrossRef]
  28. Keener, L.; Nicholson-Keener, S.M.; Koutchma, T. Harmonization of legislation and regulations to achieve food safety: US and Canada perspective. J. Sci. Food Agric. 2014, 94, 1947–1953. [Google Scholar] [CrossRef]
  29. Morgan, V.; Casso-Hartmann, L.; Bahamon-Pinzon, D.; McCourt, K.; Hjort, R.G.; Bahramzadeh, S.; Velez-Torres, I.; McLamore, E.; Gomes, C.; Alocilja, E.C.; et al. Sensor-as-a-Service: Convergence of Sensor Analytic Point Solutions (SNAPS) and Pay-A-Penny-Per-Use (PAPPU) Paradigm as a Catalyst for Democratization of Healthcare in Underserved Communities. Diagnostics 2020, 10, 22. [Google Scholar] [CrossRef] [Green Version]
  30. Vanegas, D.; Gomes, C.; McLamore, E. Biosensors for Indirect Monitoring of Foodborne Bacteria. Biosens. J. 2016, 5, 137–139. [Google Scholar] [CrossRef] [Green Version]
  31. Duffy, G.; Lynch, O.A.; Cagney, C. Tracking emerging zoonotic pathogens from farm to fork. Meat Sci. 2008, 78, 34–42. [Google Scholar] [CrossRef] [PubMed]
  32. Wassenaar, T.M. Following an imaginary Campylobacter population from farm to fork and beyond: A bacterial perspective. Lett. Appl. Microbiol. 2011, 53, 253–263. [Google Scholar] [CrossRef] [PubMed]
  33. Fozouni, P.; Son, S.; Díaz de León Derby, M.; Knott, G.J.; Gray, C.N.; D’Ambrosio, M.V.; Zhao, C.; Switz, N.A.; Kumar, G.R.; Stephens, S.I.; et al. Direct detection of SARS-CoV-2 using CRISPR-Cas13a and a mobile phone. medRxiv 2020. [Google Scholar] [CrossRef]
  34. Bhunia, A.K.; Taitt, C.R.; Kim, M.S. High Throughput Screening for Food Safety Assessment; Woodhead Publishing: Cambridge, UK, 2015. [Google Scholar] [CrossRef]
  35. Varshney, M.; Li, Y. Interdigitated array microelectrode based impedance biosensor coupled with magnetic nanoparticle–antibody conjugates for detection of Escherichia coli O157:H7 in food samples. Biosens. Bioelectron. 2007, 22, 2408–2414. [Google Scholar] [CrossRef]
  36. Daniels, J.S.; Pourmand, N. Label-Free Impedance Biosensors: Opportunities and Challenges. Electroanalysis 2007, 19, 1239–1257. [Google Scholar] [CrossRef]
  37. Jenkins, D.M.; Lee, B.E.; Jun, S.; Reyes-De-Corcuera, J.; McLamore, E.S. ABE-Stat, a Fully Open-Source and Versatile Wireless Potentiostat Project Including Electrochemical Impedance Spectroscopy. J. Electrochem. Soc. 2019, 166, B3056–B3065. [Google Scholar] [CrossRef]
  38. Wang, X.; Feng, Y.; Dong, P.; Huang, J. A Mini Review on Carbon Quantum Dots: Preparation, Properties, and Electrocatalytic Application. Front. Chem. 2019, 7, 671. [Google Scholar] [CrossRef]
  39. Xiao, Z.; Kong, L.B.; Ruan, S.; Li, X.; Yu, S.; Li, X.; Jiang, Y.; Yao, Z.; Ye, S.; Wang, C.; et al. Recent development in nanocarbon materials for gas sensor applications. Sens. Actuators B Chem. 2018, 274, 235–267. [Google Scholar] [CrossRef]
  40. Taguchi, M.; Schwalb, N.; Rong, Y.; Vanegas, D.C.; Garland, N.; Tan, M.; Yamaguchi, H.; Claussen, J.C.; McLamore, E.S. pulSED: Pulsed sonoelectrodeposition of fractal nanoplatinum for enhancing amperometric biosensor performance. Analyst 2016, 141, 3367–3378. [Google Scholar] [CrossRef]
  41. Burrs, S.L.; Vanegas, D.C.; Bhargava, M.; Mechulan, N.; Hendershot, P.; Yamaguchi, H.; Gomes, C.; McLamore, E.S. A comparative study of graphene–hydrogel hybrid bionanocomposites for biosensing. Analyst 2015, 140, 1466–1476. [Google Scholar] [CrossRef] [PubMed]
  42. Vanegas, D.C.; Taguchi, M.; Chaturvedi, P.; Burrs, S.; Tan, M.; Yamaguchi, H.; McLamore, E.S. A comparative study of carbon–platinum hybrid nanostructure architecture for amperometric biosensing. Analyst 2014, 139, 660–667. [Google Scholar] [CrossRef] [PubMed]
  43. McLamore, E.S.; Mohanty, S.; Shi, J.; Claussen, J.; Jedlicka, S.S.; Rickus, J.L.; Porterfield, D.M. A self-referencing glutamate biosensor for measuring real time neuronal glutamate flux. J. Neurosci. Methods 2010, 189, 14–22. [Google Scholar] [CrossRef] [PubMed]
  44. Claussen, J.C.; Hengenius, J.B.; Wickner, M.M.; Fisher, T.S.; Umulis, D.M.; Porterfield, D.M. Effects of Carbon Nanotube-Tethered Nanosphere Density on Amperometric Biosensing: Simulation and Experiment. J. Phys. Chem. C 2011, 115, 20896–20904. [Google Scholar] [CrossRef]
  45. Claussen, J.C.; Franklin, A.D.; Haque, A.; Porterfield, D.M.; Fisher, T.S. Electrochemical Biosensor of Nanocube-Augmented Carbon Nanotube Networks. ACS Nano 2009, 3, 37–44. [Google Scholar] [CrossRef]
  46. He, Q.; Das, S.R.; Garland, N.T.; Jing, D.; Hondred, J.A.; Cargill, A.A.; Ding, S.; Karunakaran, C.; Claussen, J.C. Enabling Inkjet Printed Graphene for Ion Selective Electrodes with Postprint Thermal Annealing. ACS Appl. Mater. Interfaces 2017, 9, 12719–12727. [Google Scholar] [CrossRef] [Green Version]
  47. Taguchi, M.; Ptitsyn, A.; McLamore, E.S.; Claussen, J.C. Nanomaterial-mediated Biosensors for Monitoring Glucose. J. Diabetes Sci. Technol. 2014, 8, 403–411. [Google Scholar] [CrossRef] [Green Version]
  48. Walcarius, A.; Minteer, S.D.; Wang, J.; Lin, Y.; Merkoçi, A. Nanomaterials for bio-functionalized electrodes: Recent trends. J. Mater. Chem. B 2013, 1, 4878–4908. [Google Scholar] [CrossRef]
  49. Hills, K.D.; Oliveira, D.A.; Cavallaro, N.D.; Gomes, C.L.; McLamore, E.S. Actuation of chitosan-aptamer nanobrush borders for pathogen sensing. Analyst 2018, 143, 1650–1661. [Google Scholar] [CrossRef] [Green Version]
  50. Li, X.; ShamsiJazeyi, H.; Pesek, S.L.; Agrawal, A.; Hammouda, B.; Verduzco, R. Thermoresponsive PNIPAAM bottlebrush polymers with tailored side-chain length and end-group structure. Soft Matter 2014, 10, 2008–2015. [Google Scholar] [CrossRef] [Green Version]
  51. Yin, Z.; Zhang, J.; Jiang, L.-P.; Zhu, J.-J. Thermosensitive Behavior of Poly(N-isopropylacrylamide) and Release of Incorporated Hemoglobin. J. Phys. Chem. C 2009, 113, 16104–16109. [Google Scholar] [CrossRef]
  52. Leal, D.; De Borggraeve, W.; Encinas, M.V.; Matsuhiro, B.; Müller, R. Preparation and characterization of hydrogels based on homopolymeric fractions of sodium alginate and PNIPAAm. Carbohydr. Polym. 2013, 92, 157–166. [Google Scholar] [CrossRef] [PubMed]
  53. Liu, Y.; Meng, S.; Mu, L.; Jin, G.; Zhong, W.; Kong, J. Novel renewable immunosensors based on temperature-sensitive PNIPAAm bioconjugates. Biosens. Bioelectron. 2008, 24, 710–715. [Google Scholar] [CrossRef] [PubMed]
  54. Zhao, X.; Liu, Y.; Lu, J.; Zhou, J.; Li, J. Temperature-Responsive Polymer/Carbon Nanotube Hybrids: Smart Conductive Nanocomposite Films for Modulating the Bioelectrocatalysis of NADH. Chem. A Eur. J. 2012, 18, 3687–3694. [Google Scholar] [CrossRef] [PubMed]
  55. Gamella, M.; Campuzano, S.; Parrado, C.; Reviejo, A.J.; Pingarrón, J.M. Microorganisms recognition and quantification by lectin adsorptive affinity impedance. Talanta 2009, 78, 1303–1309. [Google Scholar] [CrossRef] [PubMed]
  56. Campuzano, S.; Orozco, J.; Kagan, D.; Guix, M.; Gao, W.; Sattayasamitsathit, S.; Claussen, J.C.; Merkoçi, A.; Wang, J. Bacterial Isolation by Lectin-Modified Microengines. Nano Lett. 2012, 12, 396–401. [Google Scholar] [CrossRef]
  57. Vanegas, D.C.; Clark, G.; Cannon, A.E.; Roux, S.; Chaturvedi, P.; McLamore, E.S. A self-referencing biosensor for real-time monitoring of physiological ATP transport in plant systems. Biosens. Bioelectron. 2015, 74, 37–44. [Google Scholar] [CrossRef]
  58. Vanegas, D.C.; Patiño, L.; Mendez, C.; Oliveira, D.A.D.; Torres, A.M.; Gomes, C.L.; McLamore, E.S. Laser Scribed Graphene Biosensor for Detection of Biogenic Amines in Food Samples Using Locally Sourced Materials. Biosensors 2018, 8, 42. [Google Scholar] [CrossRef] [Green Version]
  59. Burrs, S.L.; Bhargava, M.; Sidhu, R.; Kiernan-Lewis, J.; Gomes, C.; Claussen, J.C.; McLamore, E.S. A paper based graphene-nanocauliflower hybrid composite for point of care biosensing. Biosens. Bioelectron. 2016, 85, 479–487. [Google Scholar] [CrossRef] [Green Version]
  60. Soares, R.R.A.; Hjort, R.G.; Pola, C.C.; Parate, K.; Reis, E.L.; Soares, N.F.F.; McLamore, E.S.; Claussen, J.C.; Gomes, C.L. Laser-Induced Graphene Electrochemical Immunosensors for Rapid and Label-Free Monitoring of Salmonella enterica in Chicken Broth. ACS Sens. 2020, 5, 1900–1911. [Google Scholar] [CrossRef]
  61. Sidhu, R.K.; Cavallaro, N.D.; Pola, C.C.; Danyluk, M.D.; McLamore, E.S.; Gomes, C.L. Planar Interdigitated Aptasensor for Flow-Through Detection of Listeria spp. in Hydroponic Lettuce Growth Media. Sensors 2020, 20, 5773. [Google Scholar] [CrossRef] [PubMed]
  62. Marhaenanto, B.; Soni, P.; Salakhe, V.M. Development of an internet-based greenhouse control system. Int. Agric. Eng. J. 2013, 22, 72–83. [Google Scholar]
  63. McLamore, E.S.; Jaroch, D.; Chatni, M.R.; Porterfield, D.M. Self-referencing optrodes for measuring spatially resolved, real-time metabolic oxygen flux in plant systems. Planta 2010, 232, 1087–1099. [Google Scholar] [CrossRef] [PubMed]
  64. Dean, D.A.; Ramanathan, T.; Machado, D.; Sundararajan, R. Electrical Impedance Spectroscopy Study of Biological Tissues. J. Electrost. 2008, 66, 165–177. [Google Scholar] [CrossRef] [Green Version]
  65. Ding, Y.; Nawroth, J.C.; McFall-Ngai, M.J.; Kanso, E. Mixing and transport by ciliary carpets: A numerical study. J. Fluid Mech. 2014, 743, 124–140. [Google Scholar] [CrossRef] [Green Version]
  66. Tsumori, F.; Saijou, A.; Osada, T.; Miura, H. Development of actuation system for artificial cilia with magnetic elastomer. Jpn. J. Appl. Phys. 2015, 54. [Google Scholar] [CrossRef]
  67. Hanasoge, S.; Hesketh, P.J.; Alexeev, A. Metachronal motion of artificial magnetic cilia. Soft Matter 2018, 14, 3689–3693. [Google Scholar] [CrossRef] [Green Version]
  68. Reeke, G.N.; Becker, J.W.; Edelman, G.M. The covalent and three-dimensional structure of concanavalin A. IV. Atomic coordinates, hydrogen bonding, and quaternary structure. J. Biol. Chem. 1975, 250, 1525–1547. [Google Scholar]
  69. Castillo-Torres, K.Y.; Arnold, D.P.; McLamore, E.S. Rapid isolation of Escherichia coli from water samples using magnetic microdiscs. Sens. Actuators B Chem. 2019, 291, 58–66. [Google Scholar] [CrossRef] [Green Version]
  70. Danielsen, E.M.; Hansen, G.H. Lipid rafts in epithelial brush borders: Atypical membrane microdomains with specialized functions. Biochim. Biophys. Acta Biomembr. 2003, 1617, 1–9. [Google Scholar] [CrossRef] [Green Version]
  71. Samuel, G.; Reeves, P. Biosynthesis of O-antigens: Genes and pathways involved in nucleotide sugar precursor synthesis and O-antigen assembly. Carbohydr. Res. 2003, 338, 2503–2519. [Google Scholar] [CrossRef] [PubMed]
  72. Singh, A.K.; Harrison, S.H.; Schoeniger, J.S. Gangliosides as Receptors for Biological Toxins: Development of Sensitive Fluoroimmunoassays Using Ganglioside-Bearing Liposomes. Anal. Chem. 2000, 72, 6019–6024. [Google Scholar] [CrossRef] [PubMed]
  73. Gibson, D.L.; White, A.P.; Snyder, S.D.; Martin, S.; Heiss, C.; Azadi, P.; Surette, M.; Kay, W.W. Salmonella produces an O-antigen capsule regulated by AgfD and important for environmental persistence. J. Bacteriol. 2006, 188, 7722–7730. [Google Scholar] [CrossRef] [PubMed] [Green Version]
  74. Miura, Y.; Hoshino, Y.; Seto, H. Glycopolymer Nanobiotechnology. Chem. Rev. 2016, 116, 1673–1692. [Google Scholar] [CrossRef]
  75. McLellan, J.S.; Chen, M.; Joyce, M.G.; Sastry, M.; Stewart-Jones, G.B.E.; Yang, Y.; Zhang, B.; Chen, L.; Srivatsan, S.; Zheng, A.; et al. Structure-Based Design of a Fusion Glycoprotein Vaccine for Respiratory Syncytial Virus. Science 2013, 342, 592–598. [Google Scholar] [CrossRef] [Green Version]
  76. Hsieh, C.-L.; Goldsmith, J.A.; Schaub, J.M.; DiVenere, A.M.; Kuo, H.-C.; Javanmardi, K.; Le, K.C.; Wrapp, D.; Lee, A.G.; Liu, Y.; et al. Structure-based design of prefusion-stabilized SARS-CoV-2 spikes. Science 2020, 369, 1501–1505. [Google Scholar] [CrossRef]
  77. Radke, S.M.; Alocilja, E.C. A high density microelectrode array biosensor for detection of E. coli O157:H7. Biosens. Bioelectron. 2005, 20, 1662–1667. [Google Scholar] [CrossRef]
  78. Joung, C.-K.; Kim, H.-N.; Lim, M.-C.; Jeon, T.-J.; Kim, H.-Y.; Kim, Y.-R. A nanoporous membrane-based impedimetric immunosensor for label-free detection of pathogenic bacteria in whole milk. Biosens. Bioelectron. 2013, 44, 210–215. [Google Scholar] [CrossRef]
  79. Chowdhury, A.; Raut, S.A.; Narman, H.S. DA-DRLS: Drift adaptive deep reinforcement learning based scheduling for IoT resource management. J. Netw. Comput. Appl. 2019, 138, 51–65. [Google Scholar] [CrossRef]
  80. Chowdhury, A.D.; De, A.; Chaudhuri, C.R.; Bandyopadhyay, K.; Sen, P. Label free polyaniline based impedimetric biosensor for detection of E. coli O157:H7 Bacteria. Sens. Actuators B Chem. 2012, 171, 916–923. [Google Scholar] [CrossRef]
  81. Jantra, J.; Kanatharana, P.; Asawatreratanakul, P.; Hedström, M.; Mattiasson, B.; Thavarungkul, P. Real-time label-free affinity biosensors for enumeration of total bacteria based on immobilized concanavalin A. J. Environ. Sci. Health Part A 2011, 46, 1450–1460. [Google Scholar] [CrossRef] [PubMed]
  82. Li, Y.; Cheng, P.; Gong, J.; Fang, L.; Deng, J.; Liang, W.; Zheng, J. Amperometric immunosensor for the detection of Escherichia coli O157:H7 in food specimens. Anal. Biochem. 2012, 421, 227–233. [Google Scholar] [CrossRef] [PubMed]
  83. Lu, Q.; Lin, H.; Ge, S.; Luo, S.; Cai, Q.; Grimes, C.A. Wireless, Remote-Query, and High Sensitivity Escherichia coli O157:H7 Biosensor Based on the Recognition Action of Concanavalin A. Anal. Chem. 2009, 81, 5846–5850. [Google Scholar] [CrossRef] [PubMed] [Green Version]
  84. Aloul, F.; Zahidi, S.; El-Hajj, W. Two factor authentication using mobile phones. In Proceedings of the 2009 IEEE/ACS International Conference on Computer Systems and Applications, Rabat, Morocco, 10–13 May 2009; pp. 641–644. [Google Scholar]
  85. Fielding, R.T. Architectural Styles and the Design of Network-Based Software Architectures. Ph.D. Thesis, University of California, Irvine, CA, USA, 2000. [Google Scholar]
  86. Surbatovich, M.; Aljuraidan, J.; Bauer, L.; Das, A.; Jia, L. Some Recipes Can Do More Than Spoil Your Appetite: Analyzing the Security and Privacy Risks of IFTTT Recipes. In Proceedings of the 26th International Conference on World Wide Web, Perth, Australia, 3–7 May 2017; pp. 1501–1510. [Google Scholar]
  87. TSN. Time-Sensitive Networking (TSN) Task Group. Available online: https://1.ieee802.org/tsn/ (accessed on 24 October 2020).
  88. NIST. NIST Cybersecurity for IoT Program. 2020. Available online: https://www.nist.gov/programs-projects/nist-cybersecurity-iot-program (accessed on 23 August 2020).
  89. Datta, S.P.A. Emergence of Digital Twins: Is This the March of Reason? 2016. Available online: https://dspace.mit.edu/handle/1721.1/104429 (accessed on 20 October 2020).
  90. CISA. UDP-Based Amplification Attacks. Available online: https://us-cert.cisa.gov/ncas/alerts/TA14-017A (accessed on 25 October 2020).
  91. Galeano-Brajones, J.; Carmona-Murillo, J.; Valenzuela-Valdés, J.F.; Luna-Valero, F. Detection and Mitigation of DoS and DDoS Attacks in IoT-Based Stateful SDN: An Experimental Approach. Sensors 2020, 20, 816. [Google Scholar] [CrossRef] [PubMed] [Green Version]
  92. NIST. Mitigating IoT-Based DDoS. Available online: https://www.nccoe.nist.gov/projects/building-blocks/mitigating-iot-based-ddos (accessed on 25 October 2020).
  93. Srinidhi, N.N.; Dilip Kumar, S.M.; Venugopal, K.R. Network optimizations in the Internet of Things: A review. Eng. Sci. Technol. Int. J. 2019, 22, 1–21. [Google Scholar] [CrossRef]
  94. Lee, E.A. Computing needs time. Commun. ACM 2009, 52, 70–79. [Google Scholar] [CrossRef]
  95. Humphreys, T.E.; Ledvina, B.M.; Psiaki, M.L.; O’Hanlon, B.W.; Kintner, P.M. Assessing the Spoofing Threat: Development of a Portable GPS Civilian Spoofer. In Proceedings of the ION GNSS Conference, Savannah, GA, USA, 16–19 September 2008. [Google Scholar]
  96. King, C.; Chu, J.; Mellinger, A.O. Emerging Technology Domains Risk Survey; Carnegie Mellon University (CMU): Pittsburgh, PA, USA, 2015. [Google Scholar]
  97. Wei, X.; Sikdar, B. Impact of GPS Time Spoofing Attacks on Cyber Physical Systems. In Proceedings of the 2019 IEEE International Conference on Industrial Technology (ICIT), Melbourne, Australia, 13–15 February 2019; pp. 1155–1160. [Google Scholar]
  98. Zhao, B.; Chen, Q. Location Spoofing in a Location-Based Game: A Case Study of Pokémon Go. In Proceedings of the International Cartographic Conference, Durban, South Africa, 10–16 August 2003; pp. 21–32. [Google Scholar]
  99. National Institute of Standards and Technology. Cybersecurity Profile for the Responsible Use of Positioning Navigation and Timing (PNT) Sevices; NIST: Gaithersburg, MD, USA, 2020.
  100. Psiaki, M.L.; Humphreys, T.E. Protecting GPS from Spoofers is Critical to the Future of Navigation. Available online: https://spectrum.ieee.org/telecom/security/protecting-gps-from-spoofers-is-critical-to-the-future-of-navigation (accessed on 25 October 2020).
  101. Eldosouky, A.; Ferdowsi, A.; Saad, W. Drones in Distress: A Game-Theoretic Countermeasure for Protecting UAVs against GPS Spoofing. IEEE Internet Things J. 2020, 7, 2840–2854. [Google Scholar] [CrossRef] [Green Version]
  102. Mallikarjun, B.C.; Kiranmayi, K.J.; Lavanya, N.; Prateeksha, K.H.; Sushmitha, J. Intruder Detection System—A LoRa Based Approach. In Proceedings of the 2020 5th International Conference on Communication and Electronics Systems (ICCES), Coimbatore, India, 10–12 June 2020; pp. 255–258. [Google Scholar]
  103. Microsoft. Azure Active Directory Authentication Documentation. Available online: https://docs.microsoft.com/en-us/azure/active-directory/authentication/ (accessed on 24 October 2020).
  104. Das, M.L.; Samdaria, N. On the security of SSL/TLS-enabled applications. Appl. Comput. Inform. 2014, 10, 68–81. [Google Scholar] [CrossRef] [Green Version]
  105. MIT. Certificates. Available online: https://ist.mit.edu/certificates (accessed on 25 October 2020).
  106. Sarma, S.; Brock, D.; Engels, D. Radio frequency identification and the electronic product code. IEEE Micro 2001, 21, 50–54. [Google Scholar] [CrossRef]
  107. Sarma, S.E.; Weis, S.A.; Engels, D.W. RFID Systems and Security and Privacy Implications; Springer: Berlin/Heidelberg, Germany, 2002; pp. 454–469. [Google Scholar]
  108. Shabandri, B.; Maheshwari, P. Enhancing IoT Security and Privacy Using Distributed Ledgers with IOTA and the Tangle. In Proceedings of the 2019 6th International Conference on Signal Processing and Integrated Networks (SPIN), Noida, India, 7–8 March 2019; pp. 1069–1075. [Google Scholar]
  109. Djaja, F. Send IoT Data to the IOTA Tangle with SAP HANA XSA and Analytics Cloud. Available online: https://blogs.sap.com/2019/10/08/send-iot-data-to-the-iota-tangle-with-sap-hana-xsa-and-analytics-cloud/ (accessed on 24 October 2020).
Figure 1. Electrochemical characterization of bare Pt/Ir, nanohybrid (nPt-rGO), and nanohybrid+nanobrush (PNIPAAm) electrodes using 4 mM K4FeCN6 as the redox probe. (a) Representative CV curves at 100 mV/s scan rate. (b) Relationship between I (μA) versus the square root of the scan rate (V/s)1/2 for electrode modifications are linear in the range tested. (c) Average ESA for various electrode modifications. All data represent the average of three replicates and error bars represent the standard deviation of the arithmetic mean; letters denote significantly different means (p < 0.05).
Actuators 10 00002 g001
Figure 2. Morphological characterization by scanning electron microscopy (SEM) and scanning white light interferometry (SWLI). (a) SEM image for nanohybrid (nPt-rGO) electrode showing homogenous coating with an average feature size of 220 to 1300 nm. (b) Average roughness (Ra) for nPt-rGO calculated from SWLI contour profiles (310.2 nm) indicates a heterogenous surface and irregular abrasions. (c) SEM images show a relatively homogenous coating for nanobrush-coated nPt-rGO electrodes (PNIPAAm) with terminal nodes 910 ± 305 nm in diameter. (d) PNIPAAm-coated electrodes had a more homogenous and smooth coating, with an average Ra of 201.4 nm.
Actuators 10 00002 g002
Figure 3. (a) Representative CV curves at 100 mV/s. For all tests PNIPAAm brushes were functionalized with ConA (100 nM) and tested at different brush configurations based on temperature response; (b) Average charge transfer resistance (Rct) and ESA for different states of PNIPAAm brushes configurations based on temperature response; uppercase and lowercase letters denote significantly different (p < 0.05) Rct and ESA means, respectively, for each temperature; (c) average impedance at different cutoff frequencies for different temperatures of PNIPAAm actuation; letters denote significantly different means (p < 0.05) among the frequencies for each temperature; (d) Representative CV (100 mV/s) showing change in peak current for different states of PNIPAAm actuation during E. coli capture (104 CFU/mL) and measurement. Electrochemical measurements were performed in Fe(CN)63−/Fe(CN)64− redox probe for (ac), and in PBS for (d). Bars represent the average of three replicates.
Actuators 10 00002 g003
Figure 4. Representative Bode plots for PNIPAAm brush sensors decorated with ConA over the frequency range of 1–100,000 Hz exposed to (a) E. coli K12 (CFU/mL); and (b) equal concentrations of E. coli K12 and Salmonella Enteritidis (CFU/mL) in PBS, respectively. Insets show exploded view over the frequency range from 1–5 Hz. (c) Calibration curves (impedance change at 1 Hz vs. log bacteria concentration) for PNIPAAm-ConA sensors exposed to E. coli K12, and E. coli K12 and Salmonella Enteritidis over their respective linear ranges. All data represents the average of three repetitions. Error bars represent the standard deviation.
Actuators 10 00002 g004
Figure 5. Representative Bode plots over the frequency range of 1–100,000 Hz for PNIPAAm brush sensor decorated with (a) ConA; and (b) Anti-GroEL antibody exposed to various concentrations of E. coli O157:H7 (CFU/mL) in vegetable broth. Insets show the exploded view over the frequency range of 1–5 Hz. (c) Calibration curves at 1 Hz for PNIPAAm brush sensor decorated with ConA and Anti-GroEL antibody exposed to E. coli O157:H7 in vegetable broth over their respective linear ranges. All data represents the average of three repetitions. Error bars represent standard deviation.
Actuators 10 00002 g005
Figure 6. Simplified schematic of SARA system, highlighting actuation at the macroscale (microcontrollers used to activate/deactivate pumps) and the nanoscale (polymer swelling/collapse during bacteria capture).
Actuators 10 00002 g006
Figure 7. Replicate impedance data for actuation of E. coli biosensors in hydroponic lettuce system. (a) Average charge transfer resistance for all tests, with colored bar charts indicating equivalent bacteria concentration. The three successive values represent impedance data obtained at 20 °C (extended nanobrush), 40 °C (collapsed nanobrush), and return to 20 °C (extended brush + bacteria). (b) Average sensor calibration using using an extend–capture, collapse–measure scheme. For simulating contamination, 10 mL of an E. coli (ATCC 35218) stock suspension was injected into a T-junction placed upstream of the particle trap/biosensor apparatus. All data represents the average of three repetitions. Error bars represent standard deviation. Different letters denote significantly different means (p < 0.05).
Actuators 10 00002 g007
Figure 8. Select screenshots of SNAPS FC Hydro decision support app. (A) Welcome screen with option for location accuracy. (B) QR code scanner option for batch calibration input; (C) Location accuracy for decision support; (D) Example of result indicating sample requires further processing and may be contaminated with E. coli (>100 CFU E. coli/100 mL).
Actuators 10 00002 g008
Publisher’s Note: MDPI stays neutral with regard to jurisdictional claims in published maps and institutional affiliations.

