Article

Active Exploration for Obstacle Detection on a Mobile Humanoid Robot

1
Humanoid Sensing and Perception Group, Center for Robotics and Intelligent Systems, Italian Institute of Technology, 16163 Genova, Italy
2
Konica Minolta Global R&D Europe, 00144 Rome, Italy
*
Authors to whom correspondence should be addressed.
Actuators 2021, 10(9), 205; https://doi.org/10.3390/act10090205
Submission received: 29 June 2021 / Revised: 5 August 2021 / Accepted: 19 August 2021 / Published: 25 August 2021
(This article belongs to the Special Issue Intelligent Humanoid Mobile Robots)

Abstract

:
Conventional approaches to robot navigation in unstructured environments rely on information acquired from the LiDAR mounted on the robot base to detect and avoid obstacles. This approach fails to detect obstacles that are too small, or that are invisible because they are outside the LiDAR’s field of view. A possible strategy is to integrate information from other sensors. In this paper, we explore the possibility of using depth information from a movable RGB-D camera mounted on the head of the robot, and investigate, in particular, active control strategies to effectively scan the environment. Existing works combine RGBD-D and 2D LiDAR data passively by fusing the current point-cloud from the RGB-D camera with the occupancy grid computed from the 2D LiDAR data, while the robot follows a given path. In contrast, we propose an optimization strategy that actively changes the position of the robot’s head, where the camera is mounted, at each point of the given navigation path; thus, we can fully exploit the RGB-D camera to detect, and hence avoid, obstacles undetected by the 2D LiDAR, such as overhanging obstacles or obstacles in blind spots. We validate our approach in both simulation environments to gather statistically significant data and real environments to show the applicability of our method to real robots. The platform used is the humanoid robot R1.

1. Introduction

Obstacle avoidance in unknown and dynamic environments remains a fundamental challenge in robots’ autonomous navigation [1]. To detect obstacles, the robot must rely on its perception system. The most used sensors used in autonomous navigation are 2D LiDAR and RGB-D cameras. 2D LiDAR sensors provide accurate measurements of the robot’s distance to walls and other obstacles. However, they usually have a limited field of view (FOV) due to occlusions with other robot parts (i.e., the wheels); in addition, they can detect only obstacles at a certain, fixed, height. Consider the example in Figure 1 where a 2D LiDAR is mounted on a robot’s base. The robot is unable, using the 2D LiDAR only, to detect and hence avoid the table in front of it. RGB-D cameras provide rough measurements of 3D surfaces but with lower accuracy than the LiDAR and with a limited field of view, which proved to increase latency in obstacle detection [2]. On the other hand, if the RGB-D camera is actuated—as is the case for the humanoid robot used in this paper—it is possible to actively control it to efficiently scan the environment to detect obstacles before they collide with the robot.
In this paper, we propose fusing 2D LiDAR and RGB-D data employing an off-the-shelf path planner for the robot’s base (where the 2D LiDAR is mounted) combined with an optimized motion planner for the head (where the RGB-D camera is mounted).
Existing works address this problem from a local path planning perspective. A safe trajectory planning strategy is proposed by the authors of [3]; in [4], the authors present a velocity obstacle approach considering sensing limitations, and [5] implements a relaxed constraint MPC framework that allows safe navigation of quad-rotors with body-mounted narrow field-of-view (FOV) sensors.
In contrast, our contribution exploits the capabilities of a humanoid robot to move the RGB-D camera, typically mounted on the robot’s head. We propose an optimized strategy that starts from potential obstacles and the planned trajectory to extract salient points and perform optimal observations in the environment to improve obstacle detection and consequently navigation performance.
The main drawback of classical LiDAR and RGB-D camera fusion approaches is the small FOV of the camera sensors that makes, under certain conditions, obstacles undetectable as demonstrated in [6]. Differently from [3,4,5], which solve this problem by changing the local navigation behavior, we propose a method that does not require modifications in the way the local path is computed.
To summarize, the contribution of the paper is thus twofold:
  • We propose a method for an efficient active exploration of the environment to overcome the limitations of sensors with small FOV;
  • We propose a method which is independent of the navigation stack used; it is thus possible to use our approach with different path planning algorithms, even in combination with [3,4,5] that perform local navigation with partial information.
Our approach has been tested both in simulations and in the real world. The platform used is the humanoid robot R1, a unicycle robot that from the waist up is built to resemble a human. The head, arms, hands and torso are actuated for a total of 26 degrees of freedom.

2. Related Work

The field of robotics navigation is quite broad and includes a large number of different approaches to the problem [1,7] and the use of different sensors technologies (Table 1) in [6,8]. However, navigation can be classified into two types: global navigation and local navigation. Global navigation often requires prior knowledge of the environment including the position of the obstacles. Some of the methods are based on Roadmaps such as [9]; others solve the problem assigning a value to each region and calculate the path with a minimum cost such as Dijkstra algorithm and A * . Other methods are based on cell decomposition, artificial potential fields, visibility graph, cell grids, to mention just a few (see [1] for a review). In local navigation, the robot relies on data coming from various sensors, and a new path is generated in response to changes in the environment. The most used approaches are R R T * , vector field histogram, particle swarm optimization (see [10] for a review). A relatively new approach to solve this category of problems leverages neural networks; examples are the biologically inspired neural network approach [11] or a pattern recognition method with a back propagation learning algorithm for mobile robot navigation, based on computer vision [12].
Researchers are facing progressively more challenging environments with considerable sources of uncertainty; this has led to extensive use of more advanced obstacle detection techniques. 2D LiDAR sensors can be considered the backbone of robotics navigation. However, the use of pure 2D LiDAR for obstacle detection is insufficient to ensure safety in difficult environments [13]. Due to its predefined, constant, scanning height and angle, LiDAR cannot detect low objects and overhanging obstacles [14]. Obstacle detection is thus moving toward more complex strategies for identification: fusion of data from RGB or RGB-D cameras and LiDAR data is a popular technique.
Existing works [15] integrate LiDAR with RGB camera data and employ the YOLO (Ref. [16]) algorithm to obtain the relevant parameters from the color image. Sensor fusion is then performed to improve the accuracy of the target detection. Ref. [14] proposes a method for the detection of overhanging obstacles in the trajectory of autonomous ground vehicle by exploiting a simple 2D LiDAR and a monocular camera. Ref. [17] describes an approach to estimate the position of targets based on fusion of RGB-D camera and 2D LiDAR sensor measurements. Other authors [18,19] demonstrate instead the effectiveness of an RGB-D camera for obstacle avoidance tasks. In particular, [19] presents a system for 2D navigation using RGB-D sensors from which we take inspiration for the Depth Image to Laser Scan module (IV.A). Fusion of LiDAR and an RGB-D sensor is thus proven to be an effective and cost effective strategy to enable navigation in complex environments. However, portable RGB and RGB-D cameras impose certain limitations due to their FOVs.
Sensors that are most frequently used (i.e., [17,18,19]) are the Intel RealSense [20] and the Kinect [21], both characterized by a limited depth range and field of view. Thus, in addition to the local path planning algorithm strategies listed in [7,10], there is also a new category that is gaining momentum in local navigation and it is associated with the field of collision avoidance with limited field of view sensing [3,4,5]. These methods, however, directly try to solve the problem at the level of path planning, without extending the space observed by the sensors.
An example that shows how optimizing the gaze direction of sensors can improve a visual navigation task is proposed in [22]. The work presents a case study for an active sensing problem that directs the gaze of a mobile robot with three machine vision cameras. The robot has to select the direction of gaze of its vision system while following a given sequence of landmarks. The task is to maximize information about the position of the landmarks. Additionally, the work of [23] studies an active sensing problem where a robot must decide in which direction to focus the attention of its actuated vision system to maximize information about landmarks while moving along a fixed trajectory.
These works differ from ours since they use a priori information of each landmark position; this can be helpful when maximizing information in specific and known points of the environment. However, during navigation, the robot does not follow a fixed trajectory and obstacles can be found in any point of the map. Our approach seeks to address the root of the problem by implementing a novel strategy to perform optimal observations in a partially known environment by exploiting information coming from a 2D LiDAR and the humanoid robot’s ability to actively scan the environment with the head.

3. Methodology

In this work, we use the humanoid robot R1 (Figure 1) equipped with 2D LiDAR sensors mounted on the base and an RGB-D camera mounted on an actuated head.
As illustrated in Figure 2, the proposed navigation stack consists of the following components: the Depth image to laser scan, Laser scan fusion, the Isaac Navigation module (from NVIDIA [24]) which performs localization and obstacle avoidance, Saliency points detection, and Head orientation optimization.
The Depth image to laser scan module flattens the 3D point-cloud from the RGB-D camera into a 2D representation of the world which is similar to 2D LiDAR scans but with a complementary perception of real obstacles occupancy in the 3D world.
The Laser scan fusion module merges these synthetic laser readings with the real LiDAR data. The resulting output is then fed to the Isaac Navigation module to perform trajectory generation and obstacle avoidance.
The Saliency points detection module uses the planned robot trajectory and LiDAR scans to create a dynamic probabilistic map of potential poorly detected obstacles that require a better observation with the RGB-D camera. From this map, the most relevant points are extracted (obstacle candidates) and, along with the planned trajectory, are then fed to the optimization module (i.e., the Head orientation optimization). The latter calculates, at each time step, the optimal direction in which the robot has to look with the RGB-D camera; the optimization accounts for the future trajectory, the computed obstacle candidates points, head speed and joint limits of the robot.
Our aim is to find an optimal head trajectory that maximizes the knowledge of the environment both by gathering data on poorly detected obstacles and expanding the area observed by the sensors. The first important benefit of calculating the optimal trajectory with this method is that we consider only uncertain points and not all the obstacles detected in the environment, so the robot can concentrate the observations towards directions that are more important. Moreover, the head trajectory is calculated over a specified period of time and the optimization takes into account the future robot positions; in this way, we maximize the number of observed salient points, not only by avoiding the observation of the same points in consecutive frames but also by taking into account the robot dynamics and thus feasible head trajectories. In fact, if the robot moves fast during navigation, the head speed may not be enough to scan all the salient points in the environment. In this case, our optimization brings two advantages. First, it allows us to generate a planned head trajectory that maximizes the observed points accounting for the speed rotational limits of the head and prioritizing points that are closer to the robot and that are potentially more dangerous. Second, the optimization also expands the area observed by the sensors, because the trajectory is computed not only to observe the highest number of saliency points but also to scan areas outside the FOV of the LiDAR by rotating the head far from the robot centerline while keeping the salient point in the camera’s field of view.

3.1. Depth Image to 2D Laser Scan

The point-cloud is transformed from the camera frame reference system into the robot’s base frame; the ground plane and ceiling plane are then detected and removed from the point-cloud by applying a threshold with respect to the robot’s height. Additionally, points outside the maximum (5 m) and minimum range (0.3 m) are excluded to avoid noisy or false readings. The resultant point-cloud is then flattened along the vertical dimension; points are then expressed in polar coordinates to obtain the representation of a typical laser scan data type. To each angular coordinate (angular resolution is set to 0.5°, from 0° to 360°) is associated the corresponding radial coordinate with the lowest value (i.e., the coordinate of the closer point). The synthetic laser scan that is generated contains the projection on the ground plane of 3D obstacles that are outside the field of view of the laser, such as overhanging obstacles, e.g., tables or shelves.

3.2. Laser Scan Fusion

The laser scan fusion module merges the scans from the 2D LiDAR sensor with the synthetic scan from the point-cloud and returns an augmented laser scan in the desired reference frame. As we can see in Figure 3, the augmented laser scan is the result of the union between the two input readings; for the same angular coordinate, the laser with the smaller radial distance is taken as value. Figure 3 shows that the laser fusion extends the actual FOV of the LiDAR, when the head of the robot is oriented towards the right or the left (i.e., when the head angle is larger or smaller than ±∣ ( L i D A R F O V R G B D F O V ) / 2 ∣.

3.3. Nvidia Isaac Navigation

The navigation system is based on the Nvidia Isaac Navigation stack gem [24]; it integrates the functions of localization, global navigation and local trajectory planning. Figure 4 is a schematic representation of the Isaac Navigation stack. In purple are highlighted the components of the stack; in green and blue are shown the input data necessary for navigation; in red is the commanded output.
In the proposed approach the navigation system uses as input the robot’s odometry, the real LiDAR scans and the augmented laser scans to compute the local trajectory, the global path and the speed of the wheels. A particle filter provides localization in a similar fashion to the Montecarlo localization algorithm [25], a global planner provides the reference path according to the visibility graph algorithm [26]. To generate the local trajectory a Linear Quadratic Regulator (LQR) planner is used, based on the model of a differential drive robot.
The localization component uses the plain LiDAR scans (Figure 2). This is because the map of the environment is built using this sensor, and, with respect to the depth camera, the LiDAR is characterized by a better range and less noise. For mapping purposes, walls and other fixed furniture are thus better represented in the 2D LiDAR scan rather than the flattened scan from a RGB-D point-cloud. The augmented laser scan is instead used to generate the local occupancy map from which the commanded trajectory is then calculated. Thus, obstacle avoidance benefits from a more complete representation of the occupancy of objects in the 3D world.

3.4. RGB-D Camera Heading Direction

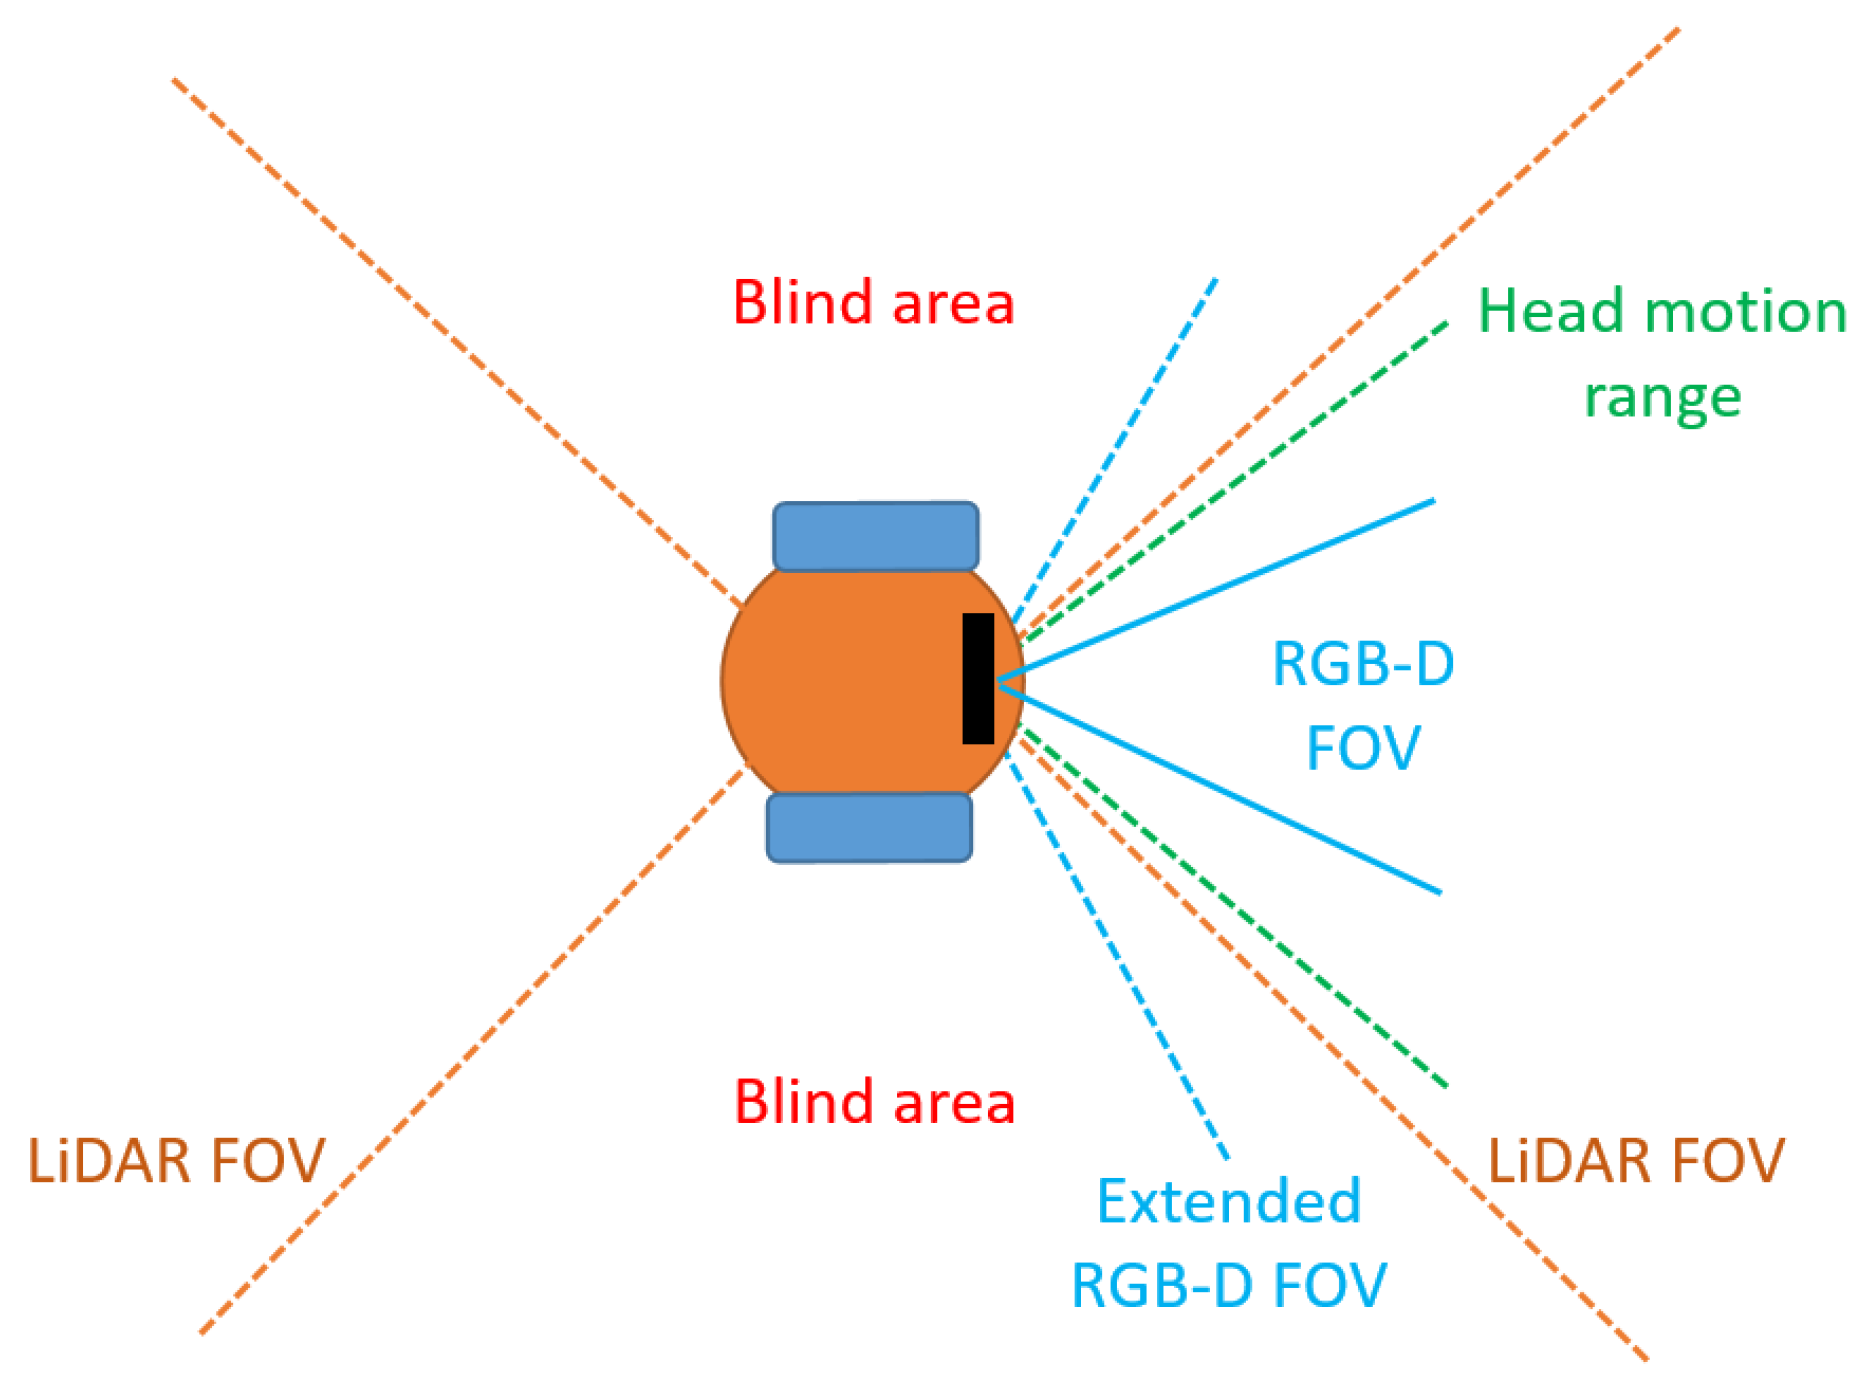
With respect to the LiDAR, the depth cameras usually have a smaller FOV. For example, in the R1 robot used in this paper (Figure 3) the front LiDAR has a FOV of 80° while the RGB-D camera has only a FOV of 70°. The augmented laser scan (that includes data from the RGB-D sensor) consequently has blind spots that are not covered by camera observations. The RGBD-D camera is mounted on the robot’s head, whose joint limits are yaw: ± 35° and pitch ± 25°. The LiDAR sensor mounted on our robot has a 360° FOV. However, due to the structure of the robot that has been built to resemble a humanoid shape, all the sensors are integrated inside the robot chassis and, as that the LiDAR is positioned inside the robot base, it has only an 80° FOV, since laser beams are blocked by the robot’s structure. As can be seen in Figure 5, the camera can thus reach visual angles of ± 65°, enough to cover and extend the LiDAR FOV. In order to provide meaningful laser augmentation scans, however, it is important to understand in which direction the robot should rotate its head. We propose three different strategies:
  • Sweep: the robot simply moves its head towards the left and right according to the joint limits and given a certain pre-defined maximum speed. This strategy is used as baseline test to evaluate effective improvements achieved with the proposed methods;
  • Trajectory: the robot anticipates the global trajectory (i.e., it looks at the intersection point between the global trajectory and a circle centered in the robot with a ±2 m radius);
  • Optimized heading (our contribution): at each time step we calculate the optimal head’s heading direction accounting for the future robot’s global trajectory, obstacle candidates points, head turning speed and joints limits of the robot.
The latter strategy is the most advanced one and it requires both the detection of the obstacle candidates points on the map and an optimization model to be solved.

3.5. Salient Point Detector

We define obstacle candidates as specific points on the map where the LiDAR has detected partial readings that may hide poorly detected obstacles (e.g., the partial reading from a thin leg of an office chair). These kinds of partial readings are often too weak to be detected as real obstacles by the path planning algorithm. Obstacle candidates points are thus characterized as follows:
  • The corresponding LiDAR reading must be uncertain and weak;
  • The detected point must be local and must not belong to the global map (i.e., it has to be far from walls and other fixed obstacles).
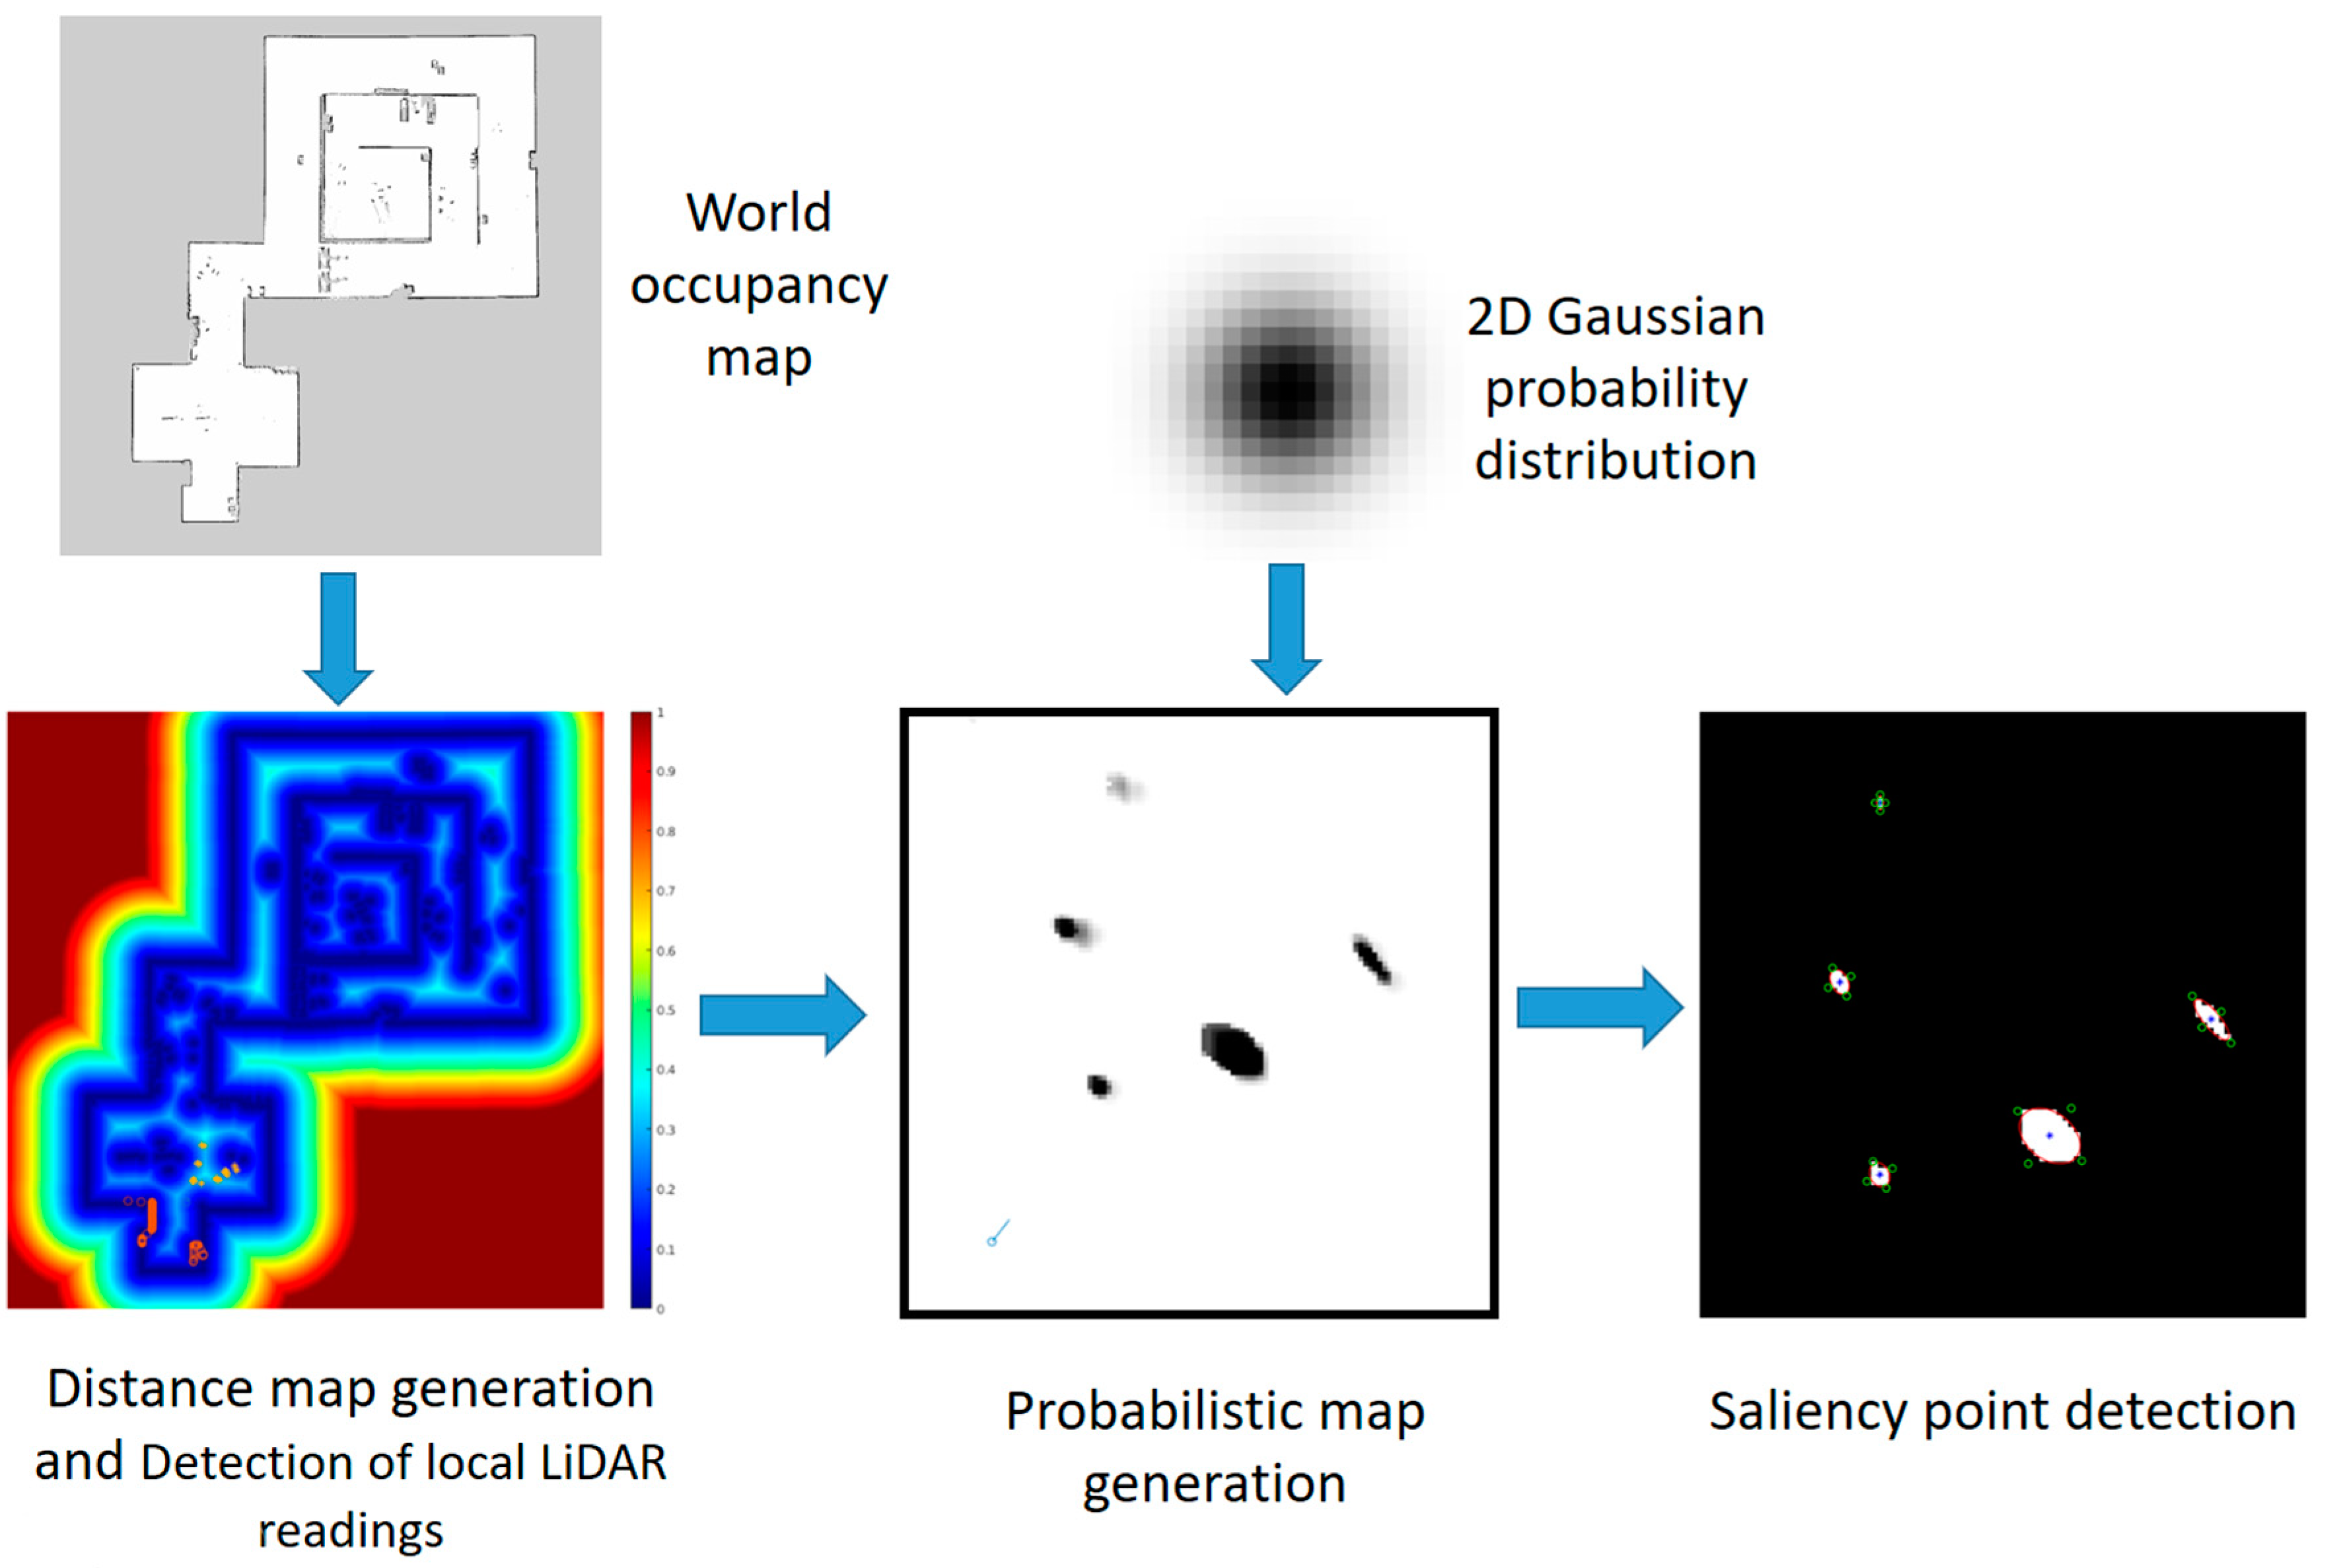
As shown in Figure 6, the proposed obstacle candidate point detector system contains several steps:
Distance map generation: Starting from the global map (in binary representation), we compute the Euclidean distance transform of the image.
At each pixel of the image is assigned a value representative of the distance between that pixel and the nearest nonzero pixel. The Matlab function bwdist [27] is used for this computation as it implements the fast algorithm [28] that is approximately four times faster than simply obtaining the Euclidean distance transform from the square root of each element.
Detection of uncertainty points not belonging to the global map: Since the global path planner already takes into account the obstacles in the global occupancy gridmap, we are only interested in looking at salient points that are not included in the global map but that are only detected in real time. Local obstacles differ from the global map for two main reasons. First, the local map is generated with real time LiDAR readings and thus takes into account new or re-located obstacles in the environment. Second, the global map is often edited in post-processing to correct possible mapping errors or to open missing passages (e.g., a door that was closed during mapping).
Laser scans are superimposed to the generated distance map by applying the frame transform between the robot’s base link and the map origin (provided by the localization module). Then, for each scan ray we consider the corresponding value of the distance map, converted into meters. Local laser points are then identified by selecting those readings that have a distance greater than a minimum threshold, so to discard points that are already part of the global map. Since we use the position of the robot to superimpose laser scans to the map, we make the assumption that the robot is well localized into the map. In cases of high localization uncertainty the threshold can be increased to compensate for false positives. In our experiment, we used a threshold of 0.15   m as it was found to work well in practice.
Probabilistic map generation: Local laser scans are used to generate a dynamic probabilistic map of possible poorly detected obstacles. Uncertainty of obstacles from laser readings is based on the assumption that small obstacles or reflective surfaces are only partially detected by the LiDAR and with a high level of noise that degrades the measurement consistency in space and time. In order to detect inconsistencies in space and time, laser readings are projected onto a probabilistic map that is generated adding a Gaussian distribution of probability for each laser reading. The occupancy probability in the areas surrounding local points is increased at each time step according to a symmetric 2D Gaussian distribution, while it is reduced for all the other areas in the FOV of the LiDAR. At each time step, the local laser readings are superimposed onto the probabilistic map and the probability values for each cell corresponding to x and y values in the real world are updated according to this equation:
s e t o f x a n d y : D i s t = min x c , y c ( ( x x c ) 2 + ( y y c ) 2 ) i f D i s t m a x D i s t : p r o b ( x , y , t ) = p r o b ( x , y , t 1 ) + I R × Δ T × e ( x x c ) 2 + ( y y c ) 2 2 σ e l s e : p r o b ( x , y , t ) = p r o b ( x , y , t 1 ) D R × Δ T
p r o b ( x , y , t ) represents the value of the occupancy probability at time t for each point ( x , y ) (expressed in meters) in the map. The Gaussian distribution is centered in the coordinates of the local laser reading ( x c , y c ) and extends with a normalized σ 2 = 0.5 over a circular area of m a x D i s t = 0.4   m . In our experiments, we used a time step of Δ T = 0.2   s , the probability increase rate I R was set to 1.2   m / s at the center of the Gaussian distribution and the probability decrease rate D R was set to 0.8   m / s for each point farther than m a x D i s t from the local point. By changing these parameters, the probabilistic map responsiveness and sensitivity can be adjusted. These parameters were manually set and experimentally validated. Notice that several of these parameters are independent of the environment in which the robot operates and are general enough. In fact, simulation and real-world experimental results are obtained with the same parameter values.
In this way, we include spatial and temporal inconsistencies of the laser in our model. For example, a small obstacle that is not detected consistently in time will be marked on the probabilistic map as areas where the obstacle position and dimensions are uncertain.
Obstacle candidates points computation: From the probabilistic map we can infer all the local areas that have uncertainty or weak obstacles detection. These “candidate areas” are characterized by probability values in the map that are between 0.1 and 0.85. High probability values are not considered because we already know with high confidence that an obstacle has been detected; the same reasoning is made for low probability values where we know with high confidence that no obstacles are present. Candidate areas are then inscribed into an ellipse that is synthetically described by four points corresponding to its corners. These are the obstacle candidates points. Each obstacle candidate is associated with a weight W that is computed from the probability of the point itself and its eight adjacent pixels:
W i = 1 9 1 | p i 0.5 | 9
This equation assigns the highest normalized weight to points that have the most uncertain probability distribution ( p = 0.5 ); where i is the index of the 10 pixels and p i is the associated probability.
This process is conceptually similar to subtracting the global costmap from the local costmap generated by the navigation stack; there are, however, two big differences: (1) A simple subtraction of the common global costmap and local costmap would not produce the same result since we are building a probabilistic map with only the meaningful laser readings as the ones related to nonrepresentative obstacles already detected in the global costmap are discarded. (2) We consider only some points that are representative of an uncertainty; the weight of these points is then calculated over its surroundings. This allows a meaningful representation of the map with a small number of points that can thus enter into the optimization without increasing the problem complexity too much.

3.6. Head Orientation Optimization

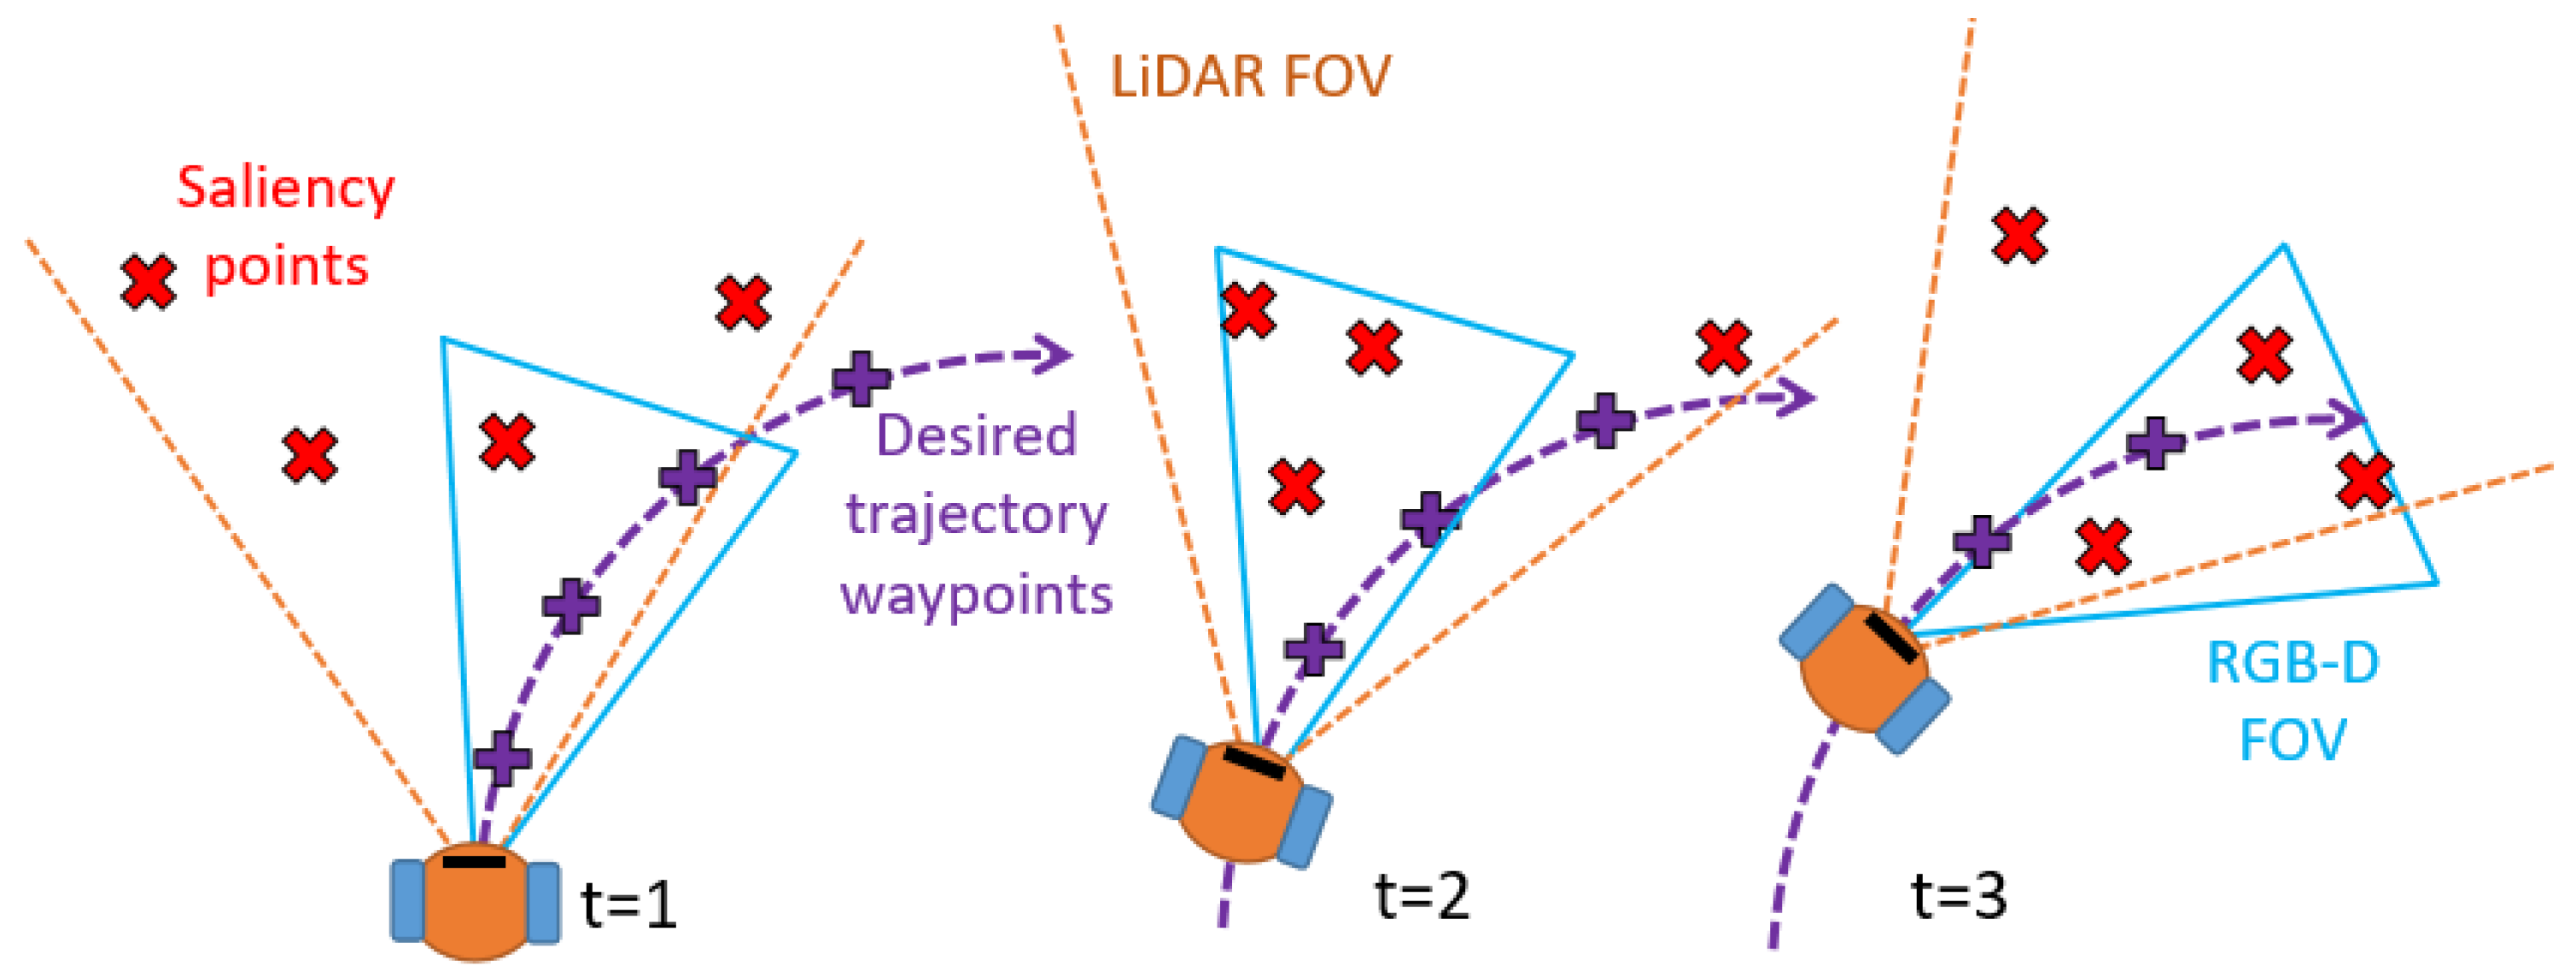
The objective of the optimization is to calculate the trajectory of the head that maximizes the sum of the weights of the relevant points (trajectory way-points and obstacle candidates points) that enters into the camera’s FOV (Figure 7).
We frame the problem as a Mixed Integer Linear Programming (MILP) problem, in which the cost function is linear, the head position in time is described with a continuous variable and we use an integer variable to describe the binary exclusion/inclusion of the obstacle candidates and trajectory points in the FOV. The different components of the model are state variables, head joint constraint, head motion speed constraint, relevant point in FOV constraint and the objective function. This problem is solved over T future time steps. Formally,
x = min x c T x subject to A x k x [ h ¯ , b ¯ ] h ¯ R p , b ¯ { 0 , 1 } q
The components of x are the variables to be determined, h ¯ is the subset of real variables of dimension p, while b ¯ is the subset of binary variables of dimension q. Matrix A and vector k linearly describe the constraints in Equations (4)–(6) and C1–4. Vector c T contains the polynomial coefficients of Equation (7).
State variables: At each time step t the state vector x is composed by one value h t in R that represents the head direction in degrees and by a number N t of binary variables b i , t representing the i relevant point at time t. N t is the total number of relevant points detected at the time instant t.
x [ h t , , h T , b 1 , t , , b N t , t , , b 1 , T , , b N T , T ]
Head joint constraint: At each time step t the head position h t is bounded between the maximum and minimum values of head rotation, h m i n and h m a x limits depends from the physical characteristics of the robot:
h m i n h t h m a x
Head motion speed constraint: At each time step t the variation in the head position can not exceed the maximum rotational speed h ˙ m a x :
h t h t 1 Δ T h ˙ m a x
Relevant point in FOV constraint: A relevant point i at time t with a relative heading θ i , t calculated with respect to the robot is in the FOV of the camera only when:
h t f o v 2 θ i , t h t + f o v 2
where f o v is the FOV of the RGB-D camera, equal to 70° in our case. However, this is not simultaneously possible for all the points i, but by using the binary variable b 1 , t we can rewrite the constraint as:
h t < + f o v 2 + θ i , t + ( 1 b i , t ) · M h t > f o v 2 + θ i , t + ( 1 b i , t ) · M
where M is any number larger than h m a x + f o v + 2 π . If M is large enough and the binary variable is set to 0 the constraints in Equation (6) are always true for any values of h t and θ i , t . With this formulation, b i , t = 1 for all the points that are inside the camera’s FOV and b i , t = 0 for all the others. This constraint reformulation is necessary to represent the nonlinear constraint of inclusion/exclusion, a similar formulation and proposed modifications of this approach can be found in [29].
Objective function: The objective function is expressed as follows:
f m i n ( t T i N t b i , t w i , t t 2 · d i , t + t T | h t | · r t )
where w i , t is the weight of the point i at time t, d i , t is the distance between the point i and the robot at time t and r t is the weight given to the head motion with respect to its rest position 0. N t is the total number of relevant points detected at the time instant t and T is the total number of time steps taken into consideration. The first addendum of Equation (7) represents the contribution of those points detected by the camera since b i , t = 1 only in that case; the contribution is reduced linearly with the distance of the point from the robot, i.e., closer points are more important) and in a quadratic proportion with respect to time (i.e., less importance is given to points that will be detected by the camera more frequently in the future). The second part of Equation (7) accounts for the head motion with respect to its rest position. This is because when the head is rotated over a certain degree the camera is directed towards points that are outside the LiDAR FOV. The value of r t is, however, small to keep this contribution secondary. The maximization of the absolute value is linearized with the addition of four constraints, a binary (i.e., b t ) and a continuous (i.e., h ^ t ) slack variable:
h t + M · b t h ^ t ( C 1 ) h t + M · ( 1 b t ) h ^ t ( C 2 ) h t h ^ t ( C 3 ) h t h ^ t ( C 4 ) f m i n = ( t T i N t b i , t w i , t t 2 · d i , t + t T h ^ t · r t ) ( E q u a t i o n ( 7 ) )
To solve the MILP problem we used the open-source GLPK library [30].

4. Evaluation

In this section, we evaluate the proposed method on a humanoid robot (i.e., R1, Figure 1) both in a simulation (with R1 simulated in Gazebo) and in the real world. The robot (schematized in Figure 5) is equipped with a front LiDAR (FOV of 80°), a back LiDAR (rpLidar A2M6 with a FOV of 120°) and an Intel Real-sense D415 RGB-D camera (FOV of 70°). The RGB-D camera is mounted on the R1 head whose joint limits are yaw: ± 35° and pitch ± 25°. LiDAR scans are parallel to the floor with an height of 0.20 m and the robot moves at a maximum speed of 0.25 m/s−1. The choice to equip our robot with a simple 2D rpLidar A2M6 is twofold: it allows—in contrast to 3D LiDARS—us to save money and space. The size of the sensor is of particular importance in the case of anthropomorphic robots, as it allows the LiDAR be hidden internally in the robot’s chassis. It is worth considering that readings similar to 3D LiDARs can also be obtained with cheap solutions, for example, by rotating a 2D sensor on its pitch axis in order to reconstruct a 3D image of the surrounding as is carried out for example in [31]. The problem in this case is that obtaining the 3D scan takes a non-negligible amount of time and it requires additional hardware. In addition, implementing a LiDAR rotation system for a robot would require effort and redesign, with consequent higher cost and space requirements. Another limitation is due to the environment scan rate which is strongly reduced as the time for a complete scan is inversely proportional to the number of segments in which we divide the (vertical) rotation angle of the sensor. This may decrease performances when the same sensor is used both for obstacle avoidance and localization because a fast scan rate in the horizontal direction is required for a proper localization. In any case, we decided to compare the use of similar hardware against our method.
The method proposed in this paper was experimentally validated both in simulations and in the real world with challenging conditions, i.e., by including a set of obstacles that are rarely properly detected by the LiDAR either because they are too small or outside the field of view. Both the situations are addressed by the proposed method. This is because in the first case we consider these obstacles as salient points, whereas in the second case the head trajectory resulting from the optimization will direct the camera towards points that are outside the FOV of the LiDAR.
Simulated and real-world scenarios have been devised to better distinguish the performance achieved by two baseline methods and the strategy proposed in this paper (Section 3.4). In addition, in the simulated scenario, we also tested the hypothetical use of a 3D LiDAR reconstructed from a 2D rotating sensor; the simulated sensor has the same FOV of the 2D laser constrained to 80° by the occlusion of the robot geometry but it can now produce 3D occupancy maps of the environment.

4.1. Tests in Simulation

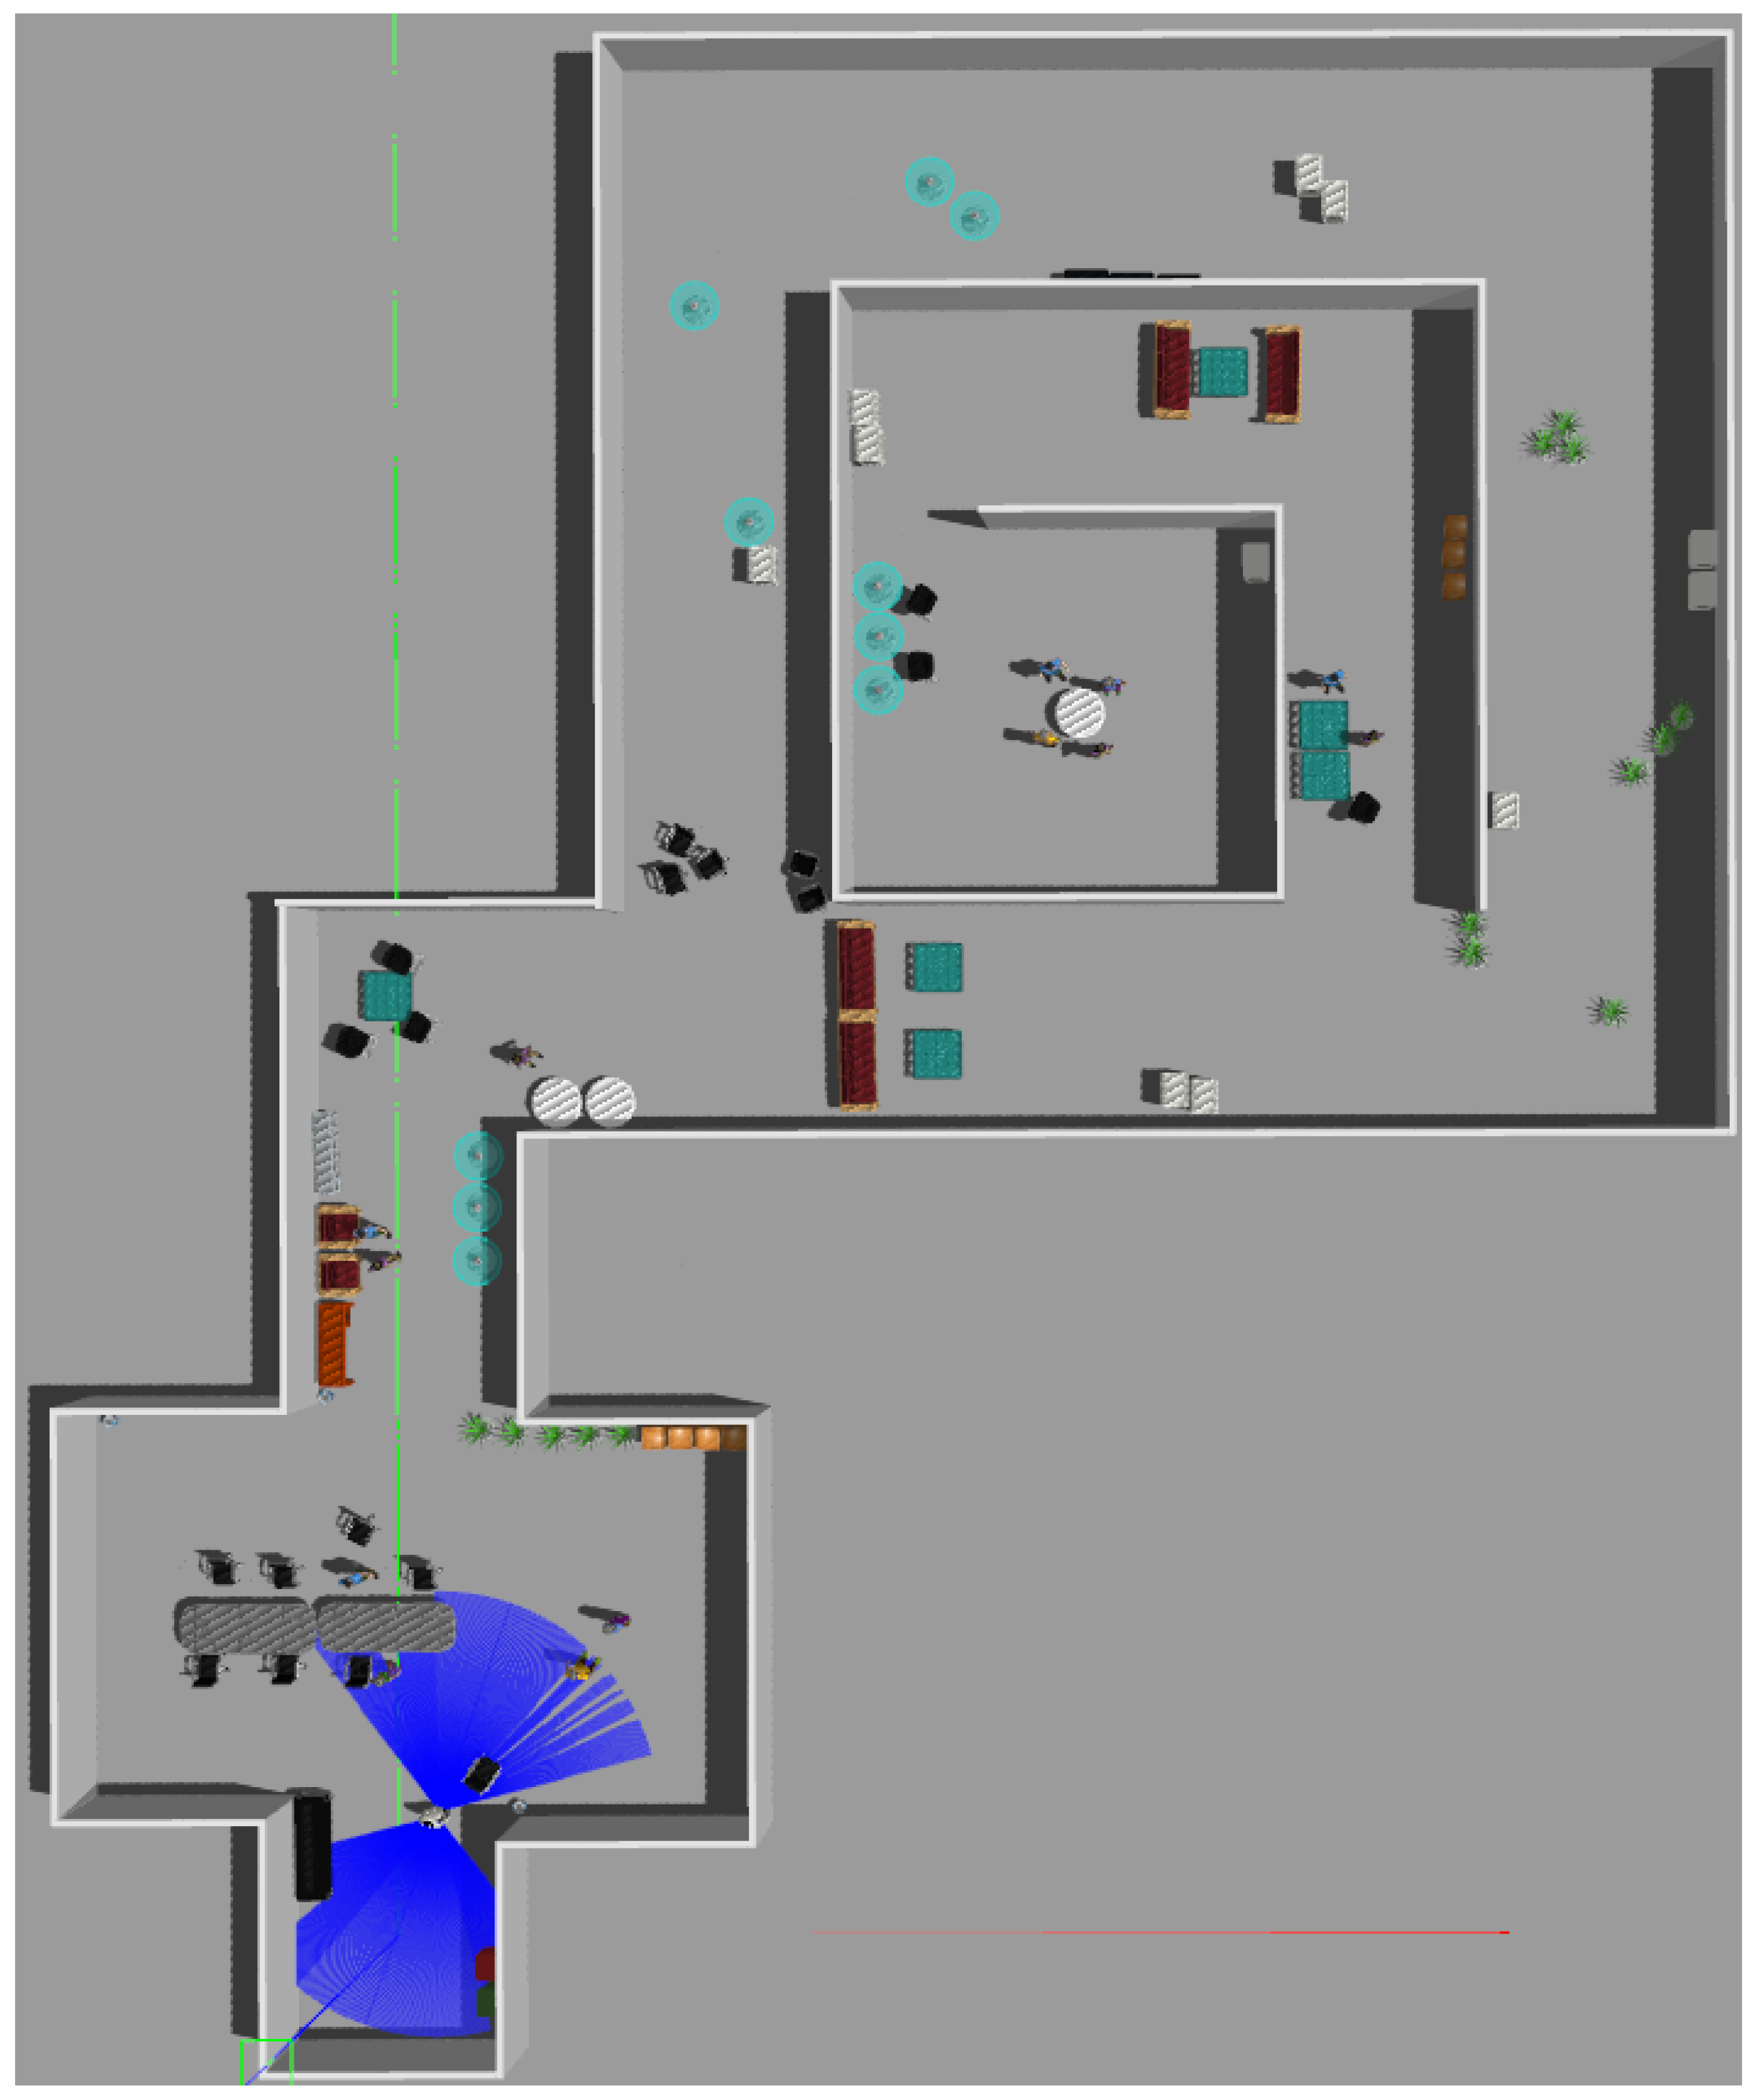
As can be seen in Figure 8, the simulated world represents a real environment and it is characterized by common indoors obstacles that are often not detected by a 2D LiDAR. Examples are small tables and chairs legs, metal objects, reflective surfaces and semi-transparent objects. To demonstrate its real effectiveness, the optimized observations is compared against two simpler methods sweep and trajectory described above.
We use Gazebo [32] to simulate the R1 robot and the environment that contains furniture (taken from [33]). We evaluated the three different strategies over a dataset of 50 navigation tests each. For each navigation test (see Figure 9 as reference), the robot was initialized at the point called “start” and was commanded to reach the goal position “end”. In addition, we recorded all points in which the robot touched an obstacle or got stuck.
In Figure 9, we plot a representative trajectory followed by the robot during the navigation and we report failure points with crosses (aggregating data from all methodologies), marking with capital letters all the areas in the map in which failure occurred. Comparing this map with the Gazebo world in Figure 8, it is evident how these zones are in correspondence with the obstacles that are the most difficult to detect.
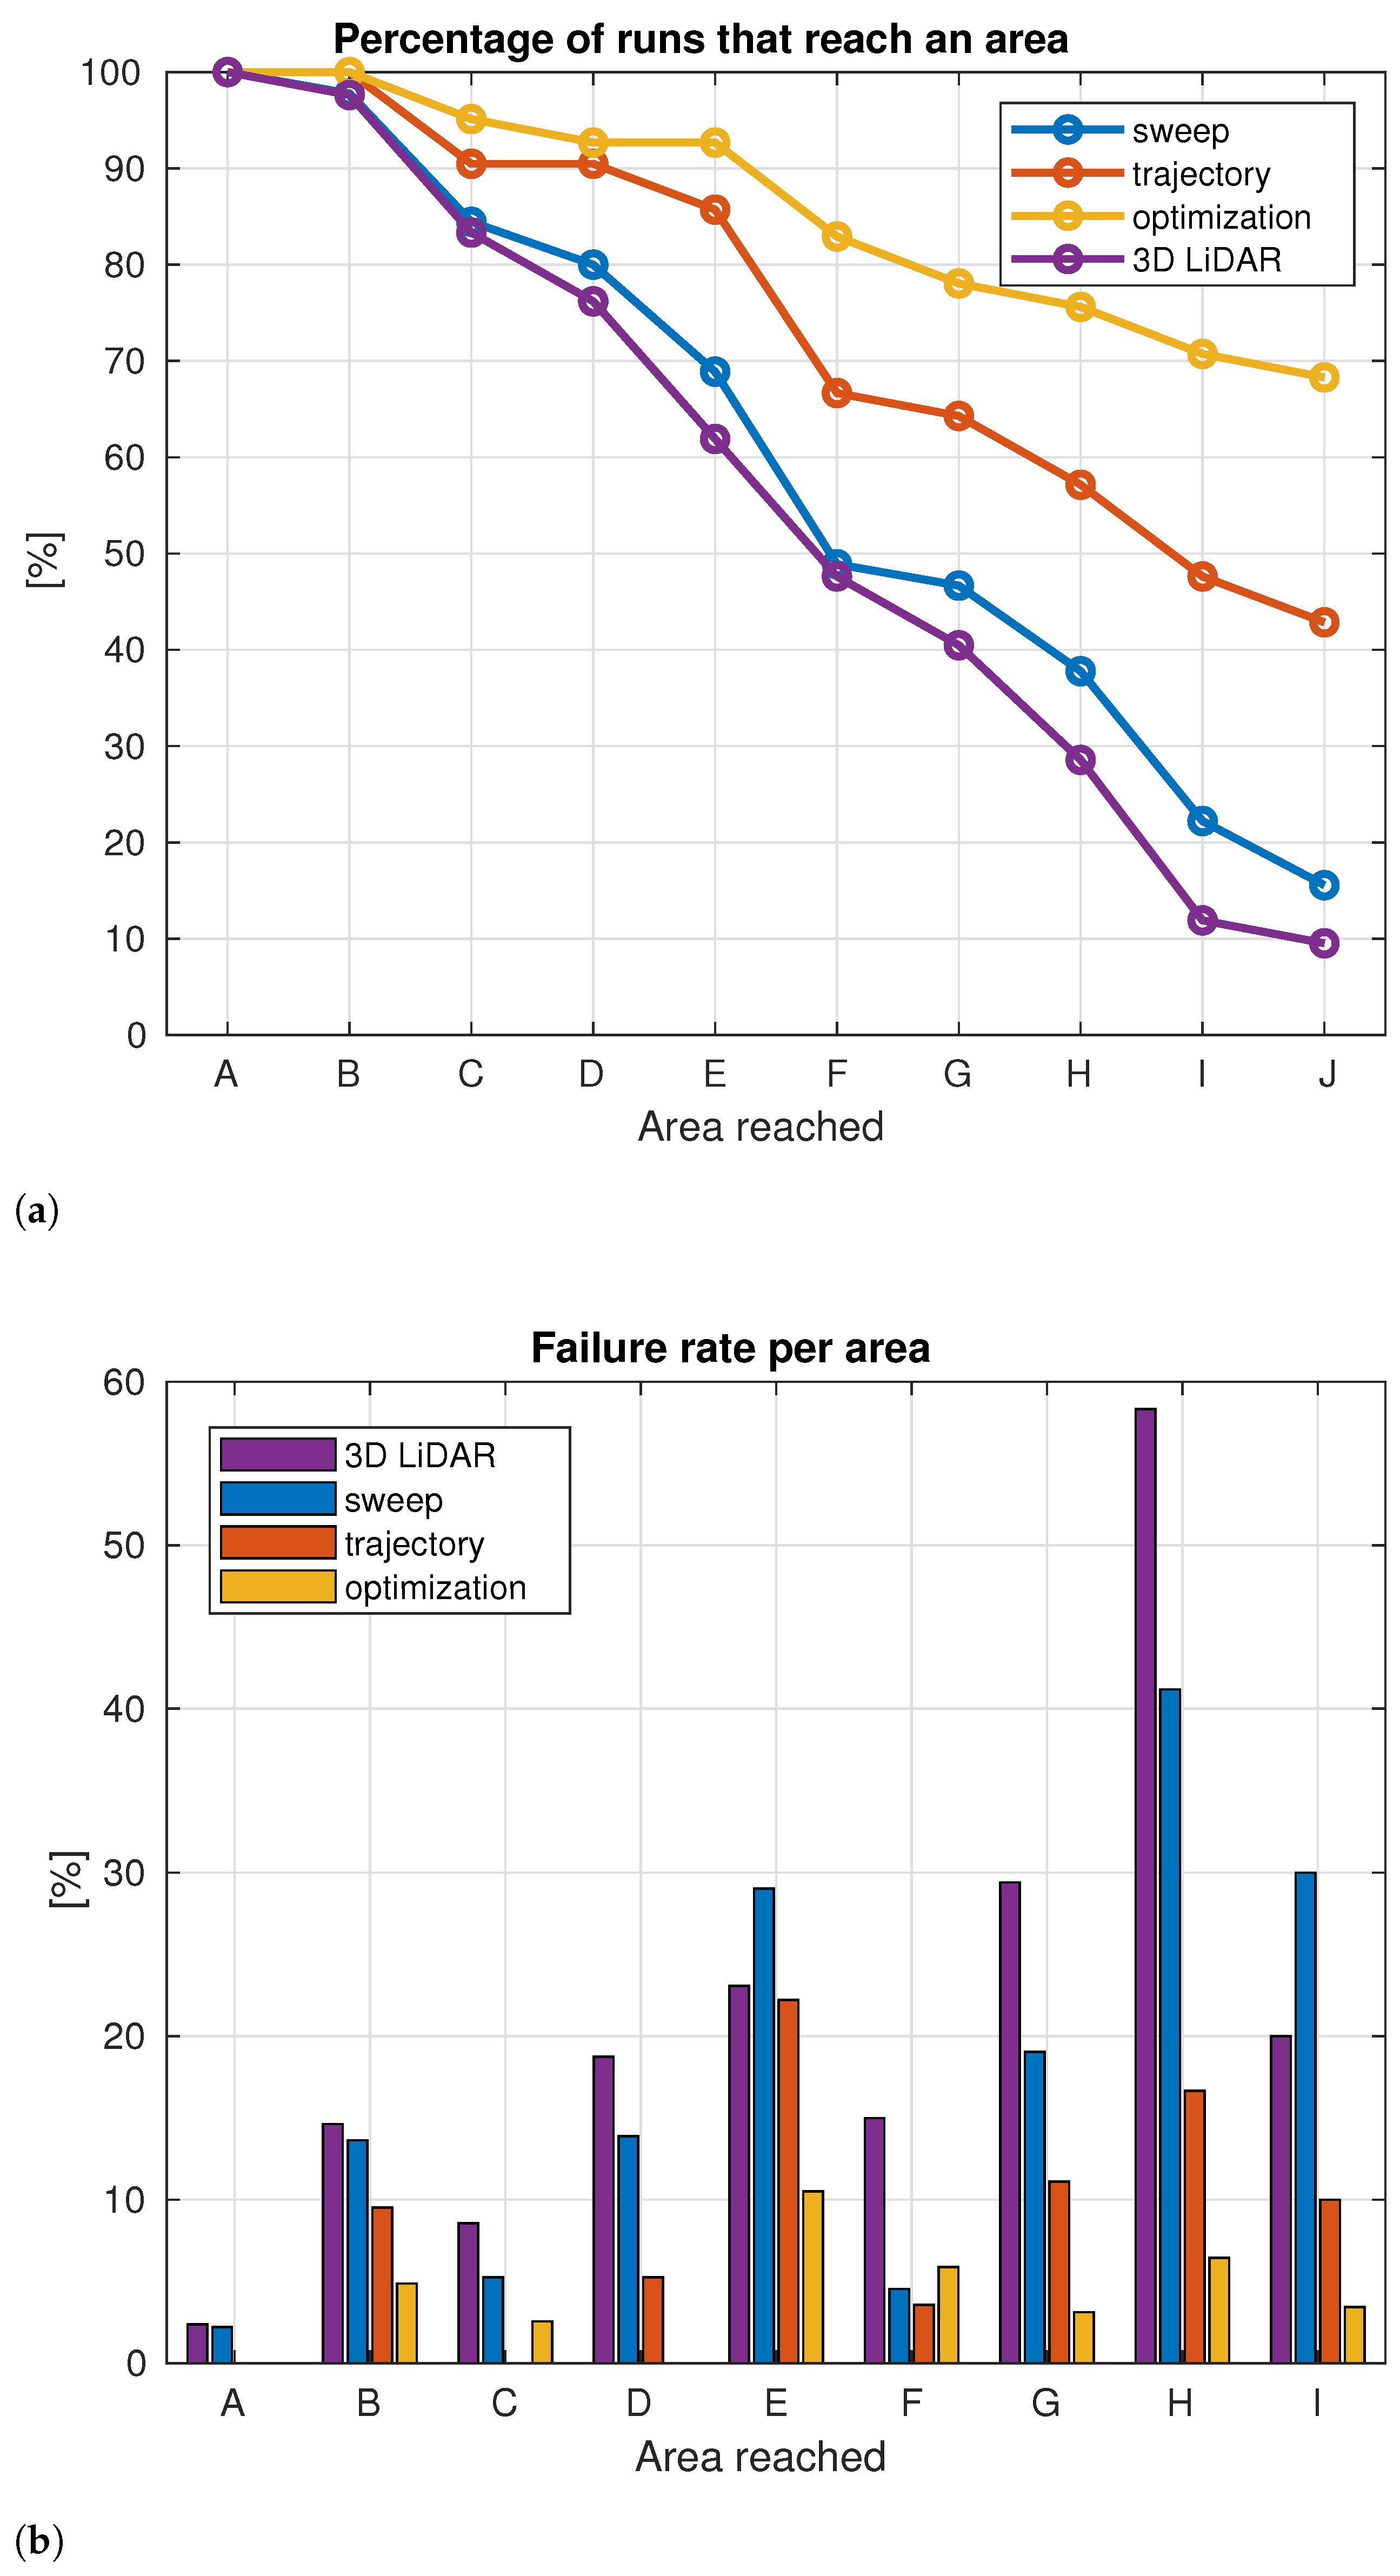
Figure 10 synthetically represents the performances of the proposed method compared to the other strategies. Figure 10a indicates the number, expressed as percentage over the total simulations, of navigation tests in which the robot reached (or passed through) a determined failure area. Figure 10b reports instead the failure rate for each individual area. We can see that when following the proposed approach the robot performed better obstacle avoidance and it reached the final goal (area J) significantly more frequently (55% and 30%) than the two considered baselines (sweep and trajectory).
When using the 3D LiDAR, instead, we can see that the robot performed similarly to the sweep strategy. This is coherent with the fact that the sweep strategy aims at increasing the small FOV of the RGBD camera while the simulated 3D LiDAR has a slightly bigger FOV with respect to the fixed camera ( 80° vs. 80°).
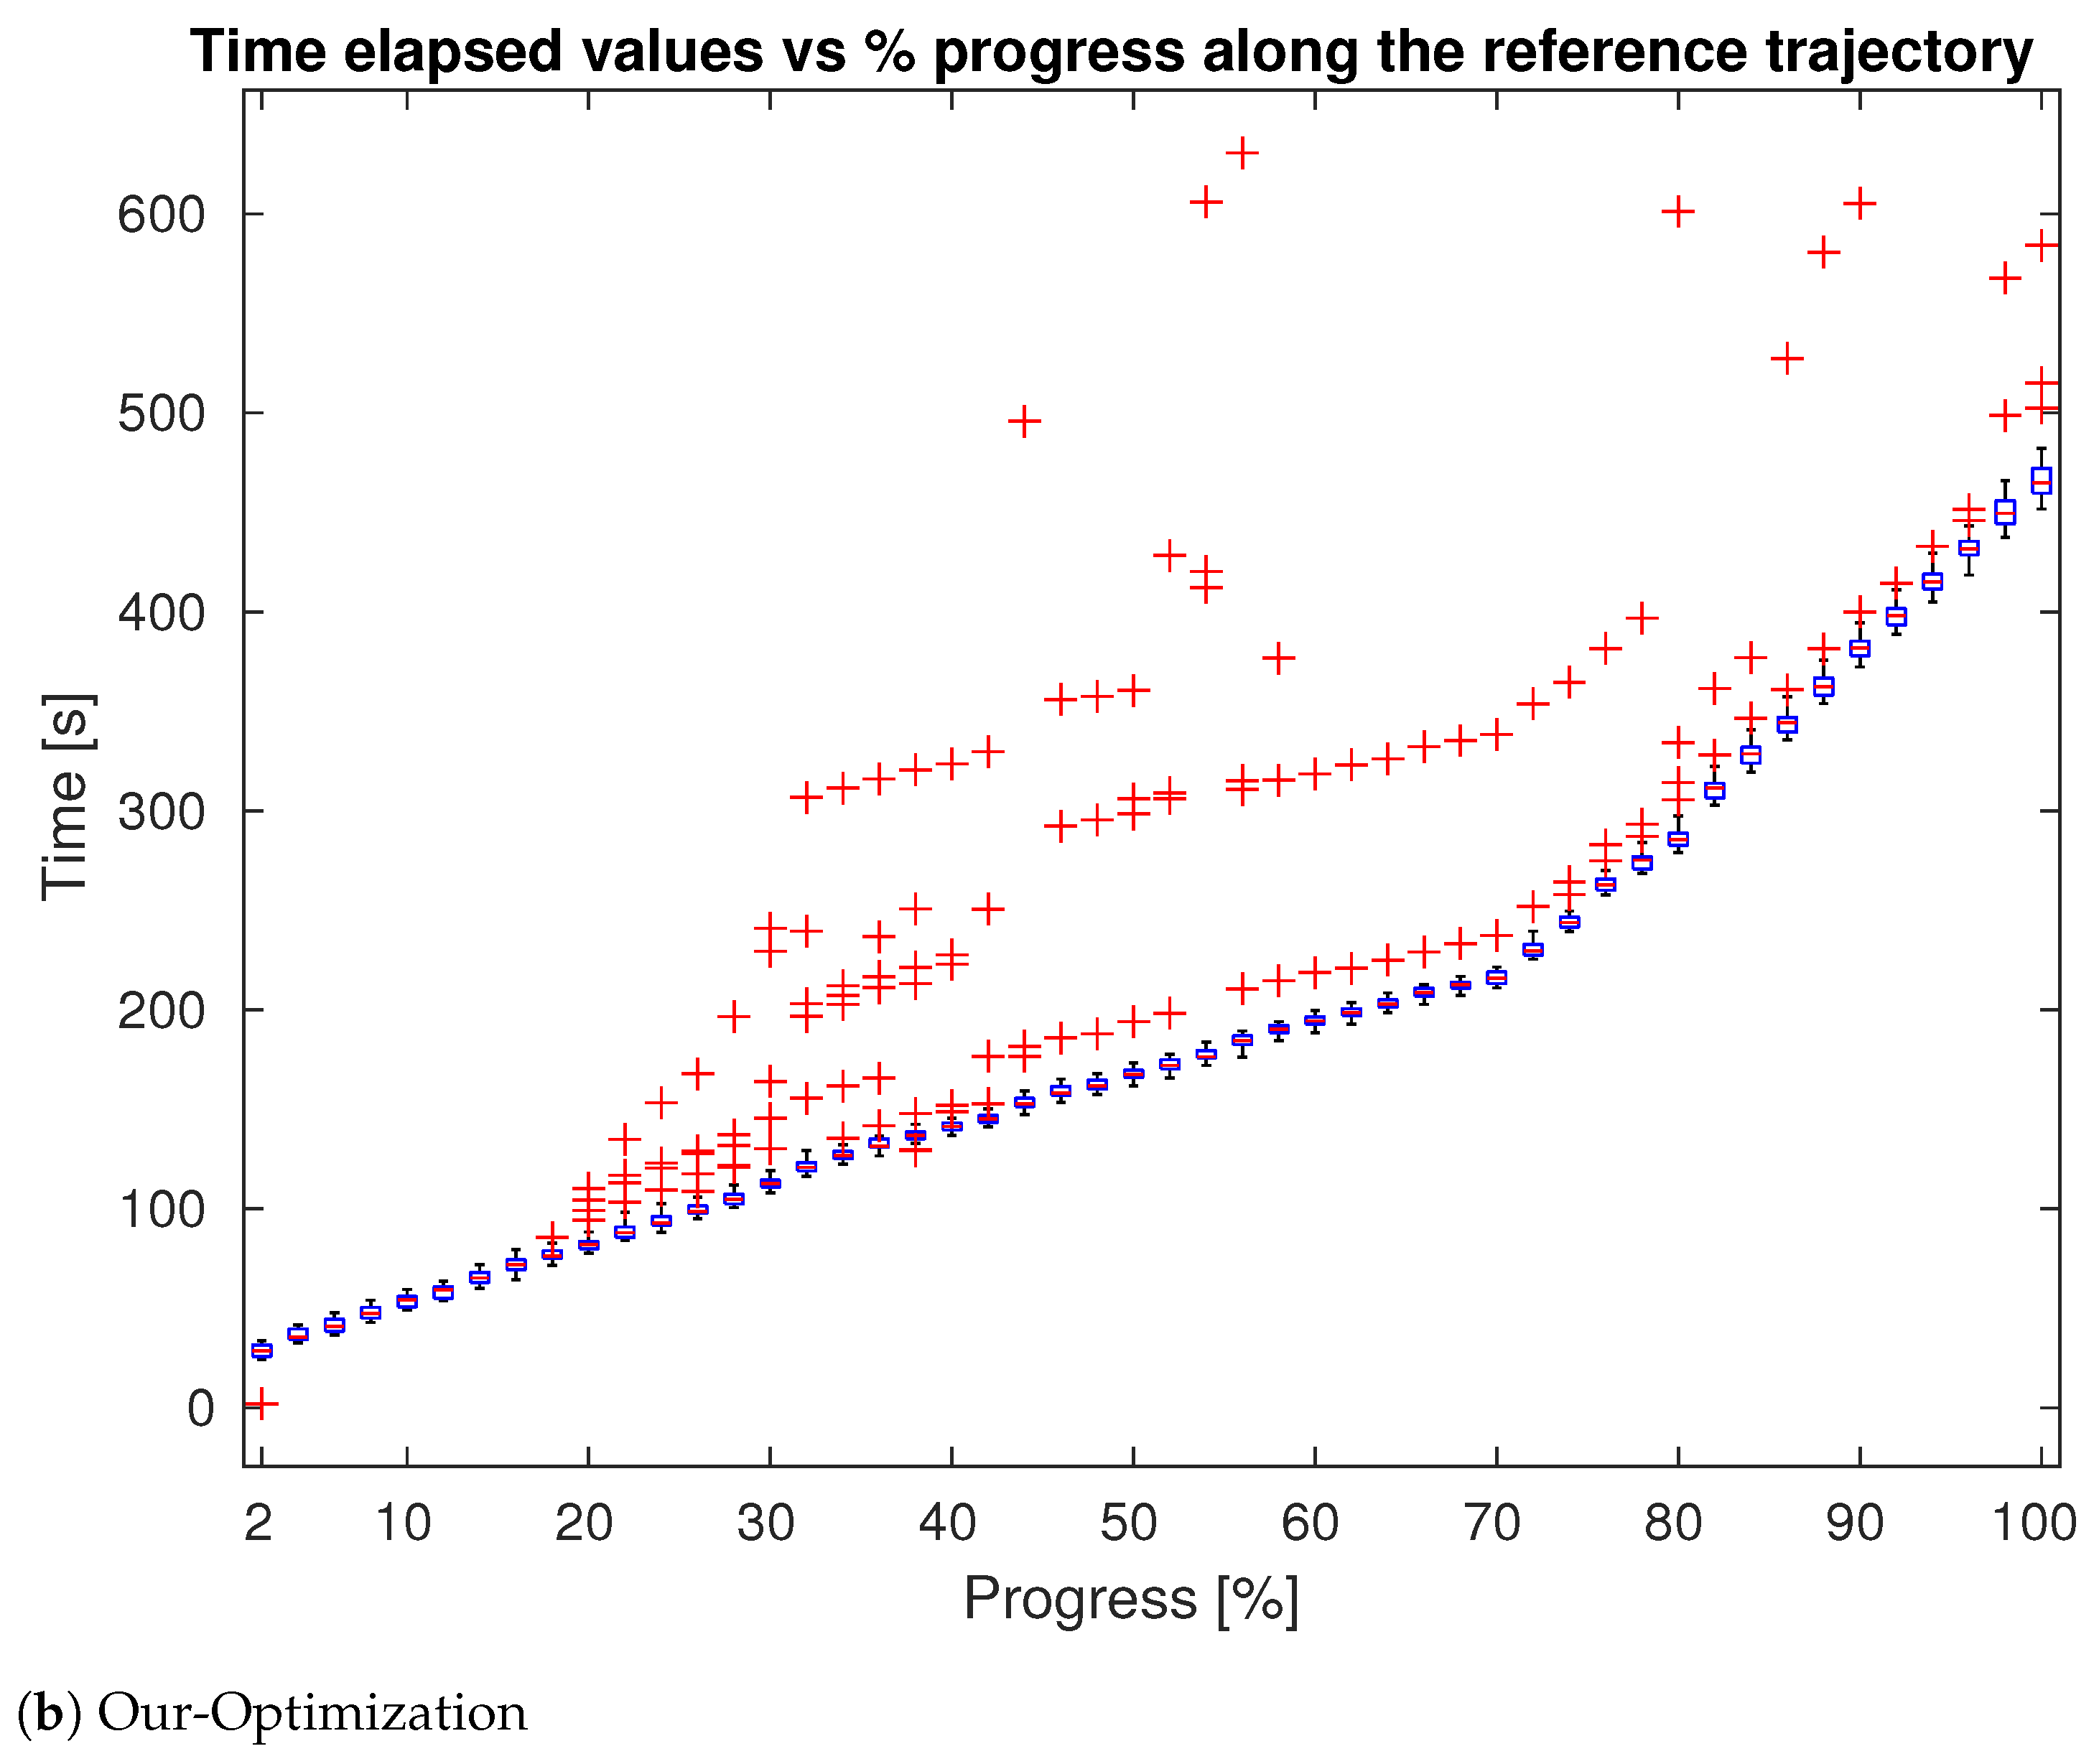
We also evaluated the speed of the navigation, with respect to the optimal global trajectory generated by the Isaac global planner. To this aim, for each trial, we recorded the time required by the robot to reach a given point along the optimal trajectory. The results are plotted in Figure 11, in which for different percentages of progress along the x axis, we report a series of box-plots that represents the time stamp distribution at which the robot reached the related progress. Box-plots were built only using time stamps relative to navigation tests in which the robot had effectively reached the associated progress and no penalties were introduced in case the robot failed to reach a determined progress. The average value of the box-plots was calculated excluding outliers, identified as a value that was more than 1.5 times the interquartile range away from the top or bottom of the box. These outliers (in red) represent “delay points”, in which the robot got stuck for several seconds before resuming the navigation. These points leave a tail of lagging time measures along the whole path. This effect can be clearly seen in Figure 11b, where delay points originate at specific points of the trajectory and maintain a constant offset from the mean value. The average time to reach a determined point in the trajectory is thus similar for the two approaches since in case of a correct navigation the differences in the trajectories are minimal and they do not bring substantial time savings. The main difference, however, is in the number of outliers, i.e., the distribution of the delay points in terms of quantity, dispersion, and absolute values. Figure 11 and Table 1 show that our method performed better in all the three metrics. From Table 1, in particular, we notice that the proposed method had a smaller number of delay points; these values were generated when the robot got stuck during the navigation for a certain period of time. The average value of the outliers is an indicator of this time period. As reported in Table 1, the proposed methodologies significantly reduced the number of delay points and the average delay that each point introduced in the trajectory.

4.2. Test in Real World

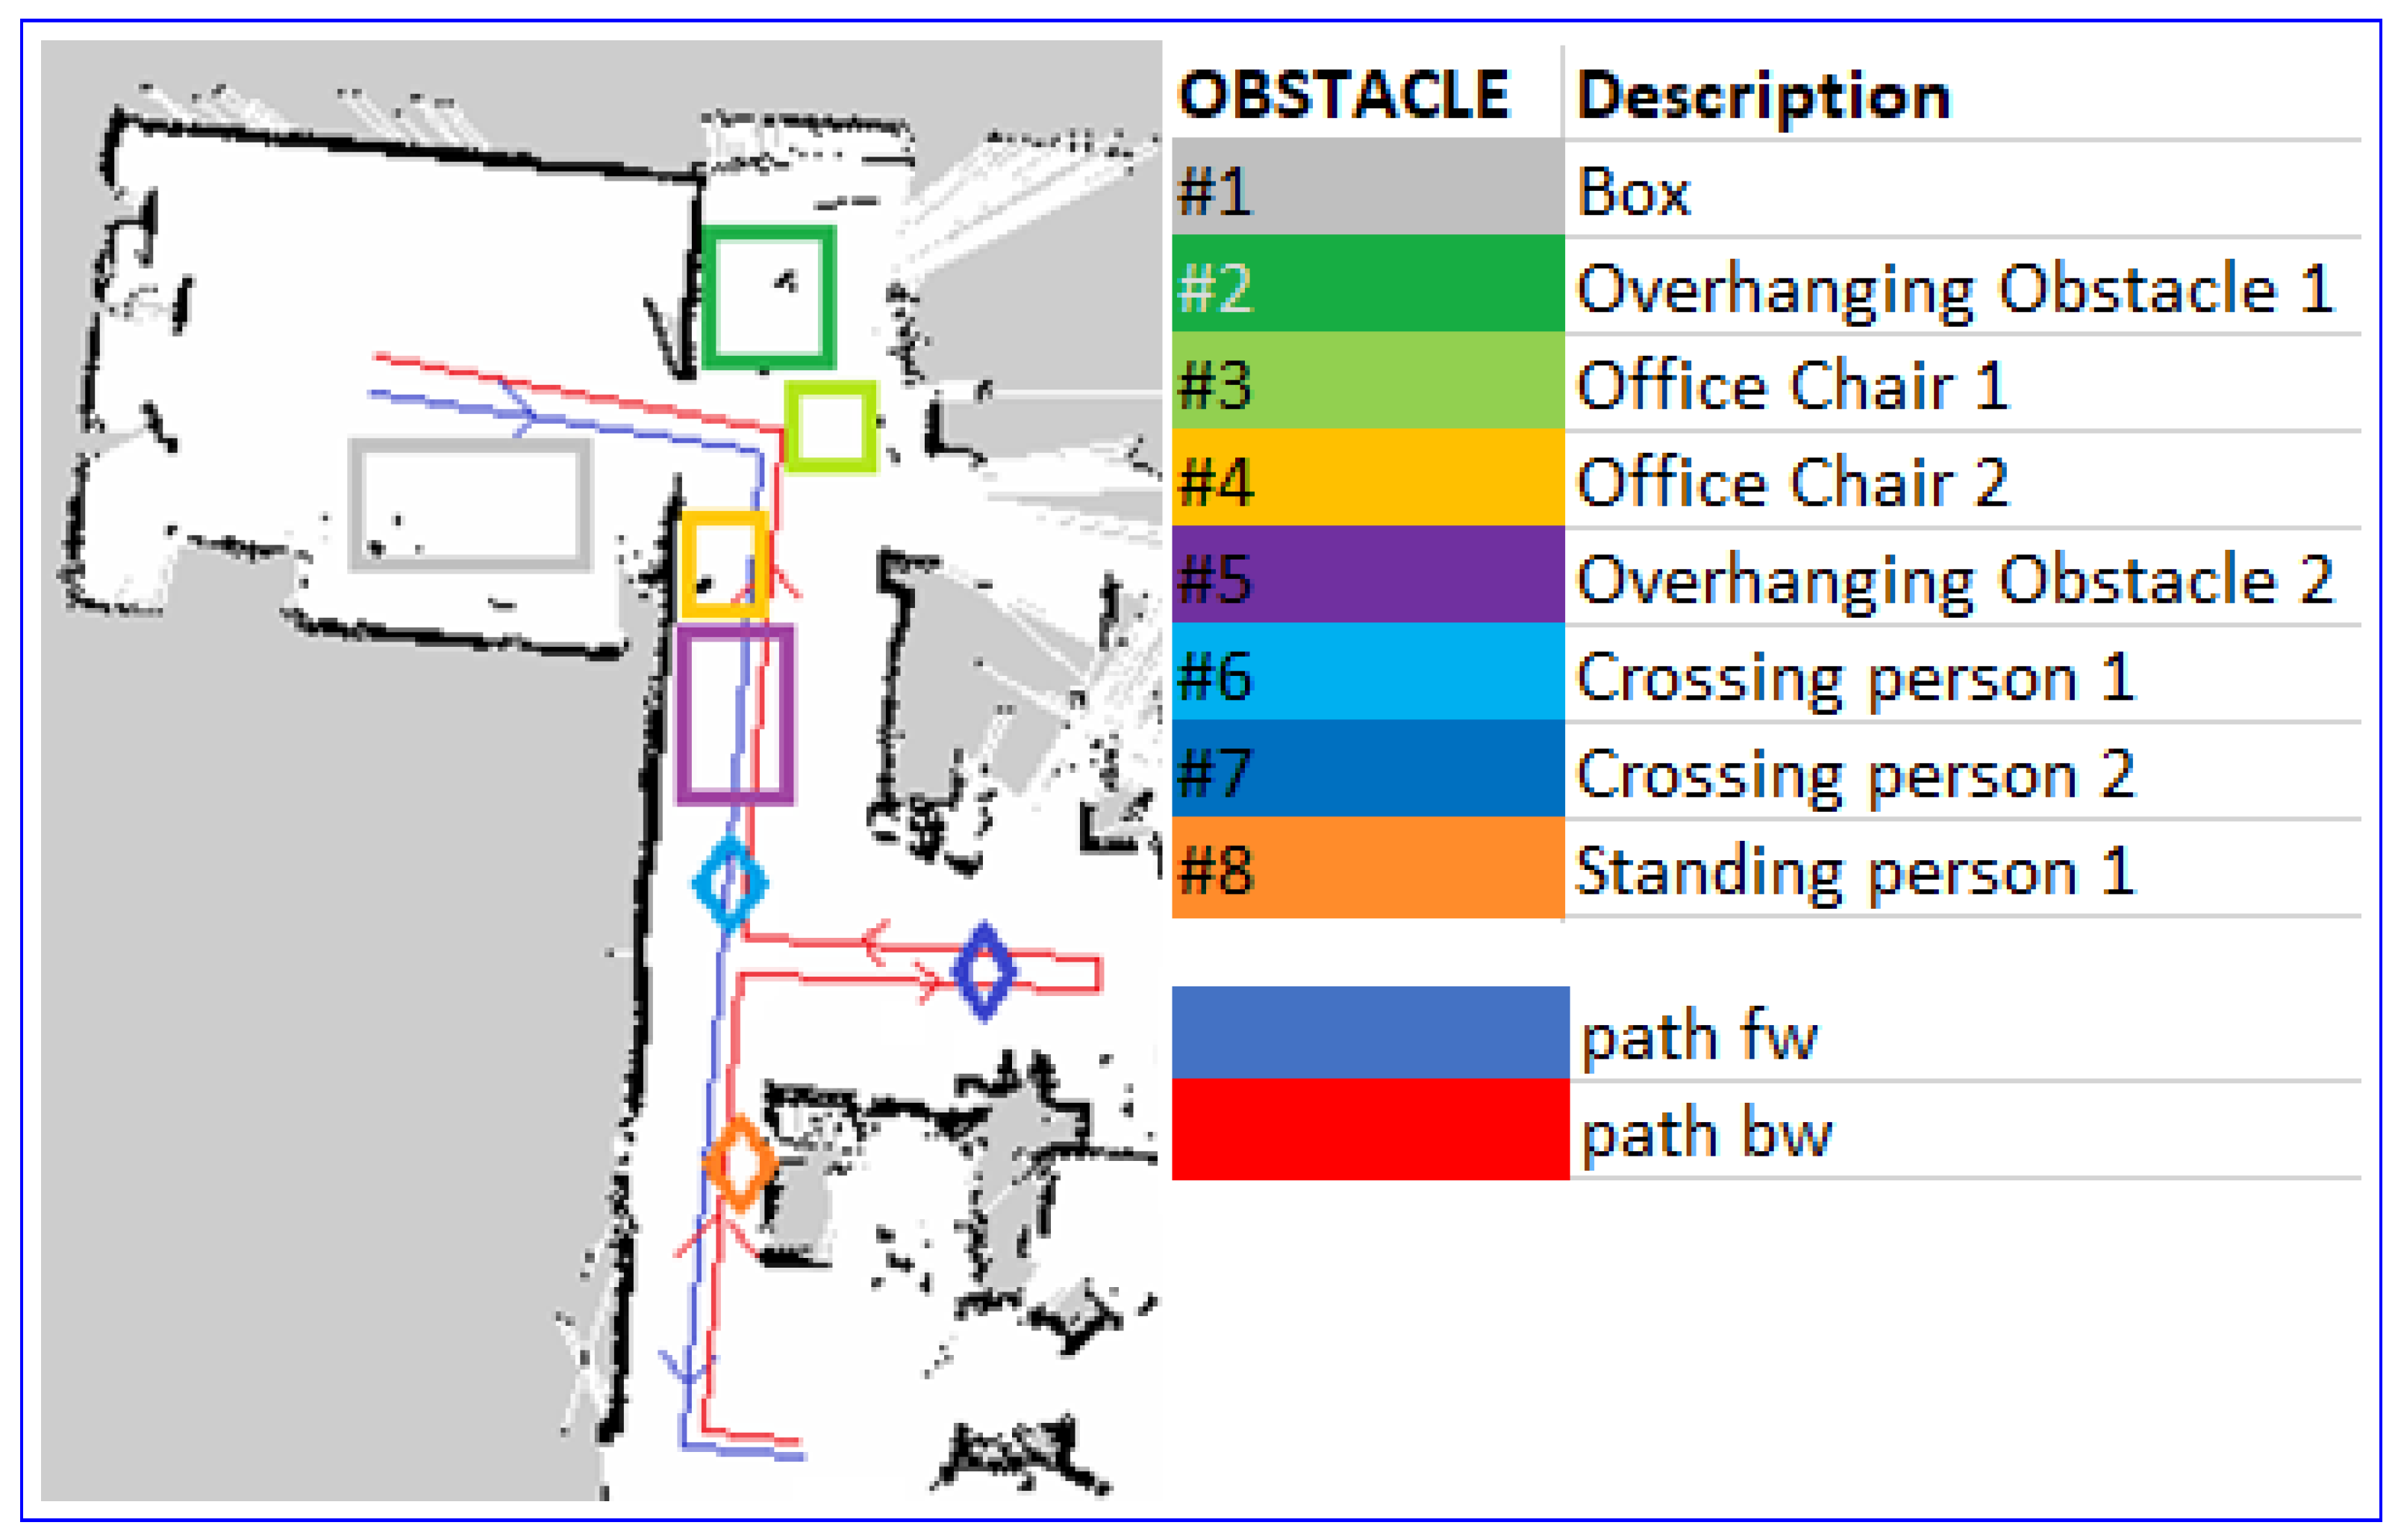
To further validate our approach, we performed experiments on the R1 robot navigating in a common office environment characterized by a mix of obstacles that are difficult to be detected by the LiDAR alone (e.g., office chairs, walking or standing people, overhanging obstacles). The map of the environment and the location of the obstacles are represented in Figure 12.
To test our method in real world we compared it against three different strategies: no head motion, sweep, and trajectory. For each of these cases, we commanded the robot to move from position A to position B along the forward and backward paths described in Figure 12 for 10 times. Similarly to the tests in the simulation, the navigation was interrupted each time the robot collided against an obstacle, and a failure was recorded. However, after each collision, the navigation was resumed to avoid a complete restart. The robot was then moved to a new safe position nearby the failure point and allowed to continue along its path. This simplified procedure allowed us to avoid time consuming manual interventions to reset the robot and bring it back to the home position, without affecting the experimental validation.
Among the different tests, the obstacles were kept in the same position. Figure 12 represents the obstacle distribution; obstacles numbered from 2 to 5 were only partially visible from the laser while obstacles 6 and 7 constituted a person that crosses the robot’s path.
Results of tests in the real world are summarized in Table 2 row All represents the percentage of navigation failures, for each methodology. Since the robot resumed navigation after a collision, the percentage of total failures was not calculated over the number of tests per methodology (10) but was calculated over the total possible collision points which corresponds to the number of tests multiplied by the total obstacles encountered during the forward and backward paths (16), for a total of 160 possible collision points. As we can see in Table 2, our method performs better with respect to the other strategies.
Rows Side and On-trajectory of Table 2 represent instead the percentage of total failures segmented into two main categories: side obstacles and on-trajectory/corner obstacles. As can be seen in Figure 12, we identified side obstacles (1, 2, 3, 5, 6) as the ones that were at the sides of the desired trajectory and that needed minor corrections to be avoided; trajectory obstacles (4, 7, 8) are the obstacles that partially blocked the passage.
Table 2 suggests that the trajectory approach improves detection of obstacles that are directly placed along the robot trajectory or at the corner before a curve. However, the detection of side obstacles is poor, especially if these obstacles do not directly lie on the planned trajectory. Our approach, on the other hand, not only reduced the total number of failures but it also enabled the detection of obstacles outside the area of interest that was strictly close to the trajectory.
A possible limit of this approach can be the presence of wide overhanging obstacles in the environment. For example, if the table in Figure 1 is very long, no salient points will be detected between the legs of the table. However, this happens only when the table is approached frontally and thus the distance of the two legs with respect to the robot point of view is maximum. In this case the robot will perceive two salient point on the left and on the right without any information in the middle but in agreement with the cost function optimized by our method, the head trajectory should pass from one point to the other and thus will also scan the portion of table in the middle of the legs. However, this behavior is not guaranteed in cases where the robot moves very fast, and the head will not have sufficient time to sweep the area between the legs of the table. It is worth noting that given the speed of the camera (the head of the robot is much lighter than the robot body); this is a quite unlikely case.

5. Conclusions

In this work, we have developed a method to actively detect obstacles with robots that are equipped with LiDARs with limited FOV and movable depth cameras. Using a humanoid robot, we exploited the additional degree of freedom of the head to probe the space of a partially determined environment in an efficient way. The proposed method optimizes the head trajectory movements in order to make observations with the attached RGB-D camera, the head movements determine the areas that are scanned by the camera and thus the obstacles that are detected. LiDAR data are not only fused with point-cloud data but are also used to gather preliminary information from the environment to be used in the head trajectory generation. Our methodology is validated experimentally in challenging conditions in simulation and with the real robot. This work opens up various directions of research, including the integration of additional methods for detecting obstacles using depth and RGB data, and a recovery systems to resume navigation when the robot gets stuck.

Author Contributions

Conceptualization, L.N. (Luca Nobile), M.R., M.C. and L.N. (Lorenzo Natale); methodology, L.N. (Luca Nobile), M.R., M.C. and L.N. (Lorenzo Natale); software, L.N. (Luca Nobile) and M.R.; validation, L.N. (Luca Nobile), M.R., M.C. and L.N. (Lorenzo Natale); formal analysis, L.N. (Luca Nobile); investigation, L.N. (Luca Nobile); resources, L.N. (Lorenzo Natale), L.M., W.V. and F.P.; data curation L.N. (Luca Nobile); writing—original draft preparation, L.N. (Luca Nobile); writing—review and editing, M.R., M.C. and L.N. (Lorenzo Natale); visualization, L.N. (Luca Nobile); supervision, M.R., M.C. and L.N. (Lorenzo Natale); project administration, L.N. (Lorenzo Natale); funding acquisition, L.N. (Lorenzo Natale). All authors have read and agreed to the published version of the manuscript.

Funding

This research was funded by Konica Minolta Global R&D Europe, 00144 Rome and Italian Institute of Technology, 16163 Genova.

Institutional Review Board Statement

Not applicable.

Informed Consent Statement

Not applicable.

Data Availability Statement

The data that support the findings of this study are available from the corresponding author, [L.N. (Luca Nobile); L.N. (Lorenzo Natale)], upon reasonable request.

Acknowledgments

The authors acknowledge financial support from Konica Minolta Laboratory Europe (KMLE).

Conflicts of Interest

The authors declare no conflict of interest.

References

  1. Pandey, D.A. Mobile Robot Navigation and Obstacle Avoidance Techniques: A Review. Int. Robot. Autom. J. 2017, 2, 1–12. [Google Scholar] [CrossRef] [Green Version]
  2. Hassan, S.; Hicks, J.; Lei, H.; Turano, K. What is the minimum field of view required for efficient navigation? Vis. Res. 2007, 47, 2115–2123. [Google Scholar] [CrossRef] [PubMed] [Green Version]
  3. Bouraine, S.; Fraichard, T.; Salhi, H. Provably safe navigation for mobile robots with limited field-of-views in unknown dynamic environments. In Proceedings of the 2012 IEEE International Conference on Robotics and Automation, Saint Paul, MN, USA, 14–18 May 2012; pp. 174–179. [Google Scholar] [CrossRef] [Green Version]
  4. Roelofsen, S.; Gillet, D.; Martinoli, A. Collision avoidance with limited field of view sensing: A velocity obstacle approach. In Proceedings of the 2017 IEEE International Conference on Robotics and Automation (ICRA), Singapore, 29 May–3 June 2017; pp. 1922–1927. [Google Scholar] [CrossRef] [Green Version]
  5. Lopez, B.T.; How, J.P. Aggressive collision avoidance with limited field-of-view sensing. In Proceedings of the 2017 IEEE/RSJ International Conference on Intelligent Robots and Systems (IROS), Vancouver, BC, Canada, 24–28 September 2017; pp. 1358–1365. [Google Scholar] [CrossRef]
  6. Jain, S.; Malhotra, I. A Review on Obstacle Avoidance Techniques for Self-Driving Vehicle. Int. J. Adv. Sci. Technol. 2020, 29, 5159–5167. [Google Scholar]
  7. Patle, B.; Babu, L.G.; Pandey, A.; Parhi, D.; Jagadeesh, A. A review: On path planning strategies for navigation of mobile robot. Def. Technol. 2019, 15, 582–606. [Google Scholar] [CrossRef]
  8. Discant, A.; Rogozan, A.; Rusu, C.; Bensrhair, A. Sensors for Obstacle Detection-A Survey. In Proceedings of the 2007 30th International Spring Seminar on Electronics Technology (ISSE), Cluj-Napoca, Romania, 9–13 May 2007; pp. 100–105. [Google Scholar] [CrossRef]
  9. Bhattacharya, P.; Gavrilova, M.L. Voronoi diagram in optimal path planning. In Proceedings of the 4th International Symposium on Voronoi Diagrams in Science and Engineering (ISVD 2007), Glamorgan, UK, 9–11 July 2007; pp. 38–47. [Google Scholar] [CrossRef]
  10. Esan, O.; Du, S.; Lodewyk, B. Review on Autonomous Indoor Wheel Mobile Robot Navigation Systems. In Proceedings of the 2020 International Conference on Artificial Intelligence, Big Data, Computing and Data Communication Systems (icABCD), Durban, South Africa, 6–7 August 2020; pp. 1–6. [Google Scholar] [CrossRef]
  11. Ni, J.; Li, X.; Fan, X.; Shen, J. A dynamic risk level based bioinspired neural network approach for robot path planning. In Proceedings of the 2014 World Automation Congress (WAC), Waikoloa, HI, USA, 3–7 August 2014; pp. 829–833. [Google Scholar] [CrossRef]
  12. Quiñonez, Y.; Ramirez, M.; Lizarraga, C.; Tostado, I.; Bekios, J. Autonomous Robot Navigation Based on Pattern Recognition Techniques and Artificial Neural Networks. In Bioinspired Computation in Artificial Systems; Ferrández Vicente, J.M., Álvarez-Sánchez, J.R., de la Paz López, F., Toledo-Moreo, F.J., Adeli, H., Eds.; Springer International Publishing: Cham, Switzerland, 2015; pp. 320–329. [Google Scholar]
  13. Pang, C.; Zhong, X.; Hu, H.; Tian, J.; Peng, X.; Zeng, J. Adaptive Obstacle Detection for Mobile Robots in Urban Environments Using Downward-Looking 2D LiDAR. Sensors 2018, 18, 1749. [Google Scholar] [CrossRef] [PubMed] [Green Version]
  14. Young, J.; Simic, M. LIDAR and Monocular Based Overhanging Obstacle Detection. Procedia Comput. Sci. 2015, 60, 1423–1432. [Google Scholar] [CrossRef] [Green Version]
  15. Han, J.; Liao, Y.; Zhang, J.; Wang, S.; Li, S. Target Fusion Detection of LiDAR and Camera Based on the Improved YOLO Algorithm. Mathematics 2018, 6, 213. [Google Scholar] [CrossRef] [Green Version]
  16. Redmon, J.; Divvala, S.; Girshick, R.; Farhadi, A. You Only Look Once: Unified, Real-Time Object Detection. In Proceedings of the 2016 IEEE Conference on Computer Vision and Pattern Recognition (CVPR), Las Vegas, NV, USA, 27–30 June 2016; pp. 779–788. [Google Scholar] [CrossRef] [Green Version]
  17. Song, H.; Choi, W.S.; Lim, S.; Kim, H.D. Target localization using RGB-D camera and LiDAR sensor fusion for relative navigation. In Proceedings of the CACS 2014-2014 International Automatic Control Conference, Conference Digest, Kaohsiung, Taiwan, 26–28 November 2015; pp. 144–149. [Google Scholar] [CrossRef]
  18. Thapa, V.; Capoor, S.; Sharma, P.; Mondal, A.K. Obstacle avoidance for mobile robot using RGB-D camera. In Proceedings of the 2017 International Conference on Intelligent Sustainable Systems (ICISS), Palladam, India, 7–8 December 2017; pp. 1082–1087. [Google Scholar] [CrossRef]
  19. Nardi, F.; Lazaro, M.; Iocchi, L.; Grisetti, G. Generation of Laser-Quality 2D Navigation Maps from RGB-D Sensors. In RoboCup 2018: Robot World Cup XXII; Springer International Publishing: Montreal, QC, Canada, 2018. [Google Scholar]
  20. Keselman, L.; Woodfill, J.I.; Grunnet-Jepsen, A.; Bhowmik, A. Intel(R) RealSense(TM) Stereoscopic Depth Cameras. In Proceedings of the 2017 IEEE Conference on Computer Vision and Pattern Recognition Workshops (CVPRW), Honolulu, HI, USA, 21–26 July 2017; pp. 1267–1276. [Google Scholar] [CrossRef]
  21. Zhang, Z. Microsoft Kinect Sensor and Its Effect. IEEE Multimed. 2012, 19, 4–12. [Google Scholar] [CrossRef] [Green Version]
  22. Välimäki, T.; Ritala, R. Optimizing gaze direction in a visual navigation task. In Proceedings of the 2016 IEEE International Conference on Robotics and Automation (ICRA), Stockholm, Sweden, 16–21 May 2016; pp. 1427–1432. [Google Scholar] [CrossRef] [Green Version]
  23. Lauri, M.; Ritala, R. Stochastic control for maximizing mutual information in active sensing. In Proceedings of the ICRA 2014 Workshop: Robots in Homes and Industry: Where to Look First? Hong Kong, China, 1 June 2014; pp. 1–6. [Google Scholar]
  24. NVIDIA Corporation. NVIDIA Isaac SDK. Available online: https://developer.nvidia.com/isaac-sdk (accessed on 19 August 2021).
  25. Fox, D.; Burgard, W.; Dellaert, F.; Thrun, S. Monte Carlo Localization: Efficient Position Estimation for Mobile Robots. In Proceedings of the Sixteenth National Conference on Artificial Intelligence and Eleventh Conference on Innovative Applications of Artificial Intelligence, Orlando, FL, USA, 18–22 July 1999; pp. 343–349. [Google Scholar]
  26. Nissoux, C.; Simeon, T.; Laumond, J.P. Visibility based probabilistic roadmaps. In Proceedings of the 1999 IEEE/RSJ International Conference on Intelligent Robots and Systems, Human and Environment Friendly Robots with High Intelligence and Emotional Quotients (Cat. No.99CH36289), Kyongju, Korea, 17–21 October 1999; Volume 3, pp. 1316–1321. [Google Scholar] [CrossRef]
  27. The MathWorks. Matlab Release 2020.a. Natick, MA, USA. Available online: https://it.mathworks.com/products/new_products/release2020a.html (accessed on 19 August 2021).
  28. Maurer, C.R.; Rensheng, Q.; Raghavan, V. A linear time algorithm for computing exact Euclidean distance transforms of binary images in arbitrary dimensions. IEEE Trans. Pattern Anal. Mach. Intell. 2003, 25, 265–270. [Google Scholar] [CrossRef]
  29. Maia, M.H.; Galvão, R.K.H. On the use of mixed-integer linear programming for predictive control with avoidance constraints. Int. J. Robust Nonlinear Control 2009, 19, 822–828. [Google Scholar] [CrossRef]
  30. Makhorin, A. GLPK (GNU Linear Programming Kit Version 4.32). Available online: https://www.gnu.org/software/glpk/ (accessed on 19 August 2021).
  31. Zhang, J.; Singh, S. LOAM: Lidar Odometry and Mapping in Real-time. In Robotics: Science and Systems; University of California: Berkeley, CA, USA, 2014; Volume 2. [Google Scholar]
  32. Koenig, N.; Howard, A. Design and use paradigms for Gazebo, an open-source multi-robot simulator. In Proceedings of the 2004 IEEE/RSJ International Conference on Intelligent Robots and Systems (IROS) (IEEE Cat. No.04CH37566), Sendai, Japan, 28 September–2 October 2004; Volume 3, pp. 2149–2154. [Google Scholar] [CrossRef] [Green Version]
  33. Rasouli, A.; Tsotsos, J.K. The Effect of Color Space Selection on Detectability and Discriminability of Colored Objects. arXiv 2017, arXiv:1702.05421. [Google Scholar]
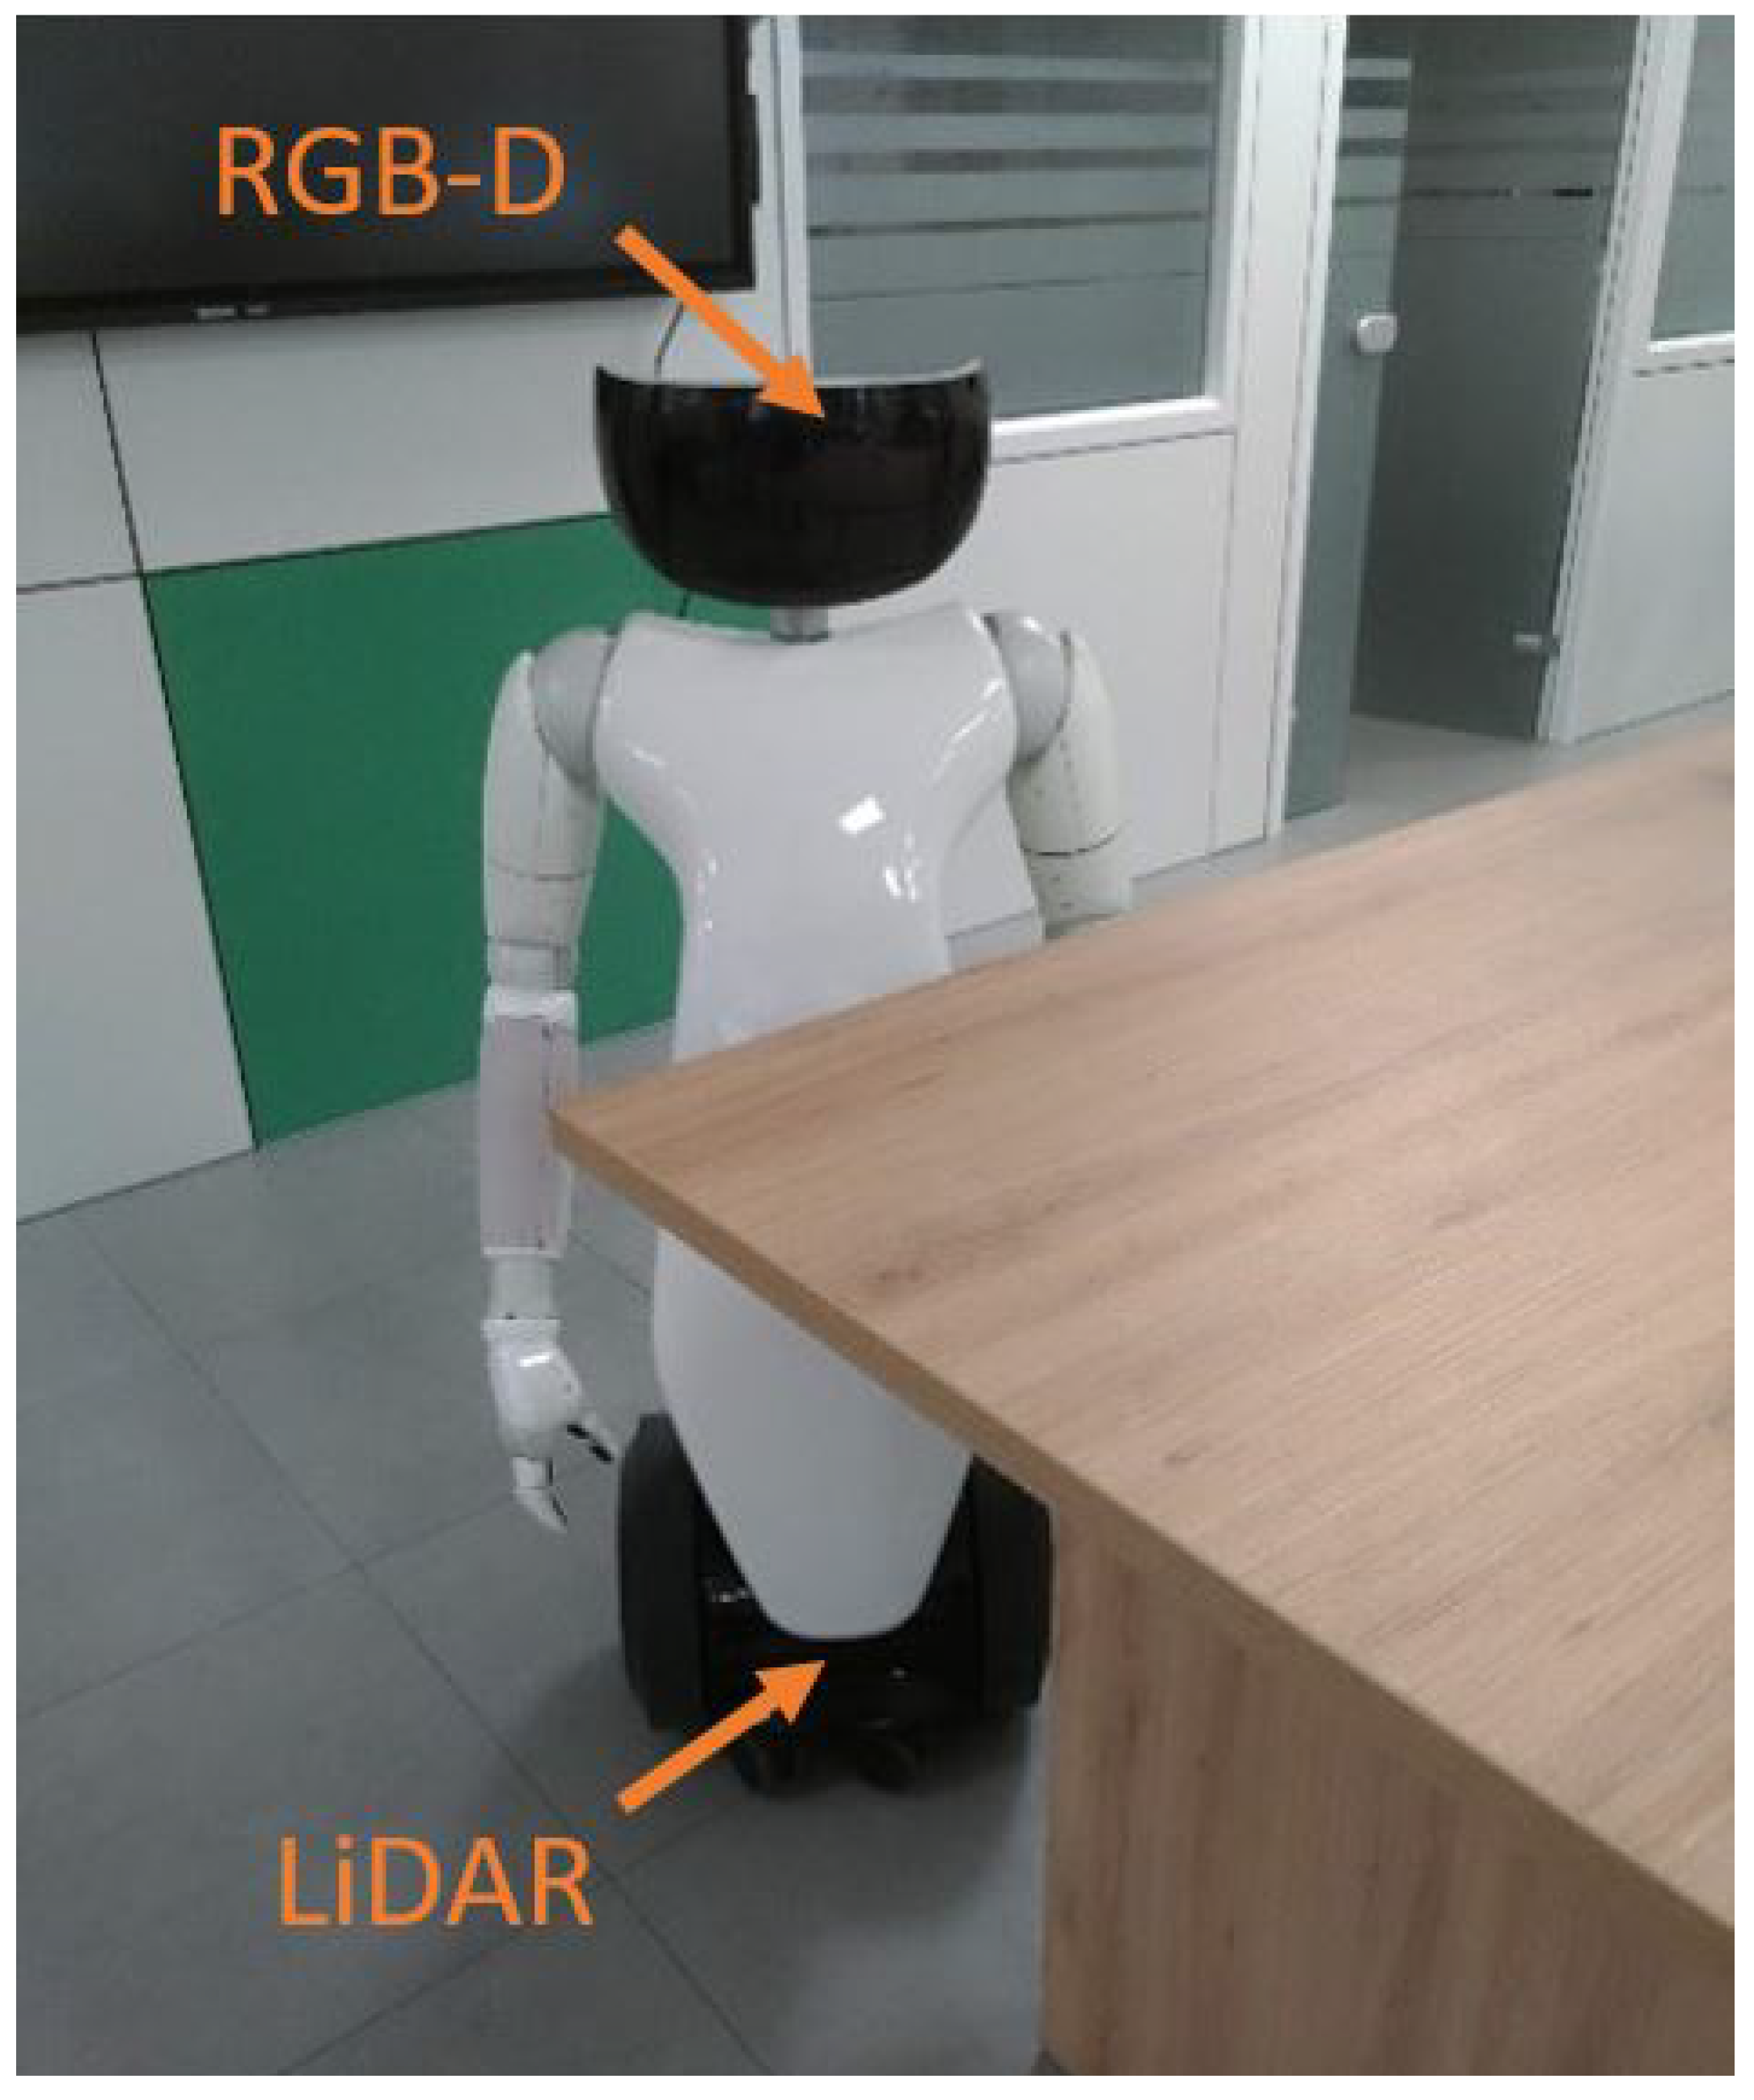
Figure 1. Example: an obstacle that is not detected by a 2D LiDAR on the robot base.
Actuators 10 00205 g001
Figure 2. Flow diagram of the proposed system.
Actuators 10 00205 g002
Figure 3. LiDAR and synthetic laser scan fusion. We can see how the LiDAR scan on the left is superimposed with the synthetic laser obtained from depth to obtain the augmented laser scan on the right. Yellow colors represent missing data in that direction; this happens when laser beams hit reflective surfaces or out of range surfaces.
Actuators 10 00205 g003
Figure 4. Flow diagram of the Isaac Navigation stack.
Actuators 10 00205 g004
Figure 5. LiDAR and RGB-D vision range of R1.
Actuators 10 00205 g005
Figure 6. Flowchart of the proposed obstacle candidate point detector.
Actuators 10 00205 g006
Figure 7. Schematic illustration of the optimization process in time.
Actuators 10 00205 g007
Figure 8. Simulated environment in Gazebo.
Actuators 10 00205 g008
Figure 9. Gazebo map with desired path and main navigation failure zones. The coloured boxes, named with letters from A to I, represent the main navigation failure areas in which the robot typically got stuck hitting an obstacle, while the + sign inside a box means that the robot stopped in that area (aggregated data are reported). The green path is representative of the trajectory followed by the robot during the navigation.
Actuators 10 00205 g009
Figure 10. (a) represents the percentage of simulations in which the robot reached a determined area. (b) represents the failure rate per area. Percentage in (a) is calculated over the total simulations. Percentage in (b) is calculated for an area over the total trial runs in which the robot reached the previous area.
Actuators 10 00205 g010
Figure 11. Time stamps values in function of progress percentage along the optimal trajectory. (a) shows performances of our Trajectory method while in in (b) are presented the result for our Optimization method. Box-plot is represented in blue and outliers (delay points) in red. Plot for sweep method not reported since it is similar to trajectory.
Actuators 10 00205 g011aActuators 10 00205 g011b
Figure 12. Scheduled path in real world and placement of obstacles.
Actuators 10 00205 g012
Table 1. Outliers number and average.
ApproachDelay Points #Delay Points Avg (s)
Sweep348295.6
Trajectory281283.4
Optimization130253.2
Table 2. Percentage of failures (robot crashes or gets stuck) per methodology and obstacles type.
Obstacle TypeFixedSweepTrajectoryOptimization
All19.4%15.7%8.8%6.3%
Side9.4%6.9%4.4%2.1%
On-trajectory10.0%8.8%4.4%4.2%
Publisher’s Note: MDPI stays neutral with regard to jurisdictional claims in published maps and institutional affiliations.