Abstract
Rubber shock absorbers are widely used to reduce vibration in aerospace load devices due to their high damping characteristics. However, due to the material nonlinearity of rubber and high temperature, the accurate numerical simulation and practical application of rubber shock absorbers face difficulties and challenges. In this paper, taking a T-type rubber shock absorber as an example, according to the correlation data obtained from the performance test of rubber materials, a constitutive model of rubber materials is established for its hyperelasticity-viscoelasticity simulation analysis. On this basis, the rubber shock absorber was used to carry out the numerical simulation and experimental verification of an Unmanned Aerial Vehicle (UAV) Light Detection And Ranging (LiDAR). The results show that when the rubber constitutive model is used for simulation analysis, the obtained acceleration response curve on the UAV LiDAR is in good agreement with the test results, which effectively confirms the accuracy of the numerical simulation, and successfully verifies that the rubber shock absorber is suitable for vibration reduction of UAV LiDAR. At the same time, this method also provides a practical and effective solution for the vibration reduction design of rubber shock absorbers.
1. Introduction
Due to its excellent stiffness and damping properties, rubber materials can not only withstand excessive static loads, but also can be used for multi-directional vibration reduction, and are widely used in the aerospace field. However, due to the nonlinear characteristics (i.e., hysteretic behavior) of rubber, nonlinear geometric deformation and nonlinear boundary conditions, it is very difficult to establish a theoretical model of the dynamic characteristics of rubber materials. At present, when characterizing the dynamic properties of rubber materials, it is usually necessary to use more complex constitutive models to study them, such as the Maxwell model [1], the Kelvin model [2], the Ogden model [3] and the Mooney-Rivlin model [4,5,6,7].
Rubber is a type of essentially incompressible material in volume, showing large deformation displacement under load. After removing the load, its elastic deformation will return to the initial zero state, so it shows hyperelasticity. In the process of studying the hyperelasticity-constitutive model of rubber materials, two main research methods have been formed: statistical thermodynamics and continuum mechanics [8,9]. E. M. Arruda et al. [10] proposed a new model, namely a non-Gaussian statistical model, and established a theoretical calculation model of rubber hyperelasticity. M. Mooney [11] first proposed a phenomenological theory of large elastic deformation, which was used to characterize the hyperelastic model of rubber. M. Sasso [12] et al. used the results of plane-tensile experiments to verify the hyperelastic parameters. Lin B [13] proposed a constitutive model which can predict the stress-strain relationship of rubber materials in plane-tensile state through uniaxial tensile test and equibiaxial tensile test. Yaya K et al. [14] proposed a hyperelastic model based on green Cauchy standard invariants which can predict the multiaxial behavior of rubber materials. Xiao Quanshan et al. [15] verified that the constitutive model can better describe its mechanical properties by fitting the parameters of the Mooney Rivlin model. Han Binhui et al. [16] obtained the constitutive parameters of the Mooney Rivlin model by uniaxial tensile test of the rubber material, and used finite element analysis software to test the performance of cylindrical rubber shock absorber, and verified the vibration reduction effect of the rubber shock absorber through experiments. Jiang X. et al. [17] designed a model test scheme of low-buried and unsymmetrical pressure tunnels with a rubber shock absorber layer. Korostelev S.A. [18] proposed an algorithm to calculate the stress and strain of rubber components in the internal shock absorbers of a small-diameter supporting roller in a caterpillar system. Ju S.-H. [19] used the three-dimensional finite element analysis to study the seismic and micro vibrations of the high-tech factory with and without lead rubber bearings. Zeng, Z. [20] analyzed the vibration reduction characteristics of the ballasted track with rubber composite sleepers in both time and frequency domains. He W. [21] reported a float track with rubber spring isolator which proved to have a good vibration isolation effect through experiments. Wang, B. et al. [22] developed a smart magneto-sensitive rubber-based isolation system and its nonlinear model. At the same time, they studied two control strategies to make the rubber isolator obtain a stronger vibration isolation effect. Menga, N. et al. [23] investigated the dynamic behavior of rubber-layer roller-bearing seismic isolators, and verified through experiments that the nonlinear system can fully reduce the instantaneous and average inertial load values. Wang, B. [24] established the constitutive model of magnetic sensitive rubber, which can accurately predict the dynamic characteristics of the rubber, and is conducive to the application of the rubber in vibration reduction.
In addition, under the action of alternating stress or strain, the strain or stress of rubber material will change with frequency and amplitude, and the viscoelastic constitutive model characterizes the nonlinear characteristics of rubber structure on dynamic load amplitude and frequency [25]. Singh MP [26] proved that the generalized Maxwell model and the generalized Kelvin model can characterize the frequency dependence of materials in response calculation. T. YAJIMA et al. [27] reached the conclusion that various viscoelastic models can be unified into one geometric expression.
Based on the hyperelastic model and viscoelastic model of rubber, a hyperelasticity-viscoelasticity model is established in this paper. The performance parameters of the constitutive model are obtained through the material performance test, and the comparative numerical simulation analysis of rubber shock absorber based on the linear elastic model and the hyperelasticity-viscoelasticity constitutive model is carried out. The vibration reduction performance of a T-type rubber damper commonly used in the aerospace field was tested by vibration test, and it was found that the frequency drift of its acceleration response curve became more and more obvious with the increase in vibration magnitude. Finally, the results of the two numerical simulation methods are compared with the results of the vibration test, and the error between the two numerical simulation analysis methods and the test results is given. It is concluded that the solution accuracy of the numerical simulation using the hyperelasticity-viscoelasticity model to characterize rubber materials is higher and better agrees with the test curves. The research in this paper can provide a practical and effective solution for the vibration reduction design of rubber shock absorber, and has important engineering application value.
2. Hyperelasticity-Viscoelasticity Constitutive Model Theory of Rubber
2.1. Mooney-Rivilin Hyperelastic Constitutive Model
Phenomenological theory and method involve the physical properties of rubber materials that can be observed, without considering the nonlinear elastic relationship between stress and strain in the microcomponent of rubber materials, and can describe the deformation characteristics of rubber materials commonly used in engineering as accurate mathematical expressions. Its theoretical assumptions are:
- When an external load (stress) is applied to the rubber material, deformation (strain) occurs immediately;
- After the load acting on the rubber material is unloaded, the material fully returns to its original state;
- The rubber material is an isotropic material and the volume is incompressible;
- There is a strain energy function, and the stress of the material can be obtained by taking the partial derivative of this function.
The constitutive relation of the rubber material can be expressed as a function of the three invariants , and of the deformation tensor by the strain energy function, or as a function of the three principal elongation ratios , and .
According to the assumption of the above phenomenological theory, the rubber material is an incompressible and isotropic material, and the influence on the strain energy density is not considered, . The strain energy function of an isotropic incompressible material is only related to two independent variables, and the strain energy function is formed by the superposition of the strain deviator energy and the volumetric strain energy. The polynomial model is as follows:
where U is the strain energy per unit volume; N is the order of the polynomial (maximum is 6, and rarely exceeds 2 when both the first and second order strain invariants are considered); and are the material coefficients, and represents whether the material is compressible (when , the material is completely incompressible); is the elastic volume ratio; and are the first-order and second-order strain invariants, respectively, which can be expressed by the principal elongation.
When the order of the polynomial is , the linear term in the strain deviator energy is preserved, that is, the Mooney-Rivlin constitutive model is expressed as:
According to the constitutive model of this material, after the tensile test is performed to obtain the test data, the residual error can be calculated by the least square method to obtain the optimal parameter result.
2.2. Generalized Maxwell Viscoelastic Constitutive Model
The Maxwell model is composed of a spring unit and a dashpot damping unit in series, as shown in Figure 1.
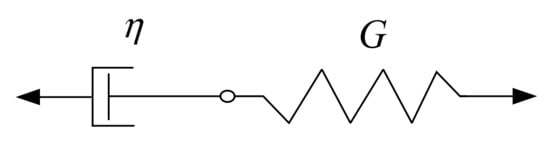
Figure 1.
Maxwell model.
The constitutive equation of the Maxwell model is as follows:
where is the relaxation time and η is the viscous damping coefficient of the sticky pot.
The generalized Maxwell model consists of a combination of N Maxwell element models and an ideal spring element in parallel, as shown in Figure 2 where represents the quasi-static elastic modulus; represents the elastic modulus in each Maxwell model; and represents the viscous damping coefficient in each Maxwell model.
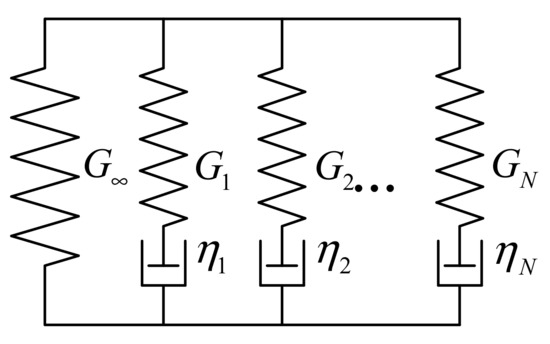
Figure 2.
Generalized Maxwell model.
According to the constitutive equation of a single Maxwell model, the kinematic differential equation of the i-th element can be obtained:
For dynamic mechanical tests, if the strain , then:
Then the total stress is:
So the complex shear modulus is:
The storage modulus , loss modulus , and dynamic viscosity are:
If the i-th unit in the model satisfies the condition , it can be seen from the formula (13) that the storage modulus of this unit is very close to , whereas the loss modulus and dynamic viscosity become very small and close to zero. When , the storage modulus is equal to , the loss modulus , and dynamic viscosity are equal to zero, and the unit has actually degenerated into a spring unit. Conversely, when , the storage modulus of the unit is close to zero, and its dynamic viscosity is close to . At , the element degenerates into a stick pot element.
When using the dynamic frequency sweep test data measured by the Dynamic Mechanical Analysis (DMA) test machine to identify the material parameters, the least squares method can also be used, and the objective function is:
Among them, G′ and G″ are the storage modulus and loss modulus of the experimentally measured frequency at , respectively; is the experimental frequency; and M is the number of experimentally measured data points.
2.3. Hyperelasticity-Viscoelasticity Constitutive Model
In order to carry out accurate dynamic analyses of rubber vibration isolators, it is considered to adopt the hyperelasticity-viscoelasticity constitutive model in the numerical simulation, that is, the Mooney-Rivilin hyperelastic model is used to describe the nonlinear characteristics of the stress-strain curve during the test, using the generalized Maxwell model to describe the frequency dependence, as shown in Figure 3.
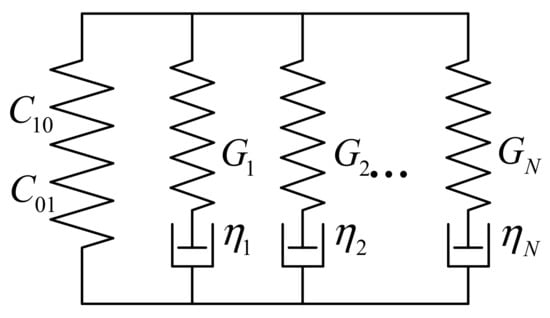
Figure 3.
Hyperelasticity-viscoelasticity model.
The material parameters in the constitutive model will be obtained through subsequent experiments.
3. Nonlinear Constitutive Parameter Testing of Rubber
In the finite element analysis, the choice of the constitutive model of the rubber materials and the accuracy of the material parameters play a decisive role in the results of the finite element analysis. Based on the theory of the constitutive model of rubber materials, it is necessary to test the properties of the rubber material’s hyperelasticity and viscoelasticity, and obtain the material parameters required to establish an accurate finite element model. Firstly, the stress-strain relationship of the rubber material is obtained by tensile test, and the material parameters required by the Mooney-Rivilin hyperelastic model are obtained by data fitting. Then, the response data of the rubber material under alternating stress are obtained through dynamic mechanical tests, and the material parameters required by the generalized Maxwell viscoelasticity model are identified to match the frequency dependence of the rubber material [28].
3.1. Generalized Maxwell Viscoelastic Constitutive Model
The rubber material tested in this test is ZN series damping silicone rubber prepared by the Aerospace Research Institute of Materials and Processing Technology. Equibiaxial, uniaxial and planar tensile specimens were cut from a rubber film with a length of 200 mm, a width of 150 mm and a height of 2 mm to measure the strain of the rubber specimen. Three groups of samples of the same kind of rubber were tested in the test, and the average value was taken as the test result, as shown in Figure 4.
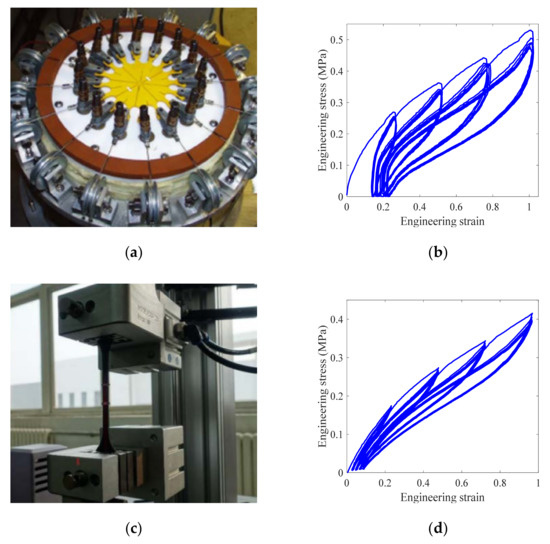
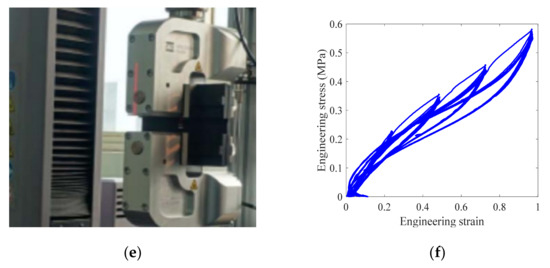
Figure 4.
Rubber sample test results: (a) Equibiaxial tensile test; (b) Equibiaxial tensile stress-strain; (c) Uniaxial tensile test; (d) Uniaxial tensile stress-strain; (e) Plane tensile test; (f) Plane tensile stress-strain.
The length of the sample before applying the tensile force F is , and the cross-sectional area before the tensile force is . In the process of stretching, the volume of the material remains unchanged, its length becomes I, and its cross-sectional area becomes A. At this time, the relationship between engineering stress-strain and nominal stress-strain can be obtained:
The stress-strain relationship directly obtained by the test is the relationship between engineering stress and engineering strain. The material model parameters used in the hyperelastic constitutive model need to be fitted with nominal stress and nominal strain. The relationship curve between the nominal stress and the nominal strain of the rubber material in the uniaxial tensile test, equi-biaxial tensile test and plane tensile test is deduced by Formulas (15) and (16). Figure 5 below shows the nominal stress-strain relationship curves of three different sample test processes obtained from the three tests.
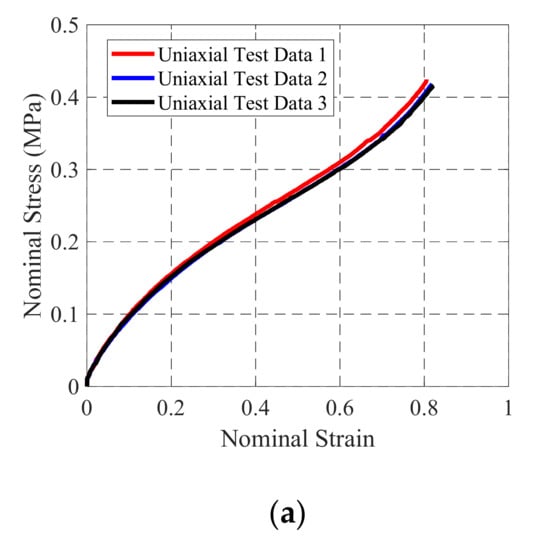
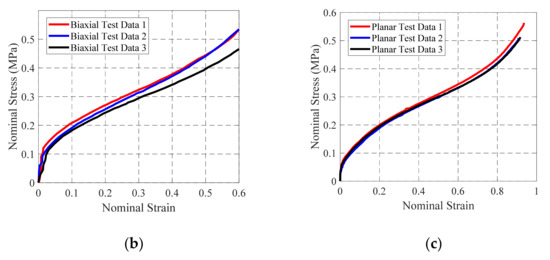
Figure 5.
Rubber sample nominal stress-strain curves: (a) Uniaxial tensile test; (b) Equal biaxial tensile test; (c) Plane tensile test.
The Mooney-Rivilin hyperelastic constitutive model obtained by fitting the constant terms in each strain-energy function with the least square method and comparing the minimum stress relationship can better characterize the stress-strain phenomenon of rubber materials. The strain-energy function of the Mooney-Rivilin model is shown in the Equation (5).
The fitting results of the constant term parameters in the strain energy function of the Mooney-Rivilin constitutive model are shown in Table 1 below.

Table 1.
Mooney-Rivilin model constitutive parameters.
3.2. Rubber Viscoelasticity Parameter Test
Most rubber materials are subjected to alternating loads in the working state, so the dynamic mechanical test, which is a test that is closer to the actual use conditions of the material [29,30] is necessary. The dynamic mechanical test is carried out by using a dynamic mechanical analyzer (DMA), the specification model of which is Q800. As shown in Figure 6, a constant temperature sweep frequency test was performed on the silicone rubber used. The test temperature is kept at a room temperature of 25 degrees Celsius; the frequency sweep range is 1–200 Hz; the frequency sweep step is 1 Hz; and the amplitude is 20 μm. The storage modulus, loss modulus, and loss factor of the rubber material measured by the test are shown in Figure 7.
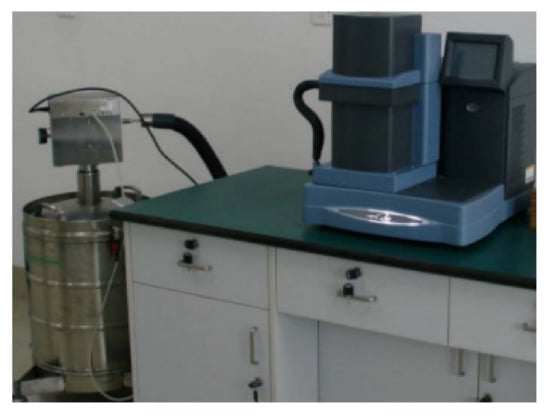
Figure 6.
Dynamic Mechanical Analyzer.
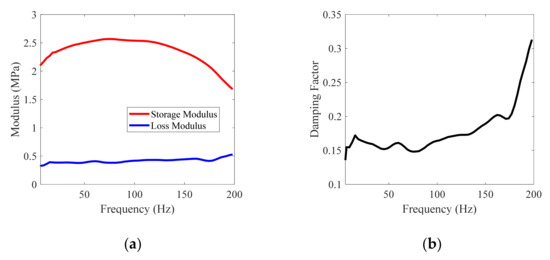
Figure 7.
Material viscoelastic test results: (a) Storage modulus and loss modulus; (b) Damping factor.
The test results show that in the test frequency range, the storage modulus increases with the increase in frequency below 100 Hz at low frequency, and decreases with the increase in frequency above 100 Hz at high frequency. The loss modulus is within the entire test frequency range. It shows a weak increase, but the rate of change is not obvious; the loss factor does not increase significantly with the change of the frequency within the range of the test frequency below 150 Hz, and it increases significantly above 150 Hz, and the maximum value can reach 0.3. Finally, the relationship between the storage modulus, loss modulus, and frequency obtained by the test is directly input into the Abaqus material model for material constitutive model fitting, which is used for the final numerical solution calculation.
4. Vibration Reduction Design of UAV LiDAR
As shown in Figure 8, the UAV radar system is fixed on the bracket on the front side of the aircraft, and the vibration generated by the UAV is transmitted to the radar system through the bracket. When the engine works or the disturbance of the propeller makes the aircraft fuselage resonate, the vibration of the radar system will increase and the performance will be degraded, and in severe cases, the radar will be damaged or malfunctioned. To this end, in order to reduce the impact of vibration on the LiDAR, a rubber shock absorber is designed on the front bracket of the drone to buffer and protect the radar.
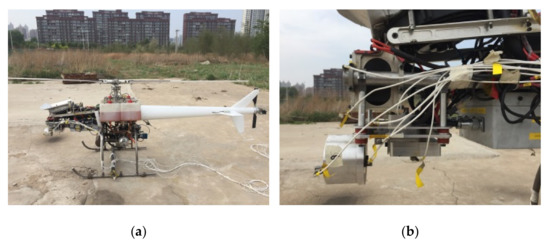
Figure 8.
Installation location of a UAV LiDAR: (a) UAV; (b) LiDAR.
The rubber shock absorber consists of a retaining ring, a connecting sleeve, a gasket and two T-shaped rubbers, as shown in Figure 9. Among them, the connecting sleeve is set in the installation hole of the load mounting plate, two T-shaped rubber sleeves are set on the outside of the connecting sleeve, and are symmetrically arranged on both sides of the installation hole. The bolts pass through the connecting sleeve and the connecting plate to connect with the connecting column. Further, spacers are provided between the load mounting plate and the T-shaped rubbers on both sides. The retaining ring and the connecting sleeve maintain a certain gap to ensure that the preload of the rubber shock absorber can be about 5% during the assembly process. There is a gap between the two T-shaped rubbers, so that the T-shaped rubber has a better vibration reduction effect in the horizontal direction, and at the same time, the upper and lower symmetrical structure is designed to improve the overall vibration reduction performance. Designing the gasket to fit between the load mounting plate and the T-shaped rubber can effectively improve the bearing stiffness and ensure that the rubber material will not be crushed. The upper and lower symmetrical combination of the rubber shock absorber can effectively improve the one-way vibration reduction effect, and the rubber T-shaped structure can greatly improve the vibration performance in the horizontal direction.
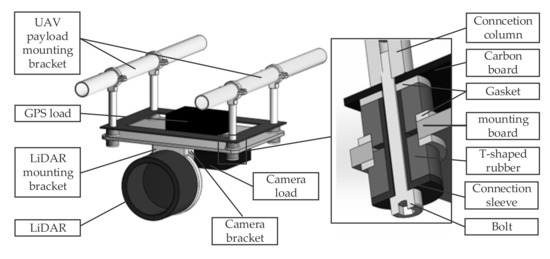
Figure 9.
Radar installation damping platform and damper structure.
Dynamic Model of Radar Vibration Reduction System
The dynamic model of the UAV front-mounted radar is shown in Figure 10. The vibration damping structure can be simplified as an element made up of springs and dashpots. The dashpots are the linear rate-dependent hysteretic elements that absorb and consume the vibration energy [31,32]. The springs mainly store the energy. It is a common simplified method to simplify the rubber material into an element made up of springs and dashpots. Due to the characteristics of the spring element, the entire dynamic system has stiffness. When the shock absorber vibrates, there is a proportional relationship between the restoring force exhibited by the spring and the vibration displacement, so the spring element can store the energy during the vibration process. At the same time, due to the characteristics of the damping element, the vibration rate of the damping element is proportional to the damping force, and the damping element consumes the energy of the vibration process.
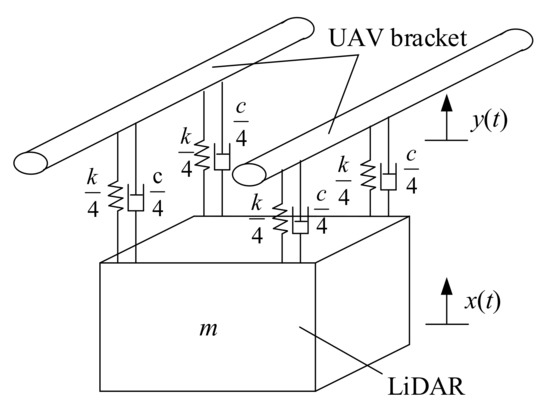
Figure 10.
Front-loading radar dynamics model of the drone.
The dynamic model of the UAV radar vibration-damping structure is simplified to a single-degree-of-freedom system. In Figure 10, the vibration displacement from the foundation is y, and the displacement x is the displacement that acts on the foundation and is transmitted to the mass block after passing through the spring damping unit. During the calculation, the deformation of the spring in the figure is proportional to the relative displacement of the LiDAR end and the UAV bracket end, so the spring is deformed by the load. When the spring stiffness is k, its restoring force is proportional to the spring stiffness and the damping. The size of the damping force generated by the shock absorber is proportional to the relative velocity at both ends of the shock absorber.
According to Newton’s second law, under the combined action of the inertial force of the mass, the restoring force of the spring and the damping force, the equilibrium equation of the single-degree-of-freedom system is obtained as follows:
The complex number method is used to solve the differential equation. Therefore, the steady-state simple harmonic vibration response displacement x transmitted to the mass through the spring damping unit and the basic simple harmonic vibration displacement y are expressed in complex form, which are expressed as follows:
Substitute the foundation vibration displacement and response displacement into Equation (17) to get
By solving the magnitude of in Equation (21), it can be obtained that the amplitude B of the steady-state response is:
Equation (22) can be rewritten as the ratio of the steady-state response amplitude to the input vibration response amplitude:
where is called the amplitude amplification factor. It can be obtained from the formula that the amplitude amplification factor of a single-degree-of-freedom system is mainly related to the natural frequency of the vibration response, the spring stiffness of the spring damping element, and the damping ratio of the damping element.
As shown in Figure 11, take the absolute displacement transmissibility as the ordinate and the frequency ratio as the abscissa, and draw the relationship curve between the transmissibility and the frequency. By changing the damping ratio and taking the damping ratio as a variable, the vibration response curve of the system under different damping ratios is drawn.
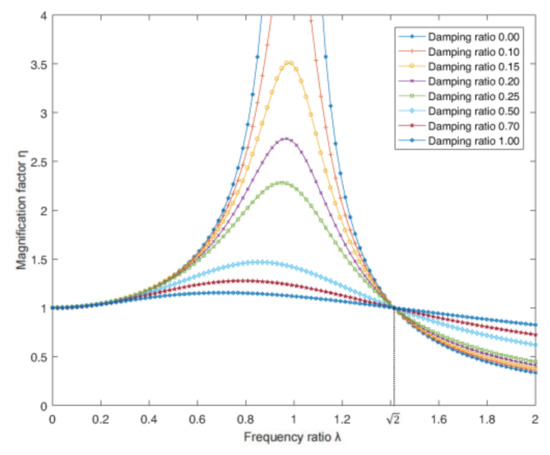
Figure 11.
Amplitude-frequency response curve.
The following conclusions can be drawn from the Figure 11:
- (1)
- When 0 < λ < 1, almost all the excitation transmitted by the UAV bracket passes through the shock absorber, and the shock absorber has no vibration reduction effect.
- (2)
- When λ ≈ 1, that is, when the input excitation frequency is very close to the natural frequency of the shock absorber, the structure will resonate in this case, which not only has no vibration reduction effect, but also increases the interference to some extent.
- (3)
- When , the shock absorber does not have the effect of vibration reduction, resulting in vibration amplification. It can be seen from the figure that in the frequency range without vibration reduction effect, when it gradually increases, the displacement transmissibility has a general decreasing law. It can be seen that the damping effect of the shock absorber is significantly improved by appropriately increasing the damping energy, and this effect is especially obvious in the frequency range of resonance occurrence.
- (4)
- When , it can be seen from the figure that the transmissibility gradually decreases with the increase in frequency, indicating that the vibration reduction effect is better. However, when the frequency increases, the transmissibility also increases. At this time, increasing the damping weakens the vibration reduction effect of the structure.
In the design process of the shock absorber, the excitation frequency bandwidth is known. In order to make the vibration reduction effect better, the natural frequency of the shock absorber is usually designed to be smaller than the excitation frequency to increase the value of λ. At the same time, the shock absorber should have a certain damping, so that the vibration response can be reduced as much as possible even in the resonance frequency range. In order to ensure the effective vibration isolation effect in the high frequency range, the damping of the shock absorber should not be too large. Because of its superior physical properties, rubber materials generally have a damping range of about 0.1–0.5, which is in line with the selection of damping materials in the shock absorber structure in this paper.
5. Finite Element Simulation of LiDAR Vibration Reduction System
5.1. Radar Mounting Base Vibration Input Condition Test
When the UAV has left the ground and is in a stable flight state in the air, the vibration source mainly comes from the action of the engine and the rotation of the UAV wing. At the same time, due to the unstable air flow in the air, vibration of the system will also be caused. The working state of the UAV basically belongs to the air flight stage, so more attention is paid to the vibration response of the LiDAR installation position in this state, and the vibration response input of the radar during its flight needs to be obtained. The acquisition equipment used in the test is the LMS test system, the model of the test hardware is the SCM209 data acquisition front end, and the test selects the B & K 4528-B acceleration sensor and the B & K 4524-B acceleration sensor, as shown in Figure 12.
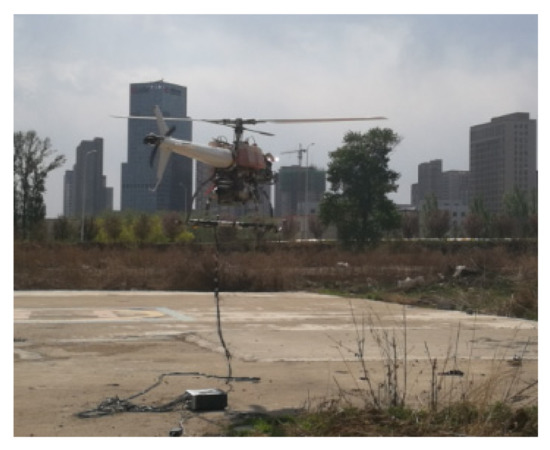
Figure 12.
UAV Air Flight Vibration Test.
During the flying phase of the UAV, the time-domain response and frequency-domain power spectral density response of the radar installation point and the engine measurement point are tested. In order to ensure the accuracy of the measured curve, it is necessary to intercept the vibration response curve within the stable time period of 10 s after the UAV is stable in the air, and the acceleration power spectral density (PSD) curve in each direction, as shown in Figure 13.
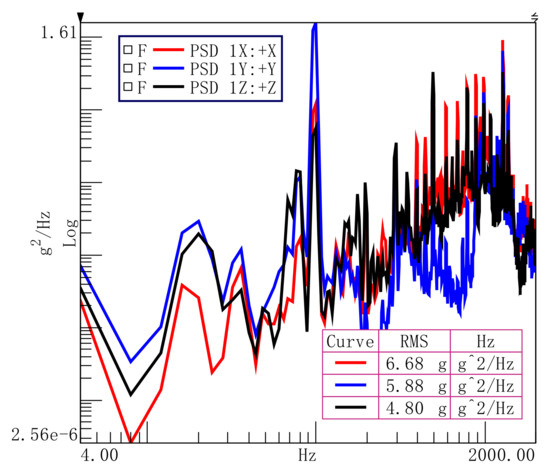
Figure 13.
Vibration input PSD curve.
5.2. Finite Element Modeling and Modal Analysis
For the specific input conditions of the radar system, it is necessary to input the measured vibration response conditions of the actual UAV LiDAR installation location for finite element analysis. The finite element model of the entire structure consists of 48,475 elements and 72,878 nodes, as shown in Figure 14. The hyperelastic and viscoelastic models are used for the rubber material, and the rubber mesh is densified at the same time to improve the analysis accuracy of the rubber material. The material parameters of each component used in the analysis process are shown in Table 2.
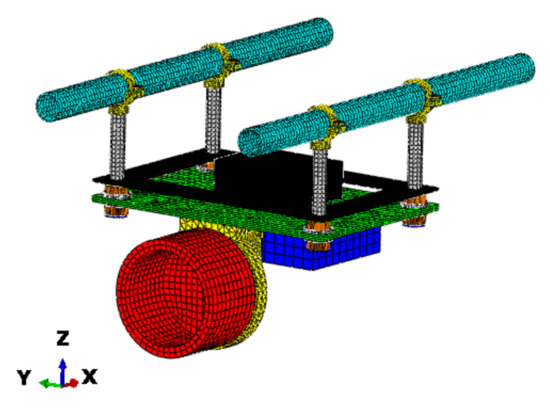
Figure 14.
Finite element model of radar installation damping platform.
Table 2.
Material parameters of various components in the UAV LiDAR installation platform.
For the designed installation platform, the two ends of the UAV bracket are constrained to simulate its boundary conditions on the UAV. The modal analysis of the structure is used to analyze the dynamic characteristics of the radar installation platform and the LiDAR, and the overall structural modal characteristics of the radar installation platform at this time are obtained. The specific modal analysis results are shown in Figure 15 below.
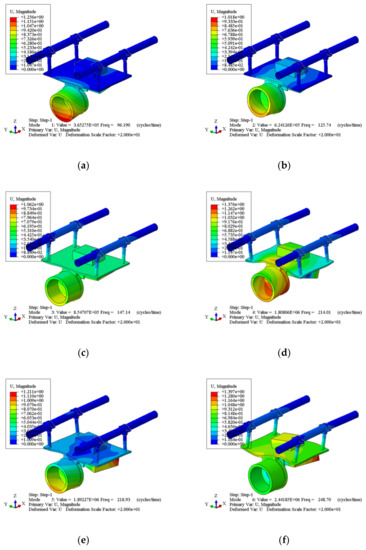
Figure 15.
The first six modes of the UAV LiDAR: (a) First-order mode; (b) Second-order mode; (c) Third-order mode; (d) Fourth-order mode; (e) Fifth-order mode; (f) Sixth-order mode.
At the same time, by analyzing the modal results, the modal frequencies and mode shapes of the first 10 modes included in the frequency components of the actual input operating conditions of the UAV are obtained, as shown in Table 3. Since the modal distribution after the 10th order under the actual input condition, that is, the frequency range of 530–2000 Hz, is the modal mode shape of the non-LiDAR structure, the modes in this range have a significant impact on the dynamic characteristics of the LiDAR. The influence is small, so the main focus is on the first 10 modal conditions.
Table 3.
Modal Frequency and Formation of UAV Radar Installation Platform System (Top 10 Stages).
After modal analysis, the modal distribution of the radar installation platform system can be obtained. Further analysis is required on the modal response of the LiDAR in the overall system, which is the focus of this paper. In different vibration directions, the vibration responses of different modes are different. Through the modal participation factor, we can know the modal order of the installation platform that plays a major role in a certain direction and the modal participation factor of this order. As shown in Figure 16, the participation factor of the first 10 modes in the direction of translational degrees of freedom at the corresponding resonance frequency is shown.
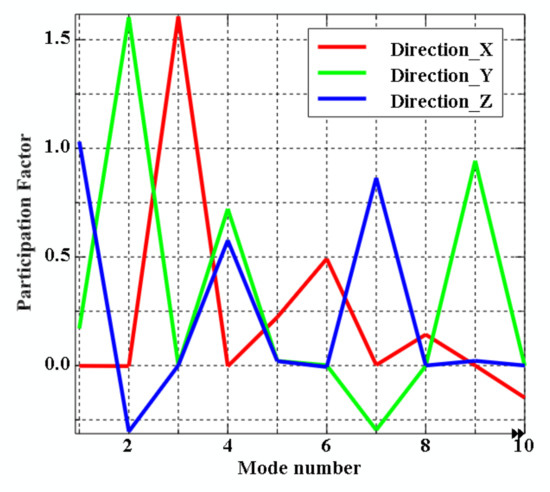
Figure 16.
Translational mode modal participation factor.
Through the modal participation factor, we can clearly see the modal order that affects the three translational degrees of freedom X, Y, and Z. By analyzing the modal order and the modal mode shape, we can obtain the main modal order, the corresponding modal frequency and the participation factor of the three translational degrees of freedom of X, Y and Z, as shown in Table 4.
Table 4.
Order, frequency and participation factors of the basic mode of the radar installation platform.
The modal characteristics of the radar installation platform are obtained through modal analysis. The fundamental modal frequency of the LiDAR in the X translation direction is 96.19 Hz, which corresponds to the first-order mode of the installation platform system. The modal frequency is 147.14 Hz, corresponding to the third-order mode of the installation platform system, and the fundamental modal frequency in the Z translation direction is 125.74 Hz, corresponding to the second-order mode of the installation platform system. Through the analysis results of the modal mode shape, it can be obtained that when the input condition of a certain vibration direction reaches the corresponding frequency, the vibration of the radar installation platform at this time is a resonance phenomenon, and the vibration at the corresponding frequency is the same as the modal mode shape.
5.3. Vibration Test System
The main equipment required for the vibration experiment is shown in Figure 17 below. The acquisition and control part mainly includes equipment such as the signal acquisition instrument, the vibration control instrument, and the power amplifier. The vibration table includes the main body, base, horizontal extension table and vertical extension table.
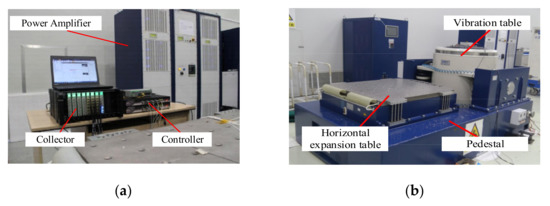
Figure 17.
Main equipment required for vibration test. (a) Vibration signal acquisition and control equipment. (b) Part of the shaker equipment.
After the UAV LiDAR installation vibration reduction platform is installed on the horizontal expansion table of the vibration table through the test tool, an acceleration sensor is attached to the attention position on the radar installation vibration reduction platform to collect the acceleration signal of the attention position, as shown in Figure 18. At the same time, an acceleration sensor is also attached to the position where the test tool is close to the UAV mounting bracket to control the acceleration input signal applied to the UAV bracket.
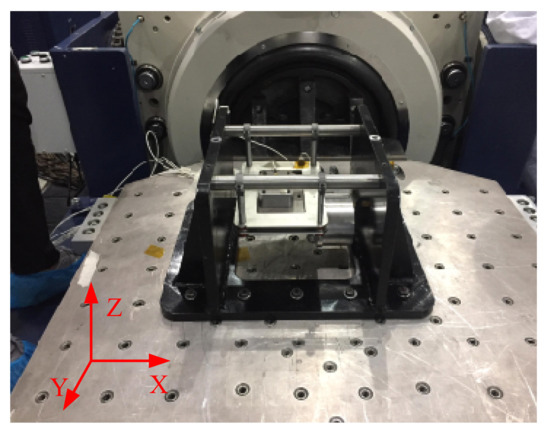
Figure 18.
Vibration table vibration test control principle.
In the vibration test, the vibration conditions are input through the computer, and the vibration signal is transmitted to the power amplifier through the controller for signal amplification, and the vibration table is controlled to generate corresponding vibration. At this time, the vibration condition input by the controller to the position of the control point A1 on the test tool is fed back through the acceleration signal of the control point A1 to form a closed-loop feedback control. The acceleration sensor at the position of interest on the UAV installation platform, that is, the acceleration signal at the response point A6, is transmitted to the operating computer through the acquisition instrument. The above is the vibration test control principle of the shaking table, as shown in Figure 19.
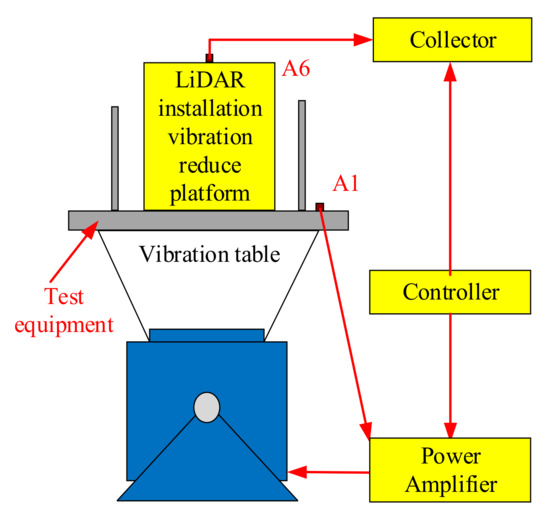
Figure 19.
Vibration test.
After the UAV radar installation vibration reduction platform is installed on the horizontal extension table through the test tool, an acceleration sensor is attached to the attention position on the radar installation vibration reduction platform to collect the acceleration signal of the attention position. At the same time, an acceleration sensor is also attached to the position where the test tool is close to the UAV mounting bracket to control the acceleration input signal input to the UAV bracket.
As shown in Figure 20, the position A1 of the LiDAR measuring point is the position where the test tool is connected to the UAV bracket. This measuring point is used to input accurate vibration signals and provide feedback adjustment for the input signal. The measuring point A2 is the frontal position of the simulated LiDAR load, mainly to obtain the vibration signal of the LiDAR position.
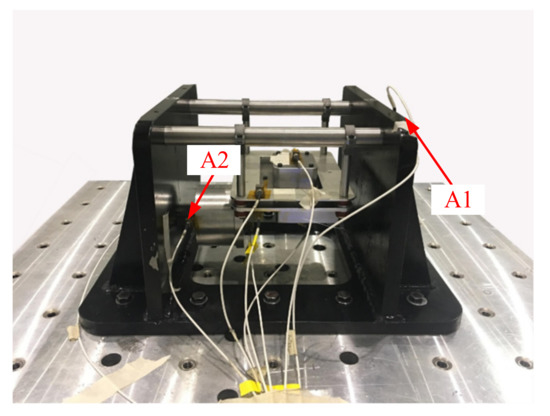
Figure 20.
Distribution of measuring points.
5.4. Vibration Response Simulation and Test Verification
After the finite element pretreatment of installing the vibration reduction platform, the operating conditions are input to be analyzed. At the same time, the test platform is assembled and installed on the vibration table, and the working test conditions are input for testing. The analysis results of the 4–200 Hz LiDAR at the same position as the test point and the vibration response result of the test point A6 on the LiDAR in the test are extracted, and the input conditions of the operating conditions are introduced for comparison, as shown in Figure 21.
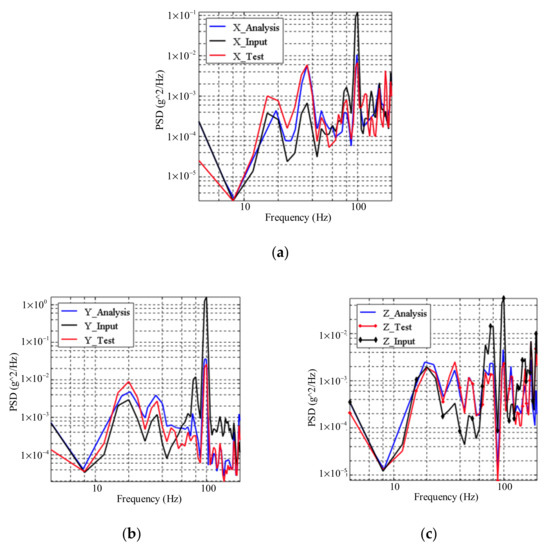
Figure 21.
Comparison of simulation and test results: (a) X direction; (b) Y direction; (c) Z direction.
By comparing the simulation analysis and experimental test results within 200 Hz, it is found that in the low frequency range, the input conditions are amplified, and the analysis results and test results maintain a similar response trend in this range. At the maximum response of the low frequency 100 Hz of the UAV input condition, the analysis and test show the vibration reduction effect. At this frequency, the input vibration response of the UAV is large, and due to the effect of the shock absorber, the transmission to the LiDAR is effectively weakened. The vibration response situation on the upper side can achieve a good vibration reduction effect, which is in line with the basic theoretical laws of vibration reduction.
The simulation and experimental comparison data are summarized, as shown in Table 5. In the frequency range of 200 Hz, the test results show that the root mean square acceleration values in X direction, Y direction and Z direction of the measuring point on the lidar are 0.42 g, 0.57 g and 0.45 g respectively. While the simulation results show that the root mean square acceleration values in X direction, Y direction and Z direction of the measuring point on the lidar are 0.46 g, 0.63 g and 0.49 g respectively. The simulation results are similar to the experimental results. The simulation error in the X direction is 7.14%, the simulation error in the Y direction is 8.77%, and the simulation error in the Z direction is 6.67%. The trend of the curve is consistent with the trend of the test, and both achieve a good vibration reduction effect.
Table 5.
Comparison of simulation and test rms acceleration values.
The vibration test results pay attention to the vibration reduction performance of the platform in the entire frequency range of 4–2000 Hz. In the vibration test, the control point K1 and the measurement point A6 on the LiDAR simulation block are shown in Figure 22 as the frequency domain acceleration power spectral density PSD curve.
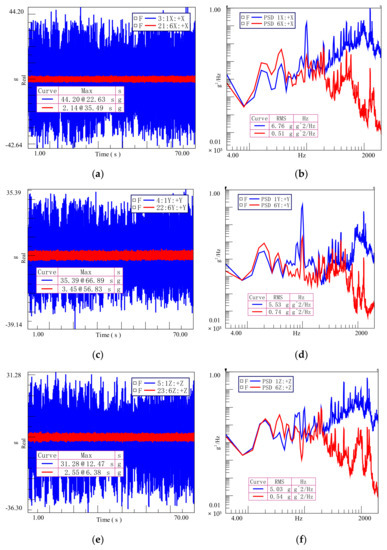
Figure 22.
Time domain response and PSD (power spectral density) curve for acceleration in all directions: (a) Time domain response in the X direction; (b) Frequency domain response in X direction; (c) Time domain response in the Y direction; (d) Frequency domain response in Y direction; (e) Time domain response in the Z direction; (f) Frequency domain response in Z direction.
From the acceleration PSD curve of the position of interest, it can be seen that when the shock absorber is not in use, the frequency response of the measuring point position is mainly reflected in the high frequency vibration response, and the time domain response generated by this vibration response is 38.21 g in the X direction, the Y direction is 37.22 g, the Z direction is 33.46 g, and the root mean square acceleration value is 6.68 g in the X direction, 5.88 g in the Y direction, and 4.80 g in the Z direction, far exceeding the environmental requirements of LiDAR. After the shock absorber is used, the vibration response at high frequencies is isolated and the vibration is greatly reduced. At low frequencies, a vibration response of a certain frequency is generated due to the action of the shock absorber, but the amplitude of this vibration response is small. The influence on the RMS acceleration value of the whole frequency band is small, and finally the overall vibration response is suppressed. It can be seen from the vibration test frequency domain curve that in the acceleration power spectral density curve of the LiDAR measuring point in the three directions of X, Y, and Z, before the low frequency range of 100 Hz, the curve shows a certain amplification effect, but the amplification effect is not outstanding. After 200 Hz, the response curve shows a clear decay trend compared with the input curve.
The time-domain acceleration responses and RMS acceleration values of measuring points A1 and A6 in all directions are shown in Table 6. It can be obtained that the acceleration time-domain responses of the measuring points exceed 30 g and the RMS acceleration when the shock absorber is not in use. The value response is more than 3 g, and the above vibration response conditions far exceed the environmental requirements of LiDAR. After the action of the shock absorber, the time domain response of the measuring point on the LiDAR is 2.77 g in the X direction, 3.64 g in the Y direction, 3.15 g in the Z direction, and the root mean square acceleration value is 0.56 g in the X direction and 0.82 g in the Y direction. The Z direction is 0.54 g, and the time domain response and frequency domain response both meet the requirements of LiDAR. Through calculation, it can be obtained that the vibration reduction efficiency of the shock absorber is 91.62% in the X direction, 86.06% in the Y direction, and 86.06% in the Z direction. 88.75%, with good vibration damping effect in all directions, and the structural vibration damping performance is good.
Table 6.
Comparison of vibration damping performance data.
At the same time, it can be seen from the frequency domain curve of the vibration test that in the frequency range of 2000 Hz, the root mean square acceleration value of the X direction of the measuring point on the LiDAR after the shock absorber is 0.56 g, compared with the X direction of the measuring point in the 200 Hz frequency range. The root mean square acceleration value is 0.42 g, and the root mean square acceleration value in the Y direction is 0.82 g. Compared with the 200 Hz frequency range, the root mean square acceleration value in the Y direction is 0.57 g, and the root mean square acceleration value in the Z direction is 0.54 g. In the frequency range of 200 Hz, the RMS acceleration value of the measuring point in the Z direction is 0.45 g. After the shock absorber acts in each direction, the vibration response of the measuring point on the LiDAR is mainly concentrated within 200 Hz. Therefore, the laws and trends obtained by the simulation analysis within 200 Hz are reliable.
6. Conclusions
In this paper, the Mooney-Rivilin hyperelastic constitutive theory of rubber materials and the generalized Maxwell viscoelastic constitutive theory are combined to establish a hyperelastic-viscoelastic constitutive model for rubber materials. The Mooney-Rivilin hyperelastic model is used to describe the non-linearity of the stress-strain curve during the test. For the viscoelasticity properties, frequency dependence is described using a generalized Maxwell viscoelastic model. The performance parameters of the above two material constitutive models were obtained by fitting the data obtained by the tensile testing machine and the dynamic mechanical testing machine, which were used for the simulation analysis of buffer vibration reduction of a UAV LiDAR vibration reduction system.
Through the aerial fixed-point flight test of the UAV, the vibration input power spectral density curve of the LiDAR installation interface is obtained, which is used for the simulation analysis and experimental test of the radar vibration reduction system. In the laboratory environment, the UAV radar installation vibration reduction platform is designed, and the vibration acceleration response curve on the laser radar is obtained through a random vibration test. The results show that the rubber shock absorber has better vibration reduction effect, and also the accuracy of the finite element simulation results is verified. It is obtained that the maximum time domain response of the measuring point on the LiDAR does not exceed 3.64 g, and the maximum root mean square acceleration value does not exceed 0.82 g. Both the time domain response and frequency domain response meet the requirements of laser. The use of radar requires that the vibration damping device has good vibration damping performance.
In addition, the testing methods and modeling methods of rubber damping materials used in this paper are general and can provide general methods and solutions for the accurate numerical simulation of other similar rubber structures.
Author Contributions
Methodology and Conceptualization, J.F.; Software and Numerical simulation, G.L.; Resources and Investigation, C.F.; Visualization and Original Draft, Z.L.; Project administration and Review & Editing, H.L. All authors have read and agreed to the published version of the manuscript.
Funding
This research was financially supported by the State Key Laboratory of Robotics (2022-Z01, 2022-Z09); National Natural Science Foundation of China (No.51975567); Liao Ning Revitalization Talents Program (XLYC1907152); Natural Science Foundation of Liaoning Province (2019-MS-029, 2021-MS-029); Chinese Academy of Science Youth Innovation Promotion Association (No.2018237) and Development Fund of Space Automation Technology Laboratory, SIA, CAS.
Conflicts of Interest
The authors declare that they have no known competing financial interest or personal relationships that could have appeared to influence the work reported in this paper.
References
- Qin, Y.; Li, Z.L.; Sun, D.G.; Wang, Y.; Sun, B. A Distributed-order Maxwell Constitutive Model for Vibration Isolation SR and its Shock Response. Mech. Sci. Technol. Aerosp. Eng. 2021, 40, 16–21. [Google Scholar]
- He, S.L.; Yu, A.; Ren, J. Study on Rationality of Fractional Derivative Constitutive Model of Rubber Viscoelasticity. J. Kunming Univ. 2020, 42, 78–83. [Google Scholar]
- Du, Y.G.; Fu, Z.H.; Yang, Z.C. The Calculation and Test for a MRD Vibration Isolation System Based on a Modified Ogden Material Model. Spacecr. Environ. Eng. 2017, 34, 265–269. [Google Scholar]
- Zhang, Q.; Shi, J.W.; Suo, S.F.; Meng, G.G. Finite Element Analysis of Rubber Material Based on Mooney-Rivlin Model and Yeoh Model. Synth. Rubber Ind. 2020, 43, 468–471. [Google Scholar]
- Vaiana, N.; Rosati, L. Classification and Unified Phenomenological Modeling of Complex Uniaxial Rate-Independent Hysteretic Responses. Mech. Syst. Signal Process. 2023, 182, 109539. [Google Scholar] [CrossRef]
- Pellecchia, D.; Lo Feudo, S.; Vaiana, N.; Dion, J.-L.; Rosati, L. A Procedure to Model and Design Elastomeric-Based Isolation Systems for the Seismic Protection of Rocking Art Objects. Comput.-Aided Civ. Infrastruct. Eng. 2022, 37, 1298–1315. [Google Scholar] [CrossRef]
- Vaiana, N.; Sessa, S.; Marmo, F.; Rosati, L. An Accurate and Computationally Efficient Uniaxial Phenomenological Model for Steel and Fiber Reinforced Elastomeric Bearings. Compos. Struct. 2019, 211, 196–212. [Google Scholar] [CrossRef]
- Li, X.F.; Yang, X.X. A Review of Elastic Constitutive Model For Rubber Materials. China Elastomers 2005, 1, 52–60. [Google Scholar]
- Pan, X.Y. An Investigation on Calculation and Modeling Methods for Dynamic Properties of a Rubber Isolator. Ph.D. Thesis, Zhejiang University of Technology, Hangzhou, China, 2009. [Google Scholar]
- Arruda, E.M.; Boyce, M.C. A Three-Dimensional Constitutive Model for the Large Stretch Behavior of Rubber Elastic Materials. J. Mech. Phys. Solids 1993, 41, 389–412. [Google Scholar] [CrossRef]
- Mooney, M. A Theory of Large Elastic Deformation. J. Appl. Phys. 1940, 11, 582. [Google Scholar] [CrossRef]
- Sasso, M.; Palmieri, G.; Chiappini, G.; Amodio, D. Characterization of Hyperelastic Rubber-like Materials by Biaxial and Uniaxial Stretching Tests Based on Optical Methods. Polym. Test. 2008, 27, 995–1004. [Google Scholar] [CrossRef]
- Lin, B. A New Model for Hyperelasticity. Acta Mech. 2009, 208, 39–53. [Google Scholar] [CrossRef]
- Yaya, K.; Bechir, H. A New Hyper-Elastic Model for Predicting Multi-Axial Behaviour of Rubber-like Materials: Formulation and Computational Aspects. Mech. Time-Depend. Mater. 2018, 22, 167–186. [Google Scholar] [CrossRef]
- Xiao, Q.S.; Zhao, Y.L.; Jin, Z. On the Equivalent test of Hyper-elastic Constitutive Model for Rubber Material of Absorber. Shipbuild. Ocean Eng. 2018, 47, 126–130. [Google Scholar]
- Han, B.H. Research on Measurement and Application of Rubber Material Constant Based on Mooney-Rivlin Model. Rubber Ind. 2018, 65, 21–25. [Google Scholar]
- Jiang, X.; Yu, L.; Yang, H.; Zhou, W. Shaking Table Test Study of Low-Buried and Unsymmetrical Pressure Tunnels with Rubber Shock Absorber Layer. Geotech. Geol. Eng. 2021, 39, 171–183. [Google Scholar] [CrossRef]
- Korostelev, S.A. Stress–Strain State of Internal Rubber Shock-Absorbing Components in a Small Supporting Roller of a Caterpillar System. Russ. Eng. Res. 2019, 39, 821–826. [Google Scholar] [CrossRef]
- Ju, S.-H.; Yuantien, C.-C.; Hsieh, W.-K. Study of Lead Rubber Bearings for Vibration Reduction in High-Tech Factories. Appl. Sci. 2020, 10, 1502. [Google Scholar] [CrossRef]
- Zeng, Z.; Ahmed Shuaibu, A.; Liu, F.; Ye, M.; Wang, W. Experimental Study on the Vibration Reduction Characteristics of the Ballasted Track with Rubber Composite Sleepers. Constr. Build. Mater. 2020, 262, 120766. [Google Scholar] [CrossRef]
- He, W.; Zou, C.; Pang, Y.; Wang, X. Environmental Noise and Vibration Characteristics of Rubber-Spring Floating Slab Track. Environ. Sci. Pollut. Res. 2021, 28, 13671–13689. [Google Scholar] [CrossRef]
- Wang, B.; Kari, L. Modeling and Vibration Control of a Smart Vibration Isolation System Based on Magneto-Sensitive Rubber. Smart Mater. Struct. 2019, 28, 065026. [Google Scholar] [CrossRef]
- Menga, N.; Bottiglione, F.; Carbone, G. The Nonlinear Dynamic Behavior of a Rubber-Layer Roller Bearing (RLRB) for Vibration Isolation. J. Sound Vib. 2019, 463, 114952. [Google Scholar] [CrossRef]
- Wang, B.; Kari, L. A Nonlinear Constitutive Model by Spring, Fractional Derivative and Modified Bounding Surface Model to Represent the Amplitude, Frequency and the Magnetic Dependency for Magneto-Sensitive Rubber. J. Sound Vib. 2019, 438, 344–352. [Google Scholar] [CrossRef]
- Li, J.Q. Practical numerical algorithm for dynamic response of viscoelastic composite structures. Machinery 2001, 28, 25–26. [Google Scholar]
- Singh, M.; Chang, T.-S. Seismic Analysis of Structures with Viscoelastic Dampers. J. Eng. Mech.-ASCE 2009, 135, 571–580. [Google Scholar] [CrossRef]
- Yajima, T.; Nagahama, H. Differential Geometry of Viscoelastic Models with Fractional-Order Derivatives. J. Phys. Math. Theor. 2010, 43, 385207. [Google Scholar] [CrossRef]
- Ning, W.W.; Chen, L.W.; Sun, L.M. Analysis and comparison of vibration test conditions for naval electronic equipment. Environ. Technol. 2017, 35, 76–80. [Google Scholar]
- Kaihong, Z.; Yunpeng, L.; Congyi, W.; Cheng, L. Non-Circular Gear Modal Analysis Based on ABAQUS. In Proceedings of the 2015 8th International Conference on Intelligent Computation Technology and Automation (ICICTA), Nanchang, China, 14–15 June 2015; pp. 576–579. [Google Scholar]
- Wu, W.Z.; Cheng, L.; Zhang, P. Finite Element Analysis of Rigid Strength of a Spaceborne Radar Electronic Equipment. Electromech. Eng. 2016, 32, 56–59. [Google Scholar]
- Vaiana, N.; Sessa, S.; Marmo, F.; Rosati, L. Nonlinear Dynamic Analysis of Hysteretic Mechanical Systems by Combining a Novel Rate-Independent Model and an Explicit Time Integration Method. Nonlinear Dyn. 2019, 98, 2879–2901. [Google Scholar] [CrossRef]
- Vaiana, N.; Capuano, R.; Rosati, L. Evaluation of Path-Dependent Work and Internal Energy Change for Hysteretic Mechanical Systems. Mech. Syst. Signal Process. 2023, 186, 109862. [Google Scholar] [CrossRef]


Publisher’s Note: MDPI stays neutral with regard to jurisdictional claims in published maps and institutional affiliations. |
© 2022 by the authors. Licensee MDPI, Basel, Switzerland. This article is an open access article distributed under the terms and conditions of the Creative Commons Attribution (CC BY) license (https://creativecommons.org/licenses/by/4.0/).