Abstract
In addressing the design challenges for constant-stress accelerated life testing in non-rectangular experimental domains, we aim to optimize the precision in estimating parameters for the product reliability statistical model. Following the principles of regression orthogonal design theory to determine the combinations of stress levels, we constrain the maximum stress levels of each experimental stress along the boundary curve of the non-rectangular experimental domain. The remaining stress levels and the allocation ratios of specimens for each test serve as design variables in the optimization process. We establish a mathematical model for the optimal design of constant-stress accelerated life testing in non-rectangular experimental domains. The results of the optimized design for comprehensive stress accelerated life testing in non-rectangular experimental regions of aerospace electrical connectors indicate that, with the same sample size, the optimized testing scheme not only enhances the precision of model parameter estimation but also reduces the number of required tests. At an equivalent number of tests and testing duration, the optimization scheme proposed in this study demonstrates an improvement of over 63% in the precision of model parameter estimation compared to the EM-optimized testing scheme in non-rectangular experimental regions. Using the mean, standard deviation, and coefficient of variation of the determinant values of the information matrix as criteria for evaluating the precision and robustness of experimental designs, a simulated evaluation was conducted for the optimized experimental design, a conventional experimental design, and an EM experimental design. The results indicate that the optimal experimental design outperforms both the conventional experimental design and the EM experimental design in terms of precision and robustness.
1. Introduction
To rapidly assess the reliability characteristics of long-life electromechanical products under operational conditions, engineers often employ comprehensive stress constant acceleration life testing. When designing such tests, it is commonly assumed that the stress levels span all values between normal stress and the highest stress level. If a Cartesian coordinate system is established with two stresses as axes, the range of test stresses (experimental domain) forms a rectangular region [1,2]. In the rectangular experimental domain defined by two stress levels (temperature and humidity), Liu and Kou [3] employed a uniform orthogonal experimental method to determine the stress combinations. Using the median life asymptotic variance (V-Optimal) under normal stress levels of the rudder system as the objective function, they optimized the original accelerated testing scheme for the rudder system and subsequently redefined the accelerated life testing plan for the rudder system. Shah Limon [4] investigated carbon film resistance, selecting temperature and electrical stress as experimental stresses. With these two stress levels combined within a rectangular region, the optimization principle based on V-Optimal was employed. The design variables included testing time intervals, testing frequencies, stress levels, and sample allocation ratios at each stress level. Multiple stress factors and their interactions were considered, leading to the establishment of a mathematical model for the optimization design of accelerated testing schemes. Case studies were conducted to validate its rationality. Wang [5] focused on the study of cylinders, employing the minimum asymptotic variance of the maximum likelihood estimator as the design principle. Temperature and frequency were chosen as experimental stresses, and the stress level combinations were determined within a rectangular experimental region. An optimized model for the stepped-stress accelerated life testing of cylinders was established. The feasibility of the optimized model and the stepped-stress accelerated life testing method in cylinder life assessment was verified through the analysis of experimental data, comparison of extrapolation accuracy, and testing efficiency between the optimized and traditional theories. Guo [6] utilized temperature and humidity as stress factors in the accelerated testing scheme. Within the rectangular experimental region formed by these two stress levels, the accelerated testing scheme was optimized using the D-Optimal criterion. The resulting optimal scheme significantly enhanced the precision of model parameter estimation. Chen and other scholars [7] focused on a type of electronic device on high-speed trains, selecting temperature and vibration as experimental stresses. Within a rectangular experimental region formed by these two stress levels, a D-Optimal-based optimization design method was proposed. This method optimized the constant-stress degradation testing scheme, and its effectiveness was validated through case studies. The optimal testing scheme not only achieved an equivalent precision in model parameter estimation but also reduced the testing time. Kangwon Seo [8] conducted a study on electronic devices, optimizing the accelerated testing scheme within a rectangular experimental region formed by temperature and humidity as stress factors. The optimization design criterion employed was based on D-Optimal principles. Duan [9] focused on the motor spindle in numerically controlled machine tools. They employed two optimization criteria: D-Optimal and the minimization of the mean square error of the average life under normal stress conditions. The experimental stresses included spindle speed and radial force. Within the rectangular experimental region formed by these two stress levels, stress level combinations were determined. The constant stress accelerated degradation testing scheme was then optimized, resulting in an optimal accelerated degradation testing plan. The rationality of this approach was validated through numerical examples.
For constant stress accelerated testing with two stresses on a non-rectangular experimental domain, traditional designs based on comprehensive stress constant acceleration life testing methods may not guarantee feasible solutions. Given this, some scholars have initiated research on the design methods for constant stress accelerated life testing in non-rectangular experimental domains. Escobar and Meeker [10] conducted a study on the design of constant stress accelerated testing schemes on non-rectangular experimental domains formed by removing the upper-right corner of a rectangular experimental region through equivalent lines of linear failure physical equations. They provided corresponding optimization design methods. Chen [11] et al. extended the design principles of Escobar and Meeker to non-rectangular experimental domains with general boundary shapes, establishing an EM-based optimization design method for constant stress accelerated testing schemes. However, the above-mentioned studies only propose a method to theoretically obtain statistically optimal experimental designs on non-rectangular experimental domains with given boundary shapes without considering the practical effectiveness of these optimal designs. As the research on accelerated testing schemes continues to advance, the rationality of experimental design and optimization requires validation through simulated evaluations of the testing schemes [12]. In light of this, numerous scholars, both domestically and internationally, have initiated research on the simulated evaluation of testing schemes [13,14]. Utilizing the Monte Carlo simulation method, the study conducts simulated evaluations on different accelerated testing schemes, as well as the optimal testing schemes obtained through optimization design, considering both robustness and estimation precision [15]. Chen et al. [16,17,18] proposed and investigated a simulation evaluation method for accelerated life testing schemes, utilizing the asymptotic variance of the median life estimate as the basis for assessing the superiority or inferiority of experimental designs. They further applied Monte Carlo simulation to evaluate the proposed optimal testing scheme. The evaluation metric focused on the asymptotic variance of the median life at normal stress levels. The results indicated that the proposed scheme was optimal when k = 5.
In summary, this paper focuses on the widely applicable linear-extremum model for electromechanical products, with the sole objective of achieving the highest precision in model parameter estimation (i.e., D-Optimal condition). Based on the proposed criteria for determining the optimal stress level combinations, the theoretical framework and methodology for optimizing the design of constant stress life testing schemes in non-rectangular experimental domains are discussed. This method is applied to design optimal testing schemes for comprehensive stress in electrical connectors, considering different numbers of stress combination points (i.e., 3, 4, and 5). After obtaining the optimal experimental scheme, a Monte Carlo simulation was employed to assess the precision and robustness of each experimental scheme at k = 5. The evaluation was based on the determinant value of the Fisher information matrix, providing an alternative perspective to validate the rationality of the optimal experimental scheme for non-rectangular constant stress testing considering parameter estimation precision.
2. Statistical Model
For accelerated life testing with dual stresses in non-rectangular test regions, assuming a consistent failure mechanism across different stress combinations, the statistical model for the lifespan of electromechanical products can be characterized by the following linear-extremal model [19,20]:
- (1)
- For all stress level combinations (test points) within the test area, product life (i.e., ) is statistically independent and is subject to extreme value distribution [21,22]; the probability density function of the product life is as follows:where and are the position and scale parameters, respectively;
- (2)
- In the test area, the position parameter and the test stresses and satisfy the following conditions:where , and are model parameters. The test stress and are transformed stress;
- (3)
- The scale parameter remains unchanged under all combinations of stress levels in the test;
- (4)
- For the constantly accelerated life test with failure-terminated testing, the censored time for each stress level combination is .
3. Optimization Criteria for Comprehensive Stress Accelerated Life Testing Schemes in Non-Rectangular Experimental Domains
3.1. Standardization of Test Stress
To ensure easy statistical processing as well as make the obtained result more representative for all cases, test stresses and are standardized.
Let
where and are normal stress levels, and are the highest stress levels.
Then, under normal stress levels and , and . Under the highest stress levels that the test stress can be subjected to, and . In addition, under test stress level combination ( and ), Equation (2) can be characterized as:
where , , .
The standardized stresses and are used as the abscissa and ordinate to establish a rectangular coordinate system, as shown in Figure 1. In general, the stress boundary curve defined in the test can be represented by the equation .

Figure 1.
The standardized non-rectangular region.
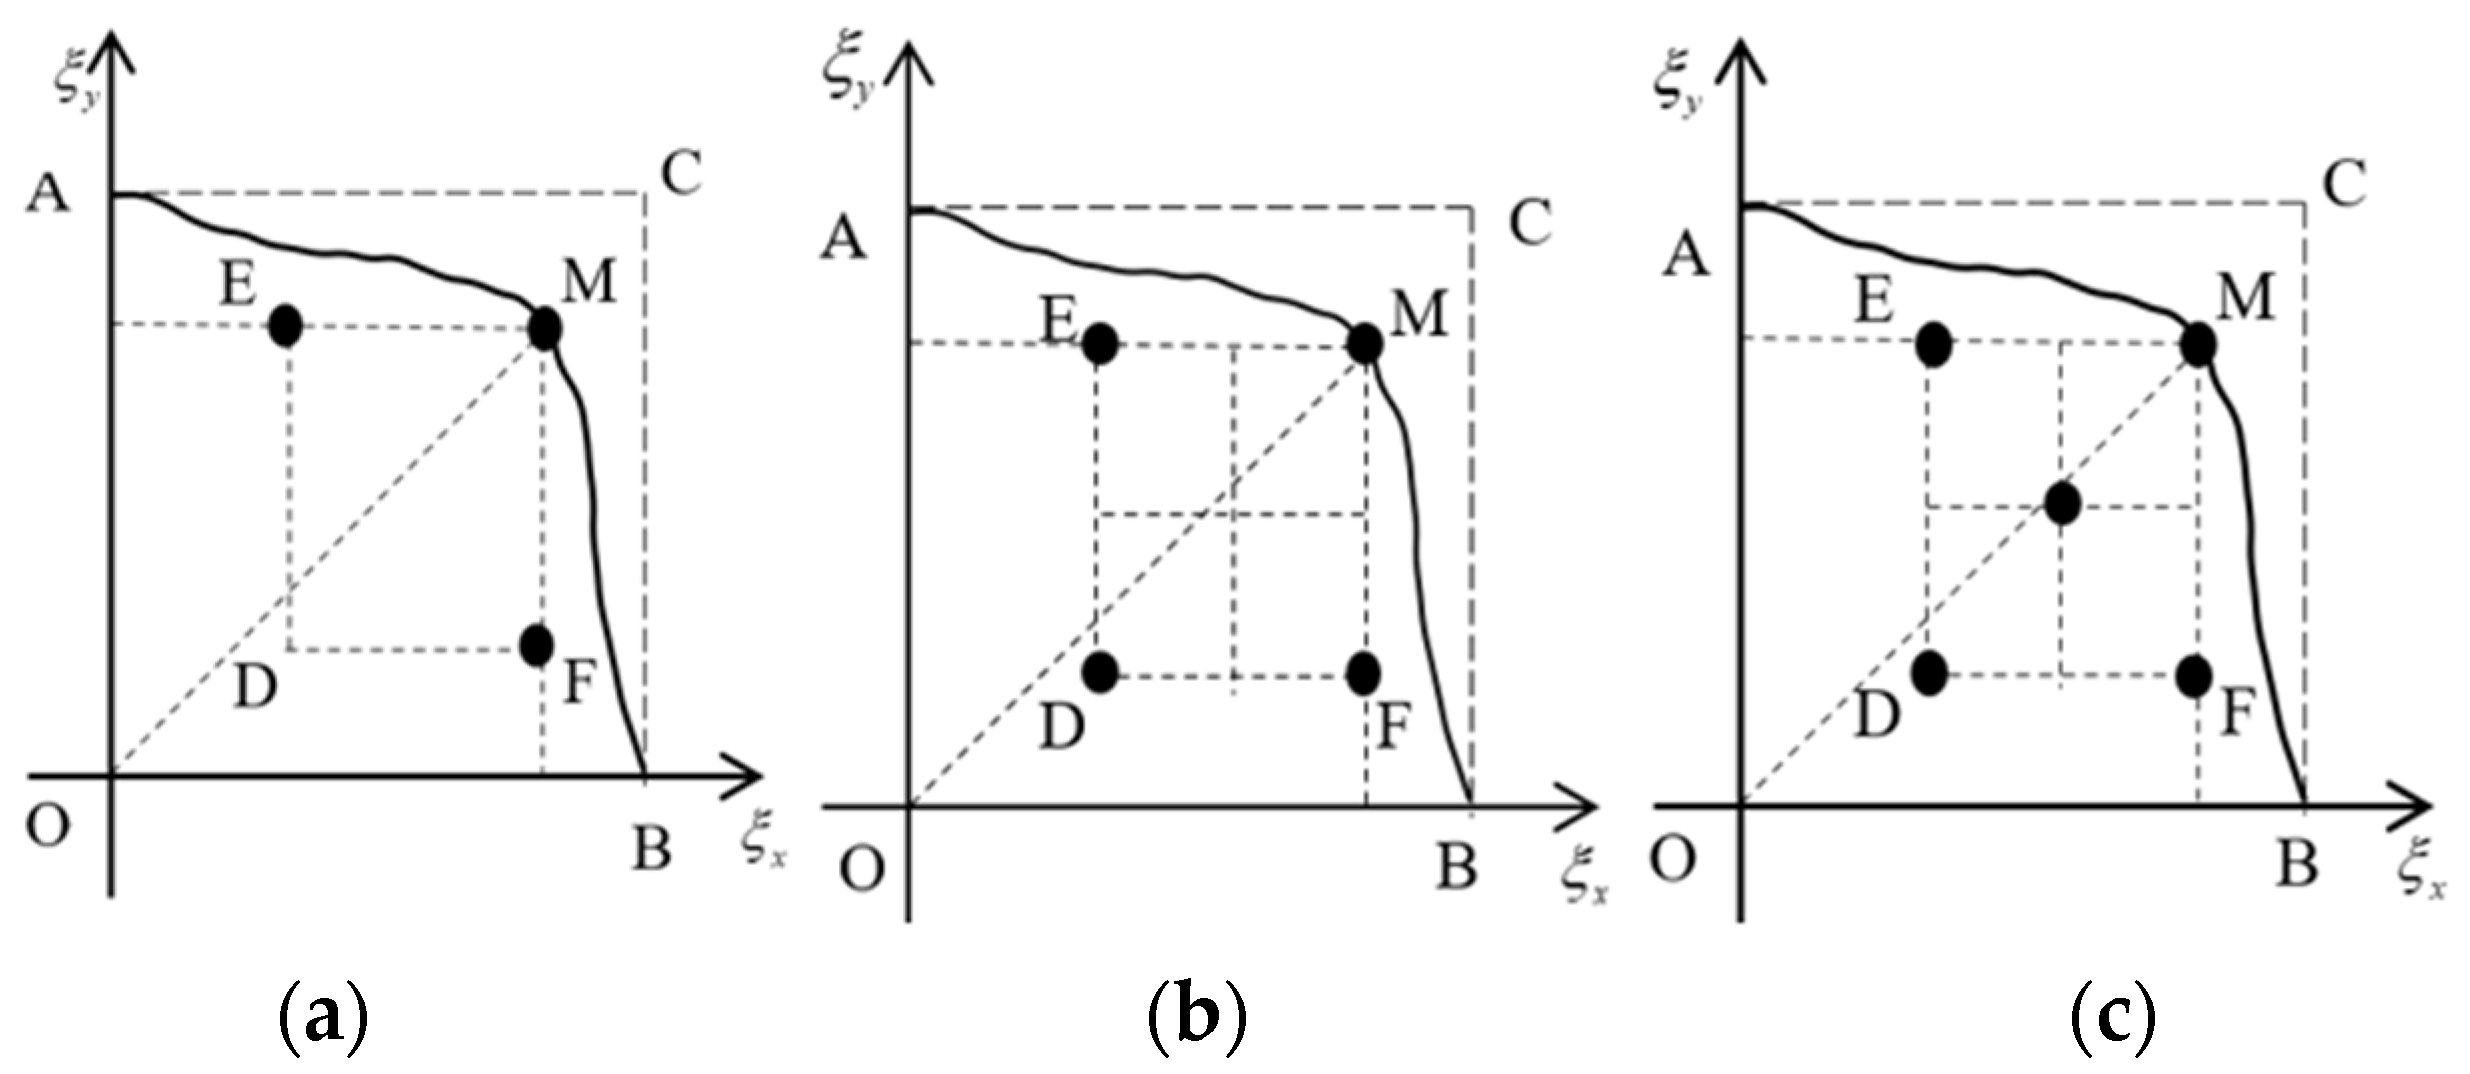
3.2. Combined Mode of Test Stresses
In order to reduce the number of experiments while maintaining comparable precision, it is imperative to ensure the feasibility and cost-effectiveness of the experimental design. We combined two stress levels based on the regression orthogonal design theory [23] according to real-life experiments in the engineering practice. The combinations are shown in Figure 2, wherein the black dot represents test points of the stress level combination.
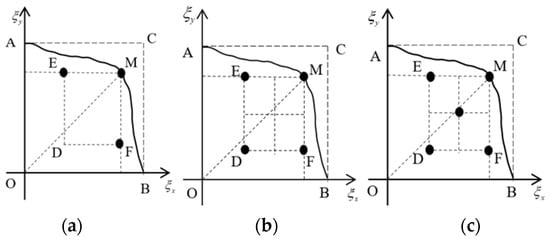
Figure 2.
The combined mode of stresses. (a) Three test points (b) Four test points (c) Five test points.
Taking K = 5 as an example, the standardized test stress levels can be represented as follows:
3.3. Criteria for Selection of Maximum Test Stress Point
While maintaining an unchanged failure mechanism, a higher selection of the maximum stress level leads to reduced variance in the estimated model parameters, consequently resulting in enhanced accuracy of the model parameter estimates [24]. For the accelerated life test in a non-rectangular test area, the highest stress level of the test is confined to the curve , and the highest stress level combination and satisfy the equation .
4. Mathematical Model for Optimization Experimental Design
4.1. Objective Function for the Optimization Design of Experimental Schemes
4.1.1. Likelihood Function of Accelerated Life Test of K Group of Test Stress Level Combination
We assume that, at th test stress level combination, samples are subjected to a failure-terminated life test. If the th sample fails at time, then for the linear-extreme model, the log-likelihood function is as follows:
where . If the sample has not failed by the end of the censored time , then its log-likelihood function is as follows:
where .
Let the indicator function be defined. If the failure time of the th sample satisfies , then ; otherwise . If and , then the likelihood function of the th sample of stress level combination can be expressed as follows:
If out of the samples fails before the censored time, the log-likelihood function under the th test stress level combination is as follows:
In summary, for the accelerated life test with failure-terminated testing and group of stress level combination, its log-likelihood function can be expressed as follows:
4.1.2. Standardized Information Matrix of Model Parameter
Information matrix of model parameters , , , and is given as follows:
As the information matrix is the mathematical expectation of the negative second-order partial derivative of the likelihood function [25], the standardized information matrix can be obtained using Equation (4) as follows:
where ,
Then, the standardized information matrix of the model parameters can be expressed as follows:
4.1.3. Objective Function
Under the test stress levels combination, if the total number of test samples is given, and assuming that the proportion of the sample input for each test is , then the sample number for each test is . Consequently, the information matrix can then be expressed as follows:
It has been proven in previous studies [6,10] that the confidence interval for estimated model parameters under a certain confidence level is inversely proportional to the arithmetic square root of the value of the Fisher information matrix determinant. Therefore, the greater the value of the information matrix determinant, the higher the accuracy of the estimated model parameters. In order to generalize the test result, the estimation precision of the model parameters is represented by the value of the information matrix determinant . Thus, the objective function can be expressed as follows:
4.2. Selection of Design Variables and Constraint Conditions in Experimental Design
For the optimization of the test plan in the case of non-rectangular test areas, under the condition that rough estimates , , , and of the model parameters are known, and when the censored time , total number of test samples , number of tests , and normal stress level point (point in Figure 1) are given, the value of the objective function completely depends on the highest stress level point in the non-rectangular test area, remain in stress level combination points, and their corresponding sample distribution proportions .
- (1)
- The stress level of each test satisfies the following:
- (2)
- The sample distribution proportion for each stress level combination must satisfy the following:
- (3)
- The highest stress level must meet the following condition:
4.3. Determination Method for Optimization Design Plan of Non-Rectangular Test Area
Any point on the stress boundary curve is considered the highest stress level point of the test plan; in addition, stress level combinations are restricted to the rectangular area with OM as the diagonal (as shown in Figure 1). According to the determined stress level combination, with the objective of achieving the highest accuracy of model parameter estimation, the other stress levels and corresponding sample distribution proportions are optimized to obtain the test plan. Furthermore, the value of the objective function at each point on the stress boundary curve is compared. Finally, the test plan with the maximum value of the objective function is considered the optimal test plan.
5. Theoretical Framework and Methodology for the Simulated Evaluation of Constant Stress Accelerated Testing Schemes in Non-Rectangular Domains
5.1. Criteria and Estimation Theory for the Simulated Evaluation of Experimental Schemes
In order to rationally evaluate non-rectangular constant stress testing schemes that consider parameter estimation precision, as well as the optimal testing schemes obtained through optimization design, we similarly utilize the determinant value of the Fisher information matrix as the basis for assessing the merits of testing schemes. The expected value and standard deviation of the determinant value of the Fisher information matrix (denoted as ) are employed as evaluation criteria for the precision and robustness of the testing scheme [26]. The larger the expected value of the determinant of the Fisher information matrix (denoted as ), the better the precision of the model parameter estimation in this experimental scheme. A smaller standard deviation indicates a more stable estimation of model parameters. To avoid the influence of different dimensions or the significant difference in average values on the assessment of the standard deviation, the coefficient of variation is employed here to appropriately measure the relative magnitude of their respective dispersion. A smaller coefficient of variation indicates a more stable estimation of model parameters in the experimental scheme [24].
The stresses (after standardization) of each constant-stress accelerated life test in the non-rectangular test region are and , the sample size of each test is , and the censored time of the test is . So, for the i-th test, if samples fail until the end of the censored time of the test , its failure times are , respectively. If another sample will fail in , then the logarithmic likelihood function in the form of extreme value distribution is
where , .
The maximum likelihood estimates of model parameters , , , and can be obtained by utilizing the aforementioned logarithmic likelihood function.
5.2. Simulation Evaluation Method for Constant Stress Accelerated Testing Schemes in Non-Rectangular Domains
In this paper, the Monte Carlo simulation method is used to obtain the life data satisfying the two parameters of the Weibull distribution of each test plan. In order to ensure a certain accuracy, the sampling number N = 1000 is now specified. Considering the estimation precision of model parameters, the specific steps of simulation evaluation of the constant-stress test plan in a non-rectangular area are as follows:
- (1)
- According to the previous test results, the rough estimate of initial values that are based on the reliability of statistical model parameters of the electrical connector can be obtained by calculation. And they are , , and ;
- (2)
- Simulate the generation of a set of lifetime data following a two-parameter Weibull distribution as represented in Equation (1). In addition, the sample size, censoring time, and total sample size are consistent with each test plan;
- (3)
- Using the simulated data generated in Step 2 as the experimental data for the simulation evaluation of the test plan and employing the theory of maximum likelihood estimation, obtain pseudo-maximum likelihood estimates for the model parameters, denoted as , , and ;
- (4)
- The pseudo-maximum likelihood estimations of the model parameters obtained by Step 3 are substituted by Equation (5), and the pseudo estimation of the determinant of the Fisher information matrix is obtained;
- (5)
- Repeat Step 2, Step 3, and Step 4 1000 times to obtain 1000 groups’ pseudo-maximum likelihood estimations of model parameters and pseudo estimations of the determinant of the Fisher information matrix. And they are , … ;
- (6)
- The mean value, standard deviation, and coefficient of variation of the pseudo estimation of the determinant of the Fisher information matrix for a constant-stress accelerated test plan in a non-rectangular area are obtained.
- (7)
- Based on the mean, standard deviation, and coefficient of variation of the pseudo-estimated determinant values of the Fisher information matrix for the experimental scheme, the assessment of the superiority or inferiority of the testing scheme is comprehensively evaluated in terms of accuracy and stability. The larger the mean value of the determinant of the information matrix, the higher the precision of the model parameter estimation in the scheme, and the smaller the standard deviation, the better the robustness of the scheme. In cases where the means differ significantly, the smaller the coefficient of variation of the determinant of the Fisher information matrix, the better the robustness of the model parameter estimation.
6. Examples
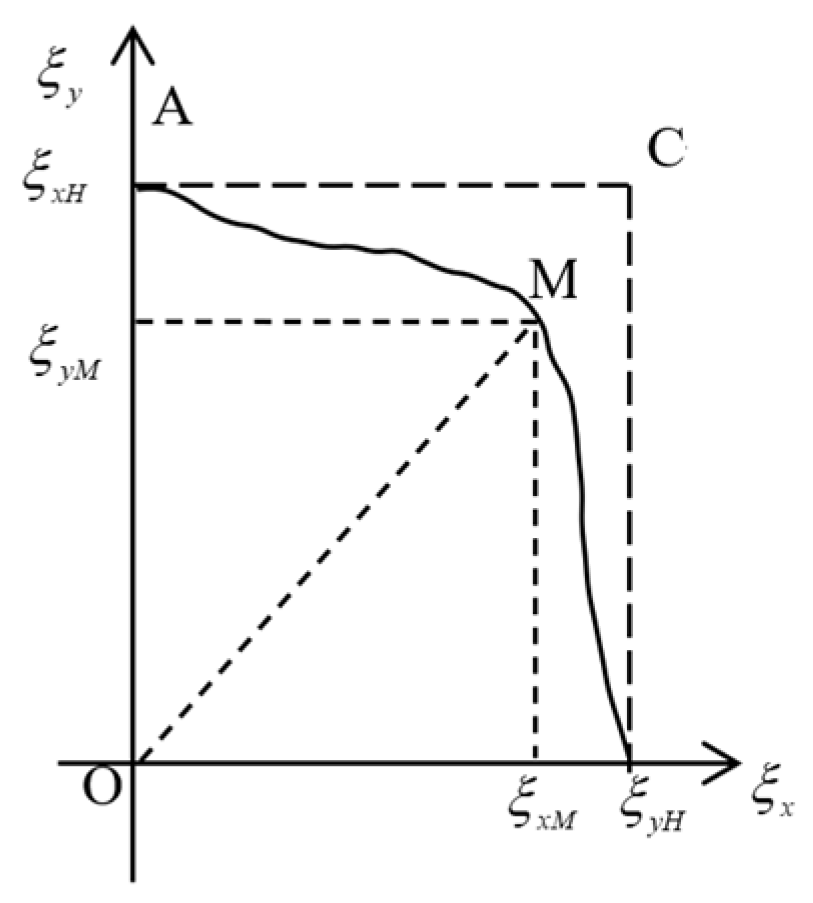
The failure mechanism of an electrical connector under the combined effects of temperature and vibration stress is that the trough filling of fretting wears corrosives at contact pairs, and surfaces contaminated by corrosives increase resistance, leading to contact failure. Thus, its reliability statistical model can be expressed as a linear-extreme model given by Equations (1) and (2). In the reliability evaluation test to assess the performance of the electrical connector, when the temperature stress is taken as the highest level, i.e., °C, and the vibration stress is taken as the highest level, i.e., [27]. The electrical connector has contact pairs transient interruption and insulation resistance that exceed the standard values; therefore, its failure mechanism changes, i.e., temperature and vibration stress cannot be taken as their maximum value simultaneously. Considering the limitation that the failure mechanism cannot be changed, after several diagnostic tests, it was found that the temperature and vibration stress satisfy the boundary curve AMB shown in Figure 3, leading to a non-rectangular test area OAMB where the abscissa represents the standardized temperature stress level, while the ordinate represents the vibration stress level [28]. The equations for the test stress boundary curve in Figure 3 are as follows:
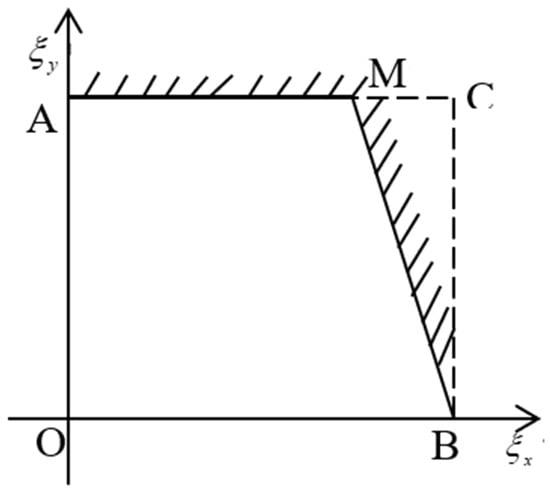
Figure 3.
Diagram of calculation example.
6.1. Optimization Design of Constant-Stress Accelerated Test Scheme in Non-Rectangular Region
According to the previous test results, the estimated values of the model parameters are as follows: , , , and , while the censored time and number of samples .
The following list introduces each test plan listed in Table 1 and presents the key findings:

Table 1.
Result of calculation example.
- (1)
- The design method is optimized based on the above-mentioned test plan. The optimal test plan for multiple stresses of the electrical connector is designed under the test stress combination points = 3, 4, 5. To show the feasibility of this method, the optimal test plan is compared with the unoptimized general test plan stated in the literature [29]. The test plans and objective function values are shown in Table 1;
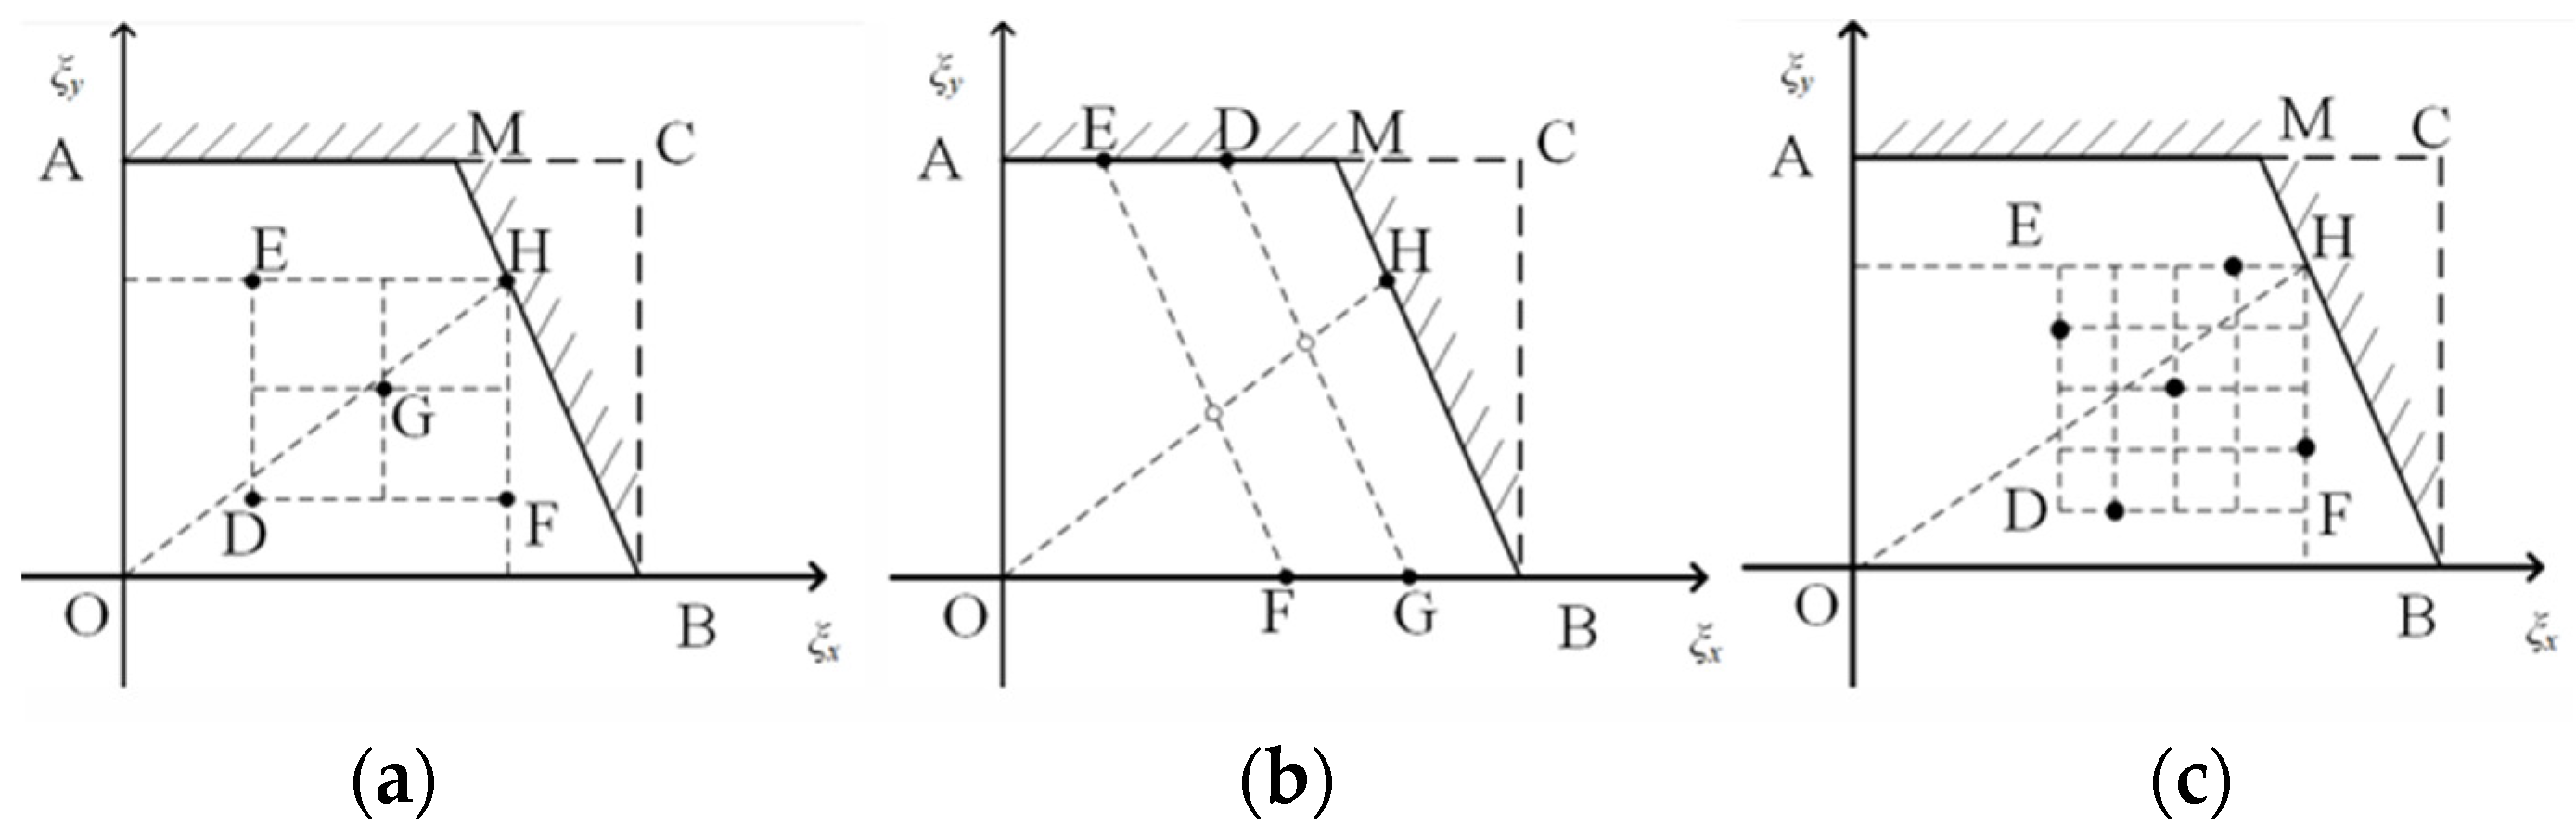
- (2)
- According to the test optimization method (EM method) that is based on the design ideas of Escobar and Meeker in the literature [11], the EM test plans are calculated for examples when K = 3, 4, 5. Taking K = 5 as an example, the experimental design results for the three methods are depicted in Figure 4 (the five black dots represent stress combination points);
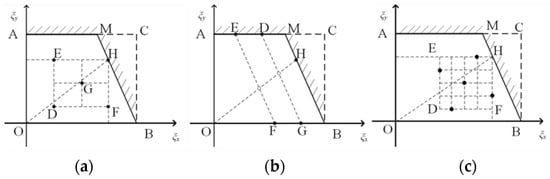 Figure 4. The design points with different methods. (a) EM test plan (b) General test plan (c) Optimal test plan.
 - (3)
- Comparing the objective function values listed in Table 1, it can be observed that, in the case of the same accuracy of model parameter estimation, our proposed optimal test plan saves about 65% of the test sample volume compared with the unoptimized general test plan. Assuming that the duration and number of tests are controlled, the optimal test plan increases the accuracy of the model parameter estimation by 68 times, 49 times, and 71 times for , respectively; in contrast, the general test plan obtained using the EM method increases the accuracy of the model parameter estimation only by 63%, 200%, and 84% when , respectively.
6.2. Simulation Evaluation and Results Analysis of Constant-Stress Accelerated Test Plan in Non-Rectangular Region
According to the results of the statistical analysis of the data of the previous test [30], the initial values of the reliability statistical model parameters of a certain type of electrical connector are as follows: , , , . Therefore, the general test plan, the EM test plan, and the optimal test plan of K = 5 in Table 1 are simulated and evaluated, and the results of the simulation evaluation are shown in Table 2.
Table 2.
Results of constant-stress accelerated test plan in non-rectangular region.
It can be seen from Table 2 that under the condition of the same sample size, the average value of the determinant of the Fisher information matrix of the optimal test plan, EM test plan, and general test plan is quite different. The average value of the determinant of the information matrix of the optimal test plan is nearly 71 times that of the general test plan, and the coefficient of variation of the former is lower than that of the latter by 3%. The average value of the determinant of the information matrix of the optimal test plan is nearly 1.8 times that of the EM test plan, and the coefficient of variation of the former is lower than that of the latter by 2%. Compared with the general test plan, the mean value of the EM test plan is nearly 39 times that of the latter, and the coefficient of variation of the EM test plan is 1% lower than that of the latter. The simulation results demonstrate that: 1. the coefficient of variation can be used as an index to evaluate the robustness of the test plan when the differences between data of the test plans are large; 2. the optimal test plan is better than EM test plan and general test plan in terms of estimation accuracy and robustness. And it is in line with the engineering practice.
7. Conclusions
In this study, after determining the combination of stress levels within the non-rectangular experimental domain based on the regression orthogonal design theory and targeting the highest precision in model parameter estimation, the experimental scheme’s maximum stress level points were constrained to the boundary curve of the non-rectangular experimental domain. The remaining stress levels and their sample allocation ratios were taken as optimization design variables. A mathematical model was established for the optimization design of accelerated life testing schemes in non-rectangular experimental domains. The optimization results of accelerated life testing schemes in the non-rectangular experimental domain under the influence of temperature and vibration stress for electrical connectors demonstrate that, compared to the results of the experimental optimization method based on the design principles of Escobar and Meeker, the optimal scheme proposed in this paper improves the precision of model parameter estimation by over 63% at the same number of experiments and duration. Compared to the non-optimized conventional experimental scheme, at the same level of estimation precision, the optimal scheme proposed in this paper saves approximately 65% of the experimental sample size. Simultaneously, a simulation evaluation was conducted on the conventional experimental scheme, the EM experimental scheme, and the optimal experimental scheme proposed in this paper at K = 5. The results indicate that, at the same level of experimental sample size, the robustness of the model parameter estimation in the optimal experimental scheme is 3% higher than that in the conventional experimental scheme. Moreover, the precision of model parameter estimation in the optimal experimental scheme far surpasses that in the conventional experimental scheme. At the same level of experimental sample size, the optimal experimental scheme exhibits significantly higher precision in model parameter estimation compared to the EM experimental scheme. Additionally, the robustness of model parameter estimation in the optimal experimental scheme is 2% higher than that in the EM experimental scheme. The optimal experimental scheme in the non-rectangular constant stress testing, considering parameter estimation precision, is capable of meeting practical engineering requirements.
Author Contributions
Conceptualization, P.Q. and Z.F.; methodology, P.Q. and Z.F.; validation, G.Z. and J.Z.; formal analysis; sourcing, G.Z.; data curation, Z.F.; writing—original draft preparation, Z.F.; writing—reviewing and editing, Z.F.; supervision, W.C. All authors have read and agreed to the published version of the manuscript.
Funding
This study was supported by Zhejiang Provincial Key Research and Development Program (2021C01133).
Data Availability Statement
The data that has been used are confidential.
Acknowledgments
The completion of this study is due to the collaborative efforts of several co-authors.
Conflicts of Interest
The authors declare that there are no conflicts of interest regarding the publication of this article.
Abbreviations
| product life | |
| position parameters | |
| scale parameters | |
| ,, | model parameters |
| , | transformed stress |
| censored time | |
| , | normal stress levels |
| , | the highest stress levels |
| , | standardized stresses |
| test points of the stress level combination | |
| log-likelihood function | |
| indicator function | |
| ,, | model parameters |
| information matrix | |
| total number of test samples | |
| the proportion of the sample input for each test | |
| objective function | |
| the highest stress level point of the test plan | |
| the pseudo estimation of the determinant of the Fisher information matrix | |
| mean value of the pseudo estimation of the determinant of the Fisher information matrix | |
| standard deviation of the pseudo estimation of the determinant of the Fisher information matrix | |
| coefficient of variation of the pseudo estimation of the determinant of the Fisher information matrix |
References
- Lei, H.; Cao, C.; Tongyue, G.; Cheng, L.; Chengwei, F.; Yongjun, Z.; Yan, H. Probability-based service safety life prediction approach of raw and treated turbine blades regarding combined cycle fatigue. Aerosp. Sci. Technol. 2021, 110, 106513. [Google Scholar]
- Meeker, W.Q. Accelerated Testing: Statistical Models, Test Plans, and Data Analyses. Technometrics 2012, 33, 236–238. [Google Scholar] [CrossRef]
- Liu, A.; Kou, K. Optimization design of rudder system accelerated life test scheme. Ship Electron. Eng. 2015, 35, 112–115. [Google Scholar]
- Limon, S.; Rezaei, E.; Yadav, O.P. Designing an accelerated degradation test plan considering the gamma degradation process with multi-stress factors and interaction effects. Qual. Technol. Quant. Manag. 2020, 17, 544–560. [Google Scholar] [CrossRef]
- Wang, D.; Chen, J. Research and application of double stress cross step accelerated life test. Qual. Reliab. 2019, 4, 35–39 + 45. [Google Scholar]
- Guo, H.; Pan, R. D-optimal reliability test design for two-stress accelerated life tests. In Proceedings of the IEEE International Conference on Industrial Engineering & Engineering Management, Singapore, 2–4 December 2007. [Google Scholar]
- Yunxia, C.; Wenbin, S.; Dan, X. Multi-Stress Equivalent Optimum Design for Ramp-Stress Accelerated Life Test Plans Based on D-Efficiency. IEEE Access 2017, 5, 25854–25862. [Google Scholar]
- Kangwon, S.; Rong, P. Planning accelerated life tests with multiple sources of random effects. J. Qual. Technol. 2022, 54, 162–183. [Google Scholar]
- Duan, F.; Wang, G. Optimal design for constant-stress accelerated degradation test based on gamma process. Commun. Stat.-Theory Methods 2019, 48, 2229–2253. [Google Scholar] [CrossRef]
- Escobar, L.A.; Meeker, W.Q. Planning Accelerated Life Tests With Two or More Experimental Factors. Technometrics 2012, 37, 411–427. [Google Scholar] [CrossRef]
- Chen, W.; Gao, L.; Liu, J.; Qian, P.; Pan, J. Optimal design of multiple stress constant accelerated life test plan on non-rectangle test region. Chin. J. Mech. Eng. 2012, 25, 1231–1237. [Google Scholar] [CrossRef]
- Pan, R.; Yang, T.; Seo, K. Planning Constant-Stress Accelerated Life Tests for Acceleration Model Selection. IEEE Trans. Reliab. 2015, 64, 1356–1366. [Google Scholar] [CrossRef]
- El-Raheem, A.M.A.; El-Din, M.M.M.; Ali, N.S.A.; Abu-Youssef, S.E. Optimal Plans of Constant-Stress Accelerated Life Tests for the Lindley Distribution. J. Test. Eval. 2016, 45, 20150312. [Google Scholar]
- Chen, W.; Zhu, Z.; Gao, L.; Pan, J.; Kong, X. Optimization design method of constant stress life test in non rectangular test area based on uniform design theory. China Mech. Eng. 2016, 27, 2064–2068. [Google Scholar]
- Wu, S.-J.; Huang, S.-R. Planning two or more level constant-stress accelerated life tests with competing risks. Reliab. Eng. Syst. Saf. 2017, 158, 1–8. [Google Scholar] [CrossRef]
- Chen, W. Research on Reliability Test and Analysis of Aerospace Electrical Connector; Zhejiang University: Hangzhou, China, 1997. [Google Scholar]
- Guo, H. Gyro Motor Accelerated Life Test Design and Reliability Analysis; Xi’an University of Electronic Science and Technology: Xi’an, China, 2014. [Google Scholar]
- Zhou, J.; Yao, J.; Su, Q.; Hu, H. Research on optimum design of temperature-vibration accelerated storage test plan. Vibroeng. Procedia 2014, 4, 63–68. [Google Scholar]
- Yang, D. Research on Optimization Design Method of Step Stress Accelerated Degradation Test for Motorized Spindle; Jilin University: Changchun, China, 2018. [Google Scholar]
- Feng, X. Reliability Statistical Analysis and Optimization Design Scheme Based on Accelerated Life Test Data; Southwest Jiaotong University: Chengdu, China, 2018. [Google Scholar]
- Keshtegar, B.; Bagheri, M.; Fei, C.-W.; Lu, C.; Taylan, O.; Thai, D.-K. Multi-extremum-modified response basis model for nonlinear response prediction of dynamic turbine blisk. Eng. Comput. 2021, 38, 1243–1254. [Google Scholar] [CrossRef]
- Chengwei, F.; Haotian, L.; Shaolin, L.; Huan, L.; Liqiang, A.; Cheng, L. Dynamic parametric modeling-based model updating strategy of aeroengine casings. Chin. J. Aeronaut. 2021, 34, 145–157. [Google Scholar]
- Fang, K.; Liu, M.; Zhou, Y. Experimental Design and Modeling; Higher Education Press: Beijing, China, 2011. [Google Scholar]
- Hakamipour, N.; Rezaei, S. Optimal Design for a Bivariate Simple Step-Stress Accelerated Life Testing Model with Type-II Censoring and Gompertz Distribution. Int. J. Inf. Technol. Decis. Mak. 2015, 14, 1243–1262. [Google Scholar] [CrossRef]
- Elsayed, E.A.; Zhang, H. Design of optimum reliability test plans under multiple stresses. Qual. Dependability 2005, 3, 16–18. [Google Scholar]
- Cheng-Wei, F.; Huan, L.; Hao-Tian, L.; Cheng, L.; Li-Qiang, A.; Lei, H.; Yong-Jun, Z. Enhanced network learning model with intelligent operator for the motion reliability evaluation of flexible mechanism. Aerosp. Sci. Technol. 2020, 107, 106342. [Google Scholar]
- Chen, W.H.; Qian, P.; Ma, Z.K. Optimum design of multiple stress accelerated life test plan under periodic inspection. Chin. J. Sci. Instrum. 2009, 30, 2345–2550. [Google Scholar]
- Fei, C.-W.; Lu, C.; Liem, R.P. Decomposed-coordinated surrogate modeling strategy for compound function approximation in a turbine-blisk reliability evaluation. Aerosp. Sci. Technol. 2019, 95, 105466. [Google Scholar] [CrossRef]
- Chen, W.; Feng, H.; Qian, Q. Theory &method for optimum design of accelerated life test plan under multiple stresses. Chin. J. Mech. Eng. 2006, 42, 101–105. [Google Scholar]
- Chen, W.; Qian, P.; Fang, J.; Zhou, S.; Lu, X. Theory and method for simulation evaluation of comprehensive stress accelerated life test scheme. Acta Astronaut. Sin. 2007, 6, 1768–1773. [Google Scholar]

Disclaimer/Publisher’s Note: The statements, opinions and data contained in all publications are solely those of the individual author(s) and contributor(s) and not of MDPI and/or the editor(s). MDPI and/or the editor(s) disclaim responsibility for any injury to people or property resulting from any ideas, methods, instructions or products referred to in the content. |
© 2024 by the authors. Licensee MDPI, Basel, Switzerland. This article is an open access article distributed under the terms and conditions of the Creative Commons Attribution (CC BY) license (https://creativecommons.org/licenses/by/4.0/).