Article

Properties Analysis of Hydraulic PTO Output Fluctuation Regulating Based on Accumulator

School of Automation Science and Electrical Engineering, Beihang University, Beijing 100191, China
*
Author to whom correspondence should be addressed.
Actuators 2024, 13(7), 261; https://doi.org/10.3390/act13070261
Submission received: 15 June 2024 / Revised: 4 July 2024 / Accepted: 9 July 2024 / Published: 11 July 2024
(This article belongs to the Section Aircraft Actuators)

Abstract

:
Hydraulic power take-off (PTO) is increasingly favored as energy regulation and transmission system in wave energy converters (WEC), significantly smoothing the inherent randomness and fluctuation of wave energy. This paper designed a novel hydraulic PTO system composition of a double-acting hydraulic cylinder pump and accumulators. The dynamic process sub-division principle in an operating period of the hydraulic cylinder pump and accumulator and the mathematical model for explaining the fluctuations of pressure and flow rate in the hydraulic pump and accumulator circuit by means of the sub-division principle are put forward. The MATLAB/Simulink simulation model used to analyze pressure fluctuation in the hydraulic PTO system is established based on the mathematical model. The numerical results and MATLAB simulation results are mutually verified about the fine analysis of the accumulator smoothing fluctuation in the hydraulic PTO system. The results show that the pressure fluctuation amplitude of a hydraulic circuit is negatively correlated with the accumulator pre-charge pressure and the accumulator volume, and is positively correlated with the operating period of a hydraulic pump. The energy transfer efficiency of the hydraulic PTO system with accumulator fine compensation can be above 90%. The theory and model in this paper will serve as a valuable reference for designing fluctuation compensation parameters in hydraulic systems.

1. Introduction

Ocean wave energy stands as a crucial renewable resource. Covering 71% of the Earth’s surface, oceans are expansive and offer an estimated wave energy potential of up to 10 TW globally, with a substantial energy density reaching 100 kW/m [1]. Moreover, the utilization of wave energy has minimal environmental problems and offers great potential for development. In recent decades, diverse wave energy conversion systems have been developed, aimed at transforming wave energy into controllable [2], measurable, and usable mechanical [3] or electrical energy [4]. Currently, the wave energy development products are focused on supplying electricity to power grids or offshore appliances. These systems are uniformly confronted with a core challenge, the inherent fluctuations in wave energy, which manifest as significant differences between peaks and valleys. This fluctuation would result in wave energy converters (WEC) operating in unstable conditions, complicating the direct utilization of the energy harvested, and potentially harming the grid or offshore appliance safety and quality. To address this issue, a power take-off (PTO) system was incorporated between the WEC device and the generator system to regulate the fluctuating energy [5].
Initially, in some large wave energy installations, such as over-topping converters, a Kaplan water turbine [6] or Pelton turbine [7] was employed in their power take-off (PTO) systems to generate electricity. Moreover, air turbines such as Wells air turbine [8] or Pulse turbine [9] are applied in oscillating water columns (OWC). Over time, the wave energy installations have shifted towards commercialized and miniaturized systems, and this approach has been proven less feasible. Currently, a large number of wave energy generation devices are being developed; the hydraulic PTO systems have been developed as the most suitable approach to convert wave energy into usable electrical power [10]. The use of incompressible hydraulic fluids facilitates the efficient transformation of the wave energy captured. Additionally, hydraulic components like accumulators would significantly help to smooth out energy output fluctuations, especially in point absorber WEC systems. The hydraulic PTO systems would be well-suited for low-frequency, high-power density wave energy, and achieving conversion efficiencies of up to 90% in certain cases [11]. The diverse PTO actuators could be used in a variety of WEC systems, such as multi-raft [12] or double-raft Pelamis [13], Wave Star [14], Eco Wave Power [15], and Wave Roller [16].
Researchers have explored various methods to regulate and control hydraulic PTO systems, aiming to enhance the efficiency of wave energy absorption for WEC, and some research results have been obtained, for example when an equivalent coulomb torque model was applied to study the interaction between hydraulic PTO systems and WEC [17] and the pressure drop database as a feedback control (PDDFC) method [18]. Some active control valves were employed to mitigate energy fluctuations and boost the efficiency of hydraulic PTO systems. Various actuators such as valve-controlled hydraulic cylinders have been used in the control and regulation of hydraulic PTO systems [19]. Moreover, a concept about declutching cylinders [20] or discrete pressure [21] is also presented in the control method. Additionally, variable displacement hydraulic motors [22] have also been utilized as these studies focus on utilizing real-time data, including signals from pressure sensors and hydraulic cylinder displacement sensors, and adjustments to hydraulic actuators based on feedback signals. However, it is also crucial to probe the causes of pressure or power fluctuations in hydraulic circuits. The models for damping and regulating fluctuations can provide some valuable prediction or feedforward data, and further enhance the control efficacy of hydraulic actuators. This method can be used in parallel with current control methods acting as a pre-processing step to optimize the performance of hydraulic PTO systems.
This paper focuses on the pressure and power dynamics property in hydraulic circuits to evaluate how hydraulic PTO systems can effectively regulate and smooth power output fluctuations. The analysis is grounded on the application of a double-acting dual-cylinder hydraulic pump in a new type of Wave Energy Converter (WEC), as referenced in [23]. In fact, the method developed is adaptable to various WEC models with similar hydraulic actuators, such as dual-stroke pendulum WEC [24] and Wavepod [25].
The novel WEC converts wave energy into mechanical energy by means of gyroscopic precession and drives the hydraulic cylinder pump to output hydraulic energy, and then drives the hydraulic motor driving the generator to output electrical power. Because the gyroscope precession is a periodic swing, the hydraulic output power is fluctuating, and the generator output power will also be unstable, so that it seriously affects the electrical equipment operating performance. Therefore, it is imperative to adjust the conversion wave power to smooth. In this paper, the accumulator will be used to smooth the hydraulic output power (pressure and flow rate), so that it can meet the needs of the hydraulic motor driving the generator to operate smoothly.
Detailed analysis about the operational modes of a hydraulic cylinder pump and accumulators is conducted in response to differing wave frequencies and power conditions. The mathematical model to describe pressure fluctuations in time domain is established, and the real-time operational efficiency of the hydraulic PTO system is assessed. Furthermore, accumulators that act as essential components that link flow rate and pressure together are studied to explore how the parameters (volume, pre-charging pressure) of design influence the fluctuation smoothing performance in the hydraulic system. This method can provide a theoretical basis for power regulation and energy control processes in hydraulic PTO systems. A flowchart of each step in this paper is given in Figure 1, and the validity of the analytical calculation will be verified by comparing it with simulation results.
In Section 2, the structure of the hydraulic PTO system is introduced, and the formation of pressure fluctuations in the hydraulic circuit is explained. Section 3 presents the development of a model for the hydraulic PTO system within a complete fluid charge and discharge process. Section 4 validates the accuracy of the proposed numerical calculations method and studies the determinants influencing pressure fluctuations in the hydraulic circuit. Finally, Section 5 discusses the conclusion and future work.

2. Analysis of Pressure Fluctuations in the Hydraulic PTO

This research uses a WEC device presented in [23], as depicted in Figure 2. A crank drives two double-acting hydraulic cylinders, actuating the pistons in a back-and-forth oscillating motion, and to output hydraulic fluid into the circuit. In this case, the motion of the pistons is modeled as a single degree of freedom harmonic displacement. The dynamics of WEC are provided in [23], and this is not part of the research in this paper.

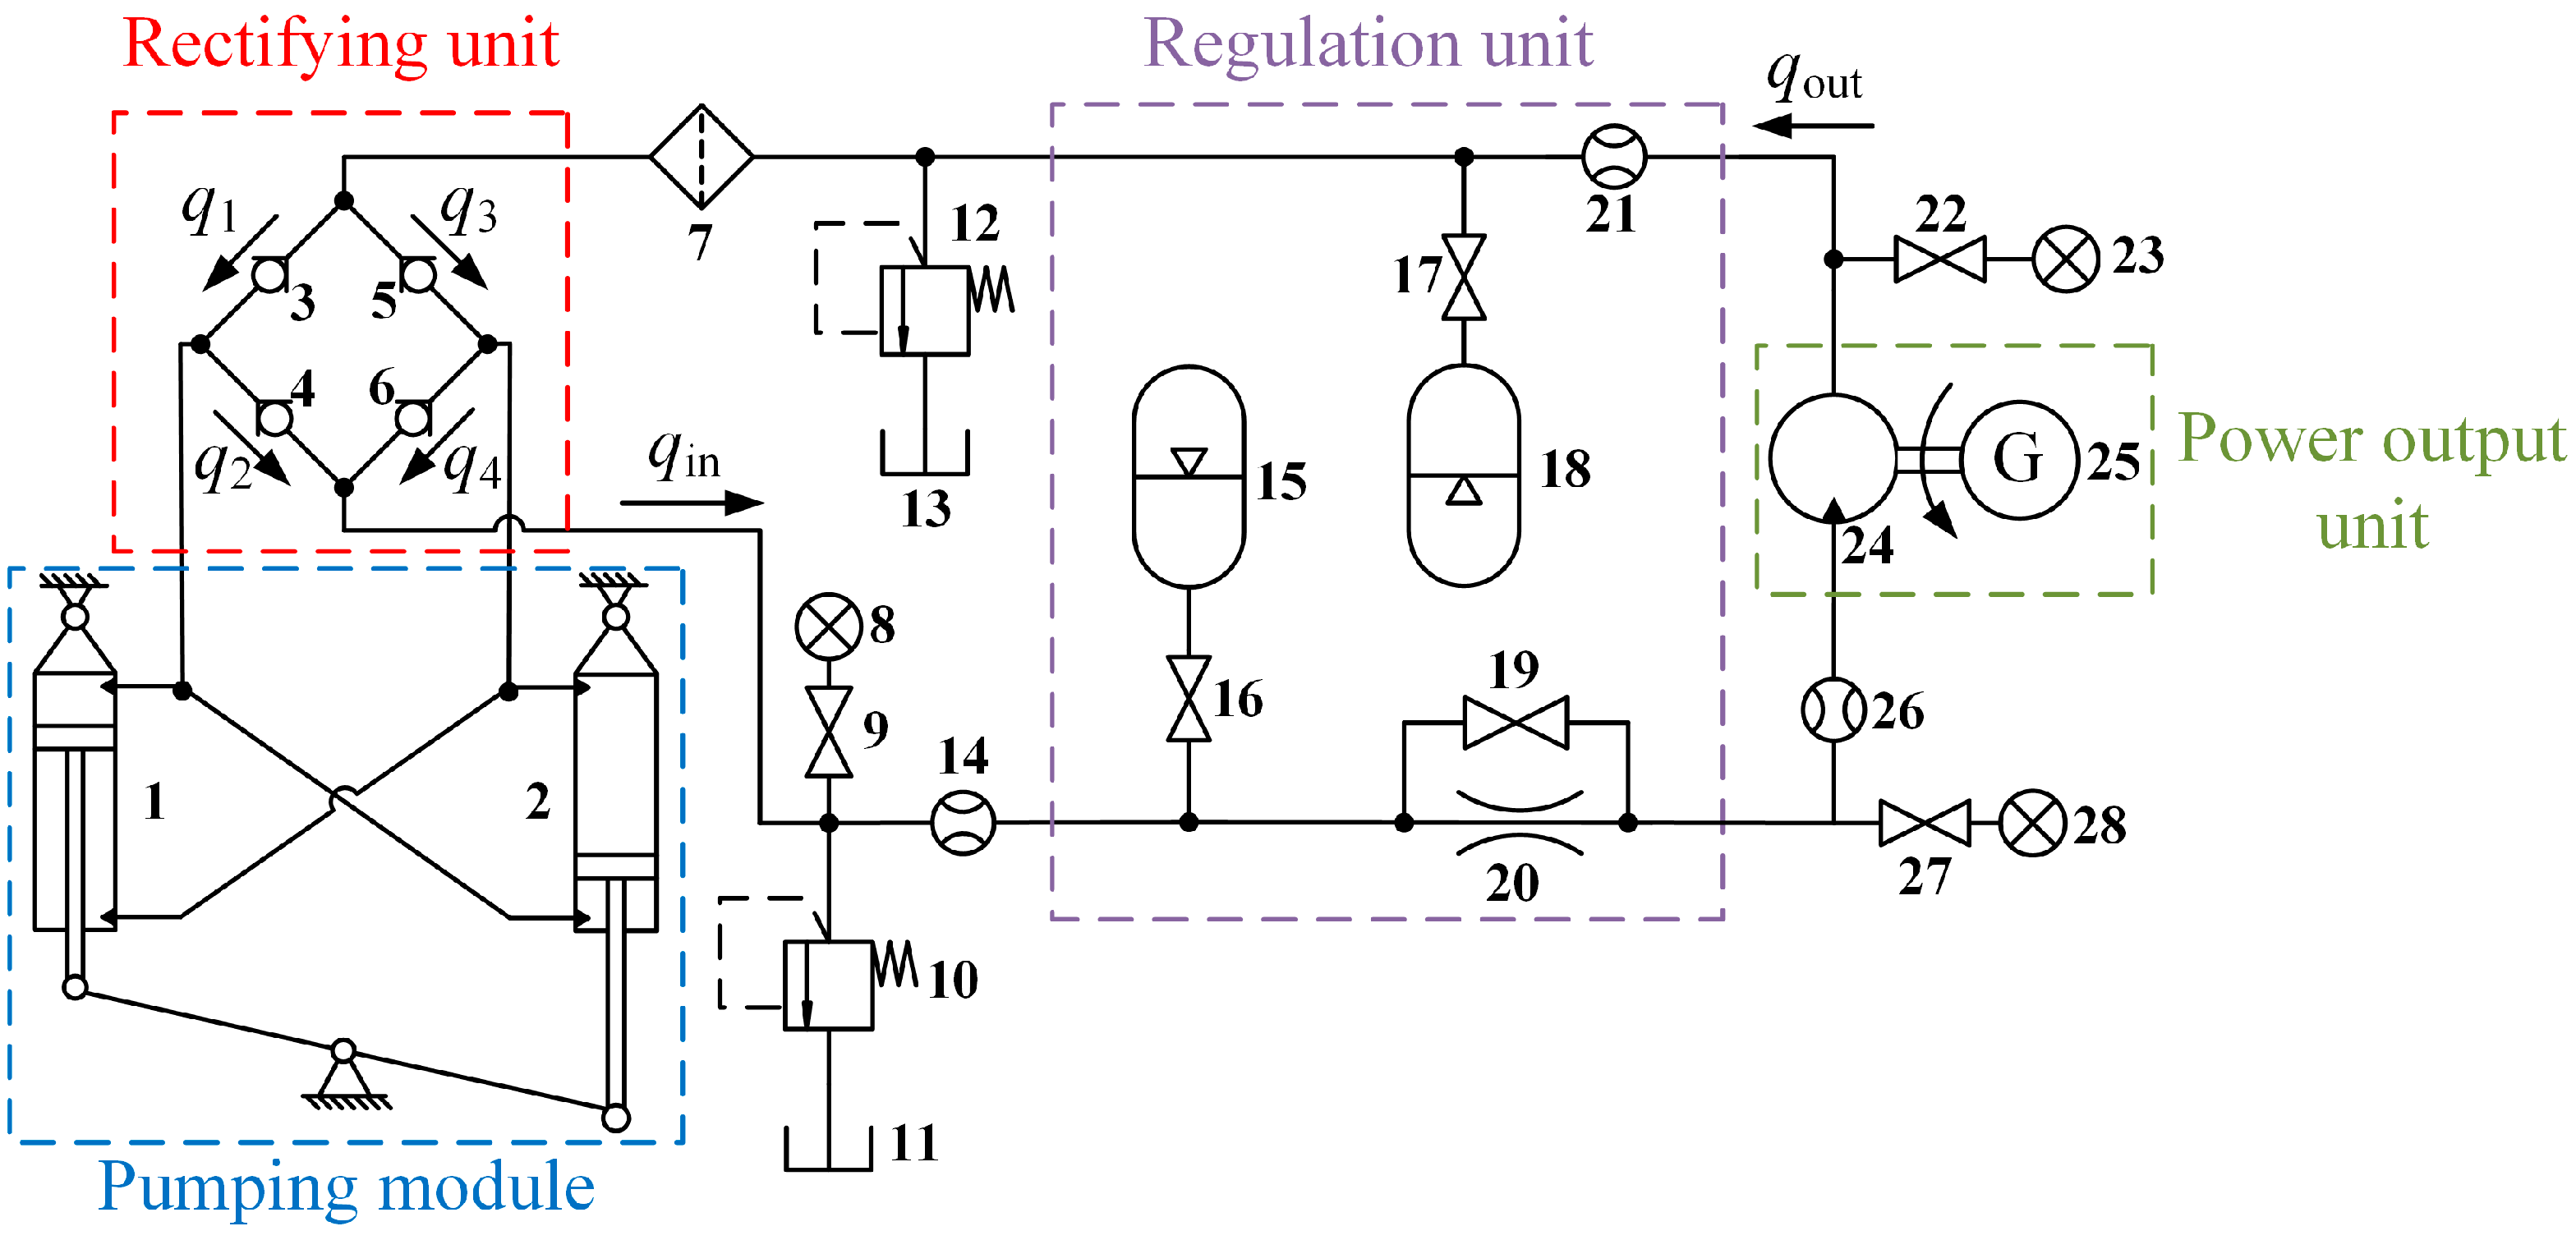
2.1. General Description of the Hydraulic PTO System

The hydraulic pumping module consists of two double-acting hydraulic cylinder pumps driven by a crank that joins with the power input shaft at the crank center point and joins with two piston rods at each crank end point. One rod extends while the other rod retracts under the power input shaft run operating condition. The pressure chambers of two double-acting hydraulic cylinder pumps are, respectively, set such as a rod chamber connected with a rod-less chamber and shared a hole for fluid input and output. This design can guarantee a continuous fluid supply into the hydraulic circuit through the rectifier module, which is made up of four check valves, as shown in Figure 3.
The rectifying unit consists of four check valves that maintain continuous, unidirectional flow from the pump to the hydraulic circuit. qi (i = 1, 2, 3 and 4) represents the flow rate through four check valves. And qin is the oil flow input of the high-pressure side of the regulation unit through rectifying unit. The regulation unit consists of a higher-pressure accumulator and a lower-pressure accumulator in the hydraulic system. The higher-pressure accumulator could significantly smooth the flow fluctuation coming from the hydraulic pump module output by means of gas expansion or compression in the accumulator. This can ensure the power output module, including the hydraulic motor and generator, running at smooth and steady states. A lower pressure accumulator with a large volume is arranged in the low-pressure hydraulic circuit for restoring or recharging fluid for the hydraulic pump module. Finally, the hydraulic motor drives a generator, collectively forming the power output unit, which delivers electrical energy. And qout is the oil flow input low-pressure side of the regulation unit from the outlet of the hydraulic motor.
This section mainly studies the pressure change in the hydraulic output circuit and how smooth the pressure and flow output of the hydraulic PTO system is during the running operation process. The energy conversion efficiency of the accumulator that balances the pressure and flow fluctuation of the hydraulic circuit in the running process is analyzed. The calculation method that can be used for analyzing the related factors and influencing the rule in the energy conversion process is derived.
The high-pressure circuit part in Figure 3 is regarded as a connected pressure chamber, which mainly includes the rodless chamber of one hydraulic cylinder pump and the rod chamber of another hydraulic cylinder pump, the liquid-filled part of the accumulator, and the pipeline volume. There are two ways in which the hydraulic cylinder pump chamber volume can change and cause the pressure and flow rate in the circuit to fluctuate or be smooth: one way is to change the volume of the hydraulic cylinder chamber by driving the piston moving by means of the wave excitation force driving the crank; the second way is the volume change that is caused by the compression or expansion of the accumulator gas bag, which causes the pressure and flow rate in the circuit to fluctuate or be smooth. During the operation volume change process of the accumulator, the gas–liquid pressure interaction occurs in the closed container at the same time.
The accumulators play a crucial role in smoothing the power fluctuations in the hydraulic circuit. This section primarily researches the smoothing capabilities of the accumulators to regulate pressure and flow rate in the hydraulic circuit on energy availability, and identifies the major effective factors of their effectiveness. In general, the hydraulic pump piston movement caused by wave excitation can be described as a simple harmonic function with a frequency, then the displacement xp of the piston with time t could be expressed by
x p t = X 0 cos ω t ,
where X0 is the complex amplitude of the piston displacement xp, and Re(·) means the real part of the xp.
Figure 4 shows that the real-time change in the output power in the hydraulic PTO when the accumulator is enabled, compared with the output power when the accumulator is disabled. Figure 4a shows the output power situation under regular wave action when the accumulator is disabled or is enabled, and Figure 4b shows the output power situation under random wave action when the accumulator is disabled or is enabled. Figure 4 shows that the output power of the hydraulic system is very uneven when the accumulator is not enabled, and the output power has a large fluctuation, and its peak value is much higher than the average power value. The output power of the hydraulic system is significantly smoothed and its fluctuation amplitude is greatly reduced when the accumulator is enabled. This shows the importance of the use of accumulators in hydraulic systems. In order to further study the smooth ability and transmission efficiency of the hydraulic system to the energy fluctuation, the pressure fluctuation model in the hydraulic circuit is established, which can more clearly understand the influence of hydraulic parameters on it.
The hydraulic pressure chamber interconnected by a rod chamber part of one hydraulic cylinder pump and the rodless chamber part of the other one, which together supplies pressure fluid into the hydraulic circuit with a flow rate qin,
q i n t = 1 + σ A p x ˙ p t ,
where Ap is the operation area of the piston, and σ represents the ratio of the operation areas about the rod chamber to the rodless chamber.
When the average power Pin of the wave action on the PTO is known, the mean pressure p ¯ h in the hydraulic circuit during a system operation period, which is half of wave period T, can be calculated from
P i n = 2 T t t + T 2 p ¯ h q i n t d t .
Substituting Equation (2) into Equation (3), we can obtain
p ¯ h = T 4 X 0 1 + σ A p P i n .
The pressure fluid in the hydraulic circuit will be controlled into the hydraulic motor to drive the generator running with the desired rotating speed. Then, the flow rate input of the hydraulic motor is expressed as
Φ = D m Ω ,
where Φ is the flow rate input of the hydraulic motor, Ω is the rotating speed of the hydraulic motor, and Dm is the displacement of the hydraulic motor.
Therefore, the mean output power of the hydraulic motor in the hydraulic circuit can be expressed as
P ¯ o u t = p ¯ m p l Φ ,
where P ¯ o u t is the average output power of the hydraulic motor, p ¯ m is the operating pressure to drive the hydraulic motor, and pl is the outlet pressure of the hydraulic motor. Due to the use of a very large accumulator (or oil tank) in the low-pressure circuit, the fluctuations in pressure are much smaller than those on the high-pressure side. So, the low pressure is regarded as a negligible constant or equivalent to standard atmospheric pressure.
The flow rate regulating valve is adopted in the hydraulic circuit to control the flow rate input of the hydraulic motor. The flow rate through the throttle port of the flow rate regulating valve is expressed as
q m = C v A v 2 p h p m / ρ ,
where qm is the flow rate through the throttle port of the flow rate regulating valve, Av is the throttle port operating area of the flow rate regulating valve, and ph is the hydraulic pressure before the throttle port. pm is the hydraulic pressure behind the throttle port. Cv is the flow rate coefficient. If the flow rate is controlled through the flow rate regulating valve directly input to the hydraulic motor, the pressure loss through the throttle can be simplified as
Δ p = p h p m = k v Φ 2 ,
among them, kv is the throttle coefficient of the flow rate regulating valve, which is related to the size of the throttle opening.

2.2. Pressure Fluctuations in the Hydraulic Circuit

Based on the above discussion, the hydraulic cylinder pumps are driven by wave excitation output flow rate and pressure at an uneven state, so that the accumulator needs to be employed to smooth the pressure pulse and flow rate fluctuation in the hydraulic circuit. The accumulator smooths the hydraulic pressure pulse in the hydraulic circuit by means of fluid charging in or releasing from the accumulator with gas compressing or expanding.
It is a complicated process that involves pressure fluid input or output from the accumulator under the pressure variation condition in the hydraulic circuit. The variation rule and influence factor need to be investigated in the transition between charging into and releasing from the accumulator in the hydraulic circuit. To study the detailed pressure fluctuations in hydraulic circuits, a cycle period of accumulator charging and releasing fluid can be divided into four distinct processes. These processes are separated by some characteristic instant points. The movement processes of the hydraulic pump piston from its minimum displacement to the maximum decide the entire process of pressure fluid charging into and releasing from the accumulator. Because of the symmetry between the two double-acting hydraulic cylinders pump, it is feasible to analyze one of them, as the processes and states of the other can be deduced using physical correlations. These processes and states of the accumulator and hydraulic cylinder are depicted in Figure 5. The flow rate of the accumulator is defined as positive with fluid charging into, and negative otherwise.
Figure 5 shows the hydraulic fluid flow process from the hydraulic cylinder pump into the hydraulic circuit during a complete cycle period; correspondingly, the hydraulic fluid flow process and state from the accumulator into and out are given. The hydraulic fluid flow processes and states within a cycle period can be divided by the time intervals described in Figure 6. It is divided into four processes: I to IV. In Figure 6, the zero value of the flow rate axis is the equilibrium point of the accumulator flow change. At this moment, there is no fluid charging into and releasing from the accumulator. qin is the flow rate coming from the hydraulic pump and above zero value, and qa is the flow rate coming into the accumulator and the value can be positive or negative. When the flow rate coming into the accumulator is a negative value, the accumulator supplies the hydraulic fluid into the hydraulic circuit to compensate the hydraulic pump output insufficiently. When the flow rate coming into the accumulator is positive value, the accumulator absorbs the hydraulic fluid from the hydraulic circuit to consume the hydraulic pump output excessively. Ω is the expected flow rate value in the hydraulic circuit and is also the control aim value.
In general, the relationship between pressure in the hydraulic circuit and volume of gas in the accumulator in one process is shown in Figure 7. Figure 7a shows that the pressure changes with the volume of gas in the accumulator in one process, where δph represents the maximum variation range of the pressure in the hydraulic circuit, and δVa represents the maximum variation range of volume of gas in the accumulator. Figure 7b shows that the pressure in the hydraulic circuit and the volume of gas in the accumulator change with the time variable. Each process will be analyzed and modeled in detail in Section 3.

3. Modeling and Analysis of Pressure Fluctuations

Process I: At instant t1, the hydraulic cylinder piston is at its minimum displacement xp1 = −X0, where its velocity is zero. At this instant point, the pump source does not supply fluid into the hydraulic circuit, so the accumulator steps in as an auxiliary source and provides all fluid for the hydraulic circuit; therefore, the flow rate coming from the accumulator reaches its peak value. The relationship equation between pressure and volume is easily derived as
p h 1 V a 1 = n R T 1 ,
where Va1 is the volume of gas in the accumulator at t1, and ph1 is the pressure in the hydraulic circuit at t1. T1 is the temperature of gas at t1, R is the gas constant, and n is the polytropic process index.
Then, at instant point t2, the volume of gas in the accumulator reaches its maximum volume, while it ceases to provide fluid into the circuit, as qa(t2) = 0, which can be expressed by
q a t 2 = 1 + σ A p x ˙ p t 2 Ω = 0 , t 2 < T 4
At the same time, t2 is considered as the conversion point of a complete process, the accumulator switches to the energy storage mode from energy output. According to the Equation (10), t2 could be solved as
t 2 = 1 ω arcsin Ω ω 1 + σ A p X 0 .
Then the gas state equation between pressure and volume of the accumulator at instant point t2 is obtained by
p h 2 V a 2 = n R T 2 ,
where Va2 is the volume of gas at instant t2, T2 is the temperature of gas at instant t2, and ph2 is the pressure in the hydraulic circuit at instant t2.
In an adiabatic process, the Equations (9) and (12) are satisfied by
p h 1 V a 1 γ = p h 2 V a 2 γ = C 0 .
where C0 represents the initial state value of the accumulator.
In the process from t1 to t2, the hydraulic cylinder pump piston is driven to pressure hydraulic fluid, and the gas volume expands in the accumulator to output hydraulic fluid, so the hydraulic cylinder pump and the accumulator jointly provide pressure fluid for the hydraulic circuit. Due to the incompressibility principle of liquid, the q-t curves of the hydraulic cylinder pump and accumulator are shown in Figure 6, where the area enclosed by the qin curve and coordinate axis is the volume of hydraulic fluid output by the hydraulic cylinder pump δVp; and the part enclosed by the qa curve and coordinate axis is the volume of hydraulic fluid input by the accumulator δVa; then, the area between these two curves is the volume of hydraulic fluid output to the hydraulic motor δVm. In the process I, δVm1 can be expressed as
δ V m 1 = Φ t 2 t 1 ,
and δVp1 is calculated by
δ V p 1 = t 1 t 2 1 + σ A p x ˙ d t = 1 + σ A p x 2 x 1 .
Based on the Equations (14) and (15), the hydraulic fluid volume output from the accumulator can be obtained by
δ V a 1 = δ V m 1 δ V p 1 .
According to the gas P-V curves in the accumulator shown by Figure 7a and the Equation (13), the relation equation can be obtained as
δ p h 1 = γ p h 1 1 / γ + 1 C 0 1 / γ δ V a 1 = Π 1 δ V a 1 ,
where δph1 is the pressure change in the hydraulic circuit during the process of t1 to t2, and the coefficient before δVa1 is replaced by Π1, which is related to the initial state C0 of the accumulator and the pressure ph1 at the time of t1.
In the process, the total work Wi1 output by the hydraulic cylinder pump and the accumulator in the hydraulic system is obtained as
W i 1 = W p 1 + W a 1 ,
where Wp1 is the output work by the hydraulic pump piston and Wa1 is the output work by the accumulator; they are expressed, respectively, as follows
W p 1 = t 1 t 2 p t q t d t p h 1 + p h 2 2 δ V p 1 = p h 1 + 1 2 δ p h 1 δ V p 1 ,
W a 1 = n C v , m T 1 T 2 = p h 1 V a 1 p h 2 V a 2 γ 1 ,
The gas expanding in the accumulator is considered adiabatic in this process; there is no heat exchange with the outside world, so the temperature of gas will decrease, and part of the energy will be transformed from the internal energy of gas in the accumulator, and the total energy of gas can output the work Wa1 in the hydraulic circuit. In this process, the output work Wo1 from the hydraulic motor to the load can be expressed as
W o 1 = t 1 t 2 p m q m d t p m 1 + p m 2 2 δ V m 1 = p m 1 + 1 2 δ p m 1 δ V p 1 + δ V a 1 .
Then, in the process from t1 to t2, the ratio of the energy output by the hydraulic motor to the energy input from the hydraulic cylinder pump into the hydraulic circuit is defined as the relative energy utilization ratio rs1 of the hydraulic system. Substituting Equation (17) into Equations (19) and (21), the rs1 can be expressed as
r s 1 = W o 1 W p 1 = 1 2 Π 1 δ p h 1 2 + 1 Π 1 p h 1 + 1 Π 1 k v Φ 2 + 1 2 δ V p 1 δ p h 1 + p h 1 δ V p 1 + k v Φ 2 δ V p 1 1 2 δ V p 1 δ p h 1 + p h 1 δ V p 1 .
The ratio rs1 denotes the operational mode of the accumulator; when rs1 < 1, the accumulator is in the charging phase, during which the hydraulic cylinder concurrently delivers hydraulic fluid to both the accumulator and the hydraulic motor. Conversely, when rs1 > 1, the accumulator changes to the releasing phase, collaborating with the hydraulic cylinder to provide hydraulic fluid to the hydraulic motor.
Then, the ratio of the sum energy output of the hydraulic circuit to the energy input to the hydraulic circuit in the process is defined as the operating efficiency ηs1. Substituting Equation (17) into Equations (18) and (21), the ηs1 can be expressed as
η s 1 = W o 1 W i 1 = 1 2 Π 1 δ p h 1 2 + 1 Π 1 p h 1 + 1 Π 1 k v Φ 2 + 1 2 δ V p 1 δ p h 1 + p h 1 δ V p 1 + k v Φ 2 δ V p 1 1 Π 1 γ 1 δ p h 1 2 + 1 2 δ V p 1 + 1 Π 1 p h 1 δ p h 1 + p h 1 δ V p 1 .
In Equation (23), the hydraulic system parameters ph1 and Π are state constants related to time t1, and Φ is system constant. Since the hydraulic pump piston motion trajectory is known, the δVp1 can be obtained during the t1 to t2 process, so the energy transfer efficiency of the hydraulic system depends on the pressure change δph1.
Process II: in the process from t2 to t3, the hydraulic cylinder pump provides pressure fluid into the hydraulic circuit, the gas volume in the accumulator gradually decreases from the maximum value. The time t3 is considered as the midpoint of a complete process, as t3 = T/4. At the same time, the accumulator keeps to the energy storage mode, and the process of gas change in the accumulator is considered an adiabatic compression process. At the moment of t3, the instantaneous flow rate of pressure fluid flow into the hydraulic circuit from the hydraulic cylinder pump reaches the maximum value. At this time, the pressure in the circuit returns to the average pressure, the gas in the accumulator quickly reaches the initial volume, and meets the following equation:
p h 3 V a 3 = n R T 3 .
The q-t curves of the hydraulic cylinder pump and accumulator in process II are shown in Figure 6. And the volume of hydraulic fluid output from the cylinder pump and into the hydraulic motor can be expressed by
δ V m 2 = Φ t 3 t 2 ,
δ V p 2 = t 2 t 3 1 + σ A p x ˙ d t = 1 + σ A p x 3 x 2 .
Based on the Equations (25) and (26), the gas volume of accumulator δVa2 can be obtained by Equation (27). It should be noted that, during process II, the value of δVa2 is negative, which demonstrates that the accumulator is in the charging phase.
δ V a 2 = δ V m 2 δ V p 2 .
Then the relationship between hydraulic oil pressure fluctuation δph2 in the accumulator and the hydraulic oil volume δVa2 can be obtained by
δ p h 2 = γ p h 2 1 / γ + 1 C 0 1 / γ δ V a 2 = Π 2 δ V a 2 ,
In process II, the total work Wi2 output by the hydraulic cylinder pump and the accumulator in the hydraulic system is obtained as
W i 2 = W p 2 + W a 2 ,
where Wp2 is the output work by the hydraulic pump and Wa2 is the output work by the accumulator; they are expressed, respectively, as follows:
W p 2 = t 2 t 3 p t q t d t p h 3 + p h 2 2 δ V p 2 = p h 2 + 1 2 δ p h 2 δ V p 2 ,
W a 2 = n C v , m T 2 T 3 = p h 3 V a 3 p h 2 V a 2 γ 1 .
The gas compressed in the accumulator is considered adiabatic in this process; there is no heat exchange with the outside world, so the temperature of gas will increase, and part of the energy will be stored in gas to enhance the internal energy. At the same time, the part pressure energy in the hydraulic circuit can be absorbed and stored by the gas in the accumulator. In this process, the value of work Wa2 is negative.
In this process, the output work Wo2 from the hydraulic motor to the load can be expressed as
W o 2 = t 2 t 3 p m q m d t p m 2 + p m 3 2 δ V m 2 = p m 2 + 1 2 δ p m 2 δ V p 2 + δ V a 2 .
Then, in the process from t2 to t3, the relative energy utilization ratio rs2 and operating efficiency ηs2 of the hydraulic system is expressed as
r s 2 = W o 2 W p 2 = 1 2 Π 2 δ p h 2 2 + 1 Π 2 p h 2 + 1 Π 2 k v Φ 2 + 1 2 δ V p 2 δ p h 2 + p h 2 δ V p 2 + k v Φ 2 δ V p 2 1 2 δ V p 2 δ p h 2 + p h 2 δ V p 2 ,
η s 2 = W o 2 W i 2 = 1 2 Π 2 δ p h 2 2 + 1 Π 2 p h 2 + 1 Π 2 k v Φ 2 + 1 2 δ V p 2 δ p h 2 + p h 2 δ V p 2 + k v Φ 2 δ V p 2 1 γ 1 Π 2 δ p h 2 2 + 1 Π 2 p h 2 + 1 2 δ V p 2 δ p h 2 + p h 2 δ V p 2 .
Process III: in the process from t3 to t4, the gas in the accumulator is continuously compressed, and the hydraulic cylinder pump still provides pressure oil for the accumulator and the hydraulic motor, but the output flow rate is gradually reducing. At the moment of t4, the gas in the accumulator is compressed to a minimum volume, and the pressure in the hydraulic circuit reaches its maximum. At this moment, the flow rate of accumulator qa(t4) = 0, which can be expressed by
q a t 4 = 1 + σ A p x ˙ p t 4 Ω = 0 , T 4 < t 4 < T 2
so that t4 can be calculated as
t 4 = T 2 1 ω arcsin Ω ω 1 + σ A p X 0 .
In this process, the changes in the volume of gas in the accumulator and the pressure in the hydraulic circuit can be calculated in a similar way to process II. During this process, the model of variation for volume and pressure fluctuations is described as follows:
δ V m 3 = Φ t 4 t 3 ,
δ V p 3 = t 3 t 4 1 + σ A p x ˙ d t = 1 + σ A p x 4 x 3 ,
δ V a 3 = δ V m 3 δ V p 3 ,
δ p h 3 = γ p h 3 1 / γ + 1 C 0 1 / γ δ V a 3 = Π 3 δ V a 3 ,
in which the definitions of the variables δVm3, δVp3, δVa3, and Π3 are in a similar way with process II. And the operating efficiency of the hydraulic system can be represented as
η s 3 = 1 2 Π 3 δ p h 3 2 + 1 Π 3 p h 3 + 1 Π 3 k v Φ 2 + 1 2 δ V p 3 δ p h 3 + p h 3 δ V p 3 + k v Φ 2 δ V p 3 1 γ 1 Π 3 δ p h 3 2 + 1 Π 3 p h 3 + 1 2 δ V p 3 δ p h 3 + p h 3 δ V p 3 .
Process IV: in the process from t4 to t5, the accumulator is switched to release hydraulic oil, and the hydraulic cylinder pump and the accumulator together supply pressure oil into the hydraulic circuit at the same time. During this period, the hydraulic cylinder pump gradually decreases the pressure oil output, while the accumulator gradually increases the pressure oil output. Until t5 instant point is reached, the hydraulic cylinder pump piston reaches the end point and no longer provides oil to the hydraulic circuit. At this point, the hydraulic system completes a cycle period in which the accumulator stores and releases the hydraulic oil. In this process, the changes in the volume of gas in the accumulator and the pressure in the hydraulic circuit can be calculated in a similar way to process I. Similarly, the model of variation for volume and pressure fluctuations is expressed by the following equations.
δ V m 4 = Φ t 5 t 4 ,
δ V p 4 = t 4 t 5 1 + σ A p x ˙ d t = 1 + σ A p x 5 x 4 ,
δ V a 4 = δ V m 4 δ V p 4 ,
δ p h 4 = γ p h 4 1 / γ + 1 C 0 1 / γ δ V a 4 = Π 4 δ V a 4 ,
in which the definitions of the variables δVm4, δVp4, δVa4, and Π4 are similar to process I. And the operating efficiency of the hydraulic system during this process is given by
η s 4 = 1 2 Π 4 δ p h 4 2 + 1 Π 4 p h 3 + 1 Π 4 k v Φ 2 + 1 2 δ V p 4 δ p h 4 + p h 4 δ V p 4 + k v Φ 2 δ V p 4 1 γ 1 Π 4 δ p h 4 2 + 1 Π 4 p h 4 + 1 2 δ V p 4 δ p h 4 + p h 4 δ V p 4
Integrating the discussion results from process I to process IV, the calculation method used for explaining the principle and results on the changes in the volume of gas in the accumulator and the pressure in the hydraulic circuit is obtained. the next section will calculate, analyze and verify the numerical results of the gas volume in the accumulator and the pressure change in the hydraulic circuit by means of the simulation model that is established by MATLAB/Simulink based on above mathematical model.

4. Numerical Calculation and Simulation Verification

4.1. Validation of the Time-Domain Model for the Hydraulic PTO System

In this section, a system model was developed in Matlab/Simulink 2019b with Simscape and depicted in Figure 8. This model can simulate the change in the main parameters of the hydraulic system on the time scale. At the same time, simulation results can be used as a reference to verify the accuracy of the numerical results calculated by using the numerical method in Section 2.
The simulation model consists of a pump module, rectifier valves, power regulation, and output modules. The low-pressure hydraulic circuit connects with an oil storage tank whose pressure is maintained at a standard atmosphere. The input of the model is powered by a source with mean power Pin, induces the simple harmonic motions in two pistons in the hydraulic pump, and the output of the system connects to a generator with an adjustable load. The pressure signal and flow signal in the loop can be collected and displayed.
Table 1 lists the fixed parameters of the hydraulic system for simulation. They are inherent operation parameters of the hydraulic pump and hydraulic motor. The time domain variation rules of pressure and flow rate in the hydraulic circuit under harmonic excitation are solved by the simulation model. The change in results of pressure in the hydraulic circuit and volume in the accumulator are calculated using the analytical method in Section 2. The simulation curves and calculation results are shown in Figure 9.
In the simulation, the average output power Pin of the hydraulic pump is set to 100 W, the area of the throttle valve port Av is 4.9 × 10⁻⁶ m2, the initial state parameter p0 of the accumulator is 1.0 MPa, and the volume of the accumulator is 1.0 L. Firstly, the accuracy of the numerical method is verified by means of the above parameters selected for numerical calculation. The results obtained by the analytical method are compared with the simulation results of MATLAB/Simulink in Figure 9. It includes (a) the pressure in the hydraulic circuit, (b) the volume of gas in the accumulator, (c) the output flow rate of the hydraulic pump, and (d) the inlet and outlet flow rate of the accumulator. The fluctuation state in the 100~108 s interval is captured, which contains five complete cycles. The solid line is the simulation result, and the dashed line is the numerical calculation result. The numerical results agree well with the simulation results, which verify the accuracy of the numerical method.
The change curves of some operation parameters in the hydraulic system are shown in Figure 9. Firstly, observe the curves changing at point t1, when the output flow rate of the accumulator is at the peak value (Figure 9d) and the output flow rate of the hydraulic pump is 0 (Figure 9c); at this moment, the pressure in the hydraulic circuit is the approximate average pressure value (Figure 9a), and the volume of gas in the accumulator is the approximate average volume (Figure 9b). Then, continue to observe the curves changing at point t2. When the inlet or outlet flow rate of the accumulator is 0 and the change rate is greater than 0 (Figure 9d), the pressure in the hydraulic circuit is the lowest value (Figure 9a), and the volume of gas in the accumulator is the largest volume (Figure 9b). Then, continue to observe the curves changing at point t3. When the inlet flow rate of the accumulator is at the maximum value (Figure 9d), the output flow of the hydraulic pump reaches the maximum value (Figure 9c); at this moment, the pressure in the hydraulic circuit is the approximate average pressure value (Figure 9a), and the volume of gas in the accumulator is the approximate average volume (Figure 9b). Finally, observe the curves changing at point t4. When the inlet or outlet flow rate of the accumulator is 0 and the change rate is less than 0 (Figure 9d), the pressure in the hydraulic circuit is the highest value (Figure 9a), and the volume of gas in the accumulator is the smallest volume (Figure 9b). The changing processes of the operation parameters shown in Figure 9 are consistent with those analyzed in Section 2, which verify the feasibility of the numerical calculation method proposed.
Figure 10 shows the changes in relative energy utilization ratio rs and meaningful operating efficiency ηs at different processes in a cycle period. The relative energy utilization ratio rs represents the proportion of the output energy of the hydraulic system comparing with the input energy from hydraulic pump at this process. The rs value can be greater than 1 because of the accumulator being used in the hydraulic system. When rs > 1, the hydraulic pump adds the accumulator serving as an auxiliary oil source, and together provides the pressure oil into the hydraulic circuit. When rs ≤ 1, the hydraulic pump acts as the only oil source and provides the pressure oil into the hydraulic circuit and the accumulator that acts as the energy storage element to absorb the excess energy at the same time. As shown in Figure 8, the relative energy utilization ratio rs of process I~IV in a cycle period is 183.43%, 69.29%, 69.32%, and 182.58%, respectively. The meaningful operating efficiency ηs represents the actual efficiency of energy transmission of the hydraulic system. The meaningful operating efficiency of process I~IV in a cycle period is 93.83%, 94.18%, 93.17%, and 93.90%, respectively, as shown in Figure 10. It can be seen that the energy transmission efficiency of the hydraulic system is basically the same in each process. These results prove the effectiveness of using accumulator to balance the energy fluctuation of the hydraulic system.

4.2. Analysis of Factors Affecting the Transmission Performance of Hydraulic PTO Systems

Under simple harmonic excitation, the pressure in the hydraulic system still oscillates periodically, and the oscillation frequency is 1/2 of the natural frequency of the excitation source, shown in Figure 9. The amplitude of oscillation δph represents the energy smoothing ability of the hydraulic system. The meaningful operating efficiency ηs represents the energy transfer efficiency of the hydraulic system. According to the model proposed in Section 2, the energy transfer ability of the hydraulic system is related to some parameters that include the mean input power Pin of the hydraulic pump, the pre-charging pressure p0 of the accumulator, the volume V0 of the accumulator, and the wave period T of the input signal. In this section, the influence of these parameters on the energy transfer of the hydraulic system is comprehensively analyzed.

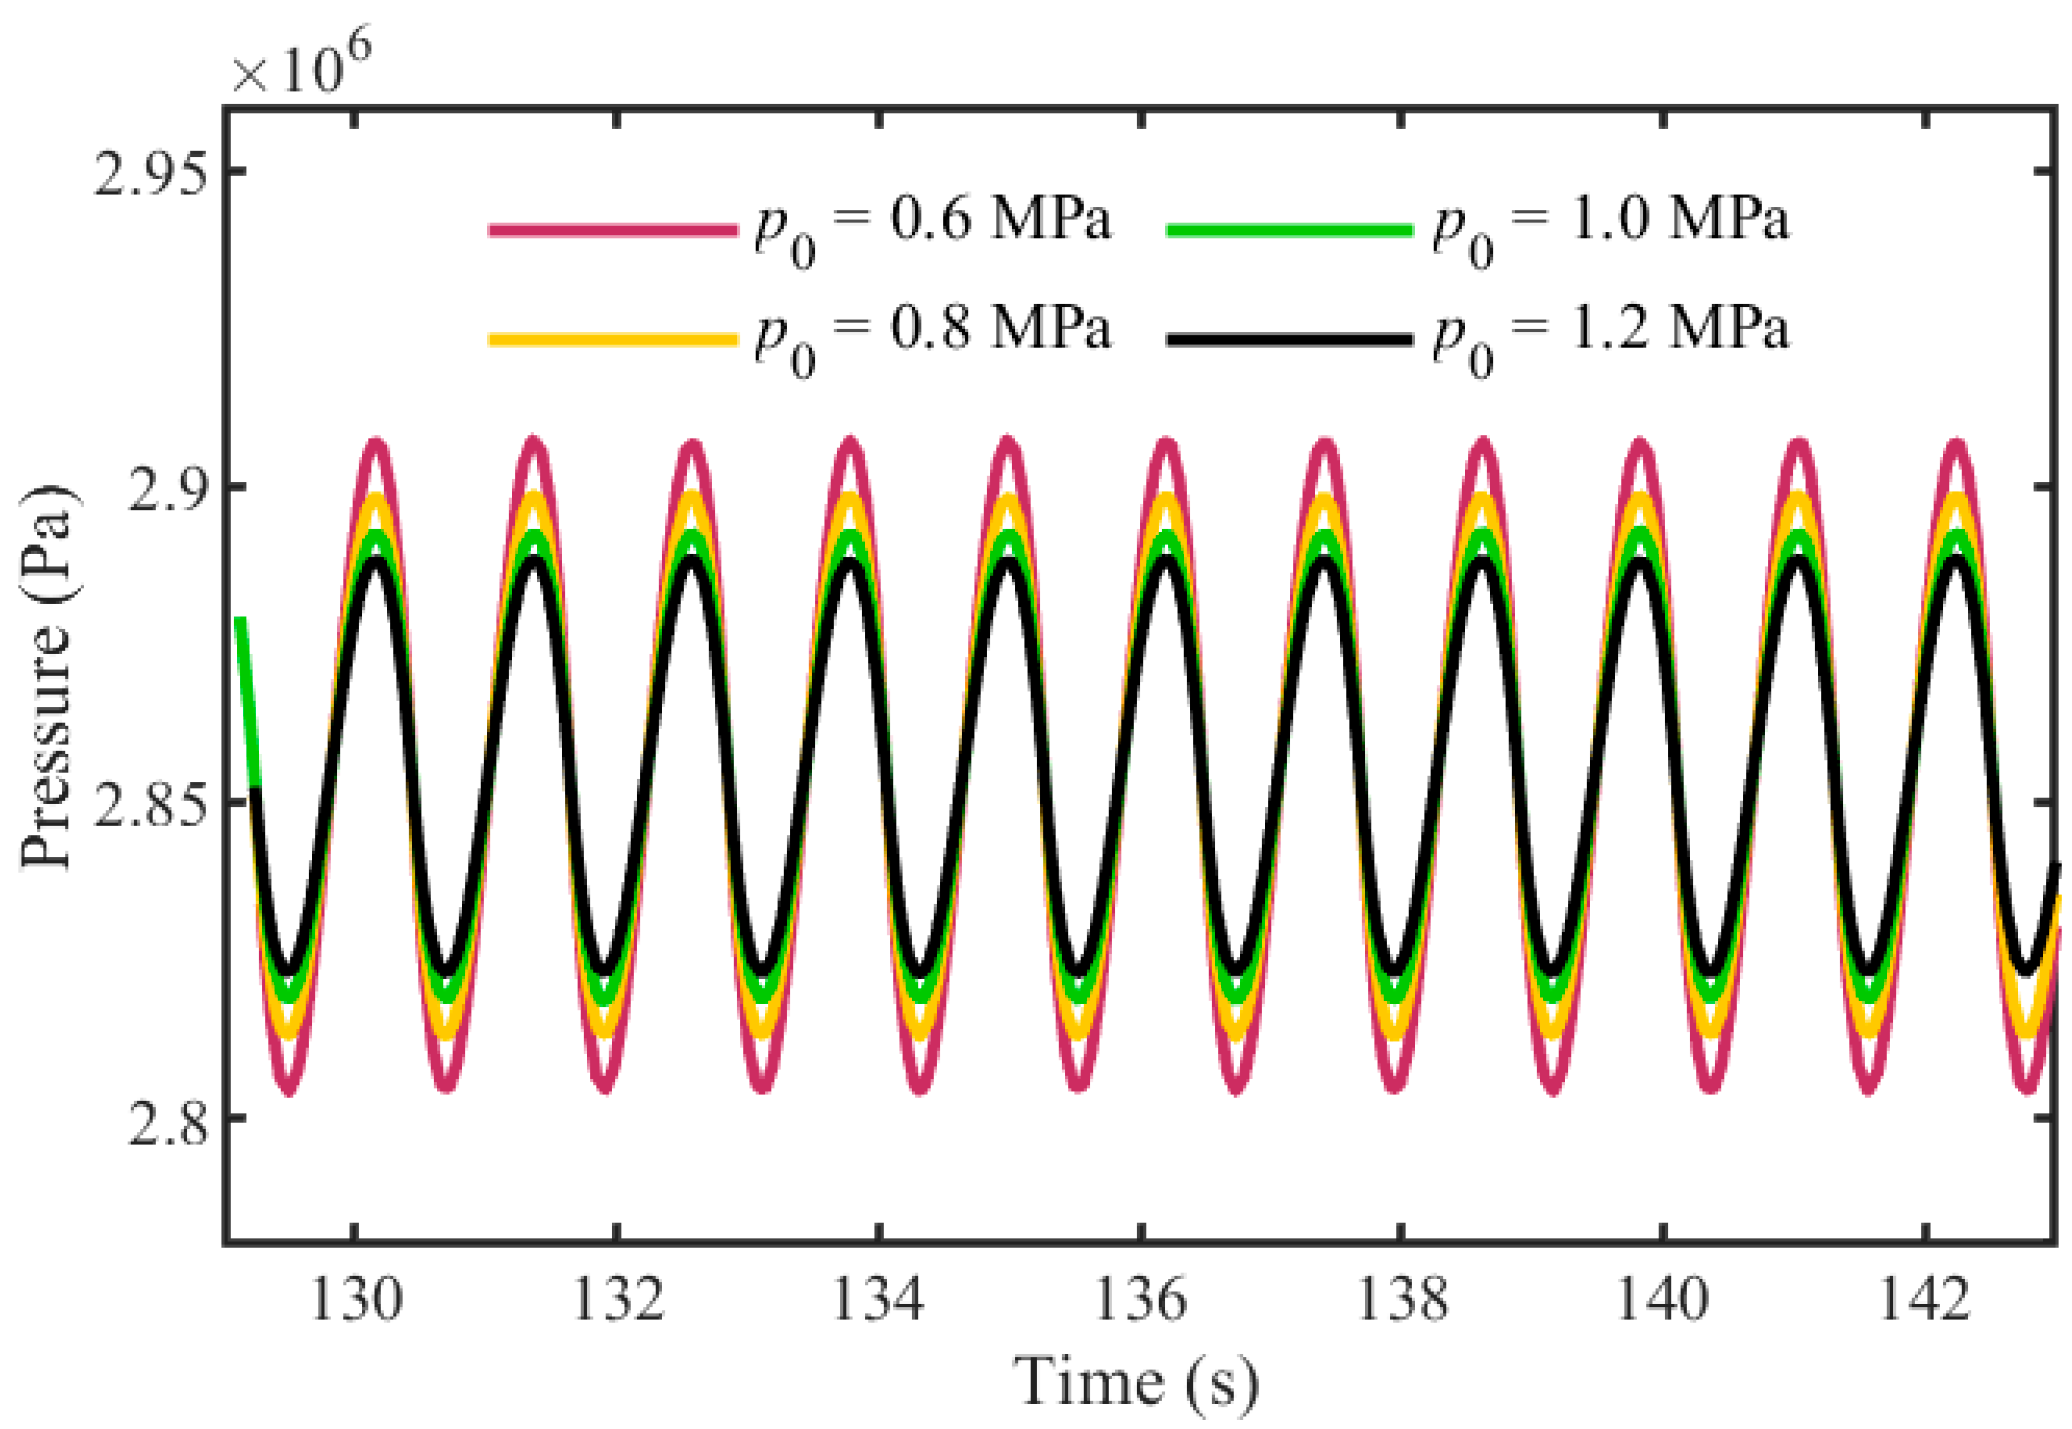
4.2.1. Influence of Pre-Charging Pressure of the Accumulator on Hydraulic PTO System

The pressure fluctuation curves in the hydraulic circuit change with different pre-charging pressure p0 in the accumulator are shown in Figure 11. Figure 11 shows that the pressure fluctuation in the hydraulic circuit is higher when the pre-charging pressure p0 in the accumulator is lower. The pressure fluctuation in the hydraulic circuit is negatively correlated with the pre-charging pressure p0 in the accumulator. The pre-charge pressure p0 of accumulator has no effect on the pressure fluctuation frequency in the hydraulic circuit.
In order to further study the change relationship among correlation parameters, under the condition of the volume of the accumulator V0 = 1.0 L and the period of the input signal T = 3 s. When the average input power is, respectively, selected as 60 W, 80 W, and 100 W, the simulation and calculation results are shown in Figure 12. Figure 12 shows (a) the mean pressure during system operation, (b) the amplitude of pressure fluctuation δph in the hydraulic circuit, and (c) the variation of operating efficiency ηs with pre-charging pressure p0.
Figure 12a shows that the pre-charging pressure p0 of the accumulator has no effect on the mean pressure in the hydraulic circuit. Figure 12b depicts that the pressure fluctuation amplitude δph gradually decreases with the pre-charging pressure p0 increasing. Figure 12c shows that pre-charging pressure p0 has almost no effect on the operation efficiency of the hydraulic system. Figure 12 also shows that the greater the average input power, the greater the average pressure and the pressure fluctuation, but the lower the operating efficiency ηs. Figure 11 and Figure 12 demonstrate that while the parameters of the accumulator cannot decide the output power of the hydraulic system, they significantly influence the pressure fluctuations in the hydraulic circuit during operation, which are critical for the safe and stable work of hydraulic components.

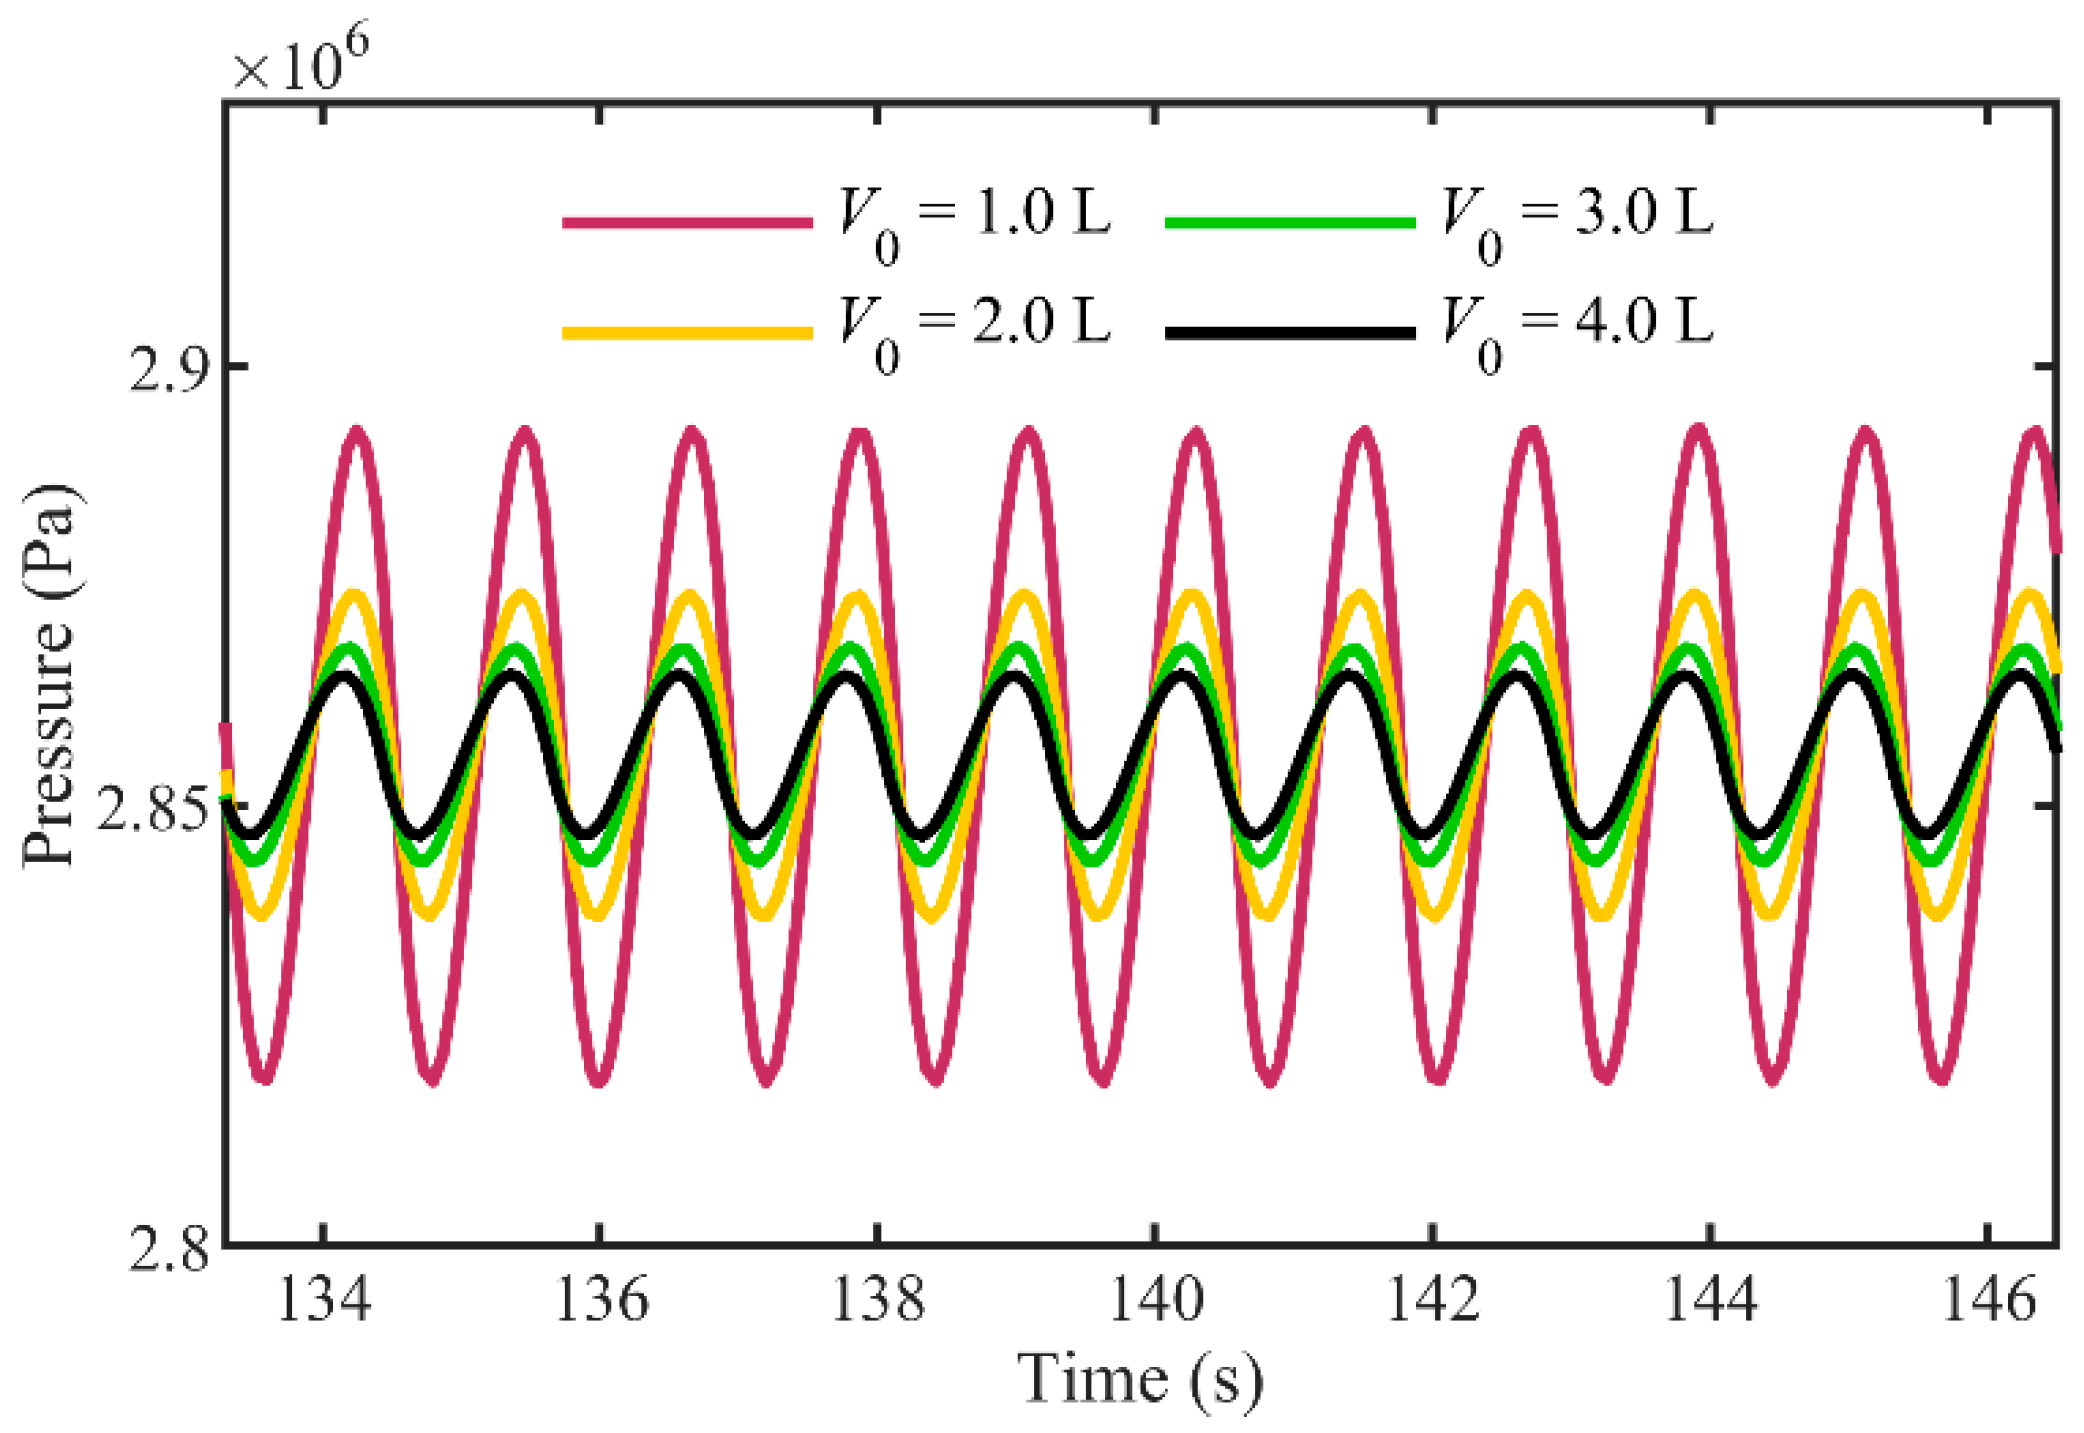
4.2.2. Influence of Volume of the Accumulator on Hydraulic PTO System

The pressure fluctuation curves in the hydraulic circuit change with different volume V0 of the accumulator are shown in Figure 13. Figure 13 shows that the pressure fluctuation in the hydraulic circuit is lower when the volume V0 of the accumulator is bigger. The pressure fluctuation in the hydraulic circuit is negatively correlated with the volume V0 of the accumulator.
Under the condition of the pre-charging pressure of the accumulator p0 = 1.0 MPa and the period of the input signal T = 3 s, when the average input power is, respectively, selected as 60 W, 80 W, and 100 W, the simulation and calculation results are shown in Figure 14. Figure 14 shows (a) the mean pressure during system operation, (b) the amplitude of pressure fluctuation δph in the hydraulic circuit, and (c) the variation in meaningful operating efficiency ηs changes with different volume V0 of the accumulator in the hydraulic system.
Figure 14a shows that the volume V0 of the accumulator has no effect on the mean pressure in the hydraulic circuit. Figure 14b depicts that the pressure fluctuation amplitude gradually decreases with the volume V0 increasing, and the pressure fluctuation decreases rapidly when V0 = 1.0~2.5 L, the pressure fluctuation decreases slowly when V0 = 2.5~4.0 L. Figure 14c shows that volume V0 has almost no effect on the operation efficiency of the hydraulic system. Figure 13 and Figure 14 demonstrates that while the parameters of the accumulator cannot decide the output power of the hydraulic system, they significantly influence the pressure fluctuations in the hydraulic circuit during operation. Compared with pre-charging pressure p0, the volume V0 of the accumulator has a more obvious response to the pressure fluctuation in the hydraulic circuit, and the smaller the volume V0, the more severe. This shows that the design of the pressure compensation parameters in the hydraulic circuit should reasonably balance the amplitude of pressure fluctuation and the volume of the accumulator.

4.2.3. Influence of Period of Input Wave Power on Hydraulic PTO System

The pressure fluctuation curves in the hydraulic circuit that change with a different wave period under the same input power are shown in Figure 15. Figure 15 shows that the pressure fluctuation in the hydraulic circuit is lower when the wave period is shorter. The pressure fluctuation in the hydraulic circuit is positively correlated with the wave period under the same input power.
Under the condition of the volume of the accumulator V0 = 1.0 L and the pre-charging pressure of the accumulator p0 = 1.0 MPa, when the average input power is, respectively, selected as 60 W, 80 W, and 100 W, the simulation and calculation results are shown in Figure 16. Figure 16 shows (a) the mean pressure during system operation, (b) the amplitude of pressure fluctuation δph in the hydraulic circuit, and (c) the variation in meaningful operating efficiency ηs changes with different wave periods in the hydraulic system.
Figure 15 and Figure 16 describe the influence of different wave periods under the same input power on the hydraulic system. Figure 16a shows that the mean pressure will gradually increase as the period becomes longer. Figure 16b shows that the pressure fluctuation amplitude also increases gradually as the period becomes longer. Given that both the mean pressure and the fluctuation amplitude change concurrently, we use a relative value of pressure fluctuation, as shown in Figure 16c, to depict its dependency on the wave period. It represents the ratio of pressure fluctuation amplitude to the mean pressure value. As the period lengthens, the relative pressure fluctuation correspondingly increases. Figure 16d shows that the operating efficiency of the hydraulic system can also gradually improve with the longer period.
In this section, it can be concluded that the design parameters of accumulator are major factors in determining the pressure fluctuations in the hydraulic circuit. Under the influence of waves with different powers and frequencies, an effective strategy is essential to modulate circuit pressure fluctuations, safeguarding the operation of hydraulic components. For this purpose, a hierarchical arrangement of accumulators has been implemented instead of a single accumulator. This setup allows for pressure adjustment through controlled accumulator activation and deactivation, catering to diverse environmental demands, as depicted in Figure 17. Currently, this proposal is still in the design concept and will be thoroughly investigated in our future work.

5. Conclusions

This paper focuses on a hydraulic PTO system with a double-acting hydraulic pump and accumulators which are suitable for WEC equipment, and discusses the dynamic characteristics of pressure fluctuation in a hydraulic circuit, and determines the influence law of main factors. The innovative achievements are summarized as follows:
(1)
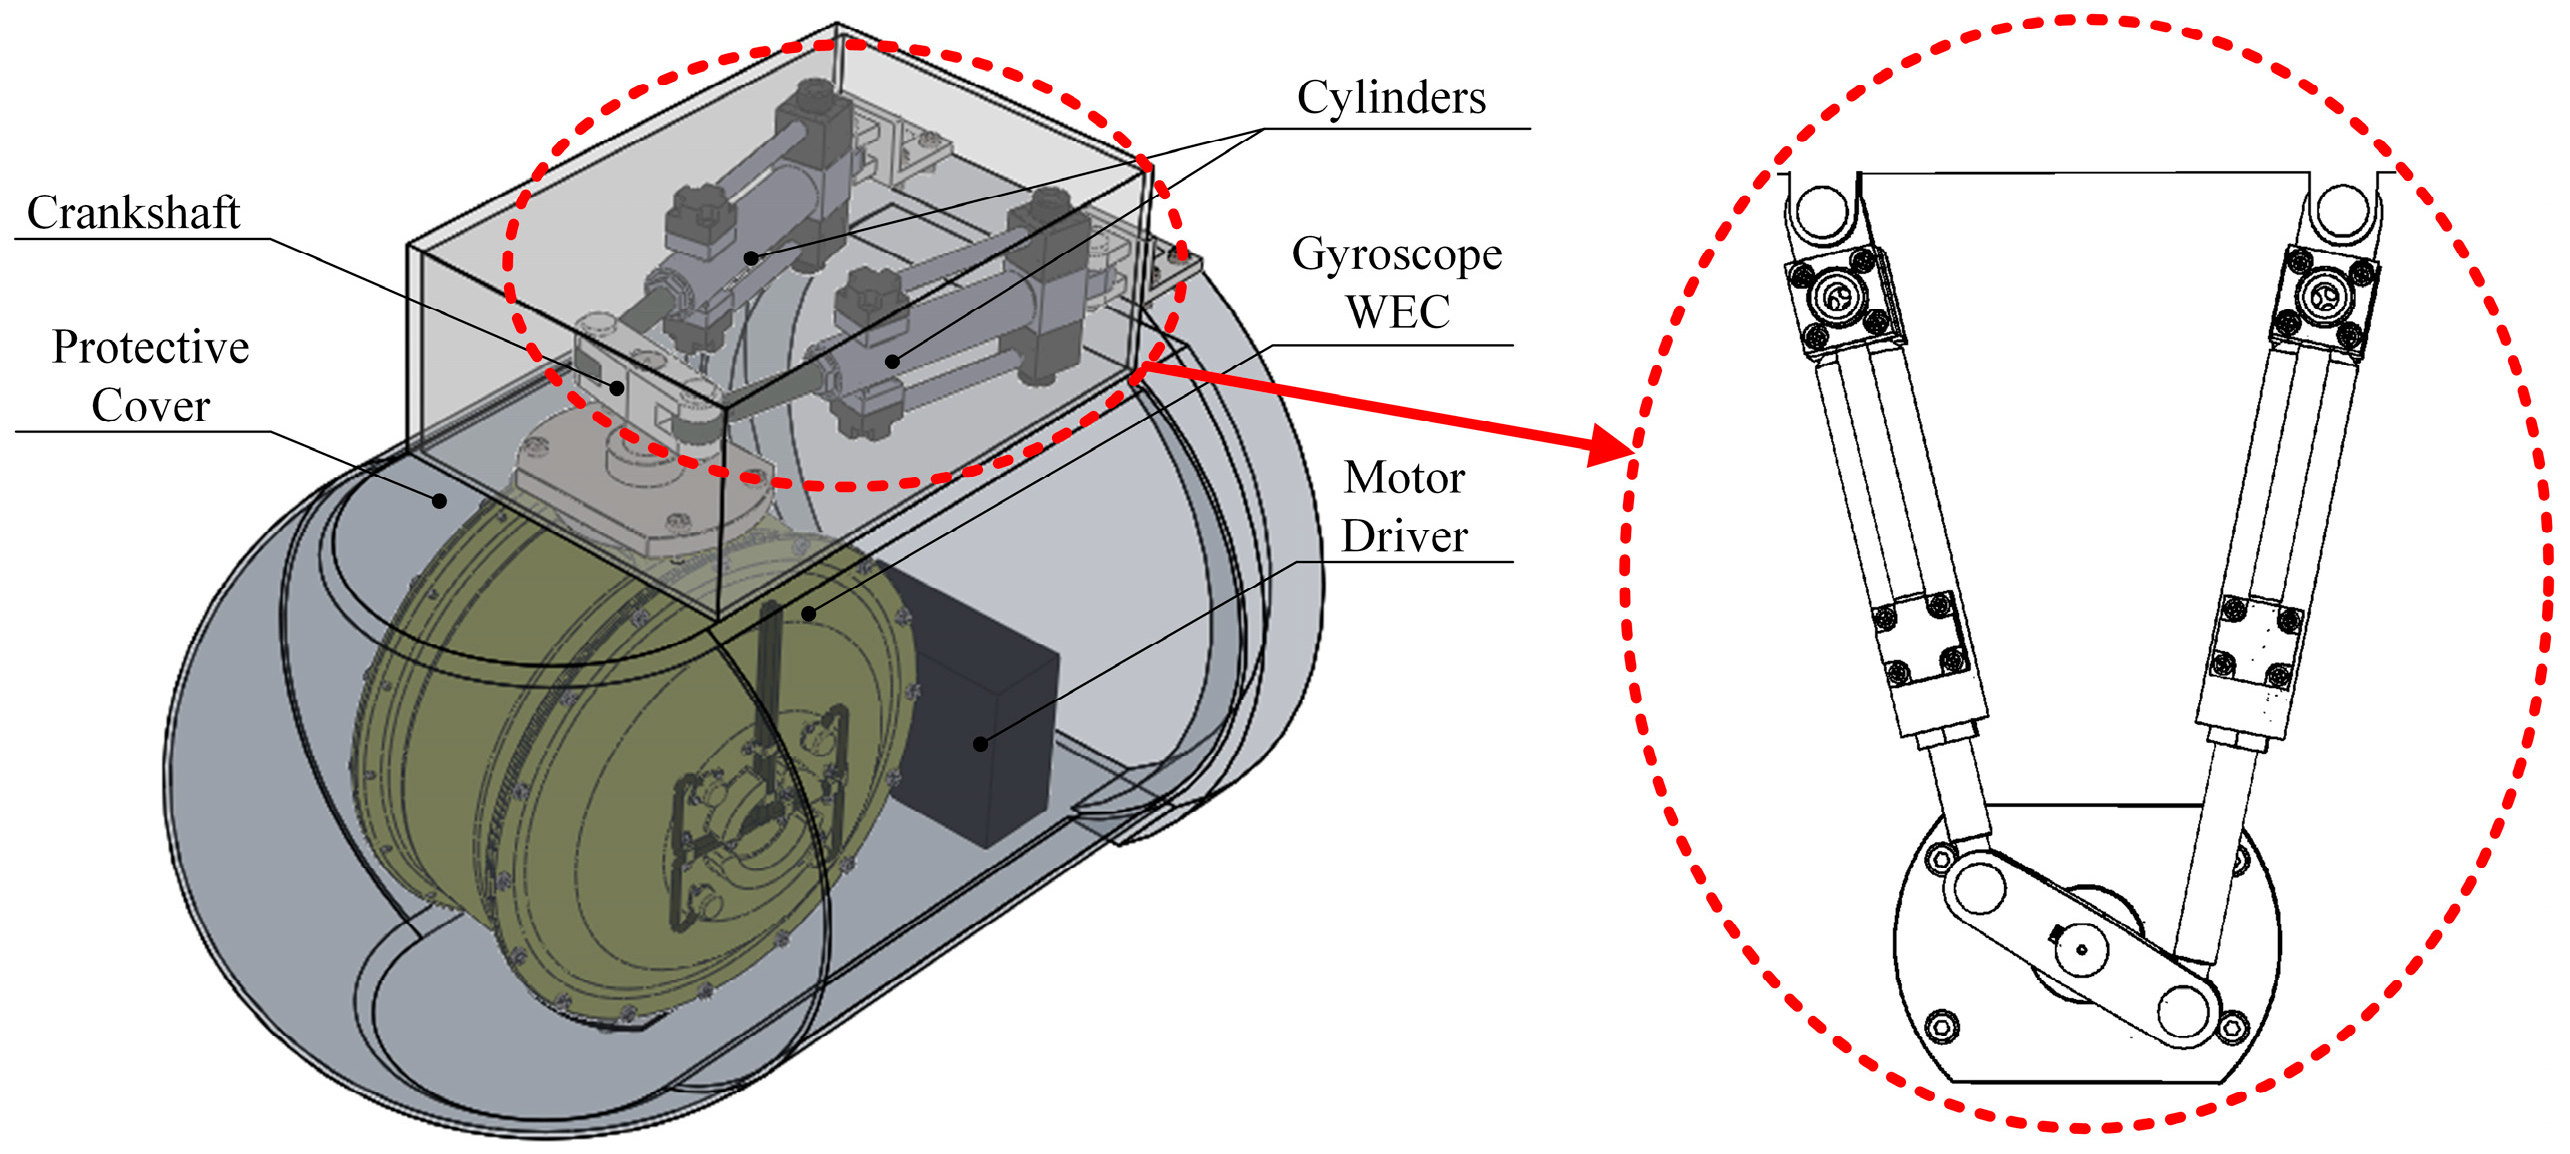
The compositions and operating principle of the novel hydraulic PTO system with a double-acting hydraulic pump and accumulators are explained. The pressure and flow fluctuation smoothing effect and energy compensation mechanism of the new hydraulic PTO system are analyzed.
(2)
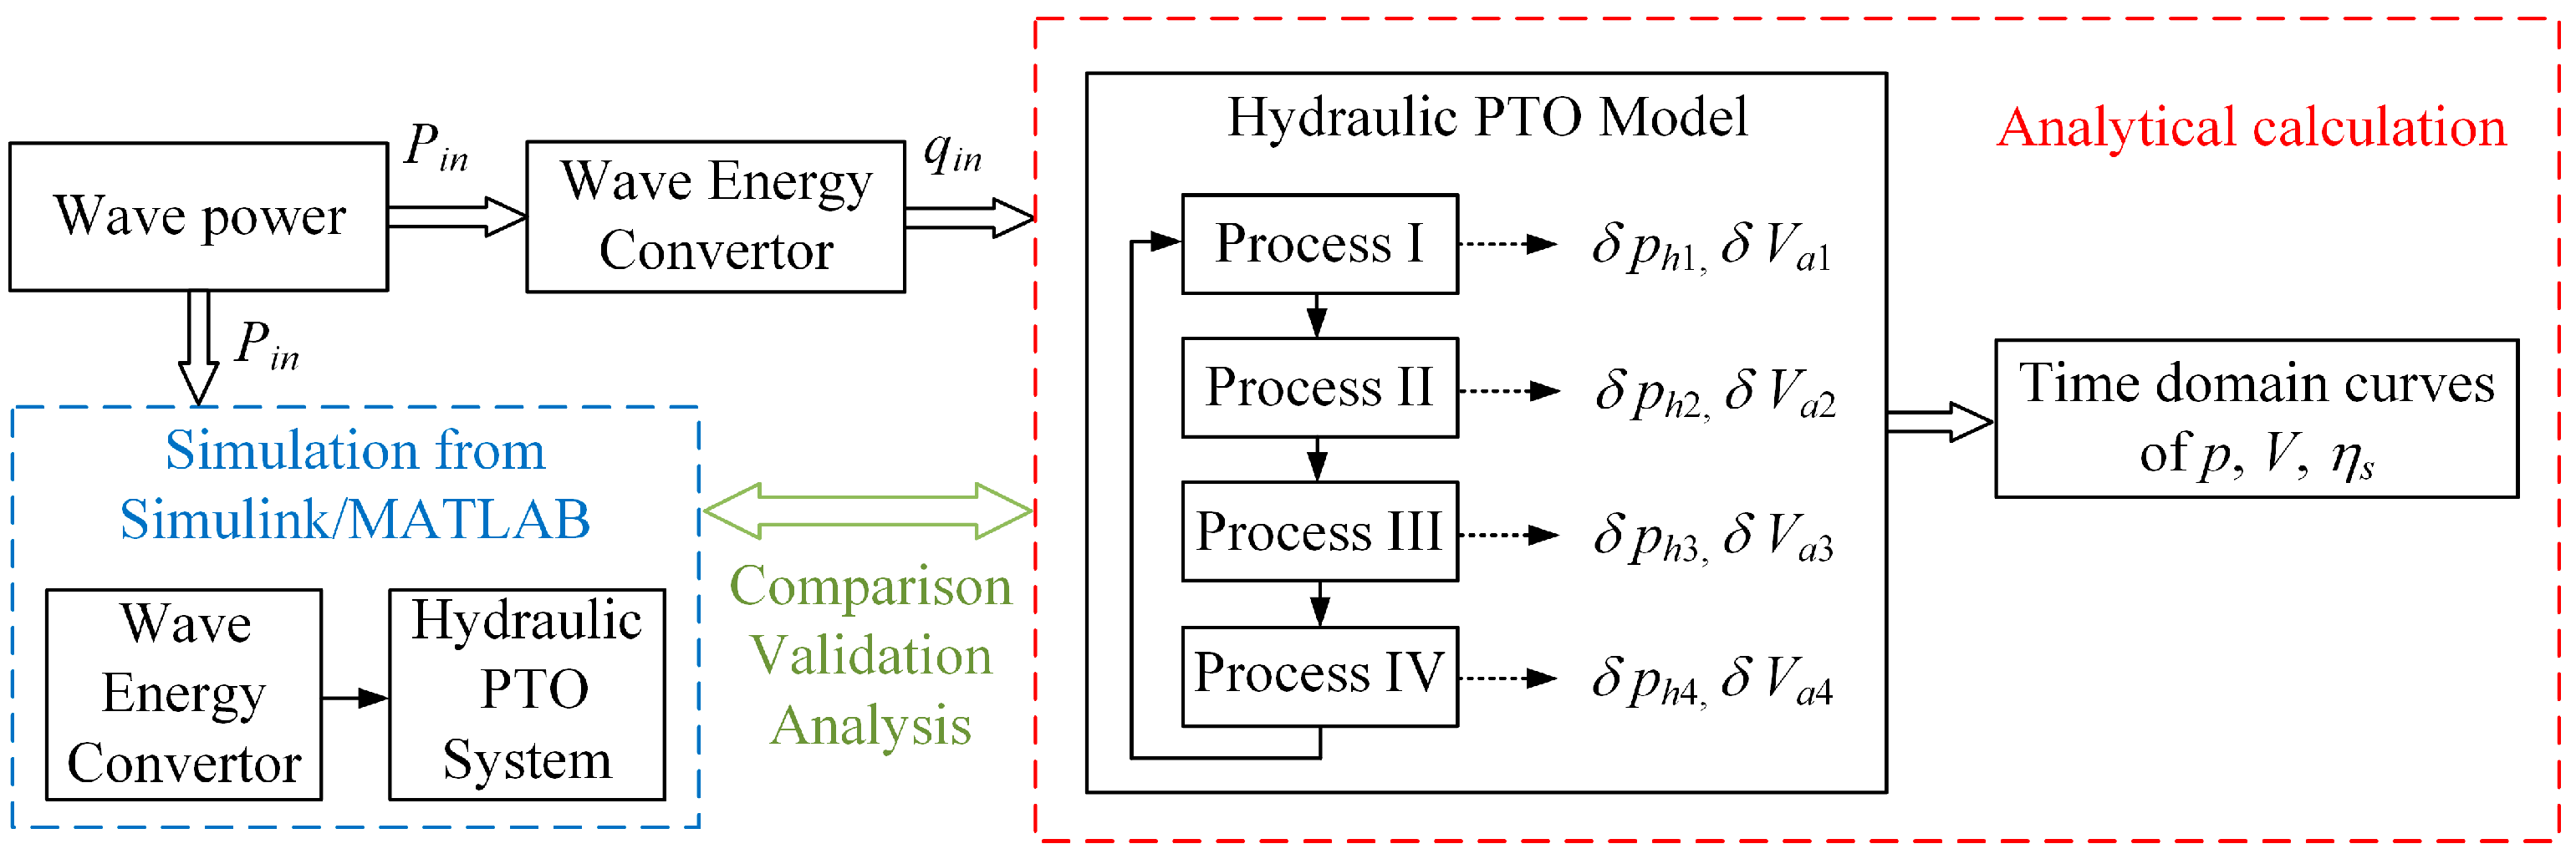
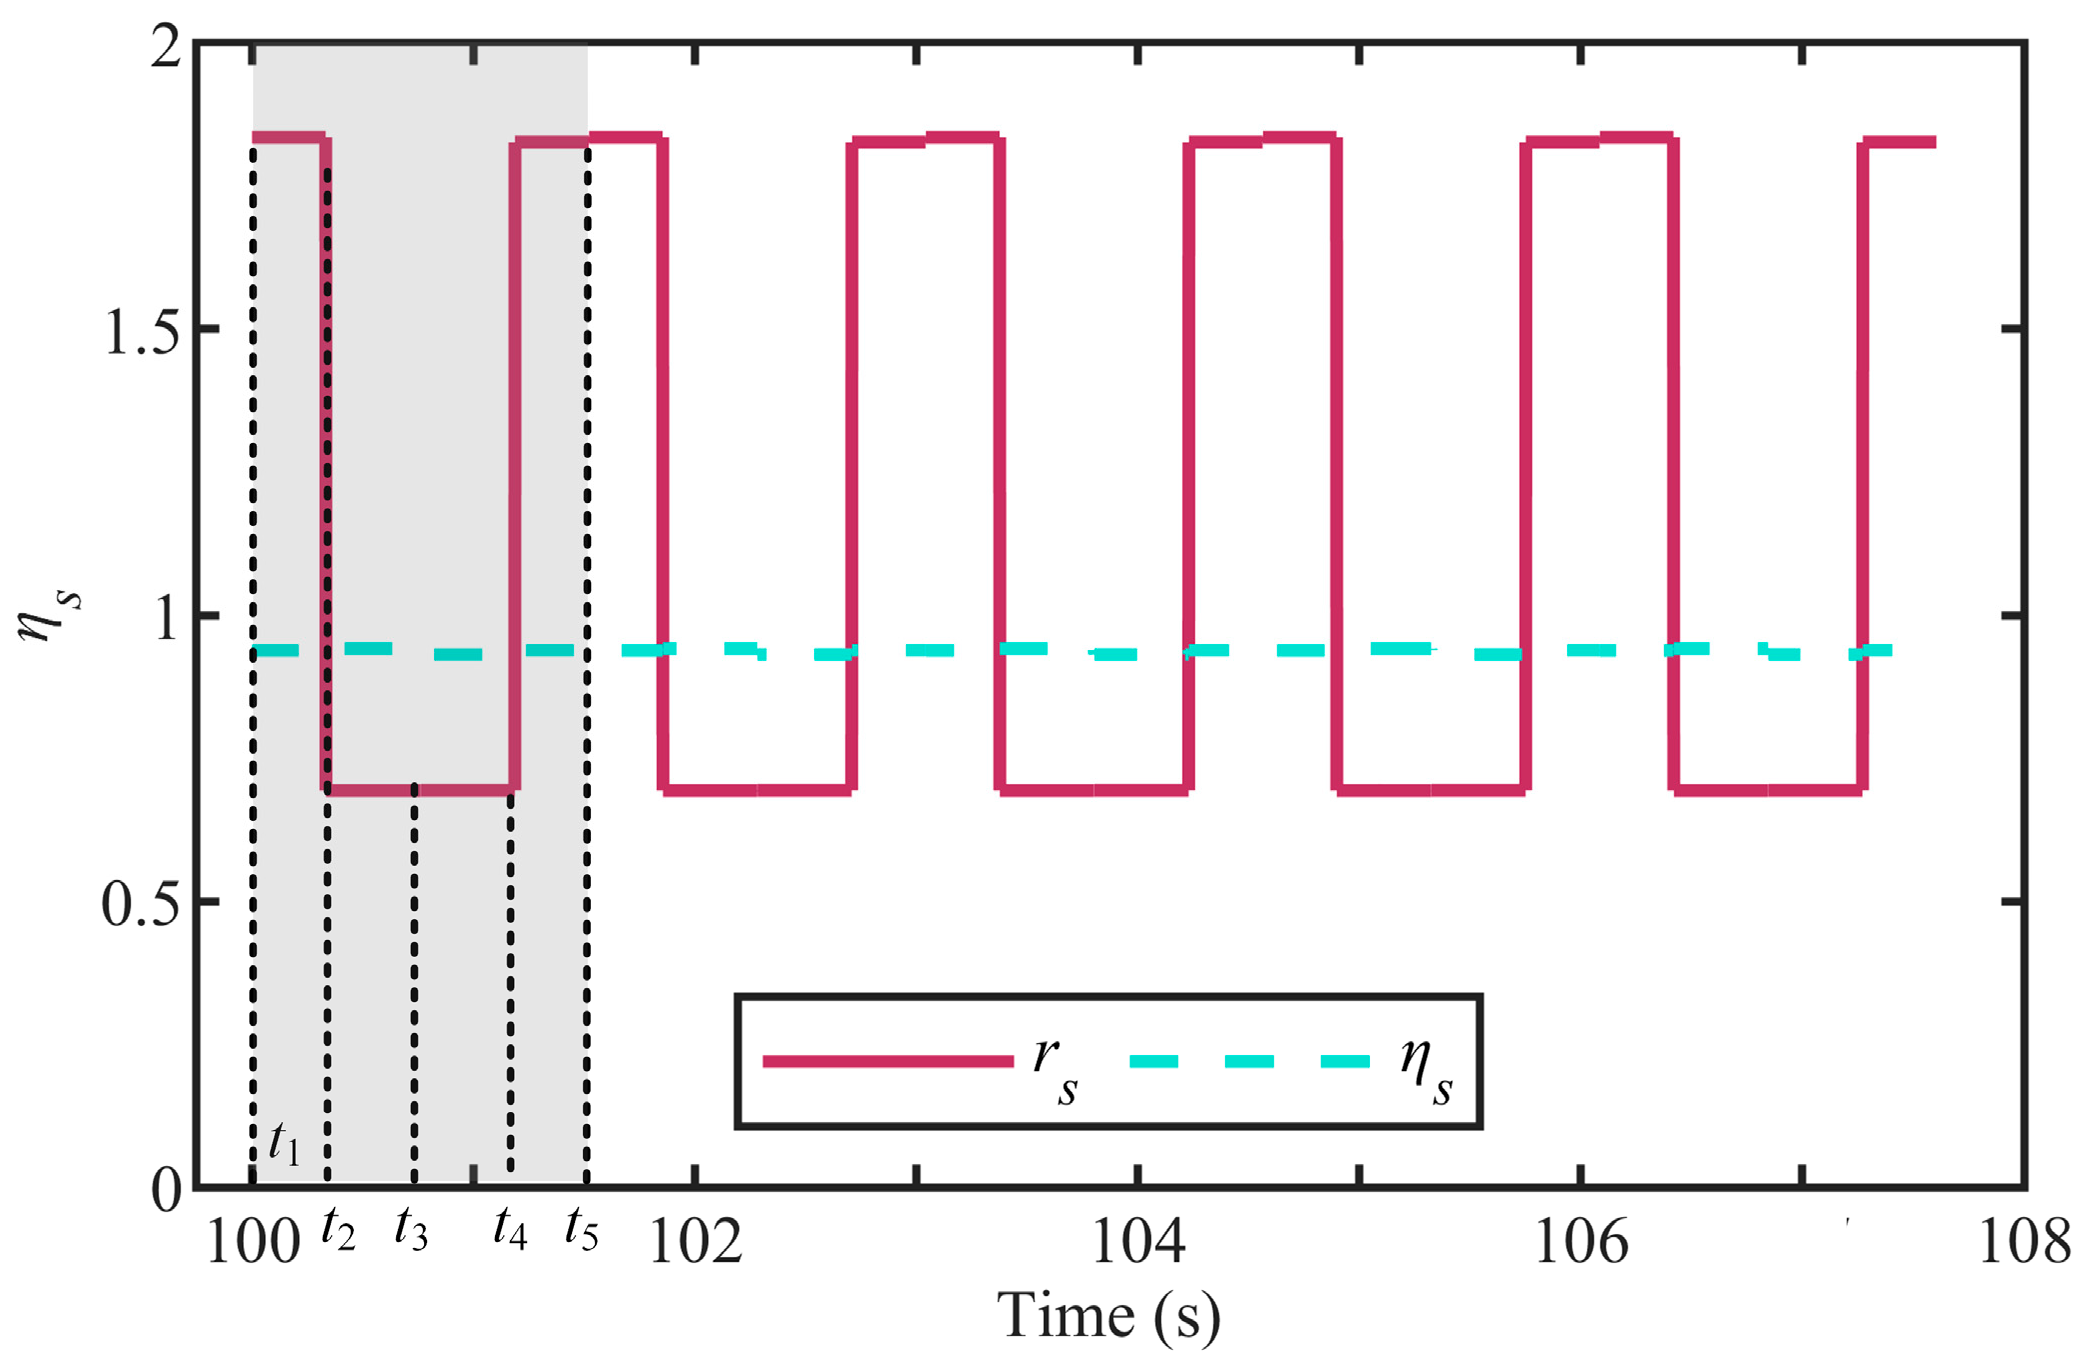
A sub-division analysis method for pressure fluctuation compensation of a hydraulic PTO system is proposed. The mathematical model describing the dynamic process of the accumulator smoothing the pressure fluctuation in a hydraulic PTO system is established based on the sub-division principle. The interaction relation between the energy output and the accumulator operating parameters in a hydraulic PTO system is obtained.
(3)
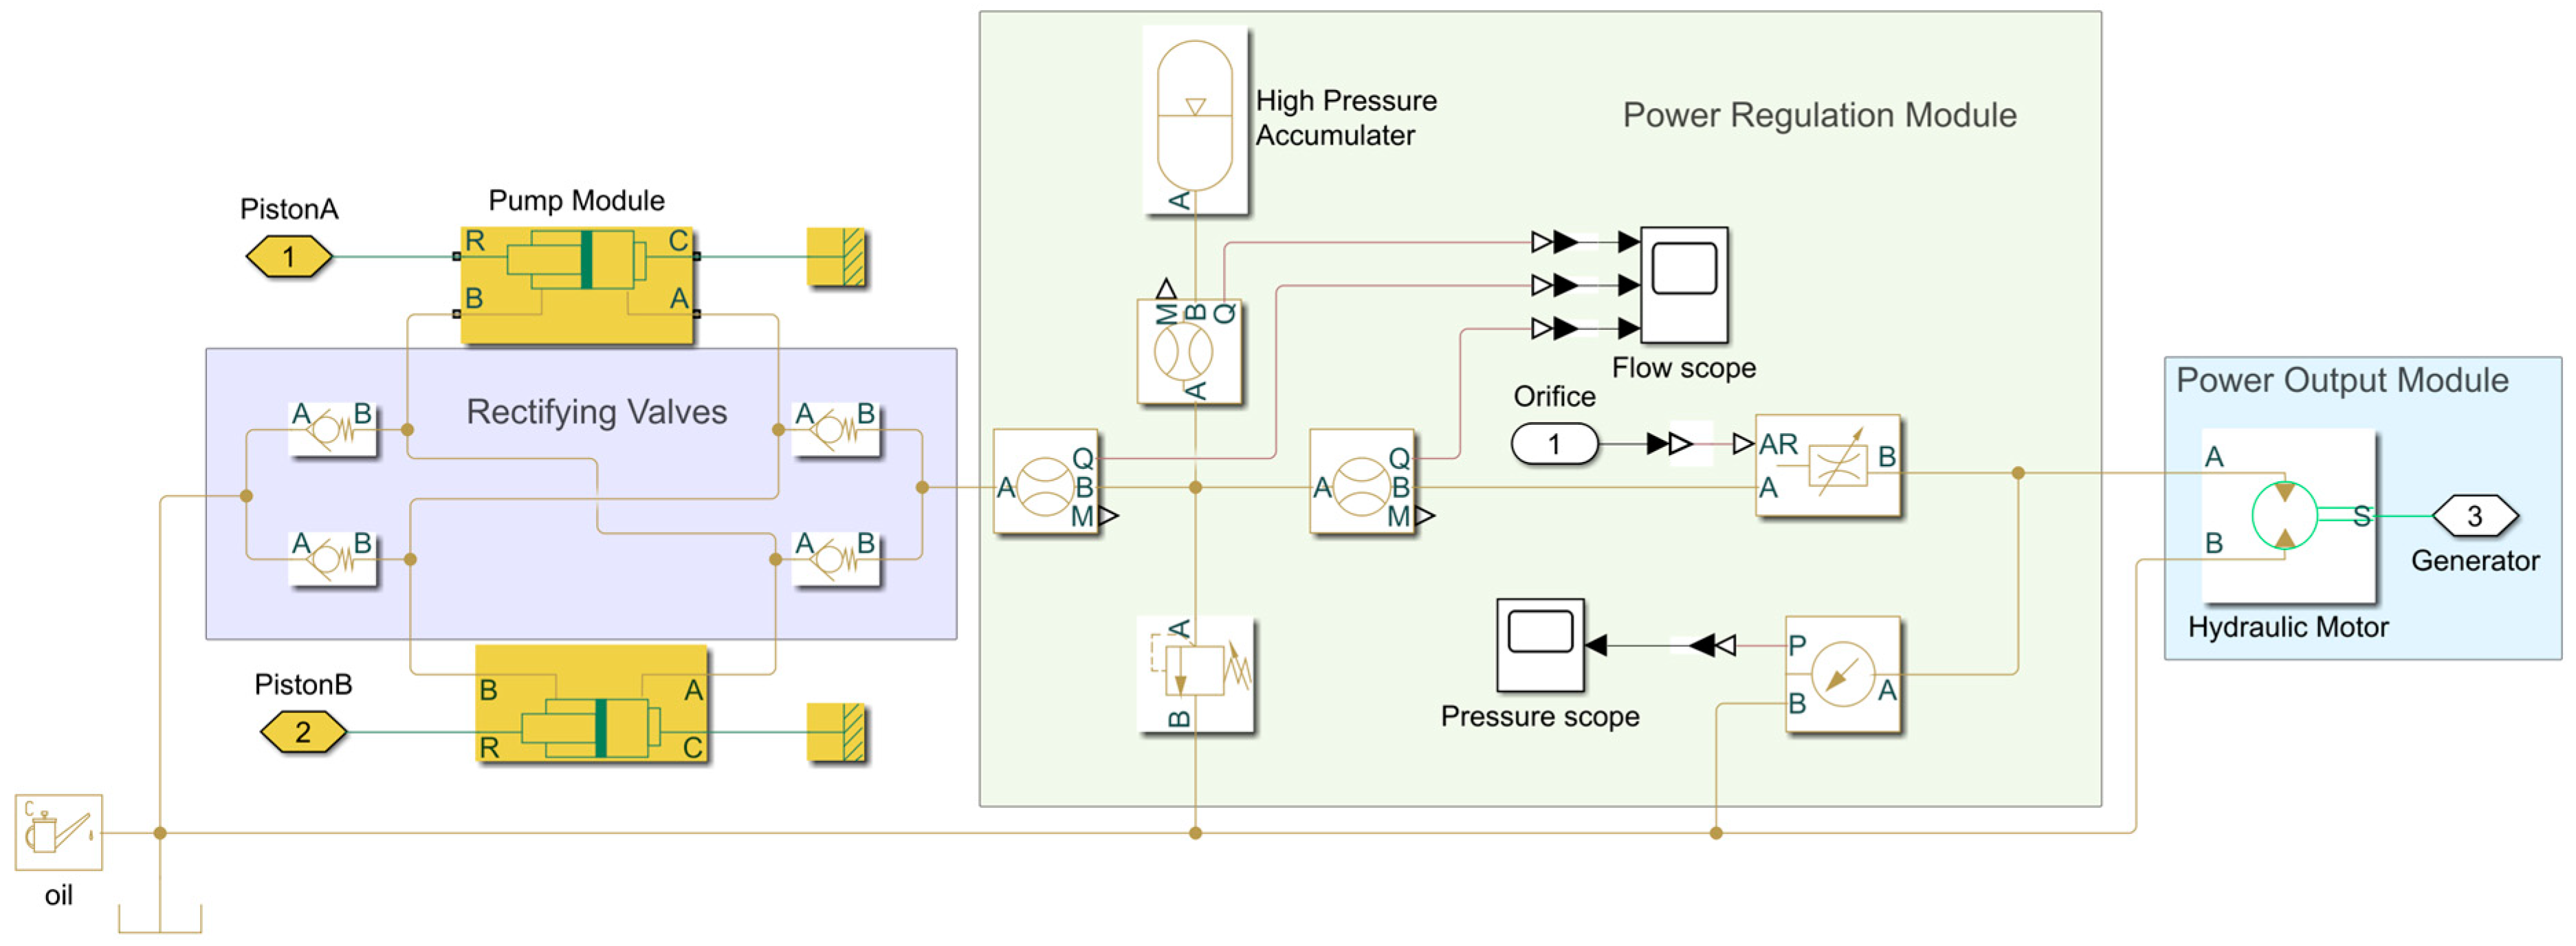
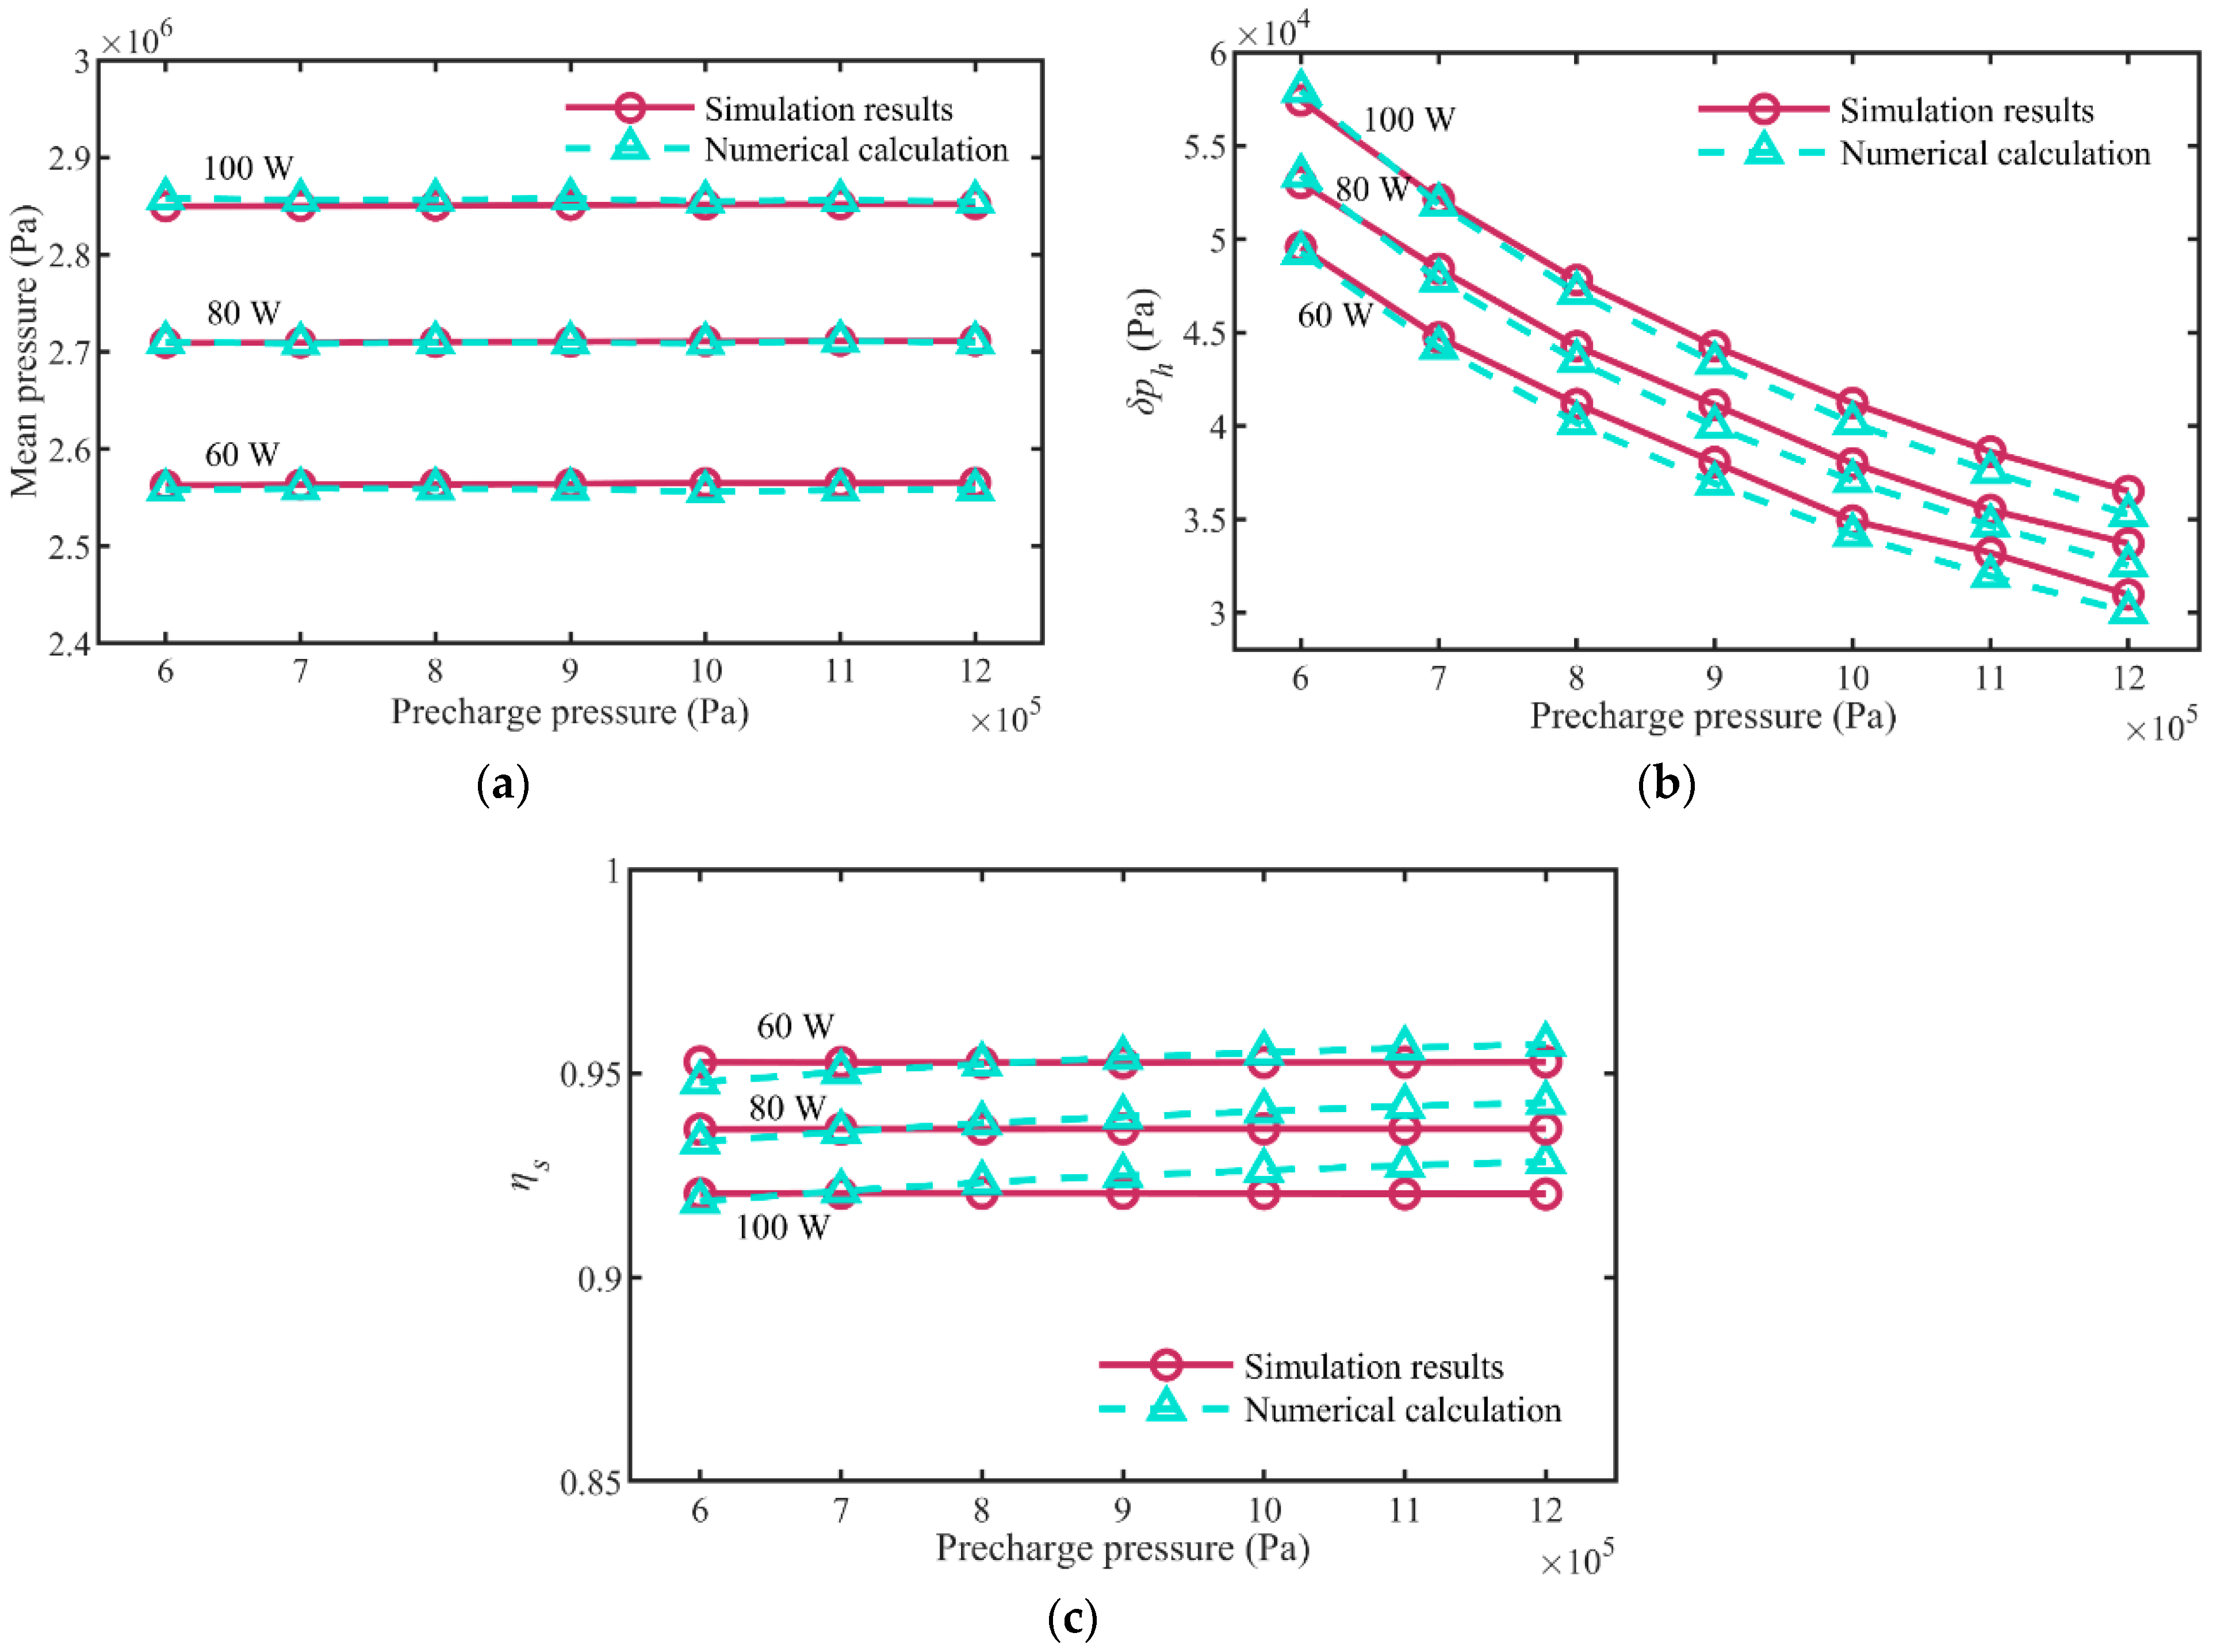
Based on the mathematical model of energy compensation hydraulic PTO system by means of the sub-division principle, the MATLAB/Simulink simulation model used for analyzing the accumulator compensation hydraulic PTO system is established. The numerical results and MATLAB simulation results of the hydraulic PTO system with accumulator compensation can be mutually verified. It is concluded that the energy transfer efficiency of the hydraulic system with fine compensation of the accumulator in each sub-process is above 90%.
(4)
The main factors affecting the output performance of the hydraulic PTO system are analyzed. The results show that the pressure fluctuation amplitude in the hydraulic circuit is negatively correlated with the accumulator pre-charge pressure p0, is negatively correlated with the accumulator volume V0, and is positively correlated with the operating period of the hydraulic pump. To achieve the desired effect of pressure fluctuation compensation, it is necessary to reasonably design the pressure fluctuation amplitude, the accumulator volume, and the parameters of the hydraulic PTO system.
For future work, we consider using the proposed analytical model to guide control strategies, enabling real-time dynamic adjustments of hydraulic PTO systems.

Author Contributions

Conceptualization, Z.P. and Z.T.; methodology, H.J.; software, H.J.; validation, H.J., M.L. and Z.T.; formal analysis, H.J.; investigation, H.J.; resources, H.J. and Z.T.; data curation, H.J. and M.L.; writing—original draft preparation, H.J.; writing—review and editing, H.J., Z.P. and Z.T.; visualization, H.J.; supervision, Z.P.; project administration, Z.P.; funding acquisition, Z.P. All authors have read and agreed to the published version of the manuscript.

Funding

This research received no funding.

Data Availability Statement

Data available on request due to restrictions.

Conflicts of Interest

The authors declare no conflicts of interest.

References

  1. Melikoglu, M. Current status and future of ocean energy sources: A global review. Ocean Eng. 2018, 148, 563–573. [Google Scholar] [CrossRef]
  2. Penalba, M.; Ringwood, J.V. A Review of Wave-to-Wire Models for Wave Energy Converters. Energies 2016, 97, 506. [Google Scholar] [CrossRef]
  3. Falcão, A.F.O. Wave energy utilization: A review of the technologies. Renew. Sustain. Energy Rev. 2010, 14, 899–918. [Google Scholar] [CrossRef]
  4. Rusu, E.; Onea, F. A review of the technologies for wave energy extraction. Clean Energy 2018, 2, 10–19. [Google Scholar] [CrossRef]
  5. Lasa, J.; Antolin, J.C.; Angulo, C.; Estensoro, P.; Santos, M.; Ricci, P. Design, Construction and Testing of a Hydraulic Power Take-Off for Wave Energy Converters. Energies 2012, 5, 2030–2052. [Google Scholar] [CrossRef]
  6. Liu, Z.; Shi, H.; Cui, Y.; Kim, K. Experimental study on overtopping performance of a circular ramp wave energy converter. Renew. Energy 2017, 104, 163–176. [Google Scholar] [CrossRef]
  7. Vicinanza, D.; Di Lauro, E.; Contestabile, P.; Gisonni, C.; Lara, J.L.; Losada, I.J. Review of Innovative Harbor Breakwaters for Wave-Energy Conversion. J. Waterw. Port Coast. Ocean Eng. 2018, 145, 03119001. [Google Scholar] [CrossRef]
  8. Takao, M.; Setoguchi, T. Air Turbines for Wave Energy Conversion. Int. J. Rotating Mach. 2012, 2012, 717398. [Google Scholar] [CrossRef]
  9. Henriques, J.C.C.; Gomes, R.P.F.; Gato, L.M.C.; Falcão, A.F.O.; Robles, E.; Ceballos, S. Testing and control of a power take-off system for an oscillating-water-column wave energy converter. Renew. Energy 2016, 85, 714–724. [Google Scholar] [CrossRef]
  10. Jusoh, M.A.; Ibrahim, M.Z.; Daud, M.Z.; Albani, A.; Yusop, Z.M. Hydraulic Power Take-Off Concepts for Wave Energy Conversion System: A Review. Energies 2019, 1223, 4510. [Google Scholar] [CrossRef]
  11. Gaspar, J.F.; Calvário, M.; Kamarlouei, M.; Guedes Soares, C. Power take-off concept for wave energy converters based on oil-hydraulic transformer units. Renew. Energy 2016, 86, 1232–1246. [Google Scholar] [CrossRef]
  12. Yemm, R.; Pizer, D.; Retzler, C.; Henderson, R. Pelamis: Experience from concept to connection. Philos. Trans. R. Soc. A Math. Phys. Eng. Sci. 2012, 370, 365–380. [Google Scholar] [CrossRef] [PubMed]
  13. Liu, C.; Yang, Q.; Bao, G. Influence of hydraulic power take-off unit parameters on power capture ability of a two-raft-type wave energy converter. Ocean Eng. 2018, 150, 69–80. [Google Scholar] [CrossRef]
  14. Hansen, R.H.; Kramer, M.M.; Vidal, E.; Hansen, R.H.; Kramer, M.M.; Vidal, E. Discrete Displacement Hydraulic Power Take-Off System for the Wavestar Wave Energy Converter. Energies 2013, 6, 4001–4044. [Google Scholar] [CrossRef]
  15. How It Works—Eco Wave Power. Available online: https://www.ecowavepower.com/our-technology/howit-works/ (accessed on 14 June 2024).
  16. WaveRoller—AW Energy, Oy. Available online: http://aw-energy.com/waveroller/#technology (accessed on 14 June 2024).
  17. Huang, Q.; Wang, P.; Liu, Y.; Li, B. Modeling and Simulation of Hydraulic Power Take-Off Based on AQWA. Energies 2022, 15, 3918. [Google Scholar] [CrossRef]
  18. Song, R.; Ming, Y.; Xiaohua, D. Intermittent wave energy generation system with hydraulic energy storage and pressure control for stable power output. J. Mar. Sci. Technol. 2018, 23, 802–813. [Google Scholar] [CrossRef]
  19. Hansen, A.H.; Asmussen, M.F.; Bech, M.M. Model predictive control of a wave energy converter with discrete fluid power power take-off system. Energies 2018, 11, 635. [Google Scholar] [CrossRef]
  20. Babarit, A.; Guglielmi, M.; Clément, A.H. Declutching control of a wave energy converter. Ocean Eng. 2009, 36, 1015–1024. [Google Scholar] [CrossRef]
  21. Hansen, R.H.; Andersen, T.O.; Perdersen, H.C. Analysis of discrete pressure level systems for Wave Energy Converters. In Proceedings of the 2011 International Conference on Fluid Power and Mechatronics, Beijing, China, 17–20 August 2011; pp. 552–558. [Google Scholar]
  22. Cargo, C.J.; Hillis, A.J.; Plummer, A.R. Optimisation and control of a hydraulic power take-off unit for a wave energy converter in irregular waves. Proc. Inst. Mech. Eng. Part A J. Power Energy 2014, 228, 462–479. [Google Scholar] [CrossRef]
  23. Jia, H.; Pei, Z.; Tang, Z.; Yang, J. Modeling and Analysis of an Inertia Wave Energy Converter and Its Optimal Design. J. Mar. Sci. Eng. 2023, 117, 1351. [Google Scholar] [CrossRef]
  24. Zhang, D.; Li, W.; Zhao, H.; Bao, J.; Lin, Y. Design of A Hydraulic Power Take-off System for the Wave Energy Device with An Inverse Pendulum. China Ocean Eng. 2014, 2, 283–292. [Google Scholar] [CrossRef]
  25. Dießel, D.; Bryans, G.; Verdegem, L.; Murrenhoff, H. Wavepod a transmission for wave energy converters—Set up and testing. Int. J. Fluid Power 2015, 16, 75–82. [Google Scholar] [CrossRef]
Figure 1. Flowchart of research.
Actuators 13 00261 g001
Figure 2. Hydraulic transmission mechanism on WEC device.
Actuators 13 00261 g002
Figure 3. Structural model of hydraulic PTO system. (1, 2. hydraulic cylinder; 3–6. check valve; 7. oil filter; 8, 23, 28 pressure sensor; 9, 16, 17, 19, 22, 27. on-off valve; 10, 12. relief valve; 11, 13. oil tank; 14, 21, 26. flow sensor; 15. high-pressure accumulator; 18. low-pressure accumulator; 20. throttle valve; 24. hydraulic motor; 25. generator).
Actuators 13 00261 g003
Figure 4. Output power when the accumulator is disabled or is enabled under (a) regular wave action and (b) random wave action.
Actuators 13 00261 g004
Figure 5. Process of charging and releasing fluid in the accumulator.
Actuators 13 00261 g005
Figure 6. Flow rate variable and processes divided in the hydraulic circuit.
Actuators 13 00261 g006
Figure 7. (a) p-V curve of accumulator and (b) p-V-t curve of accumulator.
Actuators 13 00261 g007
Figure 8. Simulation model of hydraulic PTO system in MATLAB/Simulink.
Actuators 13 00261 g008
Figure 9. Simulation result compared with the numerical calculation results (a) pressure in the hydraulic circuit, (b) volume of gas in the accumulator, (c) output flow rate of the hydraulic pump, and (d) inlet and outlet flow rate of the accumulator.
Actuators 13 00261 g009
Figure 10. The variation of rs and ηs from process I~IV.
Actuators 13 00261 g010
Figure 11. The pressure in the hydraulic circuit change with different pre-charging pressure p0 in the accumulator.
Actuators 13 00261 g011
Figure 12. (a) Mean pressure (b) pressure fluctuation amplitude δph and (c) operating efficiency ηs in the hydraulic circuit change with different pre-charging pressure p0 in the accumulator.
Actuators 13 00261 g012
Figure 13. The pressure in the hydraulic circuit change with different volume of the accumulator.
Actuators 13 00261 g013
Figure 14. (a) Mean pressure (b) pressure fluctuation amplitude δph and (c) operating efficiency ηs in the hydraulic circuit change with different volume of the accumulator.
Actuators 13 00261 g014
Figure 15. The pressure in the hydraulic circuit change with different cycle period under the same input power.
Actuators 13 00261 g015
Figure 16. (a) Mean pressure (b) pressure fluctuation amplitude δph, (c) relative pressure fluctuation and (d) operating efficiency ηs in the hydraulic circuit change with wave period.
Actuators 13 00261 g016
Figure 17. A design concept of hierarchical accumulator.
Actuators 13 00261 g017
Table 1. Parameters of the hydraulic PTO system.
ParameterSymbolUnitsValue
Amplitude of piston displacementX0m3.0 × 10−2
Area of pistonApm24.9 × 10−4
Ratio of the areaσ-0.41
Density of fluidρkg/m30.8 × 103
Adiabatic index of accumulatorγ-1.4
Displacement of hydraulic motor-m3/rev1.0 × 10−6
Disclaimer/Publisher’s Note: The statements, opinions and data contained in all publications are solely those of the individual author(s) and contributor(s) and not of MDPI and/or the editor(s). MDPI and/or the editor(s) disclaim responsibility for any injury to people or property resulting from any ideas, methods, instructions or products referred to in the content.

