Abstract
Diagnosing complex air compressor systems with traditional data-driven deep learning models often results in isolated fault diagnosis, ignoring correlations between concurrent faults. This paper introduces a knowledge graph construction approach for the air compressor fault diagnosis field, using after-sales business data as the source. We propose a model based on Robustly Optimized Bidirectional Encoder Representations from Transformers (RoBERTa), specifically tailored for constructing a knowledge graph for air compressor fault diagnosis. By integrating Whole Word Masking (WWM) technology, Bidirectional Long Short-Term Memory (BiLSTM), and Conditional Random Fields (CRFs), our approach effectively extracts specific entities from unstructured data. On our dataset, the model achieved an average accuracy of 0.7962 and an F1 score of 0.7956, demonstrating notable improvements in both accuracy and recall for entity recognition tasks. The extracted entities were subsequently stored in a Neo4j graph database, facilitating the construction of a domain-specific knowledge graph for air compressor fault diagnosis.
1. Introduction
As a critical component in the manufacturing industry, the operational state of a compressor directly affects production efficiency. Diagnosing and maintaining compressor faults poses significant challenges in equipment management. When a compressor malfunctions, it typically provides faulty information and displays an alarm code. However, this information is often limited to basic system or electrical data, lacking comprehensive diagnostics, especially for specific system faults.
Compressor failures can be categorized into two types: mechanical system failures and electrical system failures. These failures are interrelated and require a comprehensive analysis to accurately determine the root cause [1]. Over the years, factory floors have accumulated extensive compressor diagnostic and maintenance cases, primarily stored as unstructured text data. This discrete knowledge of compressor fault diagnosis is not effectively integrated or utilized, hindering the sharing of maintenance expertise among personnel. These issues lead to inefficiencies in fault diagnosis and slow progress in diagnostic capabilities.
Effectively leveraging the vast amount of unstructured expert text data to assess a compressor’s operational state is crucial for manufacturing. Doing so can reduce reliance on specialized knowledge, assist operators in making informed decisions, and minimize economic losses due to faults. This paper aims to integrate unstructured data, extract valuable information, and construct a knowledge graph, thereby laying the groundwork for the application of knowledge graphs in air compressor fault diagnosis.
A knowledge graph is an advanced form of graphical knowledge representation that evolved from directed graphs. The modern concept of the knowledge graph originated with Google’s announcement in 2012. It is widely used in applications such as search engines, question-answering systems, decision-making processes, and artificial intelligence reasoning.
A knowledge graph consists of nodes and directed edges, where each node represents an entity. Unlike traditional knowledge bases, knowledge graphs are superior and more complex because they utilize inference engines to generate new knowledge and integrate multiple information sources. They also feature custom query languages and specialized databases, making them highly adaptable for search, query, and decision-making tasks.
Knowledge graphs can be categorized into two types: domain knowledge graphs, which focus on specific fields of expertise, and enterprise knowledge graphs, which are tailored for organizational uses [2]. Domain knowledge graphs have garnered significant attention from both industry and academia. Various domain-specific knowledge graphs have been developed in fields such as medicine, finance, social media, and energy. Existing review articles have provided detailed summaries of the development and applications of knowledge graphs [2,3]. These graphs offer concise and intuitive representations of complex concepts, where edges depict the relationships between entities derived from unstructured data.
Similarly, air compressor failure knowledge can be extracted from air compressor maintenance text data and stored in a knowledge base through knowledge graph technology. We identify the entities from the air compressor operation and maintenance text, extract the relationship between the entities to form the triples, and then import the triples into the graph database to form the knowledge graph of air compressor faults. The nodes in the knowledge graph represent various entities in the air compressor domain, including Equipment, Fault, Cause, Solution, and Request. The edges in the knowledge graph represent the relationships between entities, including Contain, Relate, etc. The conversion of unstructured text data to structured data is realized.
The knowledge graph of air compressor failure not only reflects its high-quality knowledge information but also is the premise of intelligent semantic understanding in the field of air compressor failure diagnosis, which can provide theoretical data support for the subsequent knowledge reasoning of equipment failure. The air compressor equipment fault knowledge graph realizes the query and visualization of equipment fault knowledge. On the one hand, it can help operation and maintenance personnel to efficiently learn relevant fault knowledge, improve safety awareness, and promote safe production; on the other hand, it can help the staff’s relative lack of experience. According to the fault situation on site, it provides previous fault records and possible causes of faults as a reference, assisting O&M personnel to more quickly and accurately determine the fault situation of the equipment on site, solve accidents and faults, and ensure the safe operation of the equipment.
However, due to the air compressor fault diagnosis field of Chinese entities and the existence of ambiguity, tautology, entity nesting (as shown in Figure 1), data distribution imbalance, and other problems, the accuracy of Chinese entity recognition and relationship extraction needs to be improved. Otherwise, the application of Chinese knowledge graph in the field of air compressor fault diagnosis will be seriously affected.
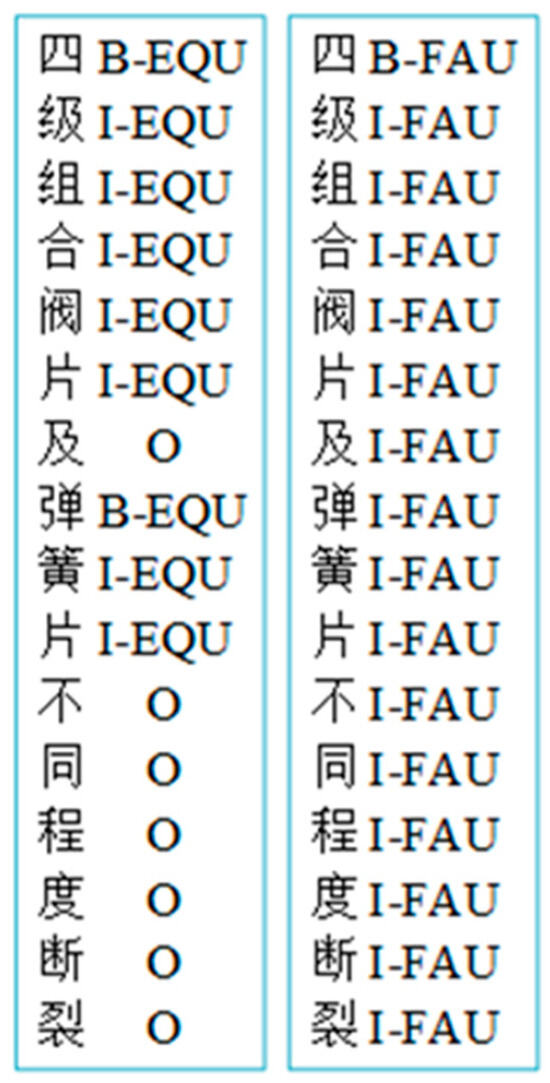
Figure 1.
Two conflicting labeling methods.
In view of the above problems, this paper proposes the following solutions when constructing the knowledge map of air compressor fault diagnosis: RoBERTa’s pre-trained model, which is more suitable for Chinese entity naming and recognition than Bert, is used to complete the entity extraction task. This model not only inherits the advantages of the BERT model but also presents the input sentence as the sum of the word vector, sentence vector, and position vector, and improves the BERT model in terms of model structure and data. A larger number of single training samples and more data were used to train the model, and the Next Sentence Prediction (NSP) objective function was removed, and a longer sequence length was used for training. In the pre-training stage, Chinese word masking technology (WWM) was adopted, and the LTP of HIT was used as a word segmentation tool. The semantic representation generated by the pre-training model contains word information and covers all the Chinese characters composed of the same word. At the same time, the model uses a dynamic mask mechanism to learn different language representations to avoid the influence of word segmentation errors [4]. Then, in the training process, feature fusion is carried out to connect RoBERTa’s output with BiLSTM’s output. The BERT model can learn more global context information, while BiLSTM can learn local sequence information, so as to enrich the model’s representation ability for input sentences. At the same time, the training monitoring index and the evaluation index are unified into the F1 value at the entity level, and the learning rate attenuation strategy is adopted to monitor the F1 value in real time. When the F1 value no longer increases, the learning rate will automatically decrease to improve the performance of the model. In addition, a new entity identification process is proposed, in which the faulty equipment entities in the CFDK dataset are stored in a separate BIO file, and the remaining four fault knowledge annotation data are combined in a BIO file. The RoBERTa-BiLSTM-CRF model was used to classify the trained entity labeling. This process solves the problem of entity nesting of faulty equipment well. Moreover, Focal LOSS classifies entity samples and reduces the loss contribution of a large number of entity samples, so that the model pays more attention to the entity categories that were difficult to identify.
The rest of this paper is organized as follows: In the second part, the development of the knowledge graph and its research in the field of fault diagnosis are summarized. The third part mainly introduces the overall framework of the model and provides detailed descriptions of its key components. In the fourth part, we discuss the model’s evaluation metrics and parameter settings, compare and analyze its performance, and present the constructed knowledge graph. The fifth part concludes the paper and outlines prospects for future work.
2. Related Work
MIT, Massachusetts, USA developed the ConceptNet [5] common sense graph using data from multiple sources, utilizing a non-formal, near-natural language description. Wikipedia, a multilingual collaborative encyclopedia, is the largest knowledge resource on the Internet. Consequently, many knowledge graphs are based on Wikipedia, such as DBpedia [6], YAGO [7,8], and Freebase [9]. DBpedia extracts structured knowledge from Wikipedia, standardizing entries in the form of ontologies. YAGO, developed by the Max Planck Institute in Germany, is a multilingual knowledge base that integrates data from Wikipedia, WordNet, and GeoNames, featuring a rich entity classification system. Freebase also extracts structured data from Wikipedia to form Resource Description Framework (RDF), storing this structured data in a graph database. Google released its Knowledge Graph in 2012. Unlike traditional search engines, which simply find all pages containing keywords, the Google Knowledge Graph uses entity recognition and linking to disambiguate search queries. It understands user intent through semantic parsing, providing more accurate search results.
With increasing attention from academia and industry, research on knowledge graphs for fault diagnosis has gradually grown. Wang et al. [10] extracted semi-structured and unstructured fault knowledge from CNC machine tool fault cases, maintenance manuals, and on-site logs. They used a comprehensive system to integrate this interrelated fault diagnosis knowledge, achieving a structured application for CNC machine tool fault diagnosis. Xue et al. [11] focused on the control rod drive mechanism (CRDM) of the liquid-fueled thorium molten salt reactor (TMSR-LF1), proposing a fault diagnosis system based on a knowledge graph and Bayesian inference algorithm. Chen et al. [12] proposed a semi-supervised self-tuning graph neural network (SSGNN) for fault diagnosis, which can effectively extract features from vibration signals and generate a graph structure representation of fault knowledge. The SSGNNs proposed in this study play an important role in the construction, extension, and application of knowledge graphs. Cai et al. [13] proposed a multilevel KG construction method to provide data support for FD, followed by a method based on multilevel KG and Bayesian theory to detect the system state, combined with relational path-based KG inference to locate the fault source, utilizing the relationship between the structures of rotating mechanical equipment for fault cause inference, and using KG as a knowledge base for reasoning using machine learning, which effectively solves the problem of low diagnostic accuracy.
In the field of power equipment fault diagnosis, Meng et al. [14] employed the BERT-BiLSTM-CRF model to identify and extract power equipment entities from pre-processed Chinese technical literature. They then used dependency analysis relationship classification to extract semantic relationships between entities. The resulting knowledge was stored in the Neo4j database as triples and visualized as graphs.
Hu [15] introduced knowledge graphs into automobile fault diagnosis. He enhanced the traditional construction process by adding text pre-classification and entity reorganization, effectively addressing issues with nested and discontinuous entities in the text.
In the field of air compressor fault diagnosis knowledge graphs, the complexity, diversity, and criticality of air compressor systems in industry make them ideal cases for validating and testing our proposed feature fusion RoBERTa-WWM-BiLSTM-CRF model. By applying it to air compressor fault diagnosis, we are able to demonstrate the effectiveness of our modeling approach in handling complex textual data and improving the accuracy and robustness of fault diagnosis, as well as demonstrating the potential of the approach to be applied to a wider range of industrial domains. Chen et al. [16] proposed a benchmark dataset and baseline model for mining fault diagnosis knowledge from compressor maintenance logs using sequence labeling (SL) and named entity recognition (NER) technologies. Qin et al. [17] developed a compressor fault knowledge mining model based on a large language model. This model can quickly and accurately extract structured compressor fault knowledge triples from unstructured fault text data, forming a comprehensive compressor fault knowledge graph.
Based on the reviewed studies, it is evident that there is a scarcity of research focusing on constructing knowledge graphs tailored to the characteristics of air compressor fault text data. While knowledge graph applications have enhanced efficiency and correlation performance in other equipment fault diagnosis fields, current methods primarily rely on models like Bert-BiLSTM-CRF to directly identify named entities in fault text data, often overlooking nested entity complexities specific to air compressor faults.
Moreover, with rapid advancements in pre-training models, such as the RoBERTa model optimized for Chinese text data logic, there is an opportunity to address these challenges effectively. This paper proposes a method tailored for constructing a fault knowledge graph specific to air compressors. The approach involves labeling fault equipment location entities nested within other entities separately within the dataset. Subsequently, entity identification tasks for fault equipment locations and other entities are performed using the RoBERTa-BiLSTM-CRF model optimized for air compressor fault diagnosis datasets. Experimental results validate the effectiveness of this optimized approach.
In summary, the main contributions of this paper include:
- (1)
- This paper enhances the traditional sequence annotation model by replacing the Bert-BiLSTM-CRF model with the more advanced RoBERTa pre-trained model. This upgrade significantly boosts the accuracy and efficiency of entity recognition tasks. Furthermore, we optimized the model structure to better suit the data characteristics. The RoBERTa-BiLSTM-CRF model was further enhanced through feature fusion technology, learning rate attenuation, and Whole Word Masking (WWM), achieving superior performance in entity recognition tasks.
- (2)
- We propose a novel method for constructing a knowledge graph from air compressor fault text. Specifically, we extract faulty equipment entities separately from other maintenance knowledge entities that may be nested within them. This approach effectively resolves issues related to entity nesting.
- (3)
- The paper constructs a domain-specific knowledge graph for air compressor fault diagnosis, laying a foundational framework for utilizing knowledge graphs in air compressor fault diagnosis. This work also offers valuable insights for applying knowledge graphs to other engineering domains.
3. Construction of the Knowledge Graph
3.1. Framework of Construction
There are two approaches to constructing a knowledge graph: top–down and bottom–up. Bottom–up construction involves completing knowledge extraction before defining ontology information. In contrast, the top–down method defines ontology information first and then extracts knowledge from the data. The fault knowledge graph of an air compressor falls under the category of a vertical domain knowledge graph.
Vertical domain knowledge graphs differ from open domain knowledge graphs in two main aspects. Firstly, entities in vertical domain knowledge graphs are constrained within a specific domain compared to the broader scope of open domain graphs. Secondly, vertical domain knowledge graphs typically require higher precision and quality to meet the specialized needs of users within that domain.
Therefore, this paper adopts the top-down construction method for building the air compressor fault knowledge graph. The construction framework is illustrated in Figure 2.
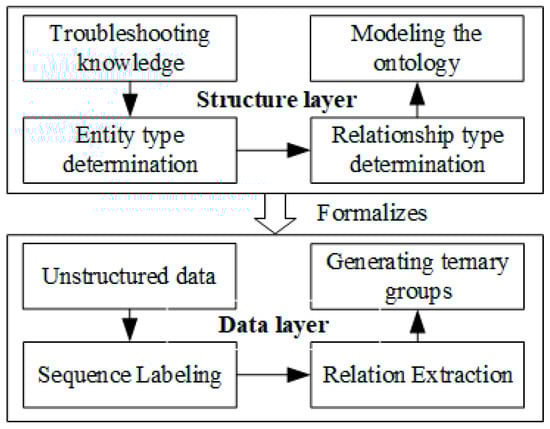
Figure 2.
Air compressor fault knowledge graph construction framework.
3.2. Ontology Construction
Ontology [18] originates from philosophy and holds significant theoretical importance for artificial intelligence, web research, semantic web development, knowledge management, information retrieval, and human–computer interaction. In the context of AI and web research, ontology is defined as a document or file that formally specifies the relationships between terms [19]. Various research groups globally have proposed diverse methods to guide ontology construction, such as the skeleton method, enterprise modeling, cyclic acquisition, METHONTOLOGY, IDEF-5, Bemem, et al., and virtual domain ontology construction [20]. As a result, numerous ontology construction tools have emerged, including Ontosaurus, Ontolingua, webonto, WebODE, Protege, OntoEdit, OILEd, and OntoBuilder. The primary goal of ontology modeling is to clearly conceptualize domain knowledge. Before constructing the knowledge graph for air compressor fault diagnosis, it is essential to define knowledge concepts and their relationships within the ontology model. This framework provides specifications for extracting subsequent entities and relationships.
Knowledge related to air compressor fault diagnosis can be categorized into two types. Firstly, there is machine tool fact knowledge, such as the type and model of the air compressor, which remains unaffected by whether a fault occurs or not. Secondly, there is fault occurrence knowledge, directly associated with faults when they arise, encompassing fault phenomena, solutions, causes, and more. These two types of knowledge are intertwined to form the air compressor fault diagnosis knowledge model.
The next section will briefly introduce ontology editing methods and tools, followed by their application in ontology modeling for air compressor fault diagnosis knowledge.
Currently, one of the most widely used tools for ontology construction is Protege, a Java-based software for ontology editing and knowledge acquisition developed by the academic community. Protege features a user-friendly graphical interface and provides functions for constructing ontology concepts, classes, relationships, attributes, and instances.
Given the advantages mentioned above, Protege is selected in this section to construct the ontology for the air compressor fault diagnosis knowledge graph. The specific logic process for ontology construction is outlined as follows:
Air Compressor Ontology Construction: Upon reviewing air compressor fault diagnosis cases, it is evident that crucial information pertains to the model and type of air compressors. Therefore, two entity classes are defined: air compressor model number and air compressor type.
Construction of Air Compressor Fault Ontology: The air compressor fault ontology forms the foundational knowledge for air compressor fault diagnosis. Given that fault diagnosis typically involves fault causes, fault phenomena, maintenance plans, and maintenance requirements, four entity classes are defined: air compressor fault cause, fault phenomenon, maintenance plan, and maintenance demand. Additionally, due to the close relationship between air compressor faults and the components within them, a fault location class is also defined.
Defining Relationships Between Entity Classes: Based on logical relationships between entity classes, six types of relationships are defined: fault position–fault cause, fault phenomenon–fault cause, fault phenomenon–maintenance plan, fault phenomenon–air compressor model number, maintenance plan–maintenance demand, and air compressor type–air compressor model number. Each of the above entity classes exhibits pairwise mutual exclusion, meaning an entity cannot belong to two entity classes simultaneously.
Using the Protege ontology building tool, a total of seven entities and eight relationships are defined. These are detailed in Table 1 below. Figure 3 illustrates the ontology model for air compressor fault diagnosis domain knowledge created using the Protege ontology editing tool. This model integrates both machine tool fact knowledge and fault occurrence knowledge, highlighting their interconnectedness. This ontology model forms the foundational layer of the air compressor fault diagnosis knowledge graph.

Table 1.
Definition and relationship of entities.
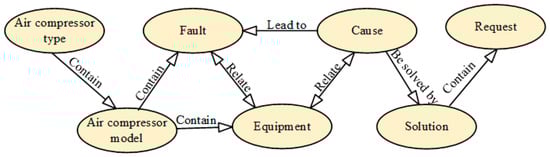
Figure 3.
Air compressor fault diagnosis domain knowledge map ontology model.
3.3. Construction of Sequence Labeling Model and NER Model
3.3.1. Construction of Feature-Fusion RoBERTa-BiLSTM-CRF Model
The RoBERTa-BiLSTM-CRF model used for marking fault knowledge sequences in air compressors employs RoBERTa as the pre-trained language model. It integrates a BiLSTM-CRF architecture to sequentially label fault phenomena, causes, and solutions in air compressor texts. RoBERTa initially converts each word in the text into a vector, which serves as input for the subsequent BiLSTM-CRF structure model. The model outputs a vector representation combined with contextual information. The overall structure of the RoBERTa-BiLSTM-CRF model, depicted in Figure 4, consists of five layers: The first layer is the preprocessing RoBERTa layer, which converts every word in the sentence into a low-dimensional vector. The second layer is the BiLSTM layer, and the vector output from the RoBERTa layer is used as the input of this layer to automatically extract semantic and temporal features from the context. The third layer is the feature fusion layer, which connects the output of ROBERTA and BILSTM to combine the features of different levels. After the feature fusion layer is the fully connected layer, and the output undergoes dimensionality reduction through the fully connected layer. This step helps the model effectively learn important features and mitigates overfitting issues associated with high-dimensional features. The final layer is the CRF layer, which considers the order relationship between labels and solves the dependency between output labels to obtain the global optimal labeling sequence.
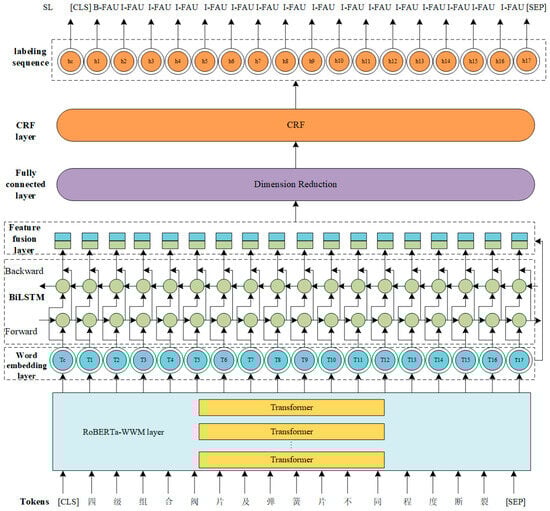
Figure 4.
The architecture of the Feature-Fusion RoBERTa-BiLSTM-CRF.
3.3.2. RoBERTa Pre-Trained Language Model
Bert (Bidirectional Encoder Representations from Transformers) [21] is an unsupervised deep bidirectional language representation model trained using masked language modeling (MLM) [21] and the next sentence prediction (NSP) [21] mechanism to understand language. RoBERTa [22], an upgraded version of BERT, undergoes longer training with more training data, resulting in improved performance. Both models share a similar structure consisting of 12 Transformer layers [23]. The key difference lies in the masking strategy. BERT employs a static mask where parts of the input sequence are randomly replaced with special mask tokens (typically [MASK]) or random words from the vocabulary. The model predicts these mask tokens. This static approach means the mask remains fixed throughout training, with each masked position replaced consistently by the same special token.
In contrast, RoBERTa utilizes a dynamic masking strategy. Each time a sequence is inputted into the model, different tokens are randomly masked. This dynamic approach involves randomly selecting mask positions for each batch, allowing the model to adapt to varying masking strategies during training. This adaptation enhances RoBERTa’s ability to effectively model input sequences.
Additionally, RoBERTa eliminates the NSP module, which is unnecessary for identifying faulty entities in air compressors. Instead, RoBERTa adopts the FULL-SENTENCES training method, concatenating multiple consecutive sentences until reaching a maximum length of 512 tokens, which is twice the maximum character length of 256 tokens used in BERT [22,24,25].
WWM (Whole Word Masking) is a masking strategy utilized in the BERT pre-training process. In contrast to BERT’s standard practice of randomly masking some subwords within a single word, WWM masks the entire word as a unit. When a word is selected for masking in WWM, the entire word is masked, rather than masking individual subwords separately.
To illustrate these two masking methods, consider the example “four-stage combined valve disc and spring disc with different degrees of breakage”. In Figure 5 and Figure 6, the model diagrams depict the differences between these masking strategies.
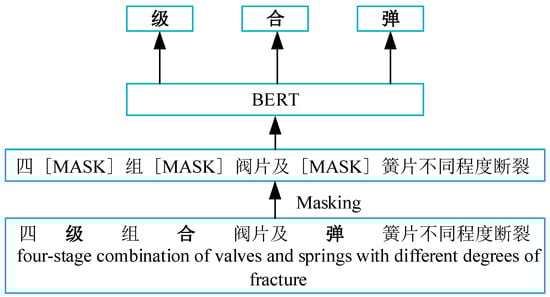
Figure 5.
Bert model masking mode schematic diagram.
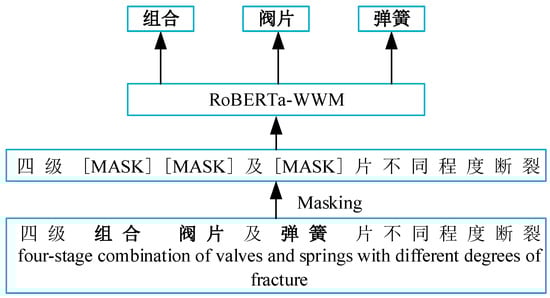
Figure 6.
RoBERTa model masking method diagram.
The primary advantage of the WWM strategy lies in its ability to preserve the integrity and original meaning of proper nouns or technical terms by masking them as whole units rather than breaking them down into sub-words. This feature is particularly beneficial when processing texts in specialized domains like air compressor fault diagnosis, where maintaining the accuracy and context of such terms is crucial.
3.3.3. BiLSTM Layer Model Structure
The BiLSTM layer is an improvement of the LSTM model, and the LSTM model itself is an improved version of the traditional RNN model. The LSTM model is good at capturing remote dependencies in text data, thereby alleviating the problem [25]. The structure of the LSTM unit is shown in Figure 7.
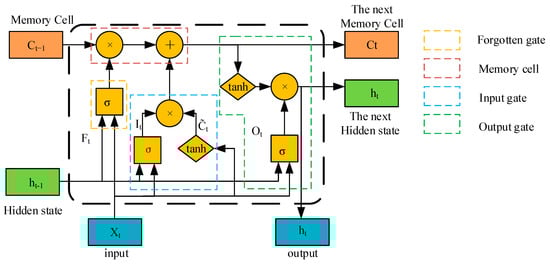
Figure 7.
LSTM’s cell structure.
BiLSTM combines forward LSTM and backward LSTM. It concatenates the output vector obtained from forward LSTM and the output vector obtained from backward LSTM as output. The model structure of BiLSTM is shown in Figure 4.
3.3.4. CRF Layer
The RoBERTa-WWM model excels in capturing contextual information and feature representations. However, it generates labels independently for each case, without fully considering the global relationships between labels. For instance, entity recognition tasks like identifying equipment names (I-EQU) should logically be followed by the beginning of new equipment names (B-EQU). To address this, incorporating Conditional Random Fields (CRFs) is essential [26]. The potential recognition outcomes influenced by the presence of CRF are illustrated in Figure 8.
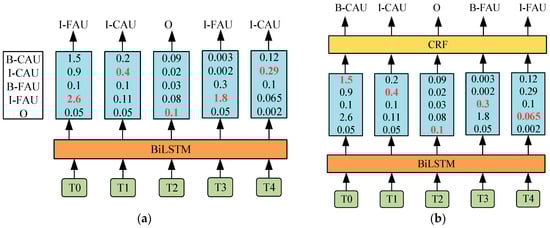
Figure 8.
Comparison of output result (a) derived from BiLSTM layer alone with output result (b) derived from BiLSTM + CRF layer.
In Figure 8a without CRF, the labeling model assigns labels based on the highest score principle, leading to nonsensical label sequences such as “I-FAU” (internal part of the fault phenomenon sequence) for T0 and “I-CAU” (internal part of the fault cause sequence) for T1. This contradicts the common understanding of fault diagnosis.
In Figure 8b, with the application of CRF, the model’s labeling decision considers the transition probability between labels. For instance, despite “I-FAU” having the highest score (2.6 points), the CRF model selects “B-CAU” (the beginning part of the fault cause sequence), which had the second highest score, as the label for T0. Moreover, the labels for T3 and T4 are corrected to “B-FAU” (the beginning part of the fault phenomenon sequence) and “I-FAU” (the internal part of the fault phenomenon sequence), with scores of 0.3 and 0.065, respectively.
The introduction of CRF significantly reduces the occurrence of incorrect labels. By considering the probability of transitions between labels, CRF effectively corrects unreasonable labeling that arises from disregarding sequence dependencies based solely on score maximization.
The CRF model is calculated as follows: take the output sequence of the BiLSTM layer and assume that is the output score matrix of the BiLSTM layer of size , where n is the number of words, k is the number of labels, and denotes the score of the jth label of the ith word. For the prediction sequence , the score function is shown in Formula (1) [27].
In the above formula, represents the transfer fraction matrix, represents the fraction of label transferred to label , and has a magnitude of k + 2. The probability that the predicted sequence Y produces is shown [27].
The real labeled sequence is represented in the above formula. represents all possible annotation sequences. When decoding, use the Viterbi algorithm to find the with the highest score of all s, as shown below [27].
The with the highest score is the globally optimal annotated sequence.
3.4. Knowledge Storage and Visualization
In practical applications, querying and processing knowledge graph data exhibit two notable characteristics. Firstly, queries typically involve a very small subset of triples within the knowledge base. Secondly, these operations often focus on retrieving specific entities and their immediate relationships. Additionally, the operations require numerous joint operations due to the fragmented nature of knowledge graph data representation.
Historically, knowledge graph data were stored as triples in relational databases, which presented challenges such as inefficient querying, scalability issues with large datasets, high I/O overhead during data updates, and costly index maintenance. With the rise of big data, there has been a growing demand for storage technologies capable of efficiently managing massive and complex relational data. Graph databases have emerged as a favored solution due to their ability to handle intricate relationships. They offer several advantages in typical knowledge graph applications:
Graphical Representation: Entities and their relationships are visually represented, enhancing clarity and ease of manipulation.
Scalability: Graph databases can effectively manage large-scale knowledge graphs comprising hundreds of millions of data points.
Efficient Query Execution: They execute relational queries efficiently, minimizing I/O operations and memory consumption compared to traditional relational databases’ join operations.
Support for Algorithms and Visualization: Many graph databases provide built-in algorithms and visualization tools, facilitating deeper analysis and intuitive knowledge of graph displays.
Given these benefits, graph databases have increasingly become the preferred choice for storing the data layer of knowledge graphs. Neo4j, a widely adopted graph database, structures knowledge graphs using nodes and relationships, making it particularly suitable for both storage and visualization in this study.
4. Experiments and Analysis
4.1. Experimental Process
The experimental process for entity and sequence labeling in the Chinese air compressor fault diagnosis field is depicted in Figure 9. This study involved training and testing five different deep learning models to compare and evaluate their entity recognition performance, specifically highlighting the advantages of the RoBERTa-BiLSTM-CRF model. Subsequently, the performance of the baseline RoBERTa-BiLSTM-CRF model was compared with an optimized version proposed in this paper, demonstrating the effectiveness of the proposed optimizations on the CFDK dataset. Finally, the study investigates the impact of various parameters on model performance, identifying hyperparameters that are best suited for the model and the CFDK dataset.
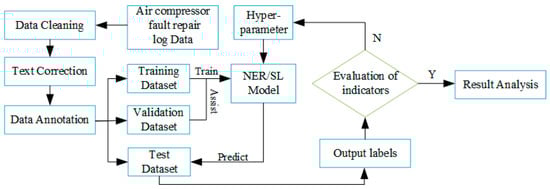
Figure 9.
Experimental flow chart.
4.2. Experiment Data
The dataset utilized in this study is the Comprehensive Fault Diagnosis Knowledge (CFDK) dataset, introduced by Chen [16] et al., derived from the after-sales business data of a specific company, specifically tailored for air compressor fault diagnosis.
The dataset is divided into training, validation, and test sets in a ratio of 6:2:2 for conducting subsequent experiments. Table 2 presents the statistical details of the dataset.
Table 2.
Statistics of the training set, test set, and verification set of the model.
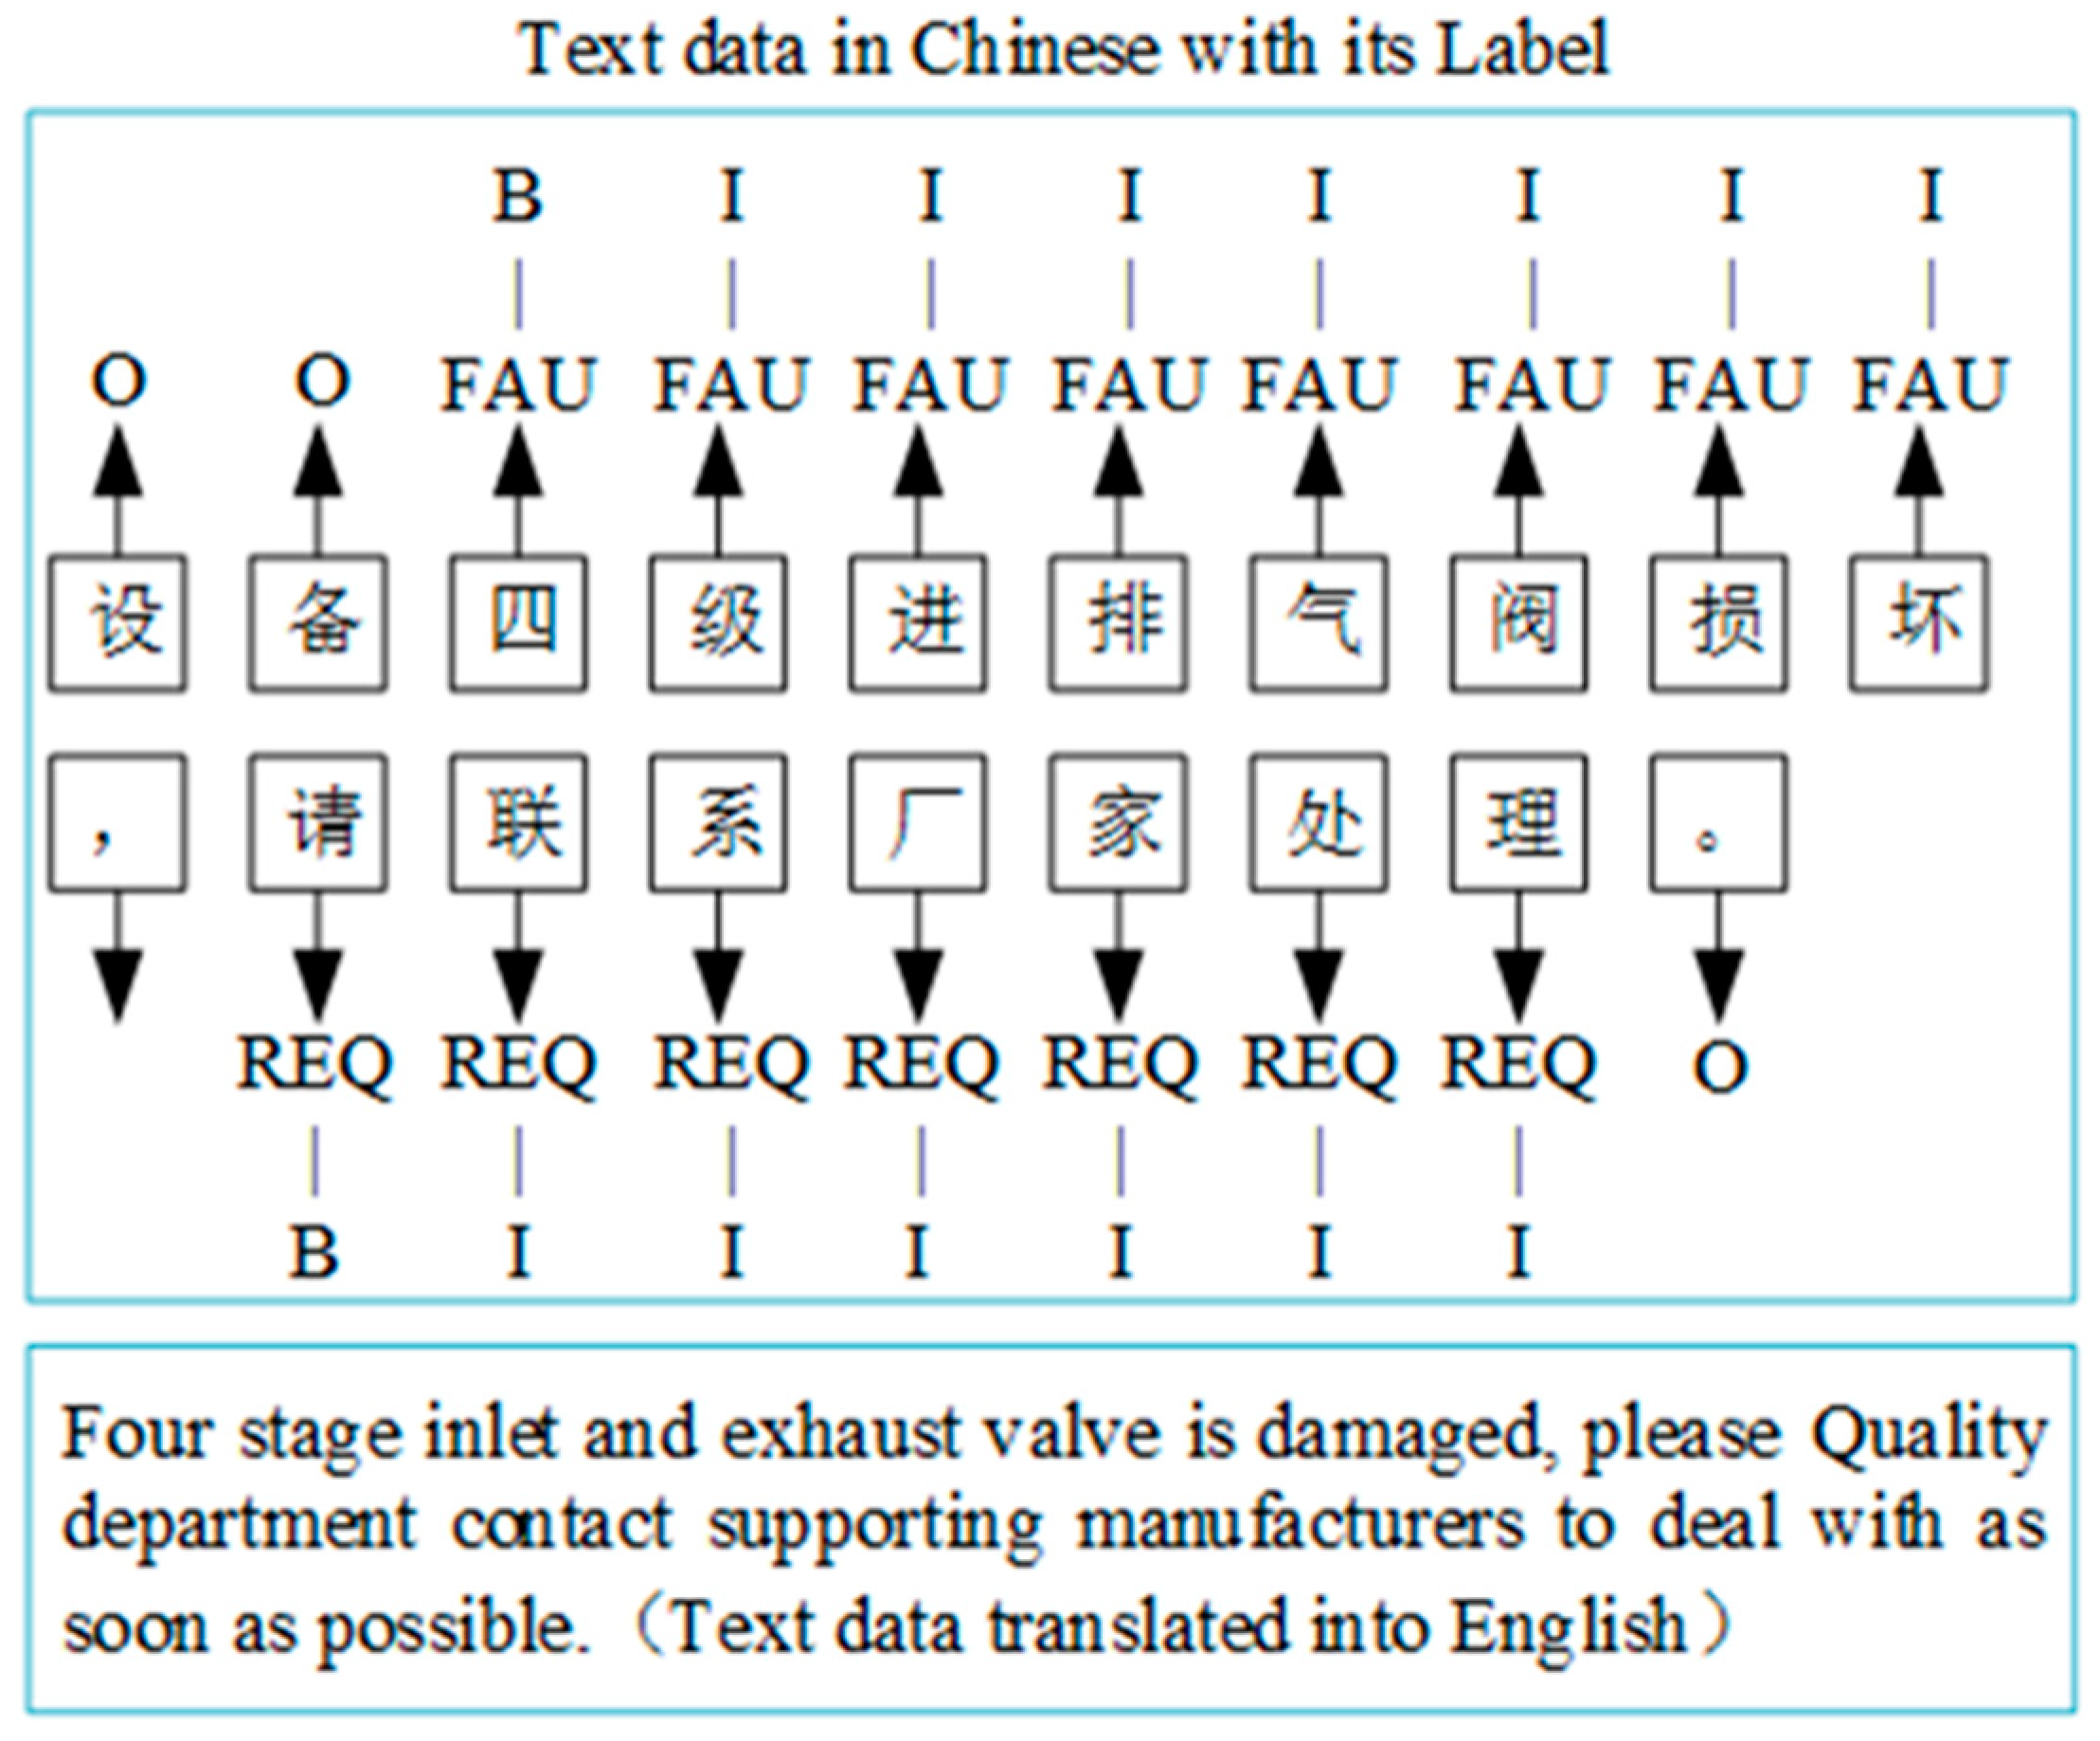
The CFDK (Compressor Fault Diagnosis Knowledge) dataset used in this paper employs the common BIO (Beginning Inside Outside) labeling pattern in named entity recognition (NER) tasks: B indicates the first word of the entity, I represents the subsequent words of the entity, and O signifies words outside of entities. The BIO annotation method has become a common annotation scheme in sequence annotation tasks due to its simplicity, low computational complexity, easy extension, and good compatibility. Although it may not be as fine as other methods when dealing with very complex entity relationships, BIO methods are able to provide good enough performance and annotation consistency in most application scenarios. An example of BIO labeling is shown in Figure 10 with the sentence, “Equipment four-stage inlet and exhaust valve is damaged, please contact the manufacturer for treatment”. The labels used are FAU for fault phenomenon, REQ for maintenance requirement, EQU for faulty equipment, CAU for fault cause, and SOL for maintenance plan. In Figure 10, “四级进排气阀损坏” as a fault phenomenon entity so that the beginning of the Chinese characters “四” is labeled as B-FAU, and other entity characters as the entity’s subsequent characters are labeled as I-FAU; “请联系厂家处理” as a maintenance requirement entity so that the beginning of the Chinese characters “请” is labeled as B-REQ, and other entity characters as the entity’s subsequent characters are labeled as I-REQ. In the text shown in the figure, except for the two entities described above, all other non-entity characters are labeled as “O”.
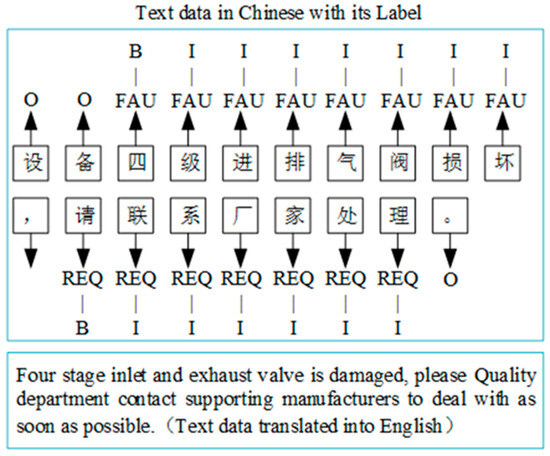
Figure 10.
The BIO label for compressor fault text.
4.3. Experiment Settings
The model in this paper is based on the Pytorch deep learning framework, and the configuration environment of the whole training is shown in Table 3. The initial parameter settings of the model were determined by reference [16]. In order to ensure the accuracy of the experimental results, the same training parameters were used for all comparison models, as shown in Table 4. In order to prevent overfitting problems, the L2 regularization method was added to the loss function, and the regularization parameter was 0.001. Focal LOSS was added to the total loss function to give higher weight to entity labels with a small number of samples for the problem of sample imbalance in the dataset. The formula for calculating the total loss function is shown in Formula (4). Where α and γ are the conditioning parameters, is the prediction probability of the model for the target class, is the conditional probability of generating the label sequence after the given input sequence , and is the parameters of the model. For the other model parameters, we use the default settings.
Table 3.
Training environment configuration.
Table 4.
Parameter settings of the experimental model.
4.4. Experimental Evaluation
To validate the effectiveness of the model proposed in this paper, commonly used evaluation metrics in sequence labeling were employed. These metrics include precision, recall, and score, which were also used to evaluate the comparison models. The formulas for these metrics are as follows:
In these formulas, represents the sample with a positive actual prediction. represents the number of samples in which the negative class is predicted as positive. is the number of samples that predicted the positive class as negative.
4.5. Model Performance Comparison
4.5.1. Comparison of Different Models
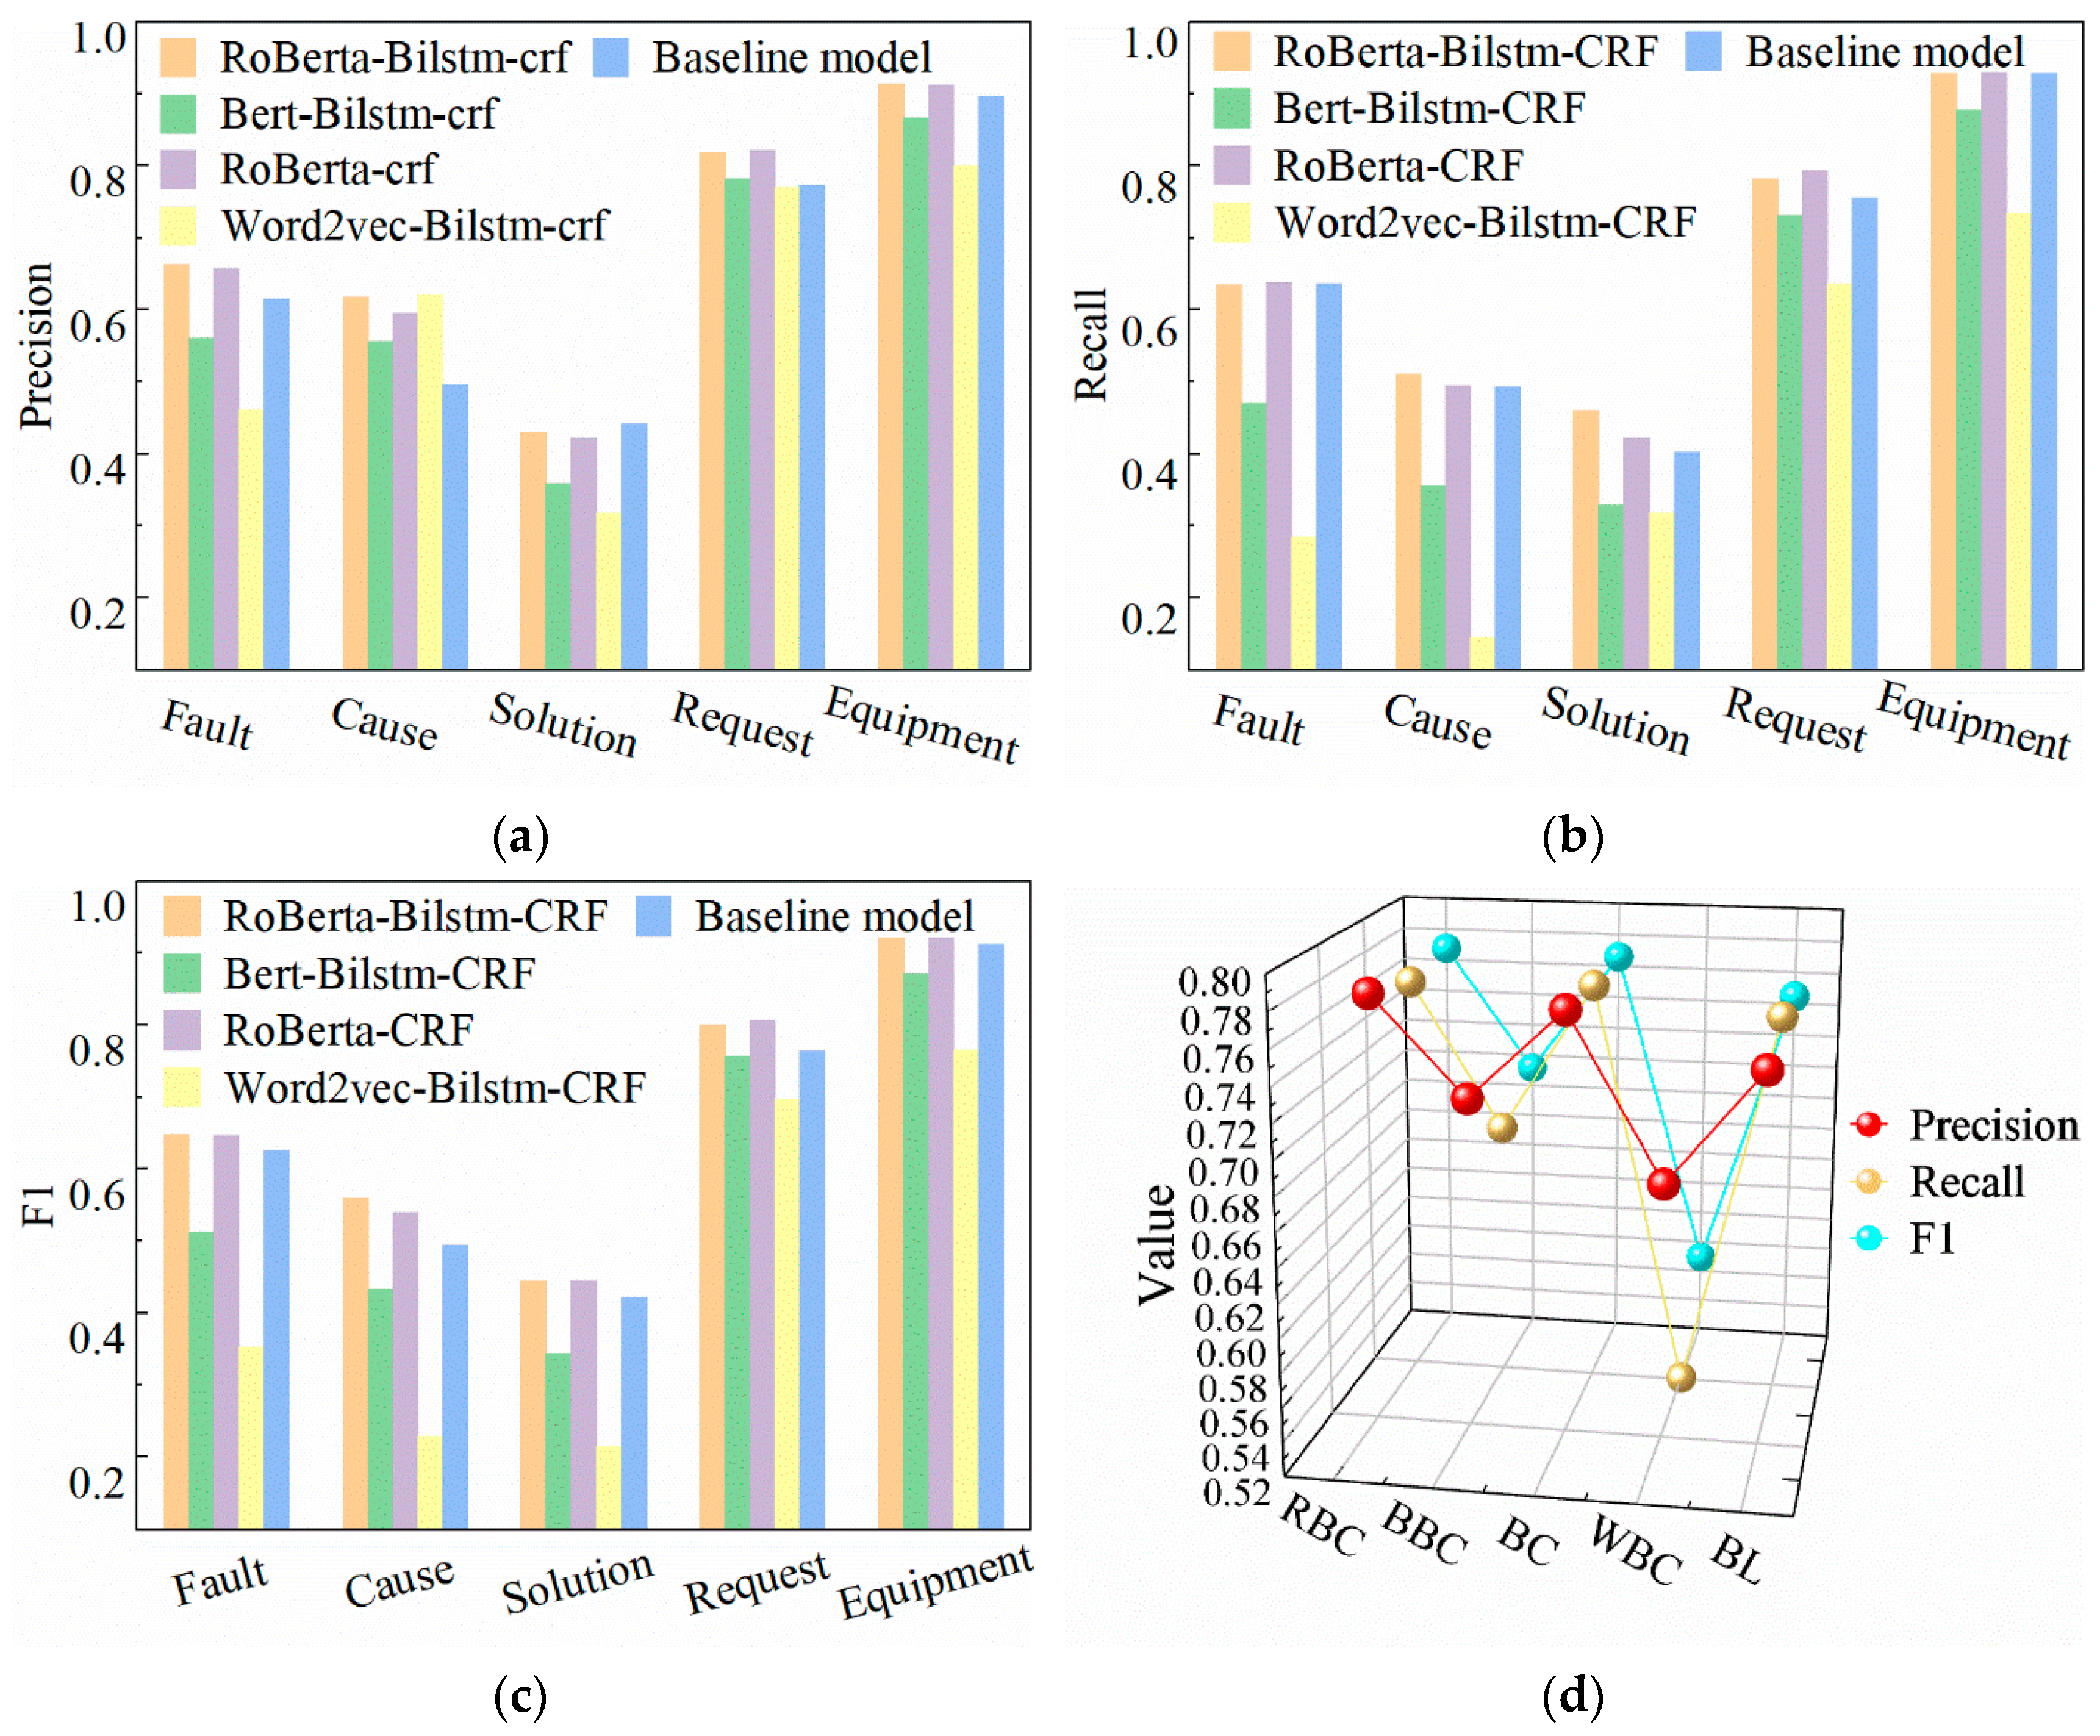
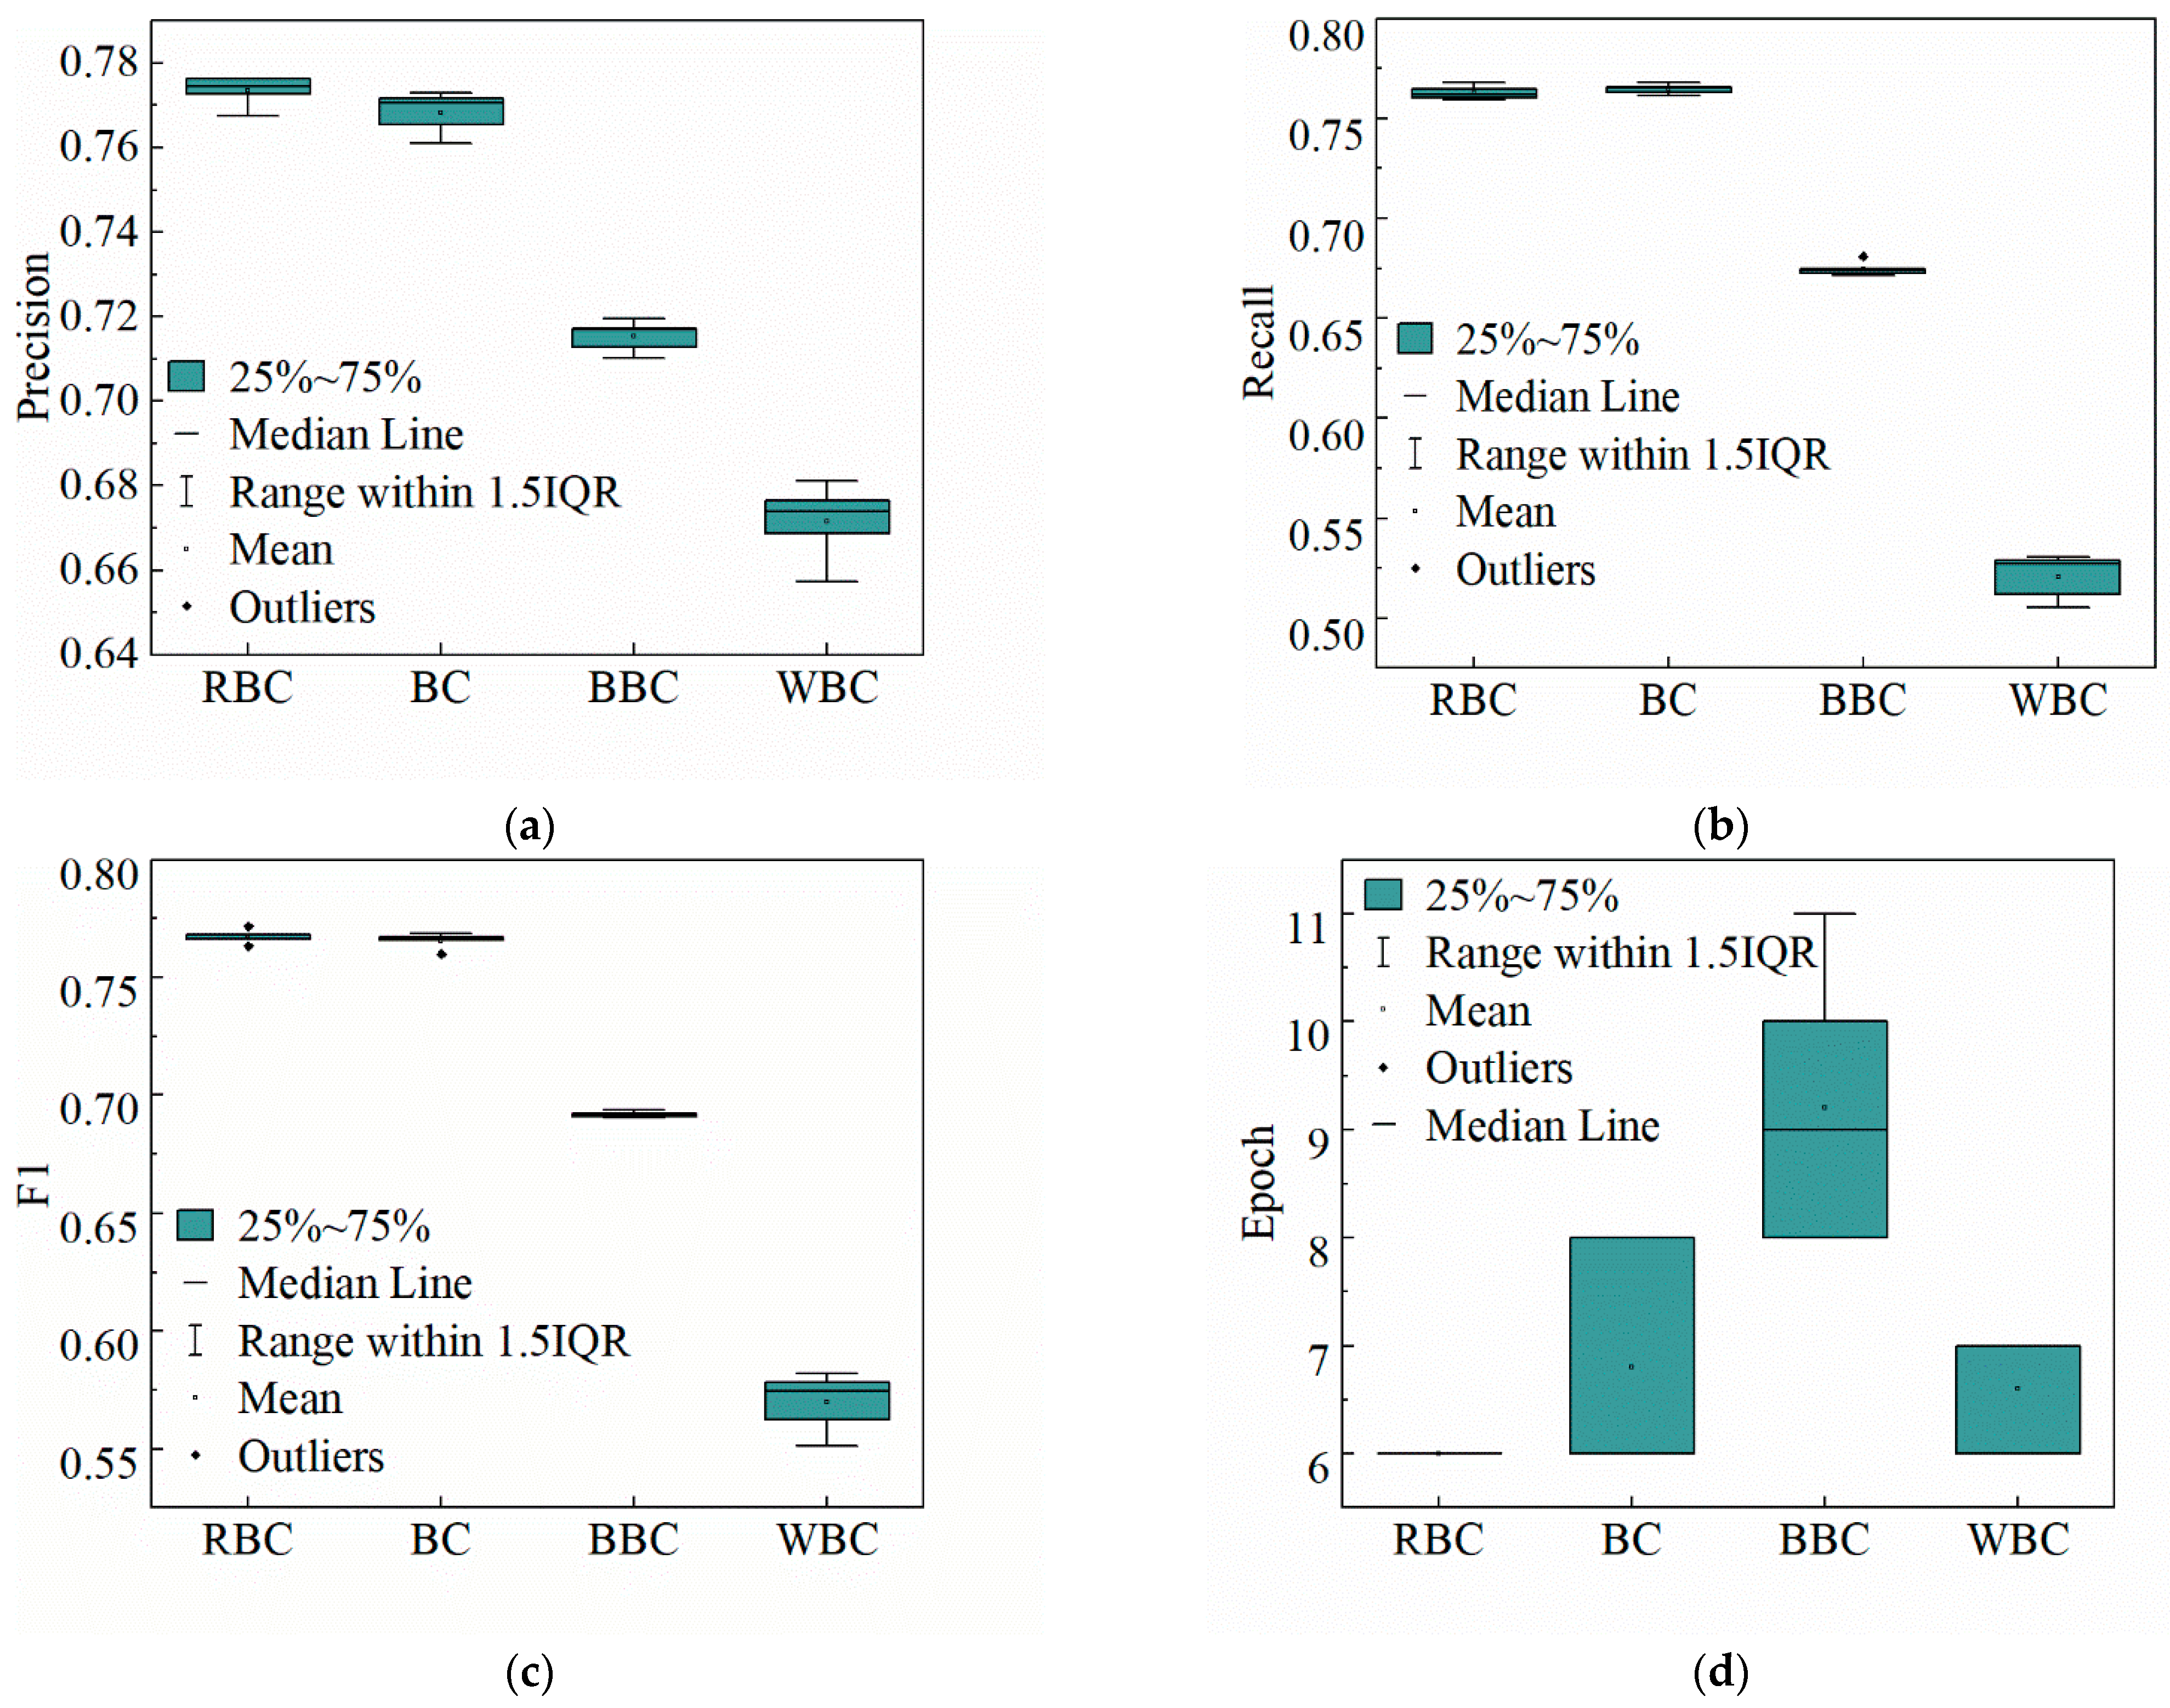
In this section, we compare the baseline models on the same dataset with the RoBERTa-BiLSTM-CRF model proposed in this paper. The baseline models include Bert-BiLSTM-CRF, RoBERTa-CRF, Word2vec-BiLSTM-CRF, and the model proposed by Chen et al. [16], which have shown good performance in the field of Named Entity Recognition (NER). To ensure consistency, each model underwent 5 experimental runs. The performance comparison of each model on various entity classes is shown in Figure 11 and Figure 12. Abbreviations used are RBC for RoBERTa-BiLSTM-CRF (Basic), BBC for Bert-BiLSTM-CRF, WBC for Word2vec-BiLSTM-CRF, and BC for RoBERTa-CRF. The macro-averaged results of five entity recognition experiments on different entity classes are summarized in Table 5.
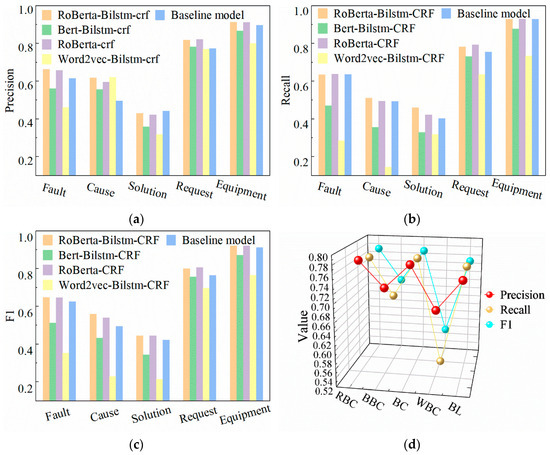
Figure 11.
Comparison of performance of different models at the entity level, Precision (a), Recall (b), F1 (c), Precision, Recall and F1 of different mdels (d).
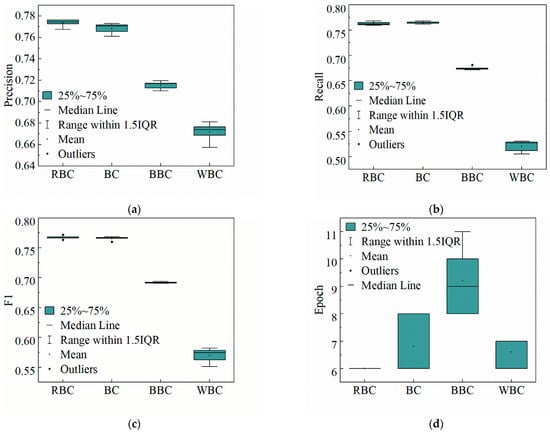
Figure 12.
Distribution of experimental results of five experiments with different models., Precision (a), Recall (b), F1 (c), Epoch (d).
Table 5.
Experimental results.
From Table 5, it is evident that the highest precision, recall, and F1 scores for each entity class are concentrated in the results of the RoBERTa-BiLSTM-CRF and RoBERTa-CRF models, both of which incorporate the RoBERTa pre-trained model. These three evaluation metrics significantly outperform the three models that do not integrate RoBERTa, demonstrating the performance enhancement achieved by introducing RoBERTa. Specifically, the RoBERTa-BiLSTM-CRF model performs best in identifying Equipment, Fault, and Cause entities, while the RoBERTa-CRF model slightly outperforms the former in identifying Solution and Request entities.
Figure 11a–c demonstrate that the RoBERTa-BiLSTM-CRF model achieves the highest accuracy, recall, and F1 scores across most entity classes. Figure 11d further shows that the average F1 score of the RoBERTa-BiLSTM-CRF model ranks first among all five models, indicating superior entity recognition performance. Additionally, the distribution of experimental data across all models in Figure 12 reveals that the RoBERTa-BiLSTM-CRF model exhibits not only better recognition accuracy and efficiency but also more stable results with minimal fluctuations compared to other models. Therefore, the RoBERTa-BiLSTM-CRF model achieves the best overall performance in this study, underscoring the effectiveness of the RoBERTa pre-training model in enhancing entity recognition tasks.
4.5.2. Comparison of Optimized Model and Basic Model
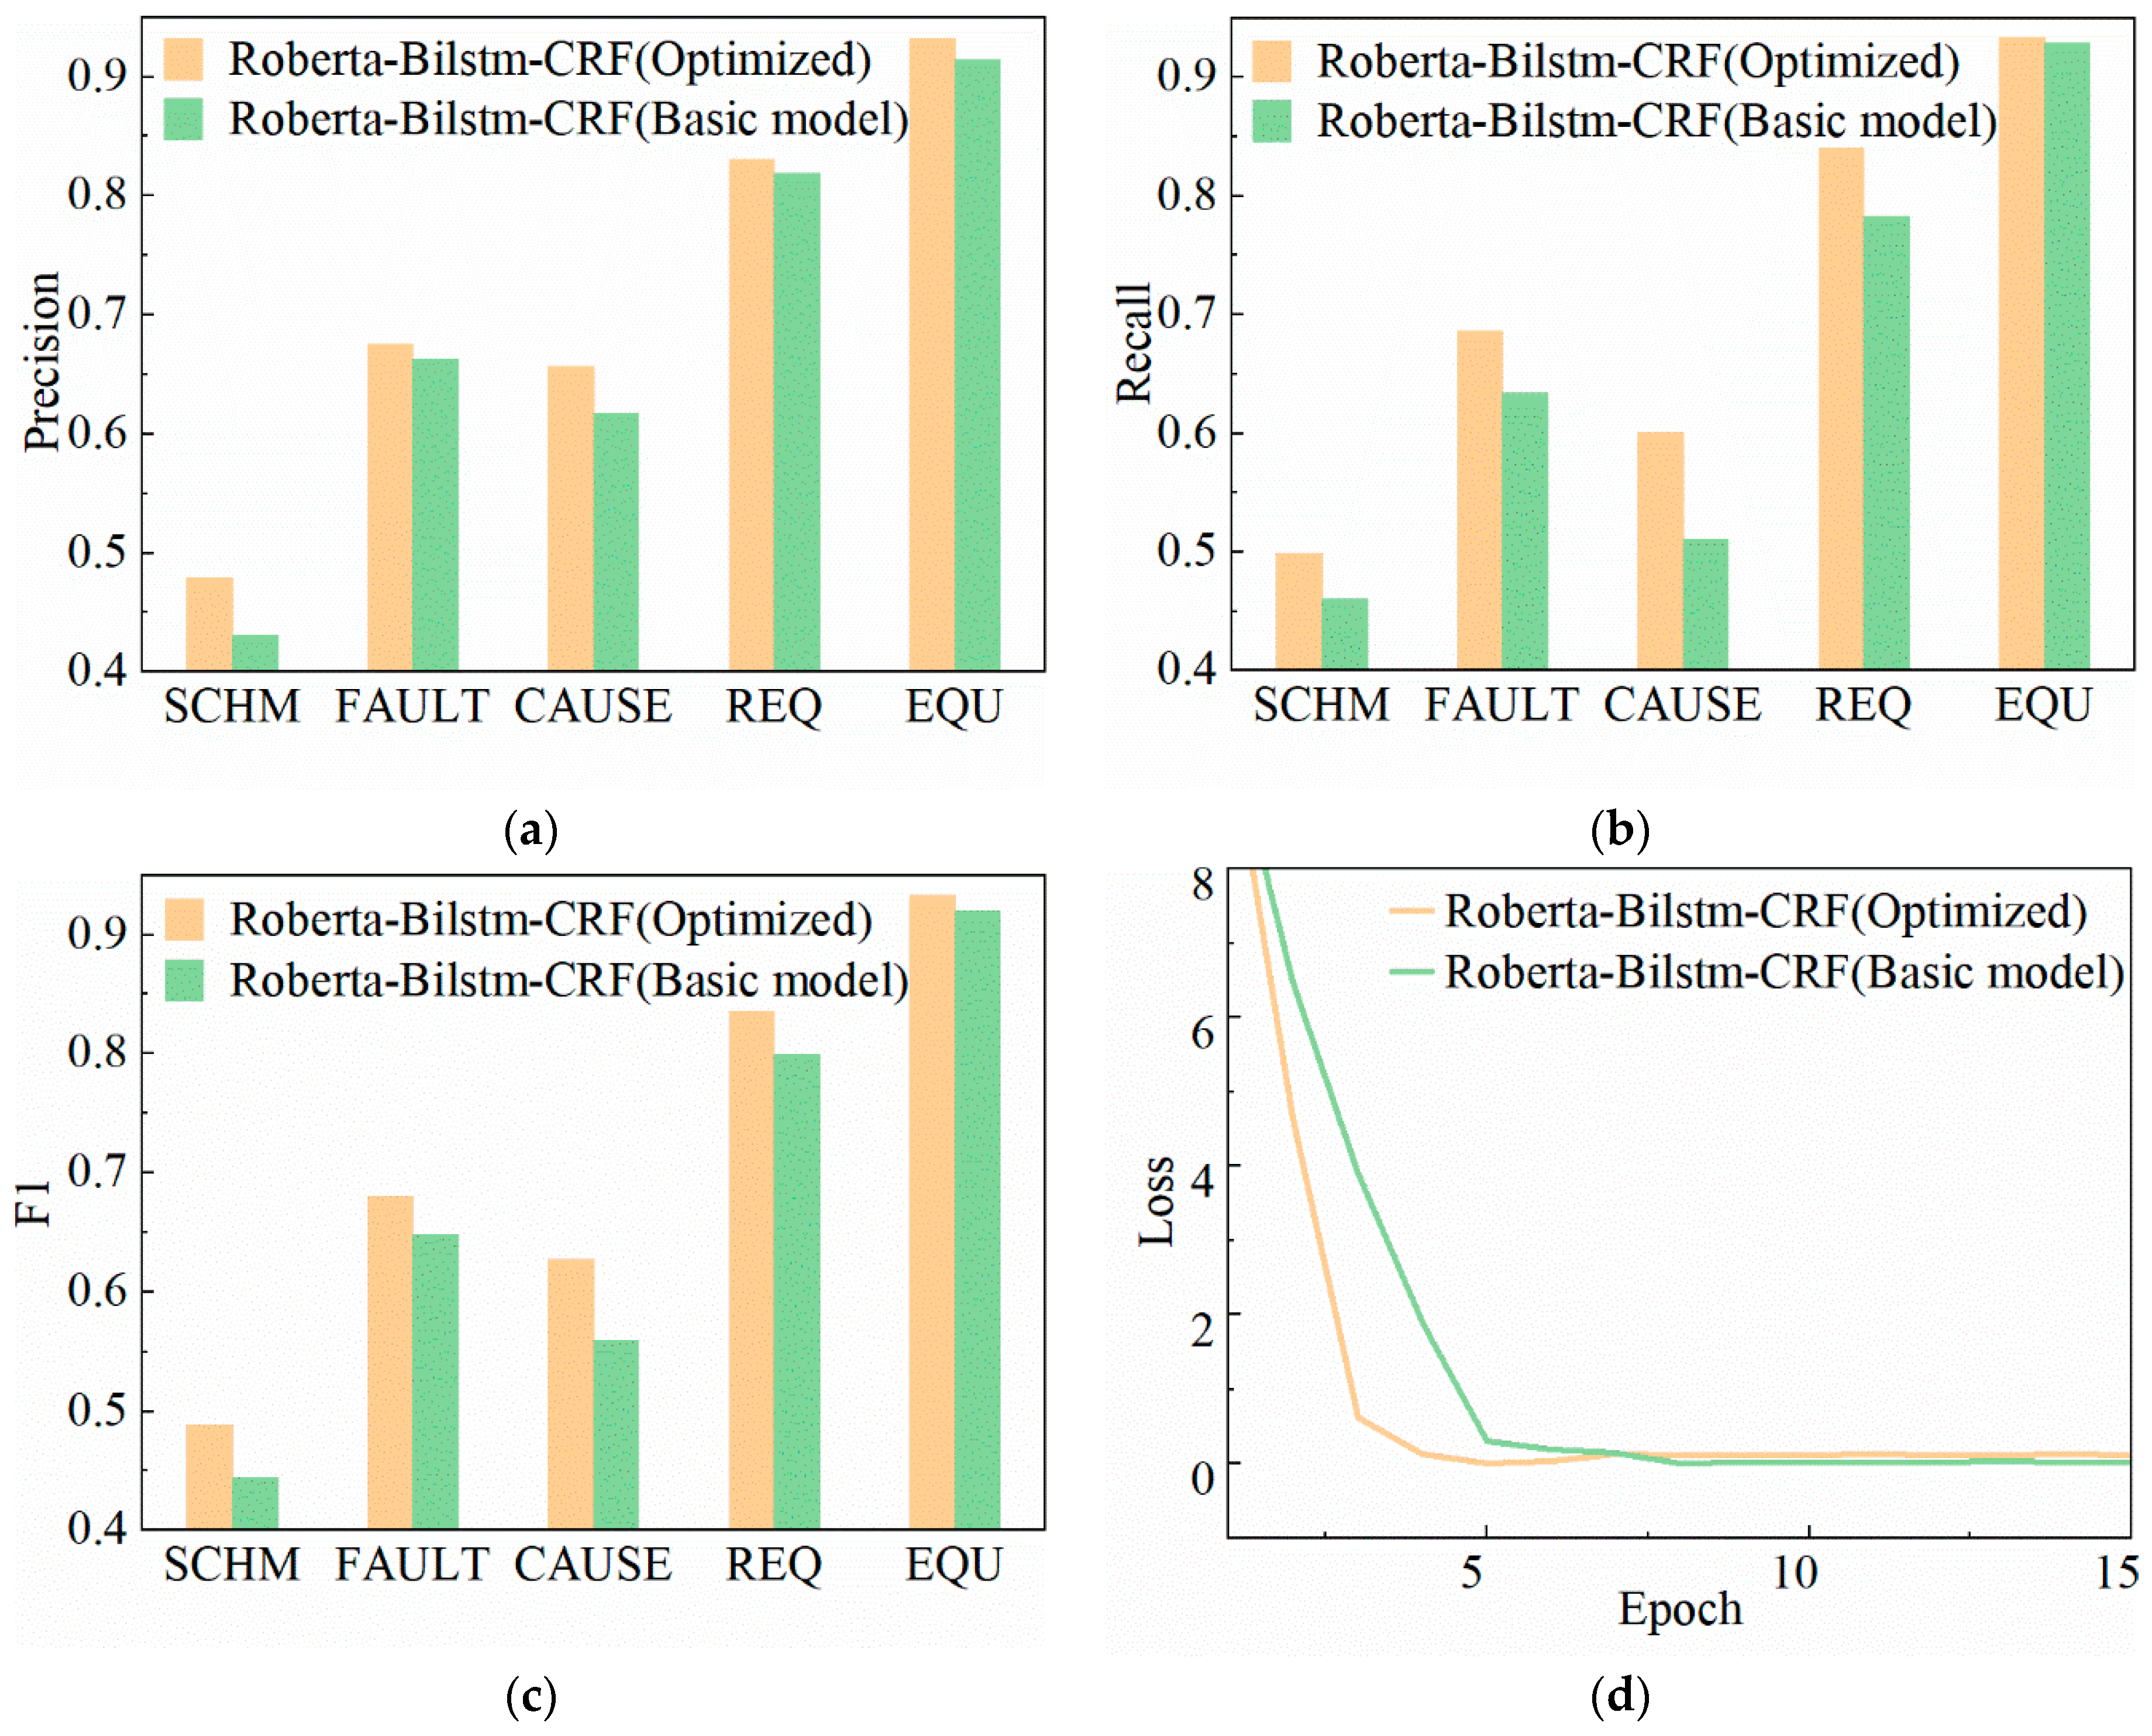
In order to optimize the basic RoBERTa-BiLSTM-CRF model, the outputs of RoBERTa and BILSTM are concatenated as shown in Figure 5, and the features of different levels are combined to enrich the feature data obtained by the CRF layer. Figure 13 presents the experimental comparison between the optimized RoBERTa-BiLSTM-CRF model and its unoptimized counterpart. Figure 13a–c illustrate the performance contrasts at the entity level between RoBERTa-BiLSTM-CRF and the baseline model. The results indicate that the optimized RoBERTa-BiLSTM-CRF model exhibits superior accuracy, recall rate, and F1 score compared to the baseline model, demonstrating enhanced recognition effectiveness. Figure 13d displays the loss functions of both models, highlighting that the optimized model converges faster with smaller loss values.
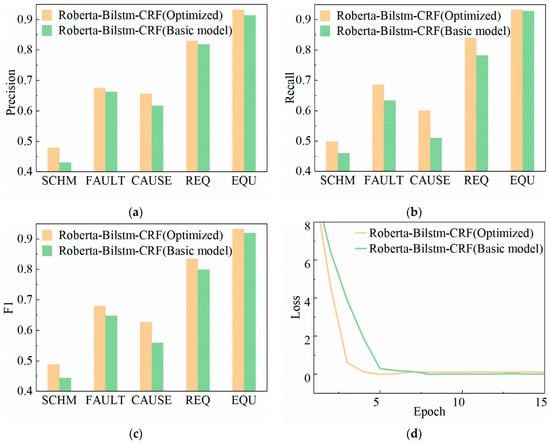
Figure 13.
Performance comparison between Feature-Fusion RoBERTa-BiLSTM-CRF model and RoBERTa-BiLSTM-CRF model at entity level, Precision (a), Recall (b), F1 (c), Loss (d).
4.5.3. The Influence of Parameters on the Model
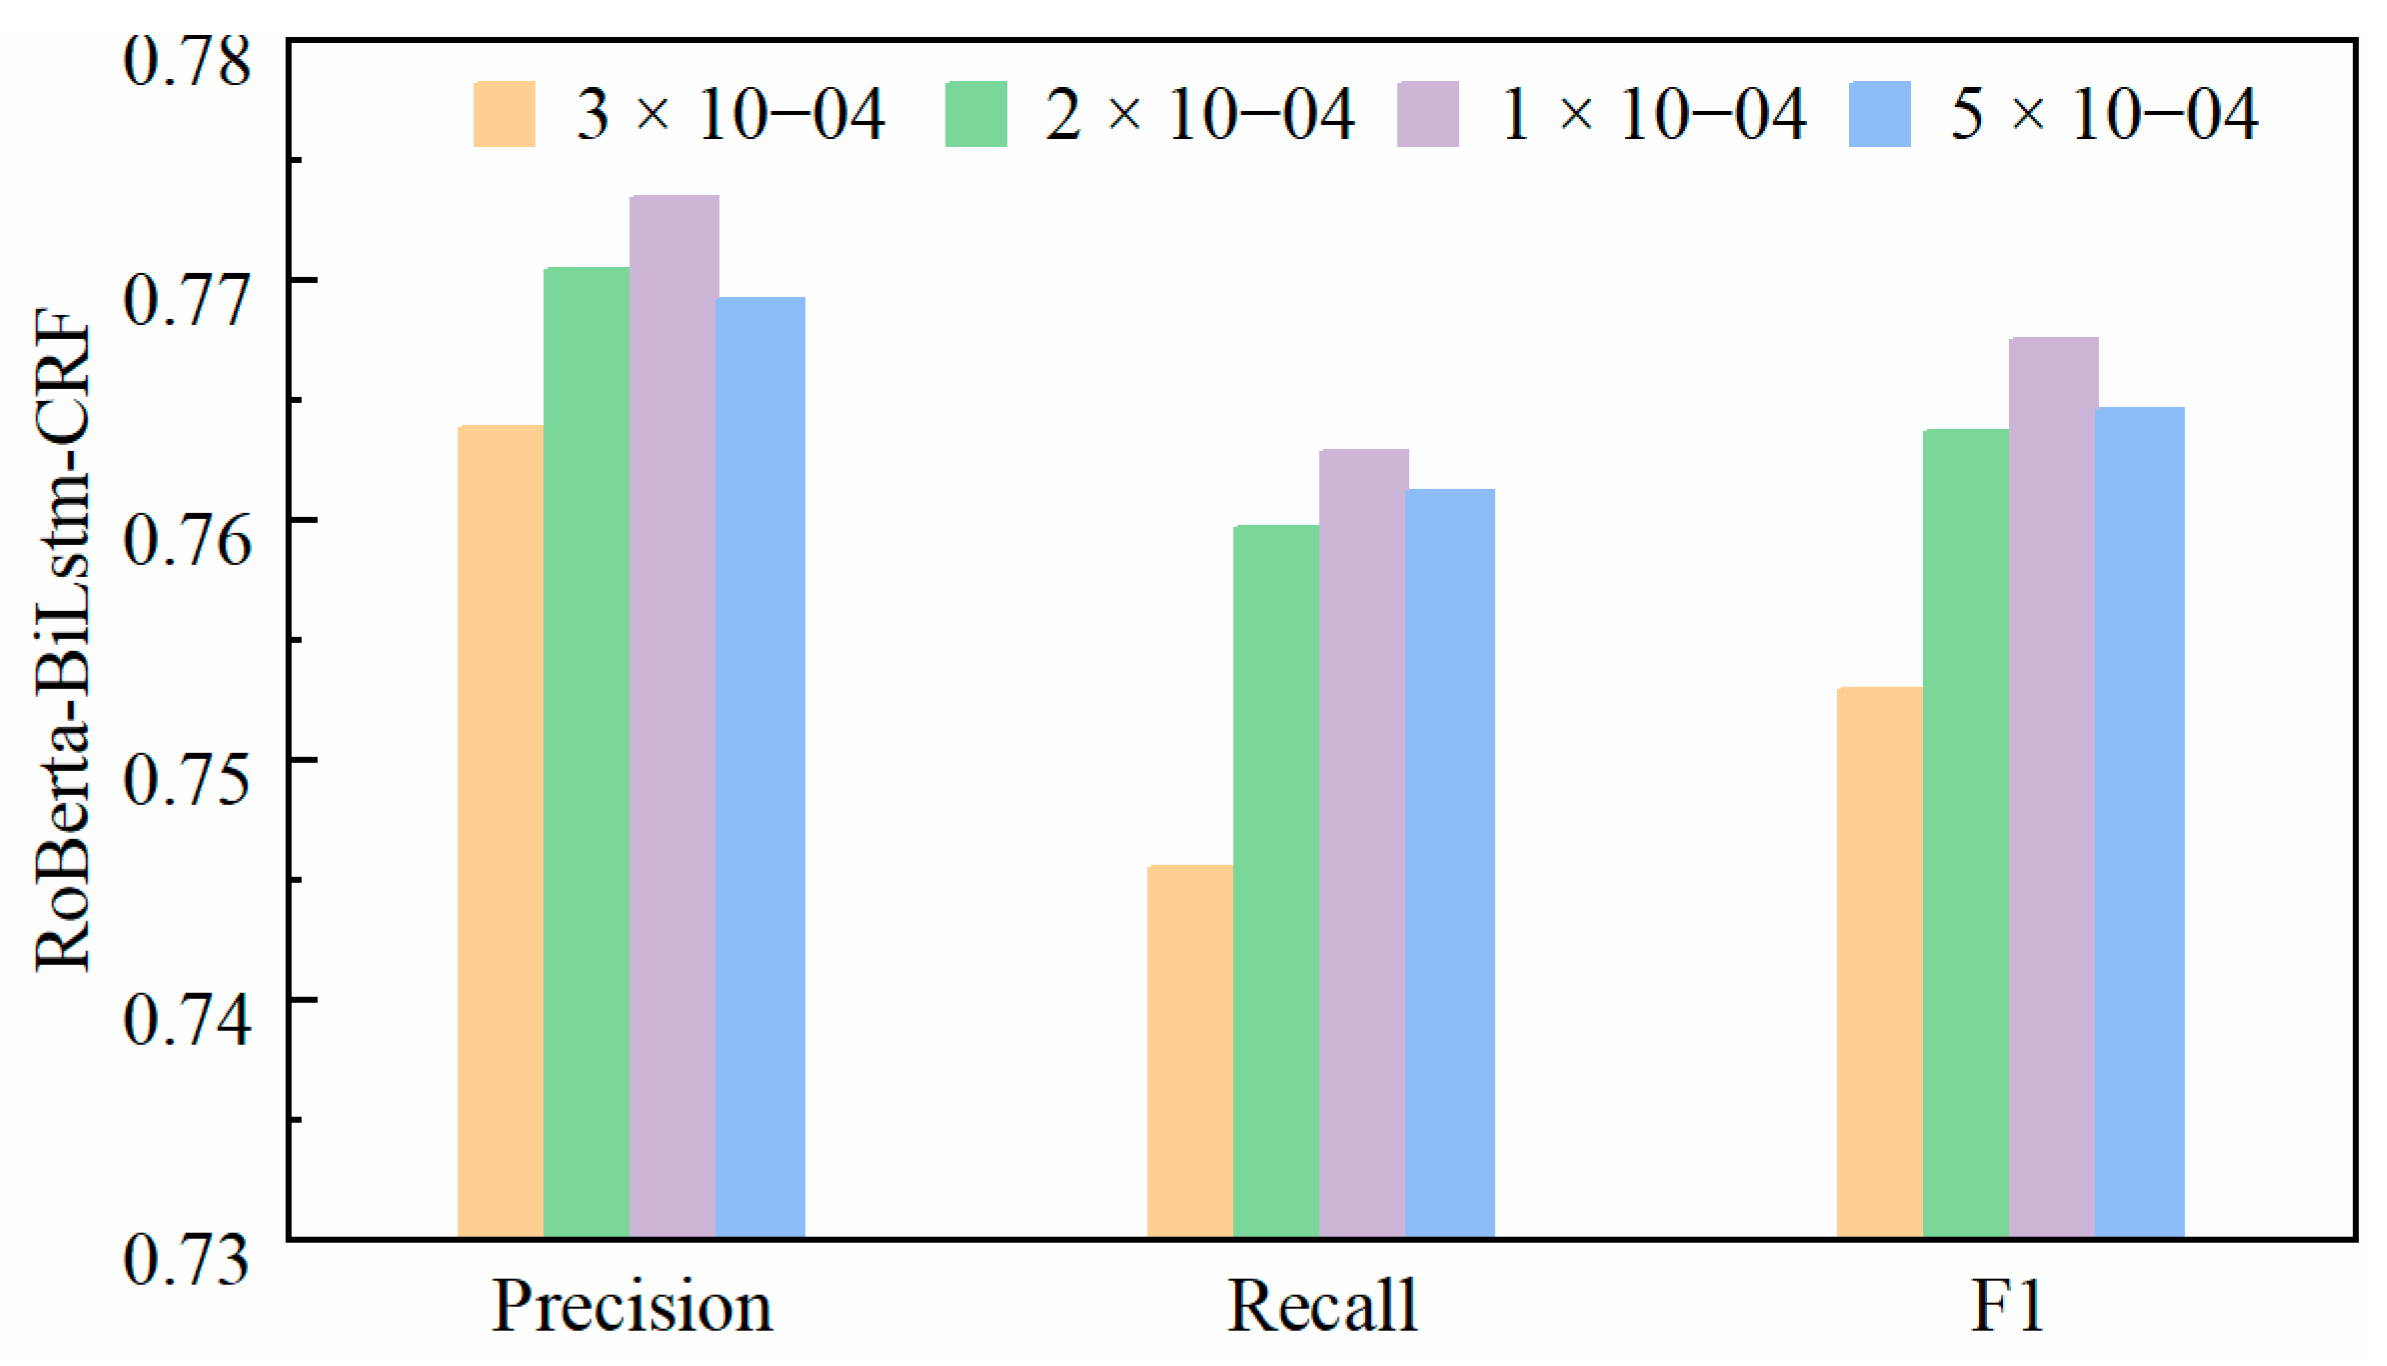
In deep learning models, the choice of learning rate significantly impacts performance, necessitating the selection of an optimal rate. Figure 14 illustrates the performance of the RoBERTa-BiLSTM-CRF model across different learning rates. The results demonstrate that the model achieves its highest performance across all four evaluation metrics when Lr = 10−4.
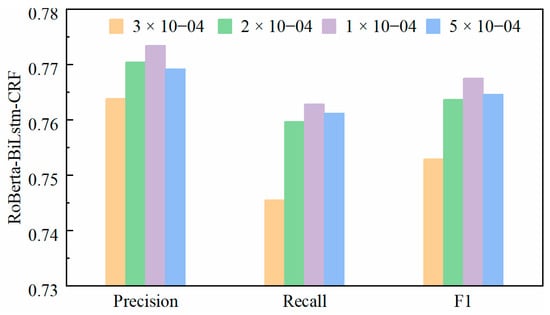
Figure 14.
Comparison of the influence of learning rate on the RoBERTa-BILSTM-CRF model.
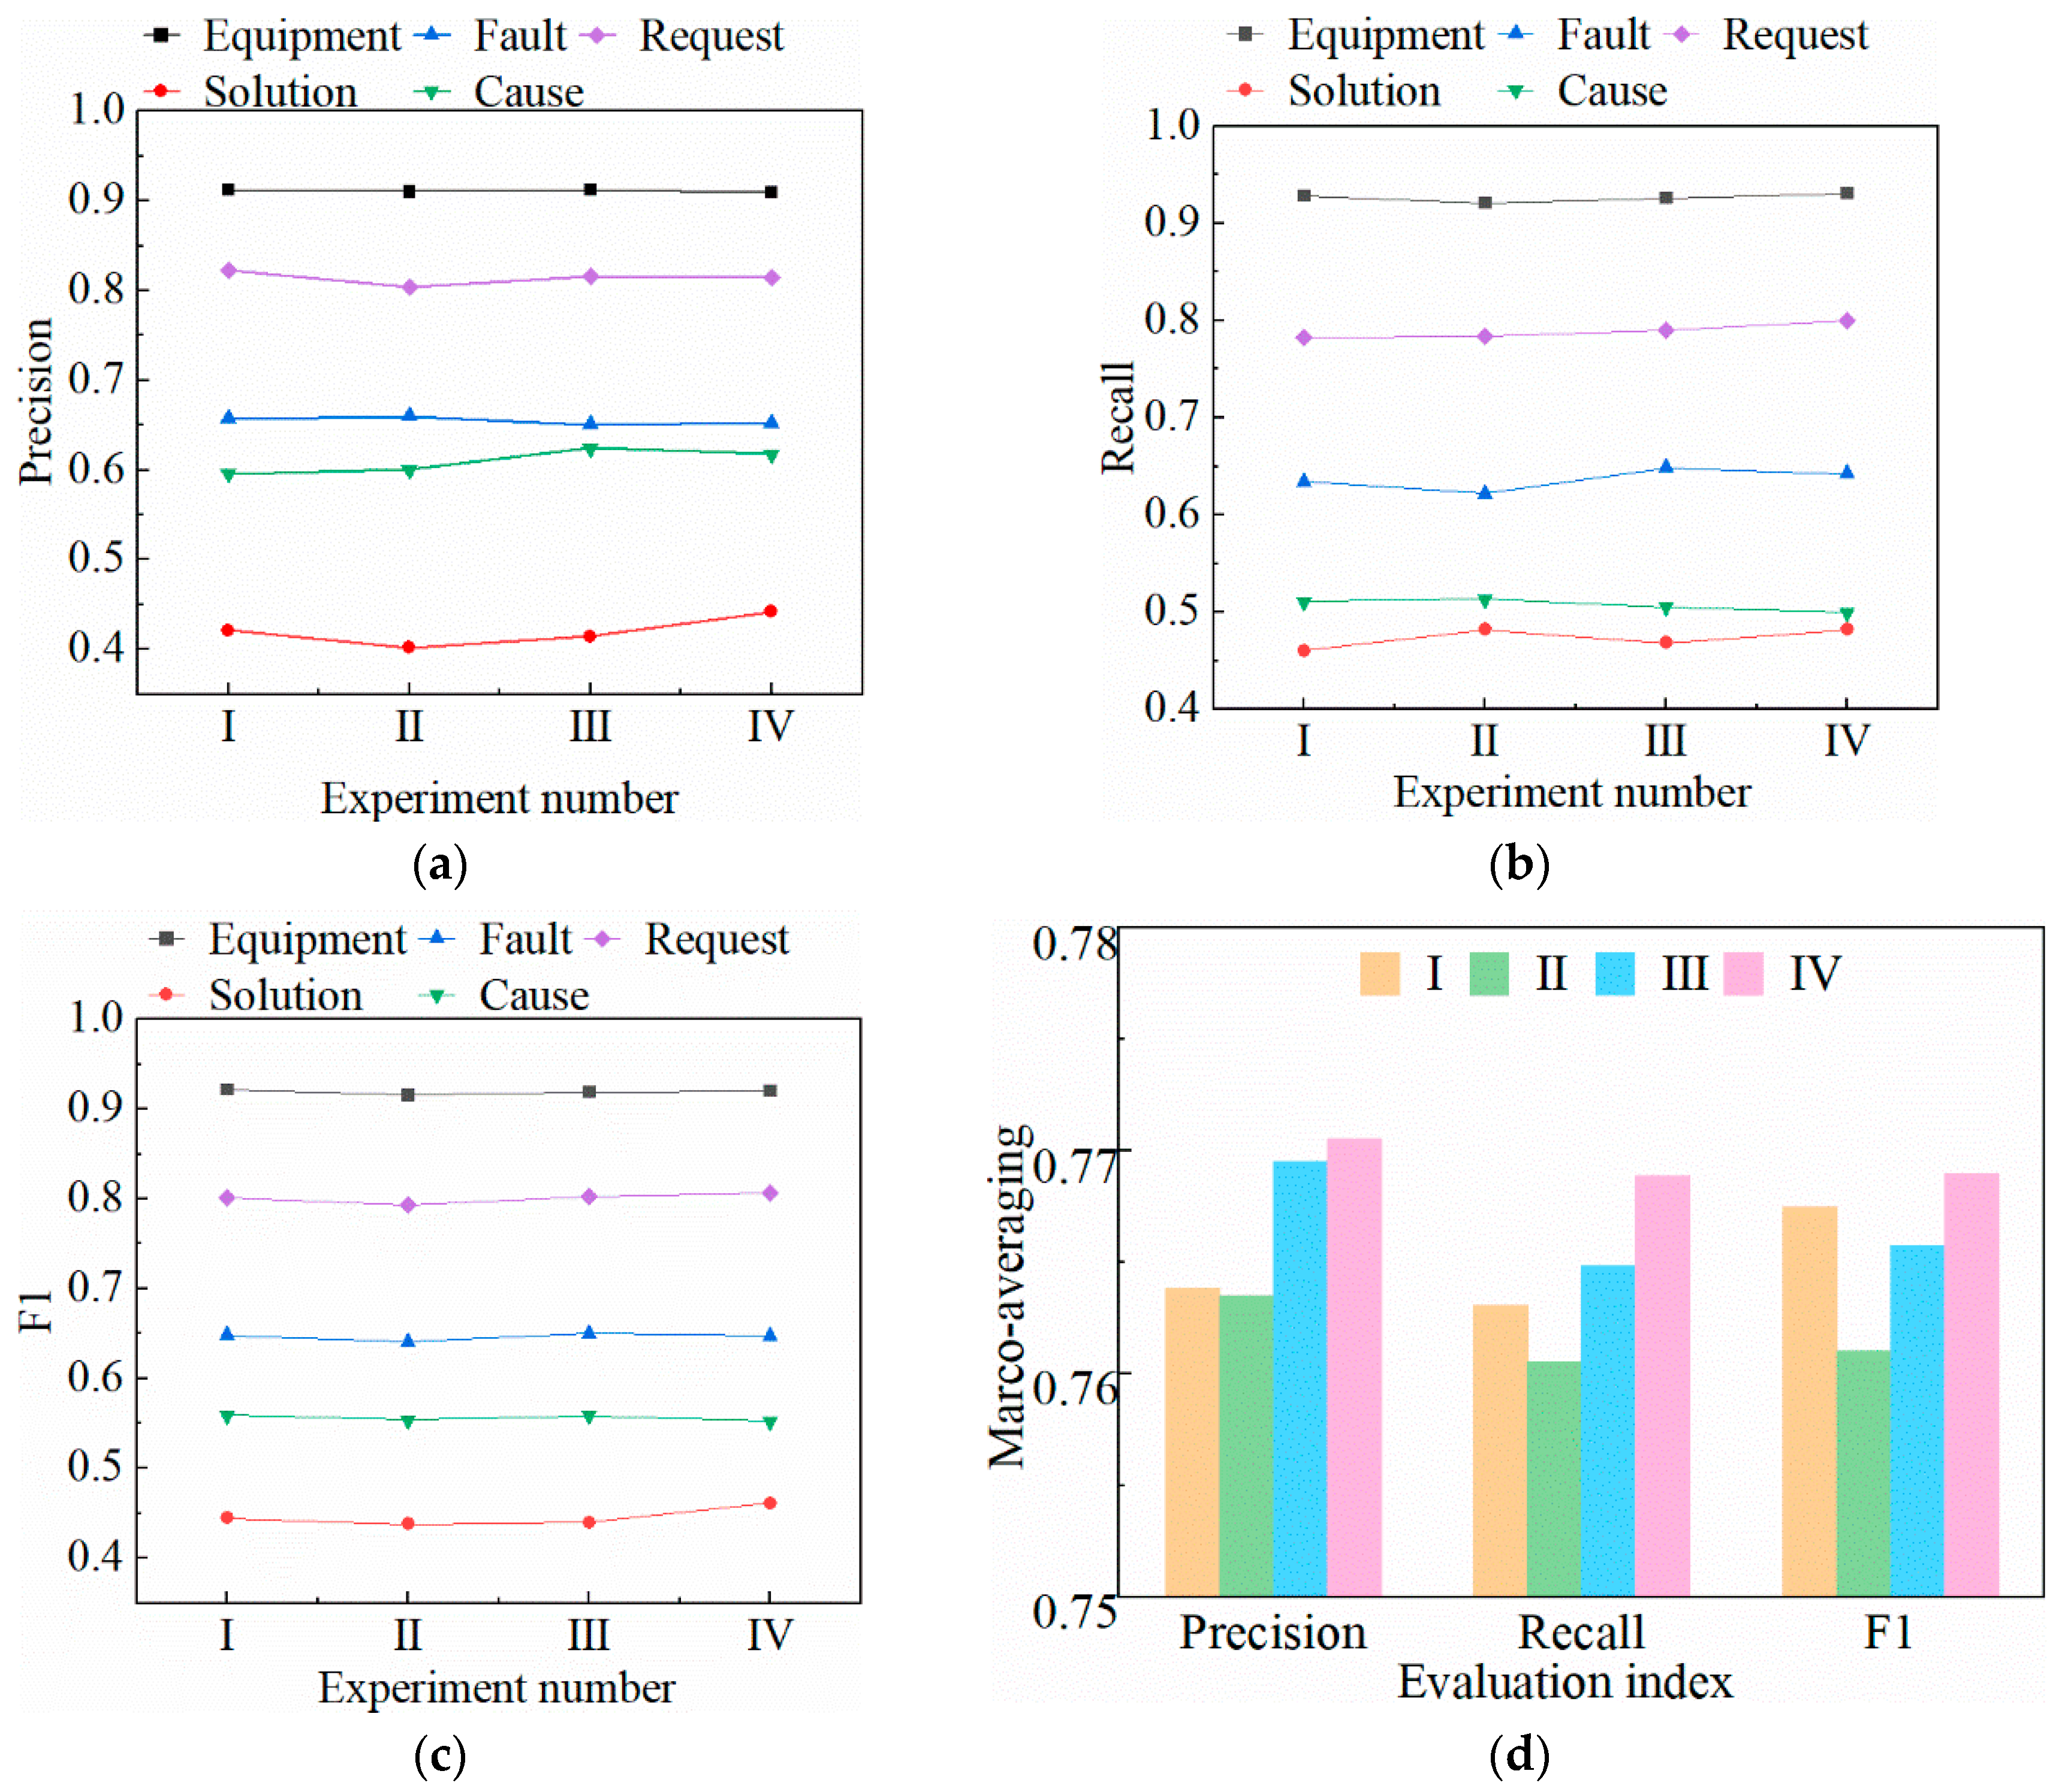
Having identified the optimal learning rate as 10−4, we proceeded to fine-tune additional parameters of the RoBERTa-BiLSTM-CRF model based on initial settings. Specifically, adjustments were made to the Batch Size, LSTM hidden layer dimensions, and random dropout rates, as detailed in Table 6. Figure 15 presents the comparative results of these parameter variations.
Table 6.
Experimental settings of different model parameters.
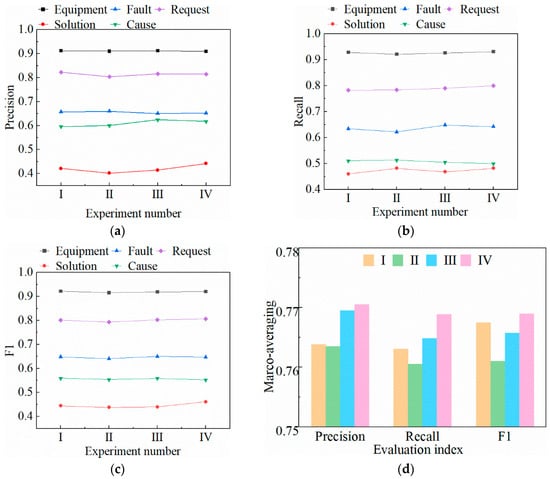
Figure 15.
Performance of the RoBERTa-BiLSTM-CRF model with different parameters, Precision (a), Recall (b), F1 (c), Marco-averaging of Precision, Recall and F1 (d).
Table 6 outlines four experiments, with Experiment 1 serving as the baseline. Experiments II, III, and IV primarily adjust the Batch Size, LSTM hidden layer dimensions, and random dropout rate, respectively.
Figure 15a–c indicate that the model’s entity recognition capability for most categories shows little change or even a decrease across experiments, except for Experiment IV, which exhibits improved Solution recognition compared to Experiment I. Figure 15d clearly shows that Experiments III and IV achieve the highest average values across the four experiments for evaluation metrics.
The enhanced dropout rate in Experiment IV effectively prevents the model from overfitting to noise in the training data, thereby enhancing its generalization to new data. Additionally, as different nodes are discarded in each iteration, the model learns to operate under diverse conditions, improving its adaptability to various inputs and enabling a more comprehensive understanding of data features. Therefore, this study concludes that an appropriate increase in the dropout rate can enhance model performance based on the original parameters.
4.6. The Construction of the Chinese Knowledge Graph of Compressor Faults
Based on the entity identification method described above, fault diagnosis knowledge entities can be extracted from the air compressor fault diagnosis log data. These entities are categorized based on the classes and relationships defined in Section 3. By associating the extracted entity sequence, semantic triplets are generated. These semantic triplets represent the knowledge about air compressor faults.
Subsequently, the semantic triplets are represented using the Cypher language and imported into the Neo4j database. This process facilitates the storage and visualization of the knowledge graph. In this way, the construction of the knowledge graph for air compressor fault diagnosis is completed.
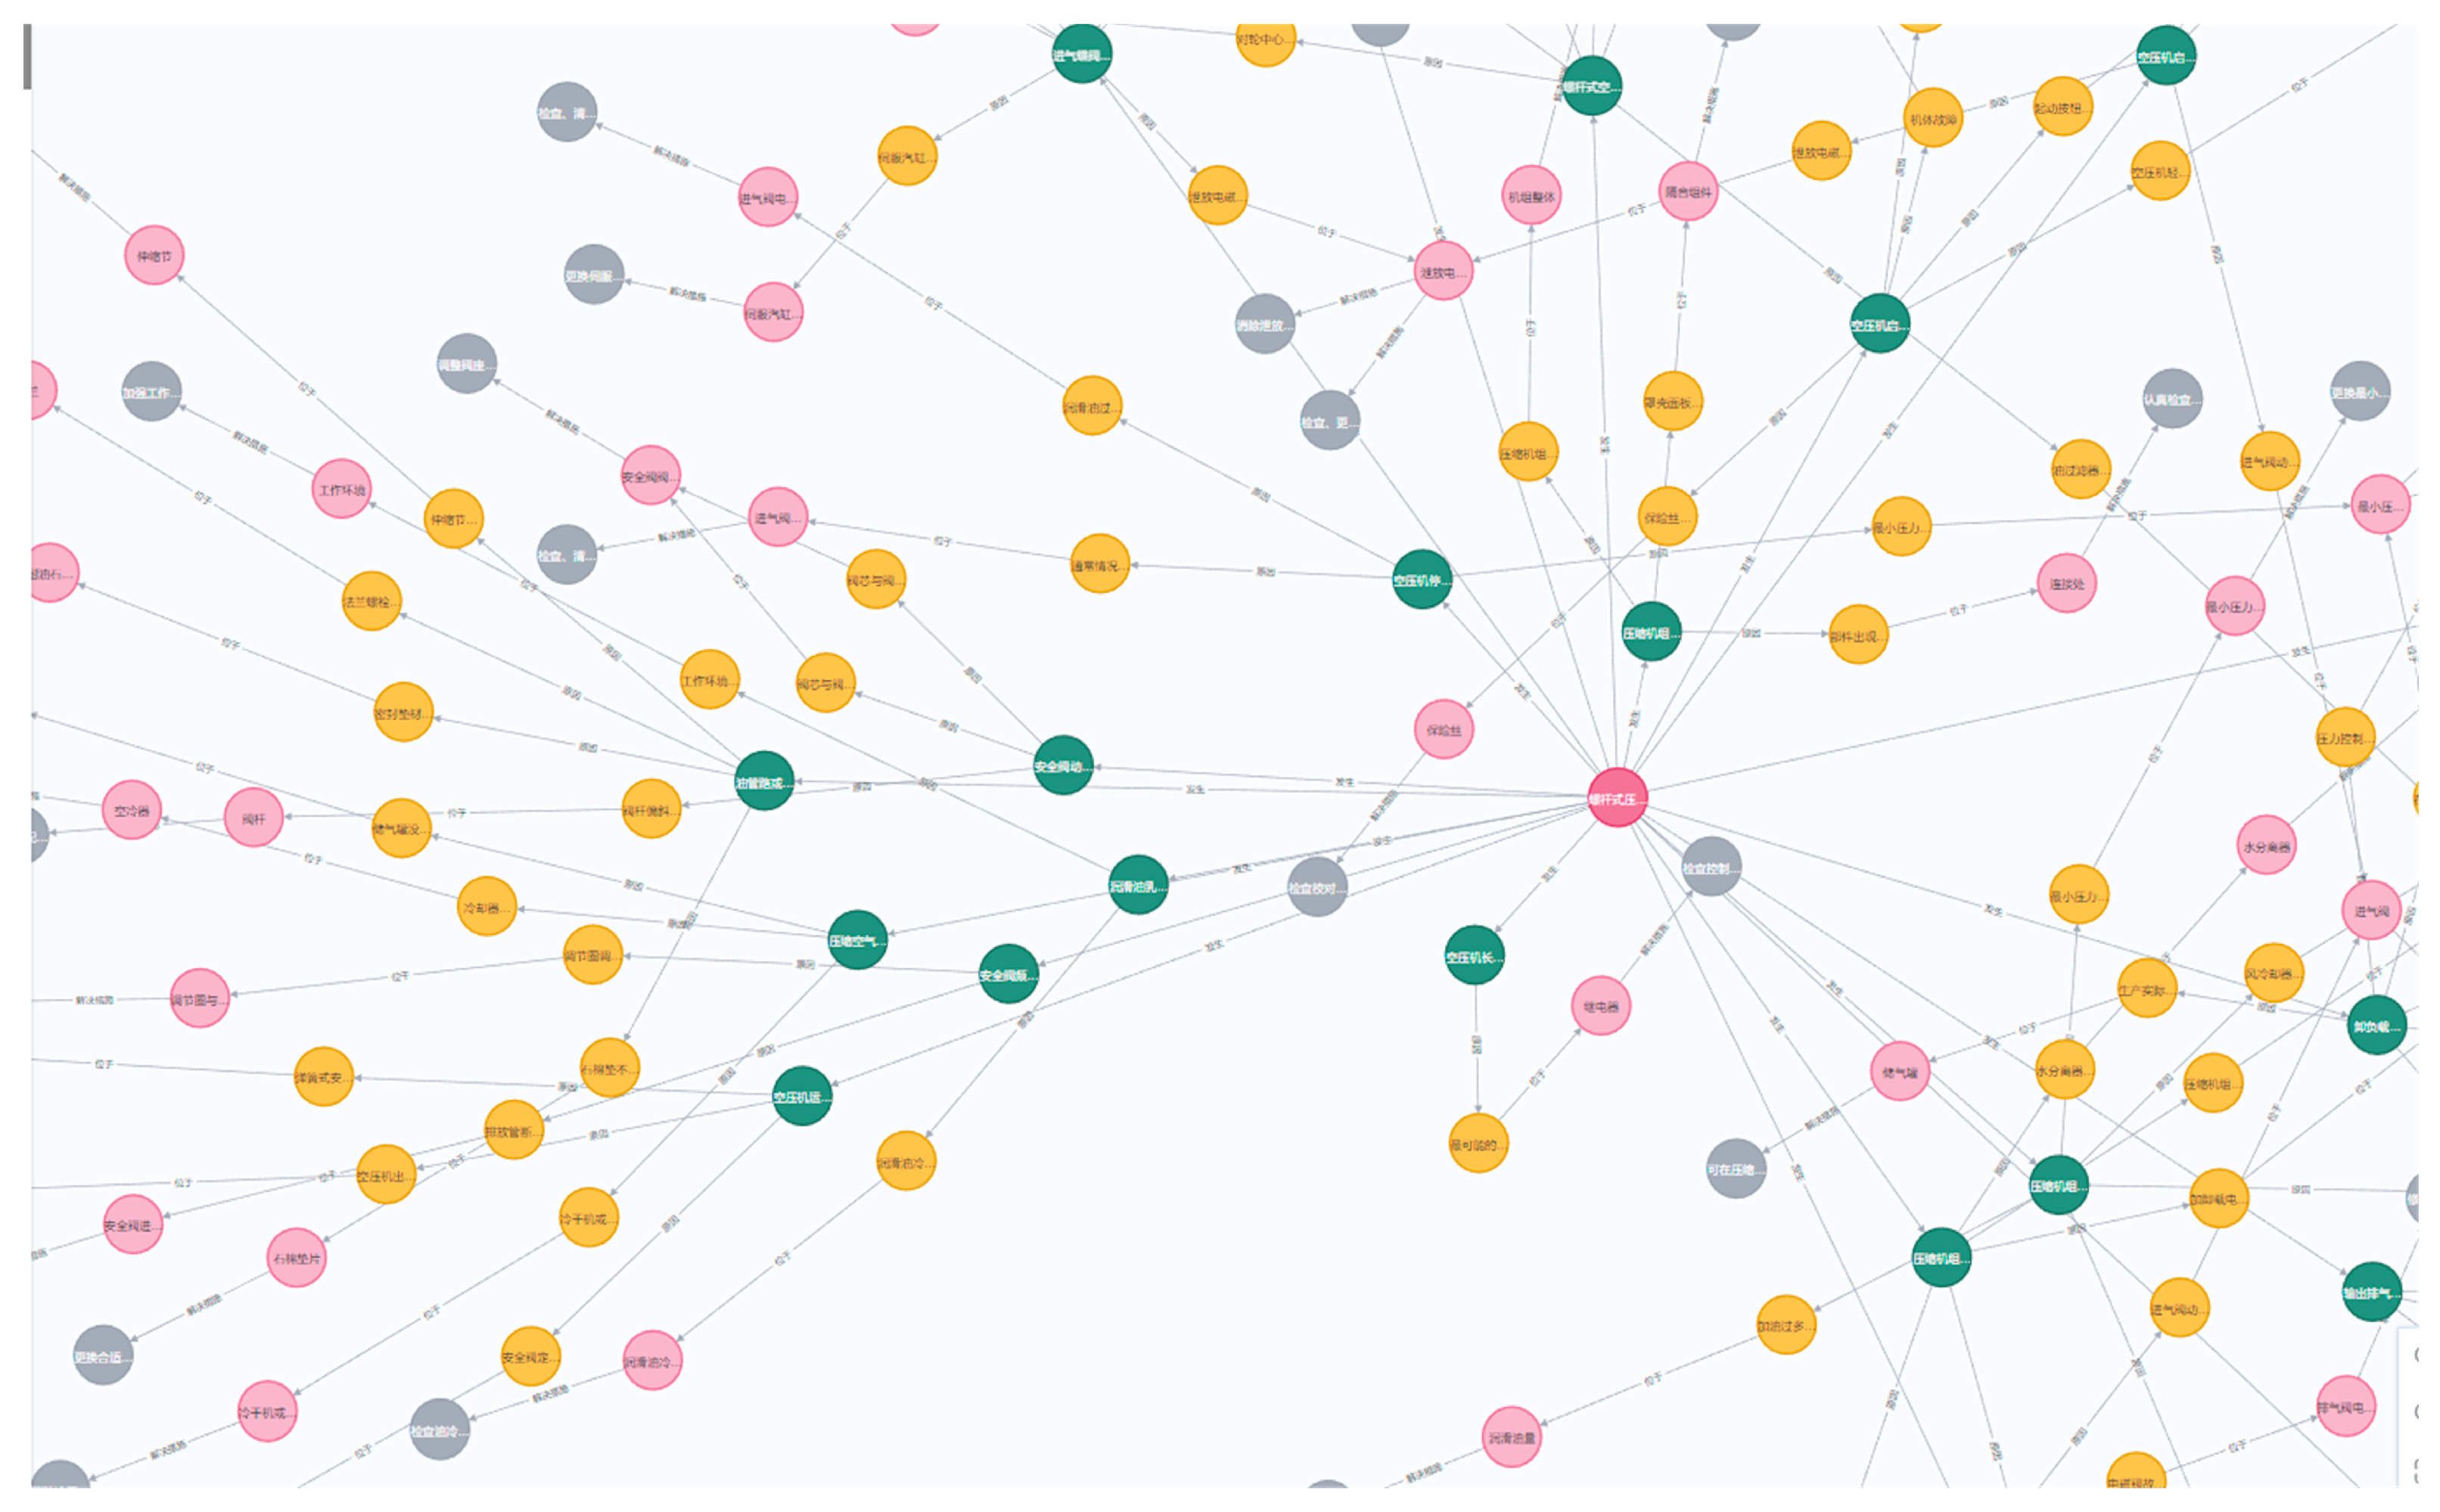
A portion of the knowledge graph is depicted in Figure 16.
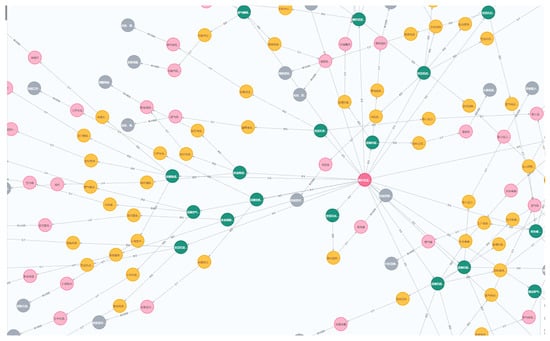
Figure 16.
The knowledge graph of compressor faults.
The knowledge graph integrates and visualizes diverse types of fault information, allowing analysts to examine fault phenomena from a comprehensive perspective. By leveraging the entities and relationships within the graph, users can effectively trace the root causes of failures, assess their scope of impact, and review related historical records. This extensive analytical capability facilitates the identification of potential failure patterns and trends, providing valuable data support for preventive maintenance strategies.
4.7. Deployment of Knowledge Graph in Fault Monitoring System
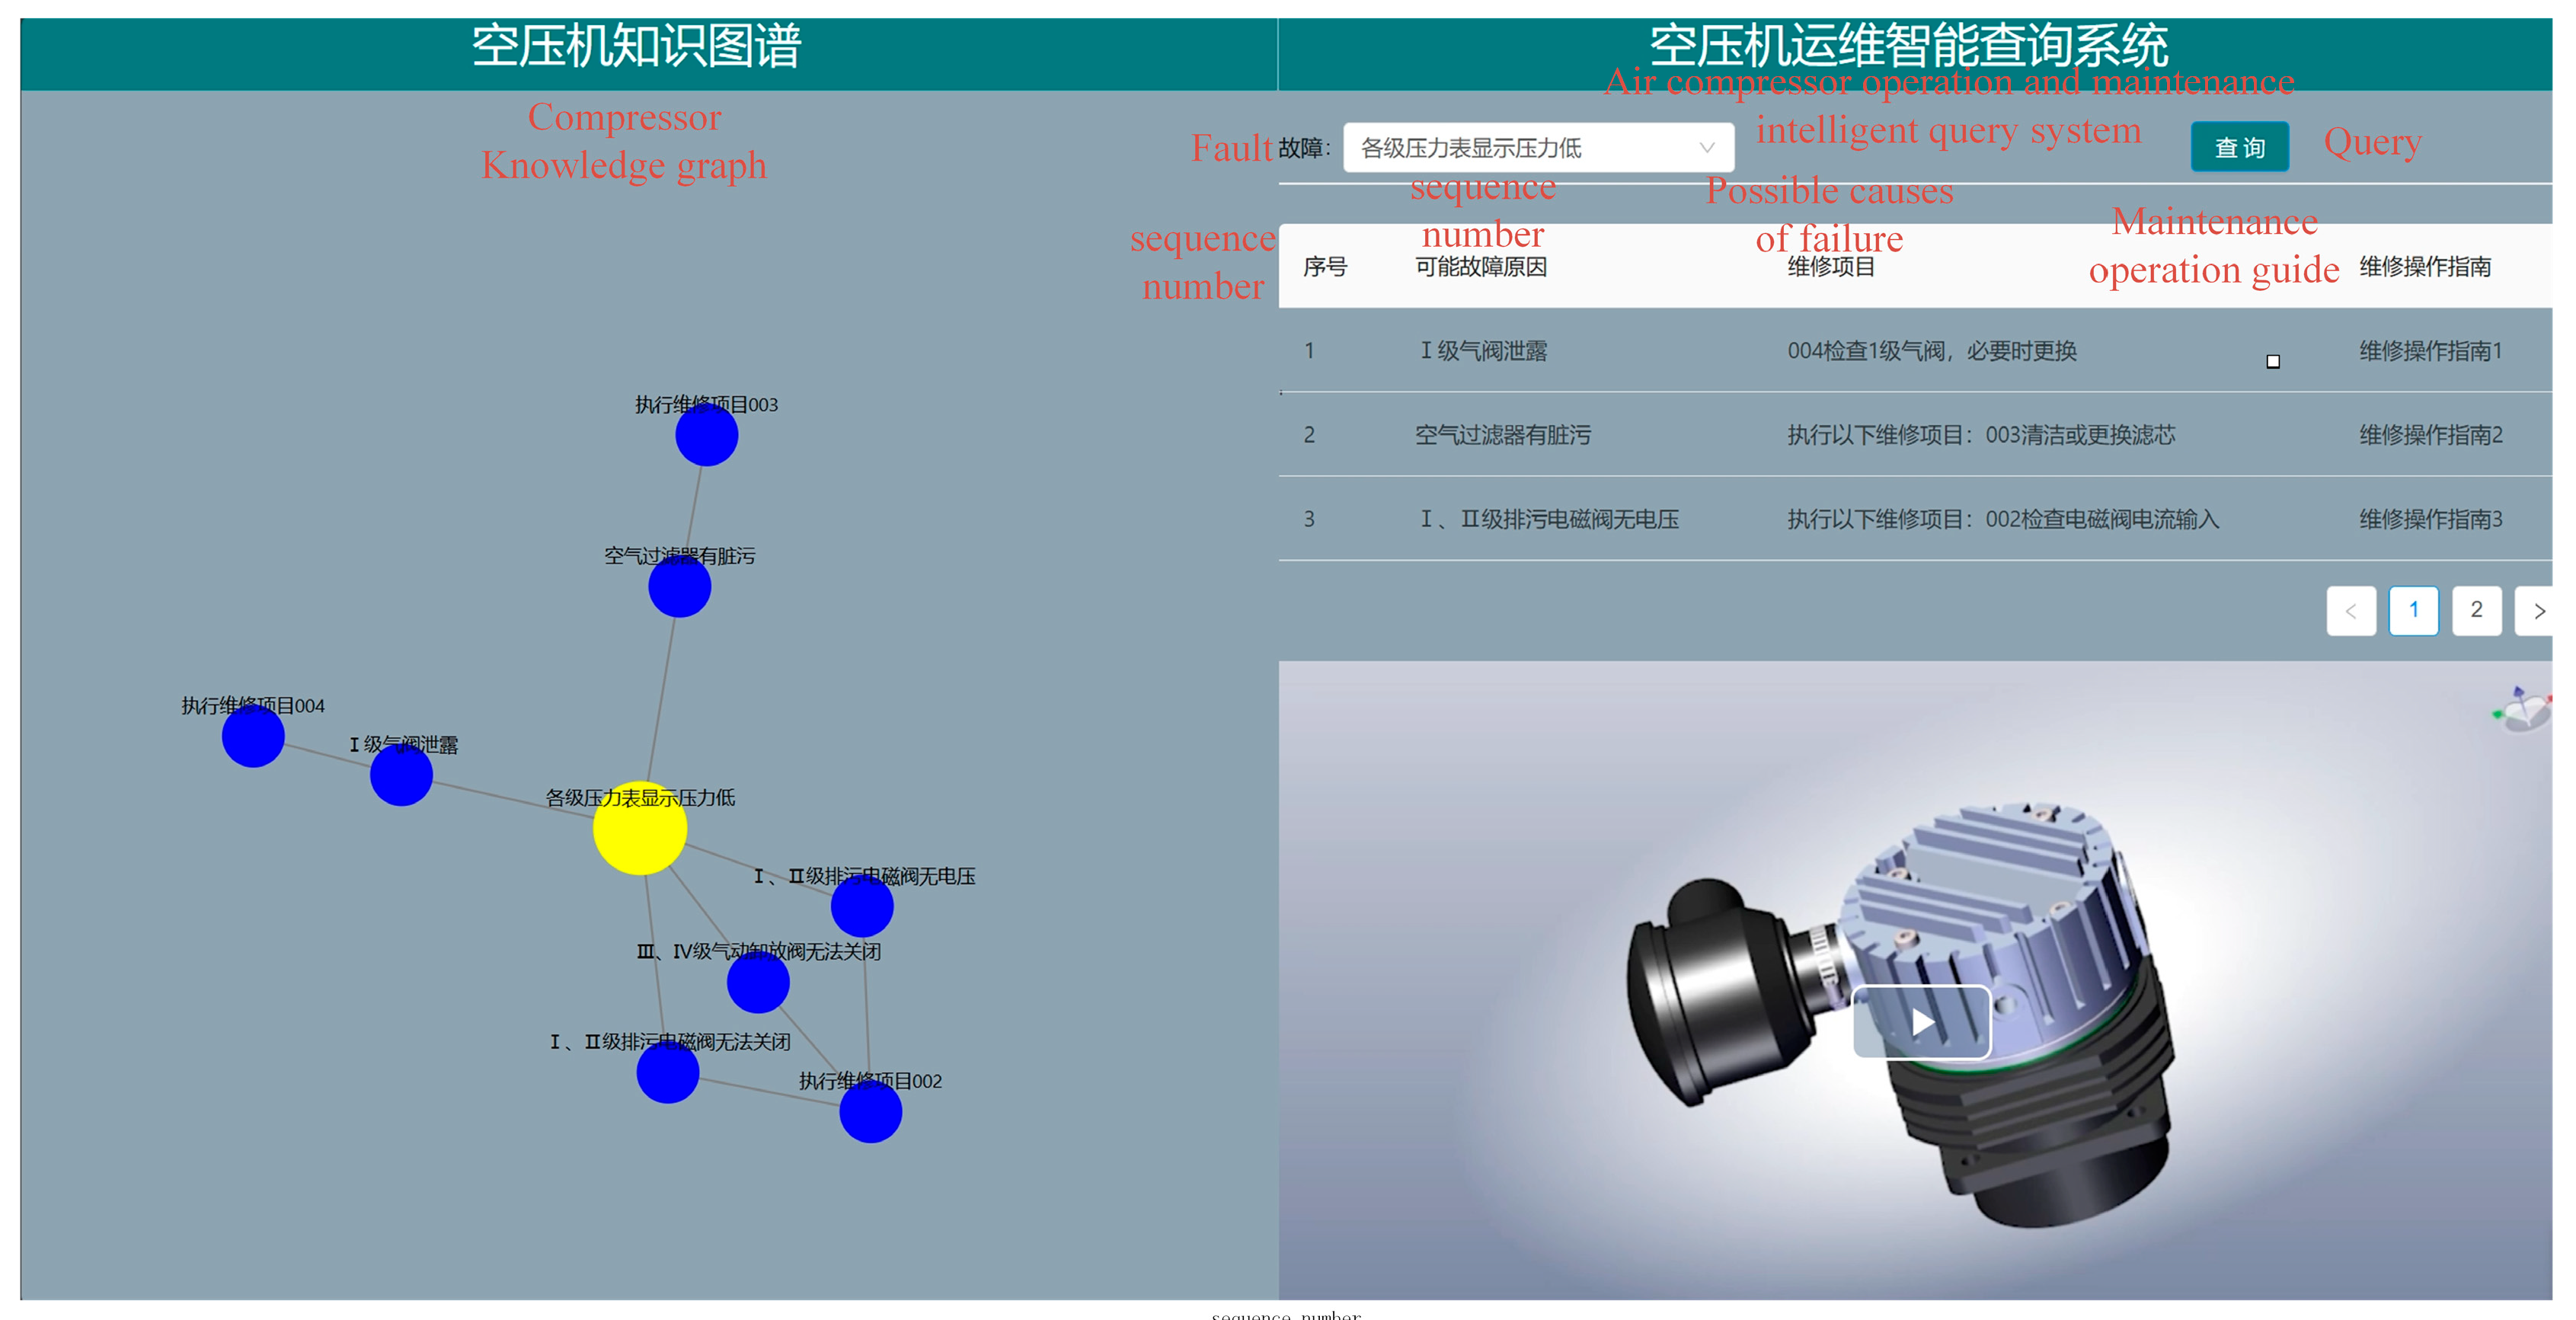
We have developed a comprehensive solution integrating a Vue.js-based front-end application for knowledge graph visualization and fault querying with a Neo4j database. The back-end is powered by the Django framework, which facilitates seamless data exchange between the Vue.js front-end and the Neo4j database. To enhance the user experience, we have employed a 3D WEBVIEW plugin to embed the Vue.js interface within a Unity-based digital twin fault monitoring system for air compressors.
This integration allows production personnel to directly access the knowledge graph query system upon receiving fault alerts from the digital twin monitoring system. By consulting the knowledge graph, users can swiftly review and learn about relevant fault information. This capability significantly aids in accurate fault diagnosis, minimizes the likelihood of human errors, and improves the overall reliability of fault diagnosis processes.
The use of a knowledge graph in this context provides a structured and comprehensive repository of fault-related knowledge, which is critical for effective decision-making and maintenance planning. The system’s design ensures that fault information is readily accessible and contextually relevant, thereby enhancing the efficiency and accuracy of fault resolution in operational settings. See Figure 17.

Figure 17.
Knowledge graph query system for fault diagnosis.
5. Conclusions
This study presents a method for constructing a knowledge graph specifically for air compressor fault diagnosis. We employ an optimized RoBERTa-BiLSTM-CRF model to identify knowledge entities related to air compressor fault maintenance and fine-tuning model parameters to enhance the quality of the knowledge graph. RoBERTa generates context-rich feature representations, while the CRF and BiLSTM layers optimize the capture of global context and sequence information, respectively. The feature fusion layer integrates the outputs from RoBERTa and BiLSTM, further boosting overall model performance.
Comparative experiments demonstrate our model’s superiority over the baseline model by Chen et al., achieving higher precision, recall, and F1 scores across various metrics, with the F1 score showing a 5.11% improvement. By addressing challenges like entity nesting and data imbalance in air compressor fault maintenance logs, our model enhances training efficiency and improves the accuracy of fault diagnosis knowledge extraction.
Integrating this knowledge graph can significantly enhance the operational efficiency of air compressor fault diagnosis systems, enabling the visualization and analysis of complex fault relationships. This comprehensive approach surpasses isolated data-driven models in providing a more holistic view of fault diagnosis.
In conclusion, our research not only represents a substantial technological advancement in air compressor fault diagnosis but also introduces novel ideas and methods applicable to fields like natural language processing and intelligent operation and maintenance. This work has the potential to drive significant progress in more complex fields and cross-industry applications in the future. Future work will focus on expanding the graph with more comprehensive data sources and refining entity recognition models to handle diverse inputs effectively.
Author Contributions
X.X.: conceptualization, methodology, software, and writing—original draft. B.S.: guidance and writing—review and editing. G.F.: data organization. Y.L.: investigation, analysis, and resources. All authors have read and agreed to the published version of the manuscript.
Funding
This research received no external funding.
Data Availability Statement
Data are contained within the article.
Acknowledgments
The authors would like to thank the editor and reviewers for their valuable comments.
Conflicts of Interest
The authors declare no conflicts of interest.
References
- Yang, C.; Cai, B.; Wu, Q.; Wang, C.; Ge, W.; Hu, Z.; Zhu, W.; Zhang, L.; Wang, L. Digital twin-driven fault diagnosis method for composite faults by combining virtual and real data. J. Ind. Inf. Integr. 2023, 33, 100469. [Google Scholar] [CrossRef]
- Hogan, A.; Blomqvist, E.; Cochez, M.; de Melo, G.; Gutierrez, C.; Kirrane, S.; Labra Gayo, J.E.; Navigli, R.; Neumaier, S.; Ngonga Ngomo, A.-C.; et al. Knowledge graphs. ACM Comput. Surv. (Csur) 2021, 54, 1–37. [Google Scholar] [CrossRef]
- Su, L.; Wang, Z.; Ji, Y.; Guo, X. A survey based on knowledge graph in fault diagnosis, analysis and prediction: Key technologies and challenges. In Proceedings of the 2020 International Conference on Artificial Intelligence and Computer Engineering (ICAICE), Beijing, China, 23–25 October 2020. [Google Scholar]
- Fangcong, Z.; Zhang, F.; Qin, Q.; Jiang, Y.; Zhuang, R. Named Entity Recognition for Chinese EMR with RoBERTa-WWM-BiLSTM-CRF. Data Anal. Knowl. Discov. 2022, 6, 251–262. [Google Scholar]
- Liu, H.; Singh, P. ConceptNet—A practical commonsense reasoning tool-kit. BT Technol. J. 2004, 22, 211–226. [Google Scholar] [CrossRef]
- Auer, S.; Bizer, C.; Kobilarov, G.; Lehmann, J.; Cyganiak, R.; Ives, Z. DBpedia: A Nucleus for a Web of Open Data; Springer: Berlin/Heidelberg, Germany, 2007. [Google Scholar]
- Suchanek, F.M.; Kasneci, G.; Weikum, G. Yago: A large ontology from wikipedia and wordnet. J. Web Semant. 2008, 6, 203–217. [Google Scholar] [CrossRef]
- Suchanek, F.M.; Kasneci, G.; Weikum, G. Yago: A core of semantic knowledge. In Proceedings of the 16th International Conference on World Wide Web, Banff, AB, Canada, 8–12 May 2007. [Google Scholar]
- Bollacker, K.; Evans, C.; Paritosh, P.; Sturge, T.; Taylor, J. Freebase: A collaboratively created graph database for structuring human knowledge. In Proceedings of the 2008 ACM SIGMOD International Conference on Management of Data, Vancouver, BC, Canada, 10–12 June 2008. [Google Scholar]
- Wang, J.; Yin, W.; Gao, J. Cases Integration System for Fault Diagnosis of CNC Machine Tools Based on Knowledge Graph. Acad. J. Sci. Technol. 2023, 5, 273–281. [Google Scholar] [CrossRef]
- Jiang, X.-J.; Zhou, W.; Hou, J. Construction of fault diagnosis system for control rod drive mechanism based on knowledge graph and Bayesian inference. Nucl. Sci. Tech. 2023, 34, 21. [Google Scholar] [CrossRef]
- Chen, H.; Wang, B.; Yang, Z.X. Semi-Supervised Self-Correcting Graph Neural Network for Intelligent Fault Diagnosis of Rotating Machinery. IEEE Trans. Instrum. Meas. 2023, 72, 1–11. [Google Scholar] [CrossRef]
- Cai, C.; Jiang, Z.; Wu, H.; Wang, J.; Liu, J.; Song, L. Research on knowledge graph-driven equipment fault diagnosis method for intelligent manufacturing. Int. J. Adv. Manuf. Technol. 2024, 130, 4649–4662. [Google Scholar] [CrossRef]
- Meng, F.; Yang, S.; Wang, J.; Xia, L.; Liu, H. Creating knowledge graph of electric power equipment faults based on BERT–BiLSTM–CRF model. J. Electr. Eng. Technol. 2022, 17, 2507–2516. [Google Scholar] [CrossRef]
- Hu, J.; Li, Y.J.; Geng, H.; Geng, H.Z.; Guo, X.; Yi, H.W. Construction of vehicle fault knowledge graph based on deep learning. Automot. Eng. 2023, 1, 52–60. [Google Scholar]
- Chen, T.; Zhu, J.; Zeng, Z.; Jia, X. Compressor Fault Diagnosis Knowledge: A Benchmark Dataset for Knowledge Extraction From Maintenance Log Sheets Based on Sequence Labeling. IEEE Access 2021, 9, 59394–59405. [Google Scholar] [CrossRef]
- Qin, X.; He, Y.; Ma, J.; Peng, W.; Zio, E.; Su, H. An Effective Knowledge Mining Method for Compressor Fault Text Data Based on Large Language Model. In Proceedings of the 2023 International Conference on Computer Science and Automation Technology (CSAT), Shanghai, China, 6–8 October 2023. [Google Scholar]
- Andrew, A.M. Ontologies: A Silver Bullet for Knowledge Management and Electronic Commerce. Kybernetes 2004, 33, 1544–1546. [Google Scholar] [CrossRef]
- Shadbolt, N.; Berners-Lee, T.; Hall, W. The semantic web revisited. IEEE Intell. Syst. 2006, 21, 96–101. [Google Scholar] [CrossRef]
- Chen, G.; Lu, R.Q.; Jin, Z. Constructing virtual domain ontologies based on domain knowledge reuse. J. Softw. 2003, 14, 350–355. [Google Scholar]
- Devlin, J.; Chang, M.-W.; Lee, K.; Toutanova, K. Bert: Pre-training of deep bidirectional transformers for language understanding. arXiv 2018, arXiv:1810.04805. [Google Scholar]
- Liu, Y.; Ott, M.; Goyal, N.; Du, J.; Joshi, M.; Chen, D.; Levy, O.; Lewis, M.; Zettlemoyer, L.; Stoyanov, V. Roberta: A robustly optimized bert pretraining approach. arXiv 2019, arXiv:1907.11692. [Google Scholar]
- Vaswani, A.; Shazeer, N.; Parmar, N.; Uszkoreit, J.; Jones, L.; Gomez, A.N.; Kaiser, Ł. Attention is all you need. In Proceedings of the Advances in Neural Information Processing Systems 30: 31st Annual Conference on Neural Information Processing Systems (NIPS 2017), Long Beach, CA, USA, 4–9 December 2017. [Google Scholar]
- Cui, Y.; Che, W.; Liu, T.; Qin, B.; Yang, Z. Pre-training with whole word masking for Chinese bert. IEEE/ACM Trans. Audio Speech Lang. Process. 2021, 29, 3504–3514. [Google Scholar] [CrossRef]
- Zhu, X.; Li, L.; Liu, J.; Peng, H.; Niu, X. Captioning transformer with stacked attention modules. Appl. Sci. 2018, 8, 739. [Google Scholar] [CrossRef]
- Zhang, Q.; Xue, C.; Su, X.; Zhou, P.; Wang, X.; Zhang, J. Named entity recognition for Chinese construction documents based on conditional random field. Front. Eng. Manag. 2023, 10, 237–249. [Google Scholar] [CrossRef]
- Zweig, G.; Nguyen, P.; Van Compernolle, D.; Demuynck, K.; Atlas, L.; Clark, P.; Sell, G.; Wang, M.; Sha, F.; Hermansky, H.; et al. Speech recognitionwith segmental conditional random fields: A summary of the JHU CLSP 2010 summer workshop. In Proceedings of the 2011 IEEE International Conference on Acoustics, Speech and Signal Processing (ICASSP), Prague, Czech Republic, 22–27 May 2011. [Google Scholar]

Disclaimer/Publisher’s Note: The statements, opinions and data contained in all publications are solely those of the individual author(s) and contributor(s) and not of MDPI and/or the editor(s). MDPI and/or the editor(s) disclaim responsibility for any injury to people or property resulting from any ideas, methods, instructions or products referred to in the content. |
© 2024 by the authors. Licensee MDPI, Basel, Switzerland. This article is an open access article distributed under the terms and conditions of the Creative Commons Attribution (CC BY) license (https://creativecommons.org/licenses/by/4.0/).