

Multi-Temperatures Pyrolysis Gas Chromatography: A Rapid Method to Differentiate Microorganisms


Abstract
:1. Introduction
2. Materials and Methods
2.1. Microorganisms and Cultivation

| No. | Species | Strain No. | Supplier | Gram a | Domain |
|---|---|---|---|---|---|
| 1 | Acinetobacter calcoaceticus | SYO-XJ2LXL20160506 | Home lab | G− | Bacteria |
| 2 | Bacillus subtilis | WD-MHM2014-D3 | Home lab | G+ | Bacteria |
| 3 | Cupidesulfovibrio oxamicus [14] | 9442 | NCIMB | G− | Bacteria |
| 4 | Escherichia coli | 1.1100 | CGMCC | G− | Bacteria |
| 5 | Staphylococcus aureus | 1.8721 | CGMCC | G+ | Bacteria |
| 6 | Streptococcus bovis | 1.1624 | CGMCC | G+ | Bacteria |
| 7 | Methanothrix harundinacea [15] | 6AC | Home lab | / | Archaea |
| 8 | Pycnoporus coccineus | WD-MHM2014-ZJ01 | Home lab | / | Fungi |
2.2. Lyophilization
2.3. Thermogravimetric Analysis (TGA)
2.4. MT-PyGC
3. Results
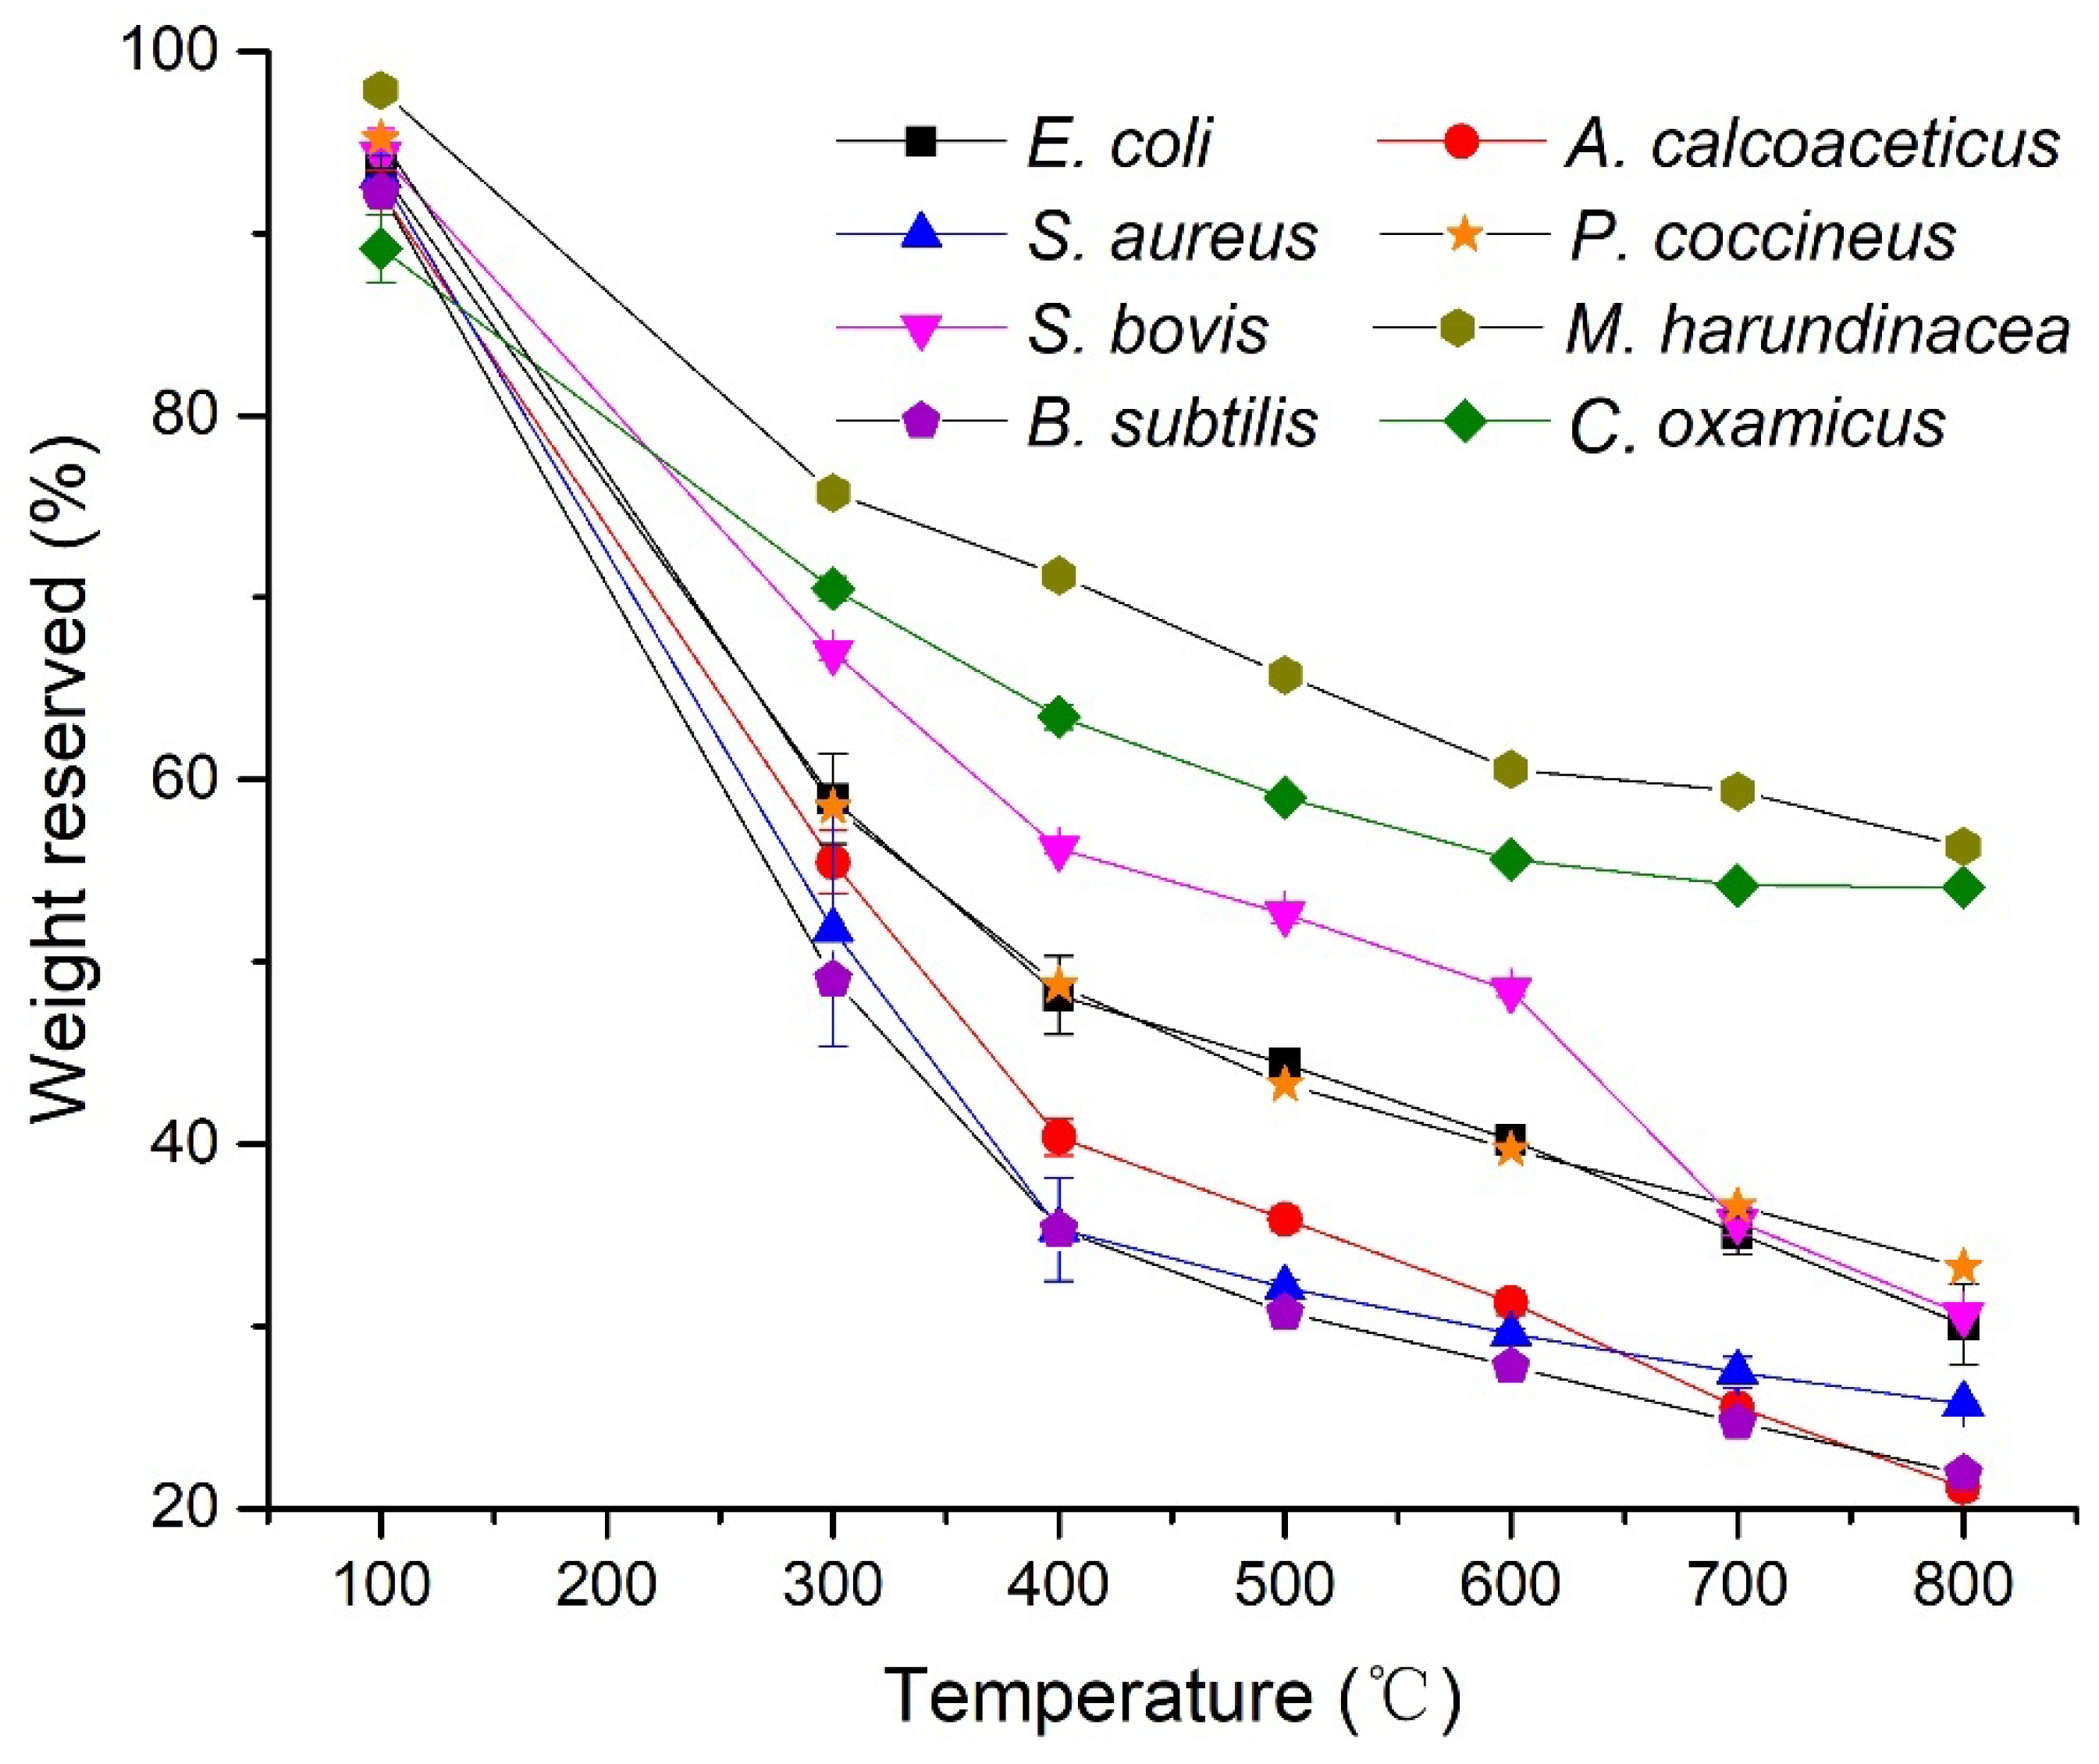
3.1. TGA Analysis
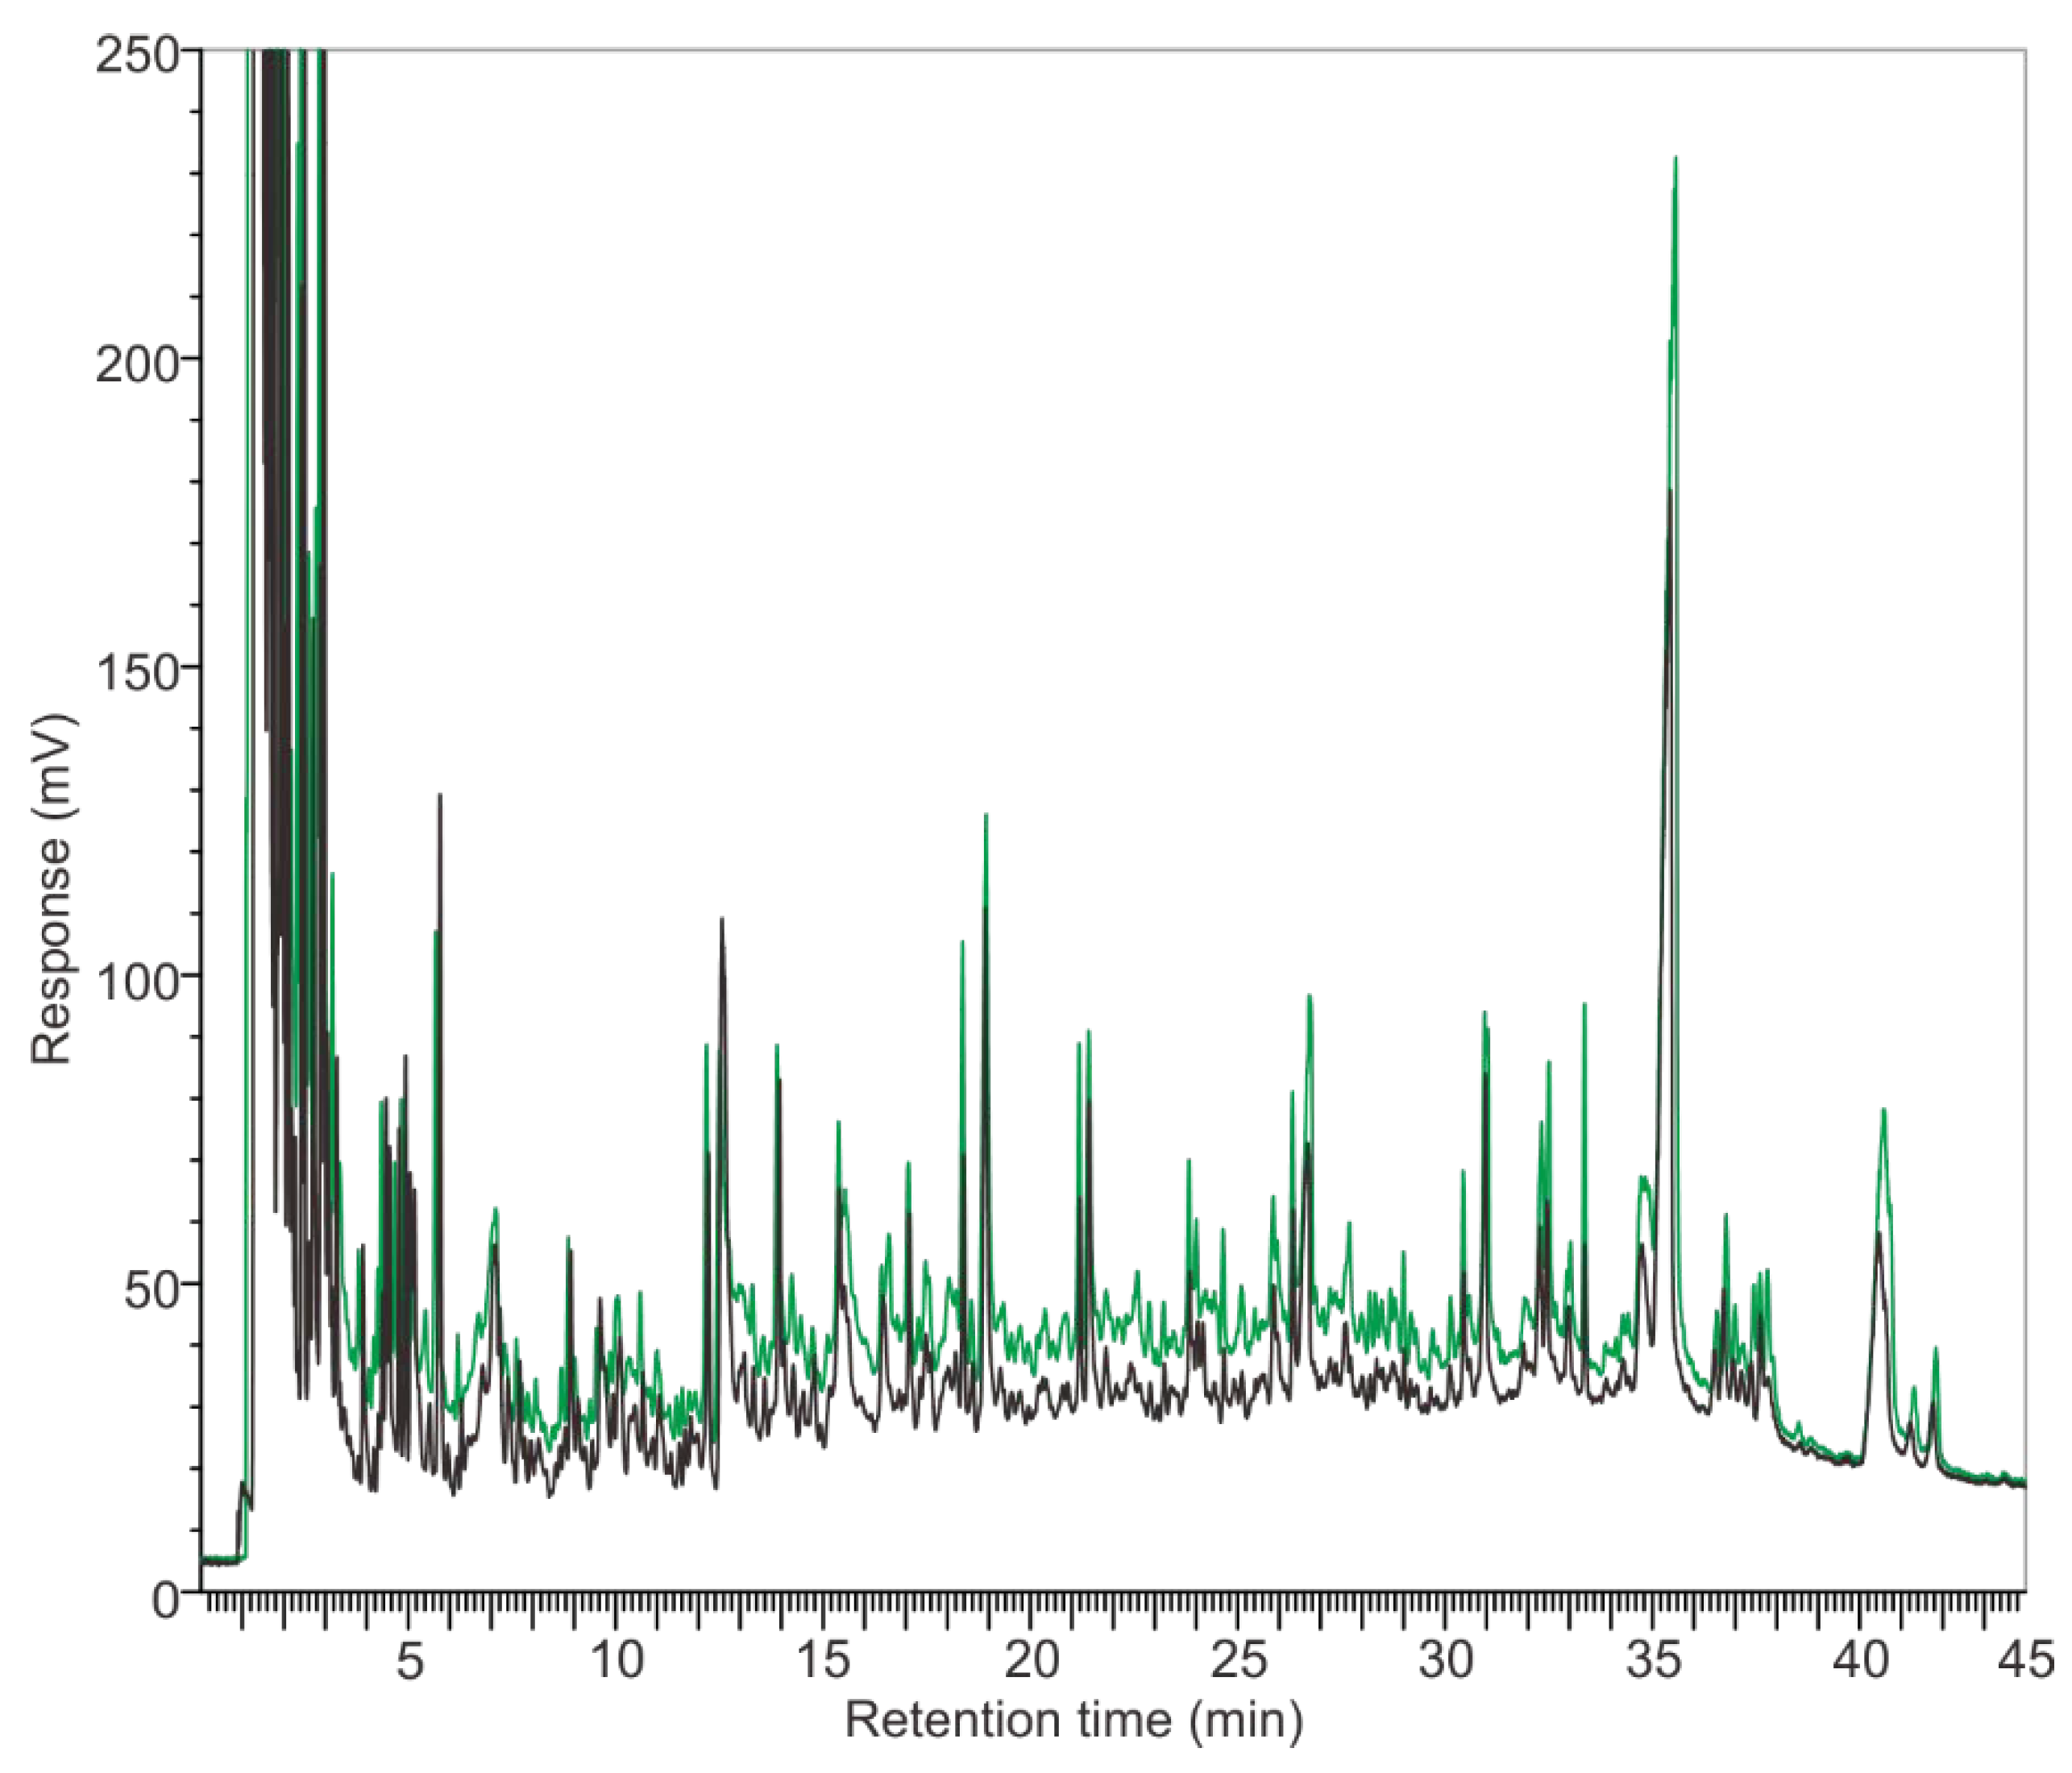
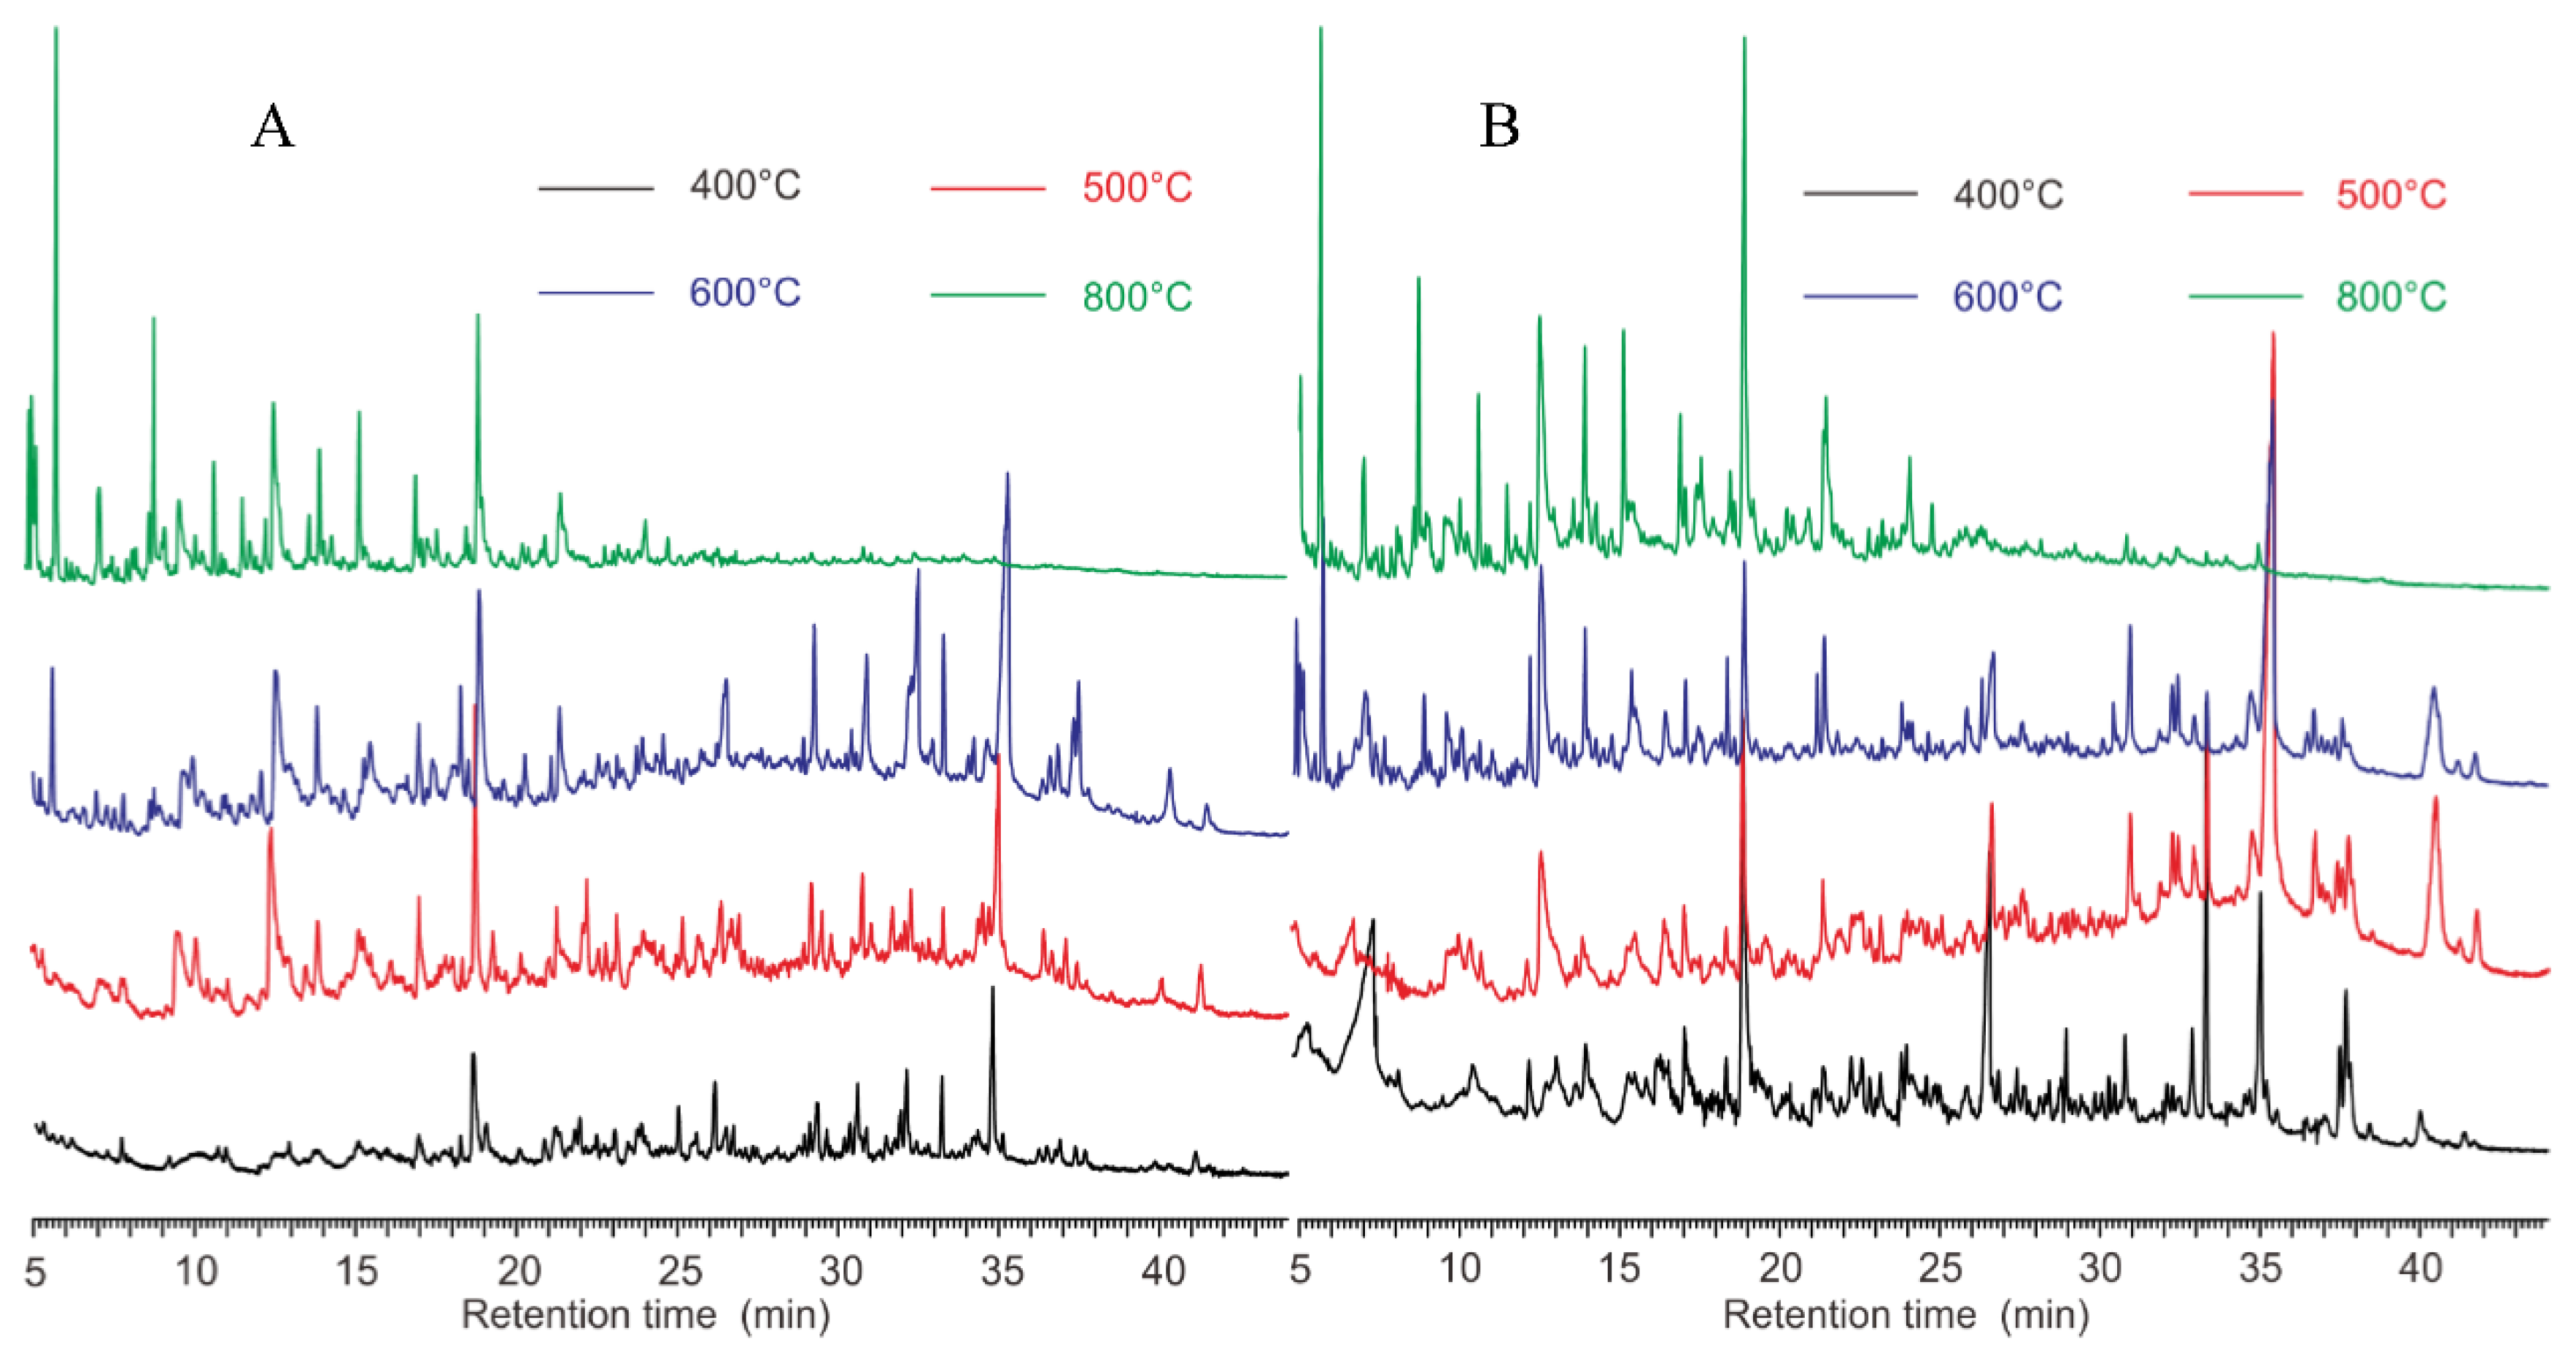
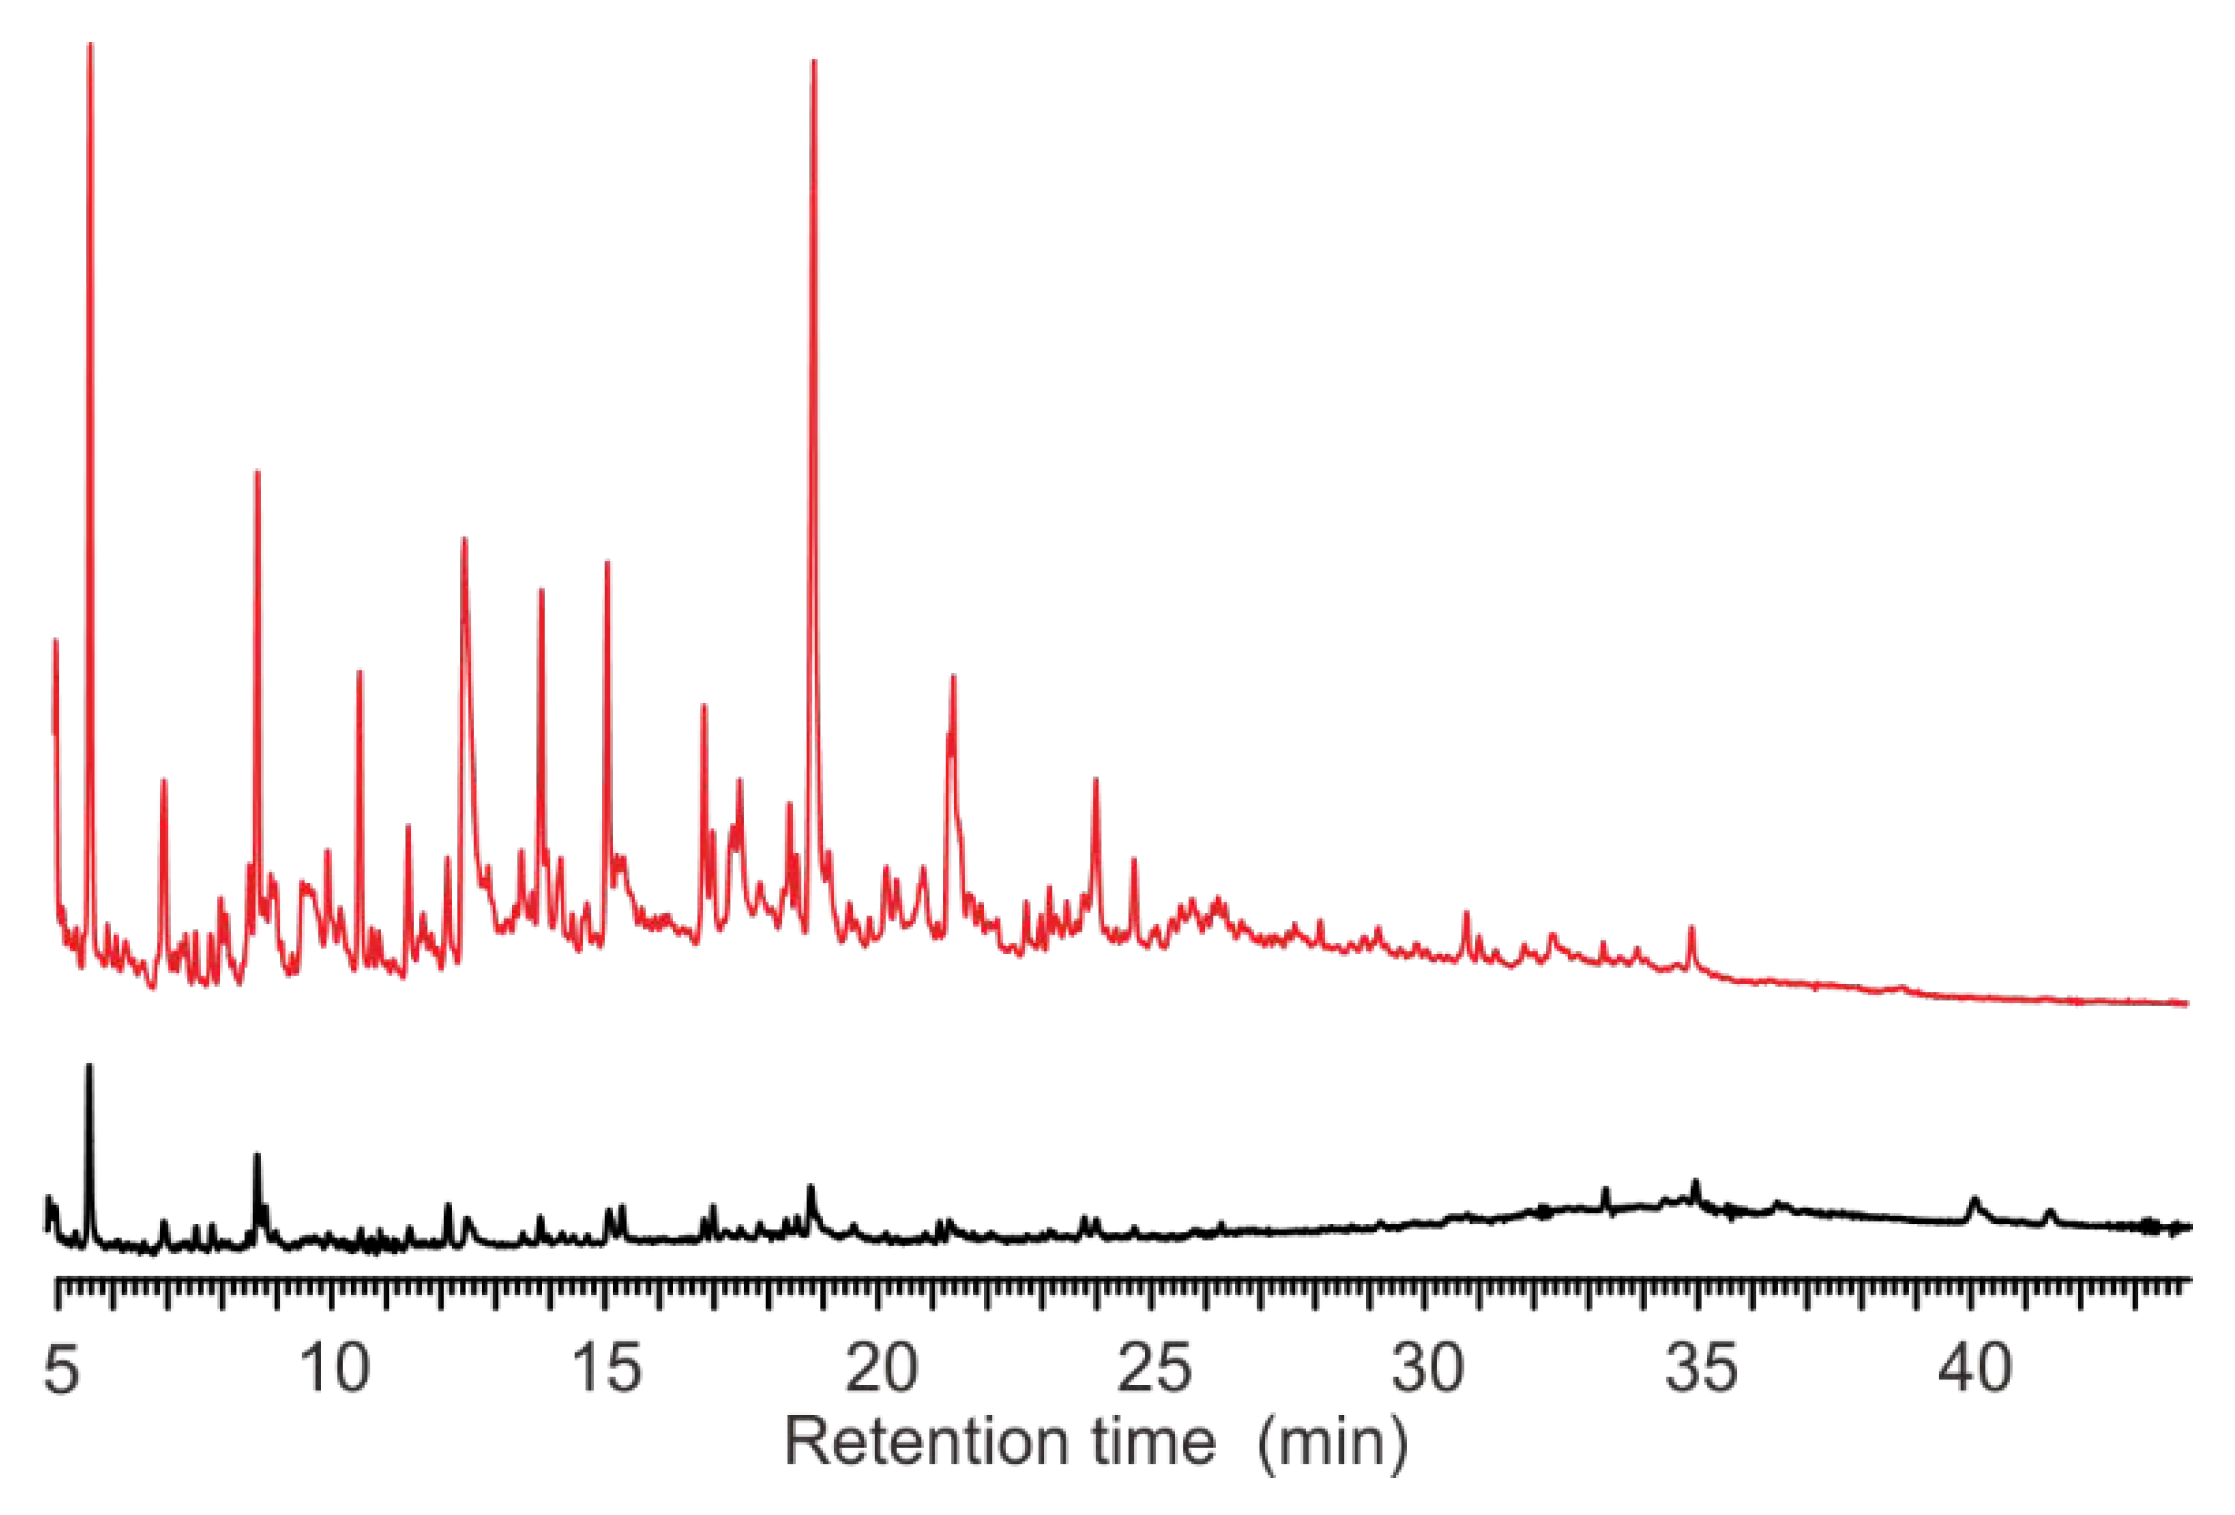
3.2. Pyrograms
4. Discussion
4.1. Pyrograms and TGA at Different Temperatures
4.2. The Disadvantages of ST-PyGC
| No. | Microorganism | Pyrolysis Temperature (°C) | Year | Reference | |||
|---|---|---|---|---|---|---|---|
| Domain | Genera | Species | Strains | ||||
| 1 | Fungi | Aspergilli | 4 a | 12 | 900 | 1970 | [6] |
| 2 | Bacteria | mycobacteria | 9 b | 9 | 850 | 1971 | [3] |
| 3 | Bacteria | Vibrio, Aeromonas | 3 c | 57 | 800 | 1973 | [20] |
| 4 | Bacteria Fungi | Acholeplasma, Citrobacter, Micrococcus Saccharomyces, Rhizopus | 5 d | 5 | 600 | 1974 | [21] |
| 5 | Bacteria | Bacillus | 5 e | 5 | 800 | 1977 | [4] |
| 6 | Bacteria | Salmonella | 10 f | 10 | 900 | 1978 | [22] |
| 7 | Bacteria | Streptococci | 3 g | 35 | 770 | 1978 | [23] |
| 8 | Bacteria | Bacillus | 4 h | 32 | 850 | 1980 | [24] |
| 9 | Bacteria | Bacillus, Staphylococcus, Pseudomonas, Escherichia, Legionella | 10 i | 10 | 1000 | 1992 | [25] |
| 10 | Bacteria | bacillus | 14 j | 14 | 700 | 1999 | [5] |
| 11 | Bacteria | Listeria | 4 k | 4 | 800 | 2004 | [19] |
| 12 | Bacteria | Escherichia, Bacillus, Micrococcus | 3 l | 3 | 650 | 2006 | [7] |
| 13 | Bacteria | Salmonella | 1 m | 1 | 600 | 2007 | [26] |
| 14 | Bacteria | Bacillus | 3 n | 3 | 530 | 2009 | [27] |
| 15 | Bacteria | Salmonella | o | 42 | 600 | 2014 | [28] |
| 16 | Bacteria | Cupidesulfovibrio | 2 p | 2 | 400, 800 | 2021 | [14] |
| 17 | Archaea Bacteria | Metallosphaera, Pyrococcus, Halorubrum Halomonas, Planococcus, Shewanella, Thermodesulfovibrio, Spirulina, Chlorella | 9 q | 9 | 650 | 2022 | [8] |
| 18 | Archaea, Bacteria, Fungi | See Table 1 | 8 | 8 | Multi-temperatures | 2017 | This study |
4.3. Advantages of MT-PyGC
5. Conclusions
Supplementary Materials
Author Contributions
Funding
Data Availability Statement
Acknowledgments
Conflicts of Interest
References
- Reiner, E. Identification of bacterial strains by pyrolysis-gas-liquid chromatography. Nature 1965, 206, 1272–1274. [Google Scholar] [CrossRef] [PubMed]
- Reiner, E.; Ewing, W.H. Chemotaxonomic Studies of some Gram Negative Bacteria by means of Pyrolysis-Gas-Liquid Chromatography. Nature 1968, 217, 191–194. [Google Scholar] [CrossRef]
- Reiner, E.; Hicks, J.J.; Beam, R.E.; David, H.L. Recent studies on mycobacterial differentiation by means of pyrolysis-gas-liquid chromatography. Am. Rev. Respir. Dis. 1971, 104, 656–660. [Google Scholar] [CrossRef] [PubMed]
- Oxborrow, G.S.; Fields, N.D.; Puleo, J.R. Pyrolysis gas-liquid chromatography of the genus Bacillus: Effect of growth media on pyrochromatogram reproducibility. Appl. Environ. Microbiol. 1977, 33, 865–870. [Google Scholar] [CrossRef] [PubMed] [Green Version]
- Guo, A.; Fang, C.; Zhang, L.; Lu, Y.; Tao, T.; Kuang, Y. Cluster Analysis Based on Pyrolysis Gas Chromatography of Whole Cell of Bacillus. J. Instrum. Anal. 1999, 18, 30–33. (In Chinese) [Google Scholar]
- Vincent, P.G.; Kulik, M.M. Pyrolysis-gas-liquid chromatography of fungi: Differentiation of species and strains of several members of the Aspergillus flavus group. Appl. Microbiol. 1970, 20, 957–963. [Google Scholar] [CrossRef]
- Schmidt, H.; Tadjimukhamedov, F.K.; Douglas, K.M.; Prasad, S.; Smith, G.B.; Eiceman, G. Quantitative assessment and optimization of parameters for pyrolysis of bacteria with gas chromatographic analysis. J. Anal. Appl. Pyrolysis 2006, 76, 161–168. [Google Scholar] [CrossRef]
- Salter, T.; Magee, B.; Waite, J.; Sephton, M. Mass Spectrometric Fingerprints of Bacteria and Archaea for Life Detection on Icy Moons. Astrobiology 2022, 22, 143–157. [Google Scholar] [CrossRef] [PubMed]
- Wan, Y.Y. Dictionary for Resources and Taxonomy of Prokaryotes; Petroleum Industry Press: Beijing, China, 2017. (In Chinese) [Google Scholar]
- Mu, H.M.; Wan, Y.Y.; Wu, B.C.; Tian, Y.; Dong, H.L.; Xian, C.G.; Li, Y. A rapid change in microbial communities of the shale gas drilling fluid from 3548 m depth to the above-ground storage tank. Sci. Total Environ. 2021, 784, 147009. [Google Scholar] [CrossRef]
- Tian, Y.; Wan, Y.; Mu, H.; Dong, H.; Briggs, B.R.; Zhang, Z.-H. Microbial Diversity in High-Temperature Heavy Oil Reservoirs. Geomicrobiol. J. 2020, 37, 59–66. [Google Scholar] [CrossRef]
- Wan, Y.Y.; Du, W.D. New Approaches and Technologies for Prevention and Control of Petroleum-Contaminated Soils and Sediments; Petroleum Industry Press: Beijing, China, 2017. (In Chinese) [Google Scholar]
- Wan, Y.Y.; Dong, H. Environmental Geomicrobiology Experiments; Petroleum Industry Press: Beijing, China, 2014. (In Chinese) [Google Scholar]
- Wan, Y.Y.; Luo, N.; Liu, X.; Lai, Q.; Goodfellow, M. Cupidesulfovibrio liaohensis gen. nov., sp. nov., a novel sulphate- reducing bacterium isolated from an oil reservoir and reclassification of Desulfovibrio oxamicus and Desulfovibrio termitidis as Cupidesulfovibrio oxamicus comb. nov. and Cupidesulfovibrio termitidis comb. nov. Int. J. Syst. Evol. Microbiol. 2021, 71, 4618. [Google Scholar] [CrossRef]
- Akinyemi, T.; Shao, N.; Whitman, W. Methanothrix/Patel G. Bergey’s Manual of Systematics of Archaea and Bacteria; John Wiley & Sons, Inc.: New York, NY, USA, 2020; pp. 1–12. [Google Scholar]
- Wan, Y.Y.; Tian, Y.; Zhang, Z.; Zhang, Y.; Xia, Y. A Device and Method for Biomass Pyrolysis and Productive Trace Sulfides Collection. Patent 201520449676.9, 23 September 2015. (In Chinese). [Google Scholar]
- Wan, Y.Y.; Zhu, Y.; Jiang, L. A Device and Method for Identification Microorganisms between Genus or Species. Patent 201710006035.X, 12 February 2019. (In Chinese). [Google Scholar]
- Ghosh, A.; Goyal, A.; Jain, R.K. Study of methanol-induced phenotypic changes in a novel strain of Acinetobacter lwoffii. Arch. Microbiol. 2007, 188, 533–539. [Google Scholar] [CrossRef]
- Donohue, J.P.; Welsh, W.J. Speciation of Listeria via pyrolysis/gas chromatography. J. Anal. Appl. Pyrolysis 2004, 72, 221–228. [Google Scholar] [CrossRef]
- Haddadin, J.M.; Stirland, R.M.; Preston, N.W.; Collard, P. Identification of Vibrio cholerae by pyrolysis gas-liquid chromatography. Appl. Microbiol. 1973, 25, 40–43. [Google Scholar] [CrossRef] [PubMed]
- Quinn, P.A. Development of high resolution pyrolysis-gas chromatography for the identification of microorganisms. J. Chromatogr. Sci. 1974, 12, 796–806. [Google Scholar] [CrossRef] [PubMed]
- Emswiler, B.S.; Kotula, A.W. Differentiation of Salmonella Serotypes by pyrolysis-gas-liquid chromatography of cell fragments. Appl. Environ. Microbiol. 1978, 35, 97–104. [Google Scholar] [CrossRef] [PubMed] [Green Version]
- Stack, M.V.; Donoghue, H.D.; Tyler, J.E. Discrimination between oral streptococci by pyrolysis gas-liquid chromatography. Appl. Environ. Microbiol. 1978, 35, 45–50. [Google Scholar] [CrossRef] [PubMed] [Green Version]
- O’donnell, A.G.; Norris, J.R.; Berkeley RC, W.; Claus, D.; Kaneko, T.; Logan, N.A.; Nozaki, R. Characterization of Bacillus subtilis, Bacillus pumilus, Bacillus licheniformis, and Bacillus amyloliquefaciens by Pyrolysis Gas-Liquid Chromatography, Deoxyribonucleic Acid-Deoxyribonucleic Acid Hybridization, Biochemical Tests, and API Systems. Int. J. Syst. Evol. Microbiol. 1980, 30, 448–459. [Google Scholar] [CrossRef] [Green Version]
- Smith, P.B.; Snyder, A.P. Characterization of bacteria by quartz tube pyrolysis-gas chromatography/ion trap mass spectrometry. J. Anal. Appl. Pyrolysis 1992, 24, 23–38. [Google Scholar] [CrossRef]
- Guo, A.; Zheng, H.; Ma, A.; Yu, G. Studies on the Whole Cell of Salmonella by Pyrolysis-Gas Chromatography-Mass Spectrometry. Chin. J. Anal. Chem. (Fen Xi Hua Xue) 2007, 35, 700–702. (In Chinese) [Google Scholar]
- Cheung, W.; Xu, Y.; Thomas, C.L.; Goodacre, R. Discrimination of bacteria using pyrolysis-gas chromatography-differential mobility spectrometry (Py-GC-DMS) and chemometrics. Analyst 2009, 134, 557–563. [Google Scholar] [CrossRef] [PubMed]
- Zhang, P.; Xing, X.; Wang, X.; Yang, B.; Fu, C.; Liu, D.; Guo, C. Comparison of fatty acid analysis with serotype and pulsed-field gel electrophoresis for typing salmonella isolated from retail foods and human. J. Food Saf. 2014, 34, 388–395. [Google Scholar] [CrossRef]


Publisher’s Note: MDPI stays neutral with regard to jurisdictional claims in published maps and institutional affiliations. |
© 2022 by the authors. Licensee MDPI, Basel, Switzerland. This article is an open access article distributed under the terms and conditions of the Creative Commons Attribution (CC BY) license (https://creativecommons.org/licenses/by/4.0/).
Share and Cite
Wan, Y.Y.; Zhu, Y.J.; Jiang, L.; Luo, N. Multi-Temperatures Pyrolysis Gas Chromatography: A Rapid Method to Differentiate Microorganisms. Microorganisms 2022, 10, 2333. https://doi.org/10.3390/microorganisms10122333
Wan YY, Zhu YJ, Jiang L, Luo N. Multi-Temperatures Pyrolysis Gas Chromatography: A Rapid Method to Differentiate Microorganisms. Microorganisms. 2022; 10(12):2333. https://doi.org/10.3390/microorganisms10122333
Chicago/Turabian StyleWan, Yun Yang, Ying Jia Zhu, Liang Jiang, and Na Luo. 2022. "Multi-Temperatures Pyrolysis Gas Chromatography: A Rapid Method to Differentiate Microorganisms" Microorganisms 10, no. 12: 2333. https://doi.org/10.3390/microorganisms10122333