Article

Seasonal Patterns of Zoonotic Cutaneous Leishmaniasis Caused by L. major and Transmitted by Phlebotomus papatasi in the North Africa Region, a Systematic Review and a Meta-Analysis

1
Bioactives, Health and Environmental, Epigenetics Team, Faculty of Sciences and Techniques, Errachidia (UMI) and Moroccan Center for Culture and Sciences, Moulay Ismail University, Meknes 50050, Morocco
2
InterTryp, IRD-CIRAD, Parasitology Infectiology and Public Health Research Group, University Montpellier, 34000 Montpellier, France
3
Cluster of Competency on Health and Environment, Moulay Ismail University, Meknes 50050, Morocco
4
Bioactives, Health and Environmental Laboratory, Epigenetics Team, Moulay Ismail University, Meknes 50050, Morocco
*
Authors to whom correspondence should be addressed.
Microorganisms 2022, 10(12), 2391; https://doi.org/10.3390/microorganisms10122391
Submission received: 19 November 2022 / Accepted: 29 November 2022 / Published: 2 December 2022
(This article belongs to the Special Issue Epidemiology of Vector Born Diseases 2.0)

Abstract

:
Background: In North African countries, zoonotic cutaneous leishmaniasis (ZCL) is a seasonal disease linked to Phlebotomus papatasi, Scopoli, 1786, the primary proven vector of L. major dynamics. Even if the disease is of public health importance, studies of P. papatasi seasonal dynamics are often local and dispersed in space and time. Therefore, a detailed picture of the biology and behavior of the vector linked with climatic factors and the framework of ZCL outbreaks is still lacking at the North African countries’ level. Our study aims to fill this gap via a systematic review and meta-analysis of the seasonal incidence of ZCL and the activity of P. papatasi in North African countries. We address the relationship between the seasonal number of declared ZCL cases, the seasonal dynamic of P. papatasi, and climatic variables at the North African region scale. Methods: We selected 585 publications, dissertations, and archives data published from 1990 to July 2022. The monthly incidence data of ZCL were extracted from 15 documents and those on the seasonal dynamic of P. papatasi from 11 publications from four North African countries. Results: Our analysis disclosed that for most studied sites, the highest ZCL incidence is recorded from October to February (the hibernal season of the vector), while the P. papatasi density peaks primarily during the hot season of June to September. Overall, at the North African region scale, two to four months laps are present before the apparition of the scars reminiscent of infection by L. major. Conclusions: Such analysis is of interest to regional decision-makers for planning control of ZCL in North African countries. They can also be a rationale on which future field studies combining ZCL disease incidence, vector activity, and climatic data can be built.

1. Introduction

Cutaneous leishmaniasis (CL), a skin infection provoking ulcers on exposed body parts, affects annually between 600,000 to 1 million new cases on a global scale [1]. In North African countries, Morocco, Algeria, Tunisia, and Libya, the disease is caused by L. major, L. tropica, and L. infantum, which belong to the Leishmania genus [2]. Cutaneous leishmaniasis caused by L. major remains the most frequent in North Africa and Middle East countries. Still, they present a high incidence rate in other territories, such as Afghanistan [3], Iran [4], and Saudi Arabia [5]. One or more lesions appear after the bite by an infected sand fly, and the inflammation causes scarring if not treated, which leads to traumatic psychological impacts. Shaw’s jird (Meriones shawi) and the fat sand rat (Psammomys obesus) are the identified reservoirs, while P. papatasi is the proven vector of L. major [6,7]. This disease affects regions with semi-arid and arid climates in North African countries, especially in the poorest provinces. It is estimated that 97.8% of cases concentrate in areas with poor socio-economic conditions, below 725 m, and arid semi-arid climates [8]. The infection affects, more commonly, younger humans and males. Most ZC cases are aged < 10 years, males, with ulcers primarily present on the face and hands [4]. ZCL is endemic in rural areas, with lesions and scars appearing between August and January [9] in arid regions [10]. Socioeconomic conditions [11], anthropogenic disturbance in the peri-urban area [12], and topography [13] are also associated with the disease incidence. Vegetation, wind speed, and altitude are significant factors in forecasting ZCL cases [14].
In North African countries, zoonotic cutaneous leishmaniasis caused by L. major remains among the most widespread neglected tropical diseases impacting public health. The geographical dispersion of the disease is primarily affected by ecological and socioeconomic drivers that favor vector proliferation and host-reservoir sheltering conditions. In addition, seasonal climatic conditions influence ZCL incidence and dispersion [15] via the ecological conditions required for the vector and reservoirs. These factors were addressed in Morocco, Algeria [10], and Tunisia [16]. The world health organization (http://www.emro.who.int/neglected-tropical-diseases/information-resources-leishmaniasis/cl-factsheet.html; accessed on 14 July 2022) reported the incubation period of L. major needs at least one week and usually less than four months, while L. tropica requires at least one week and usually 2–8 months [17].
Most published research papers focus on localized geographical areas in a restricted time range. Here, we collected data on the proven vector of ZCL, P. papatasi, whose seasonal activity causes seasonal outbreaks at the North African region scale. To our knowledge, no studies dealing with these aspects were undertaken on such a broad geographic scale. We further analyzed the interplay between seasonal ZCL cases number, P. papatasi density, and climatic data.

2. Materials and Methods

2.1. Systematic Review, Data Set Collection, and Localization of Sites

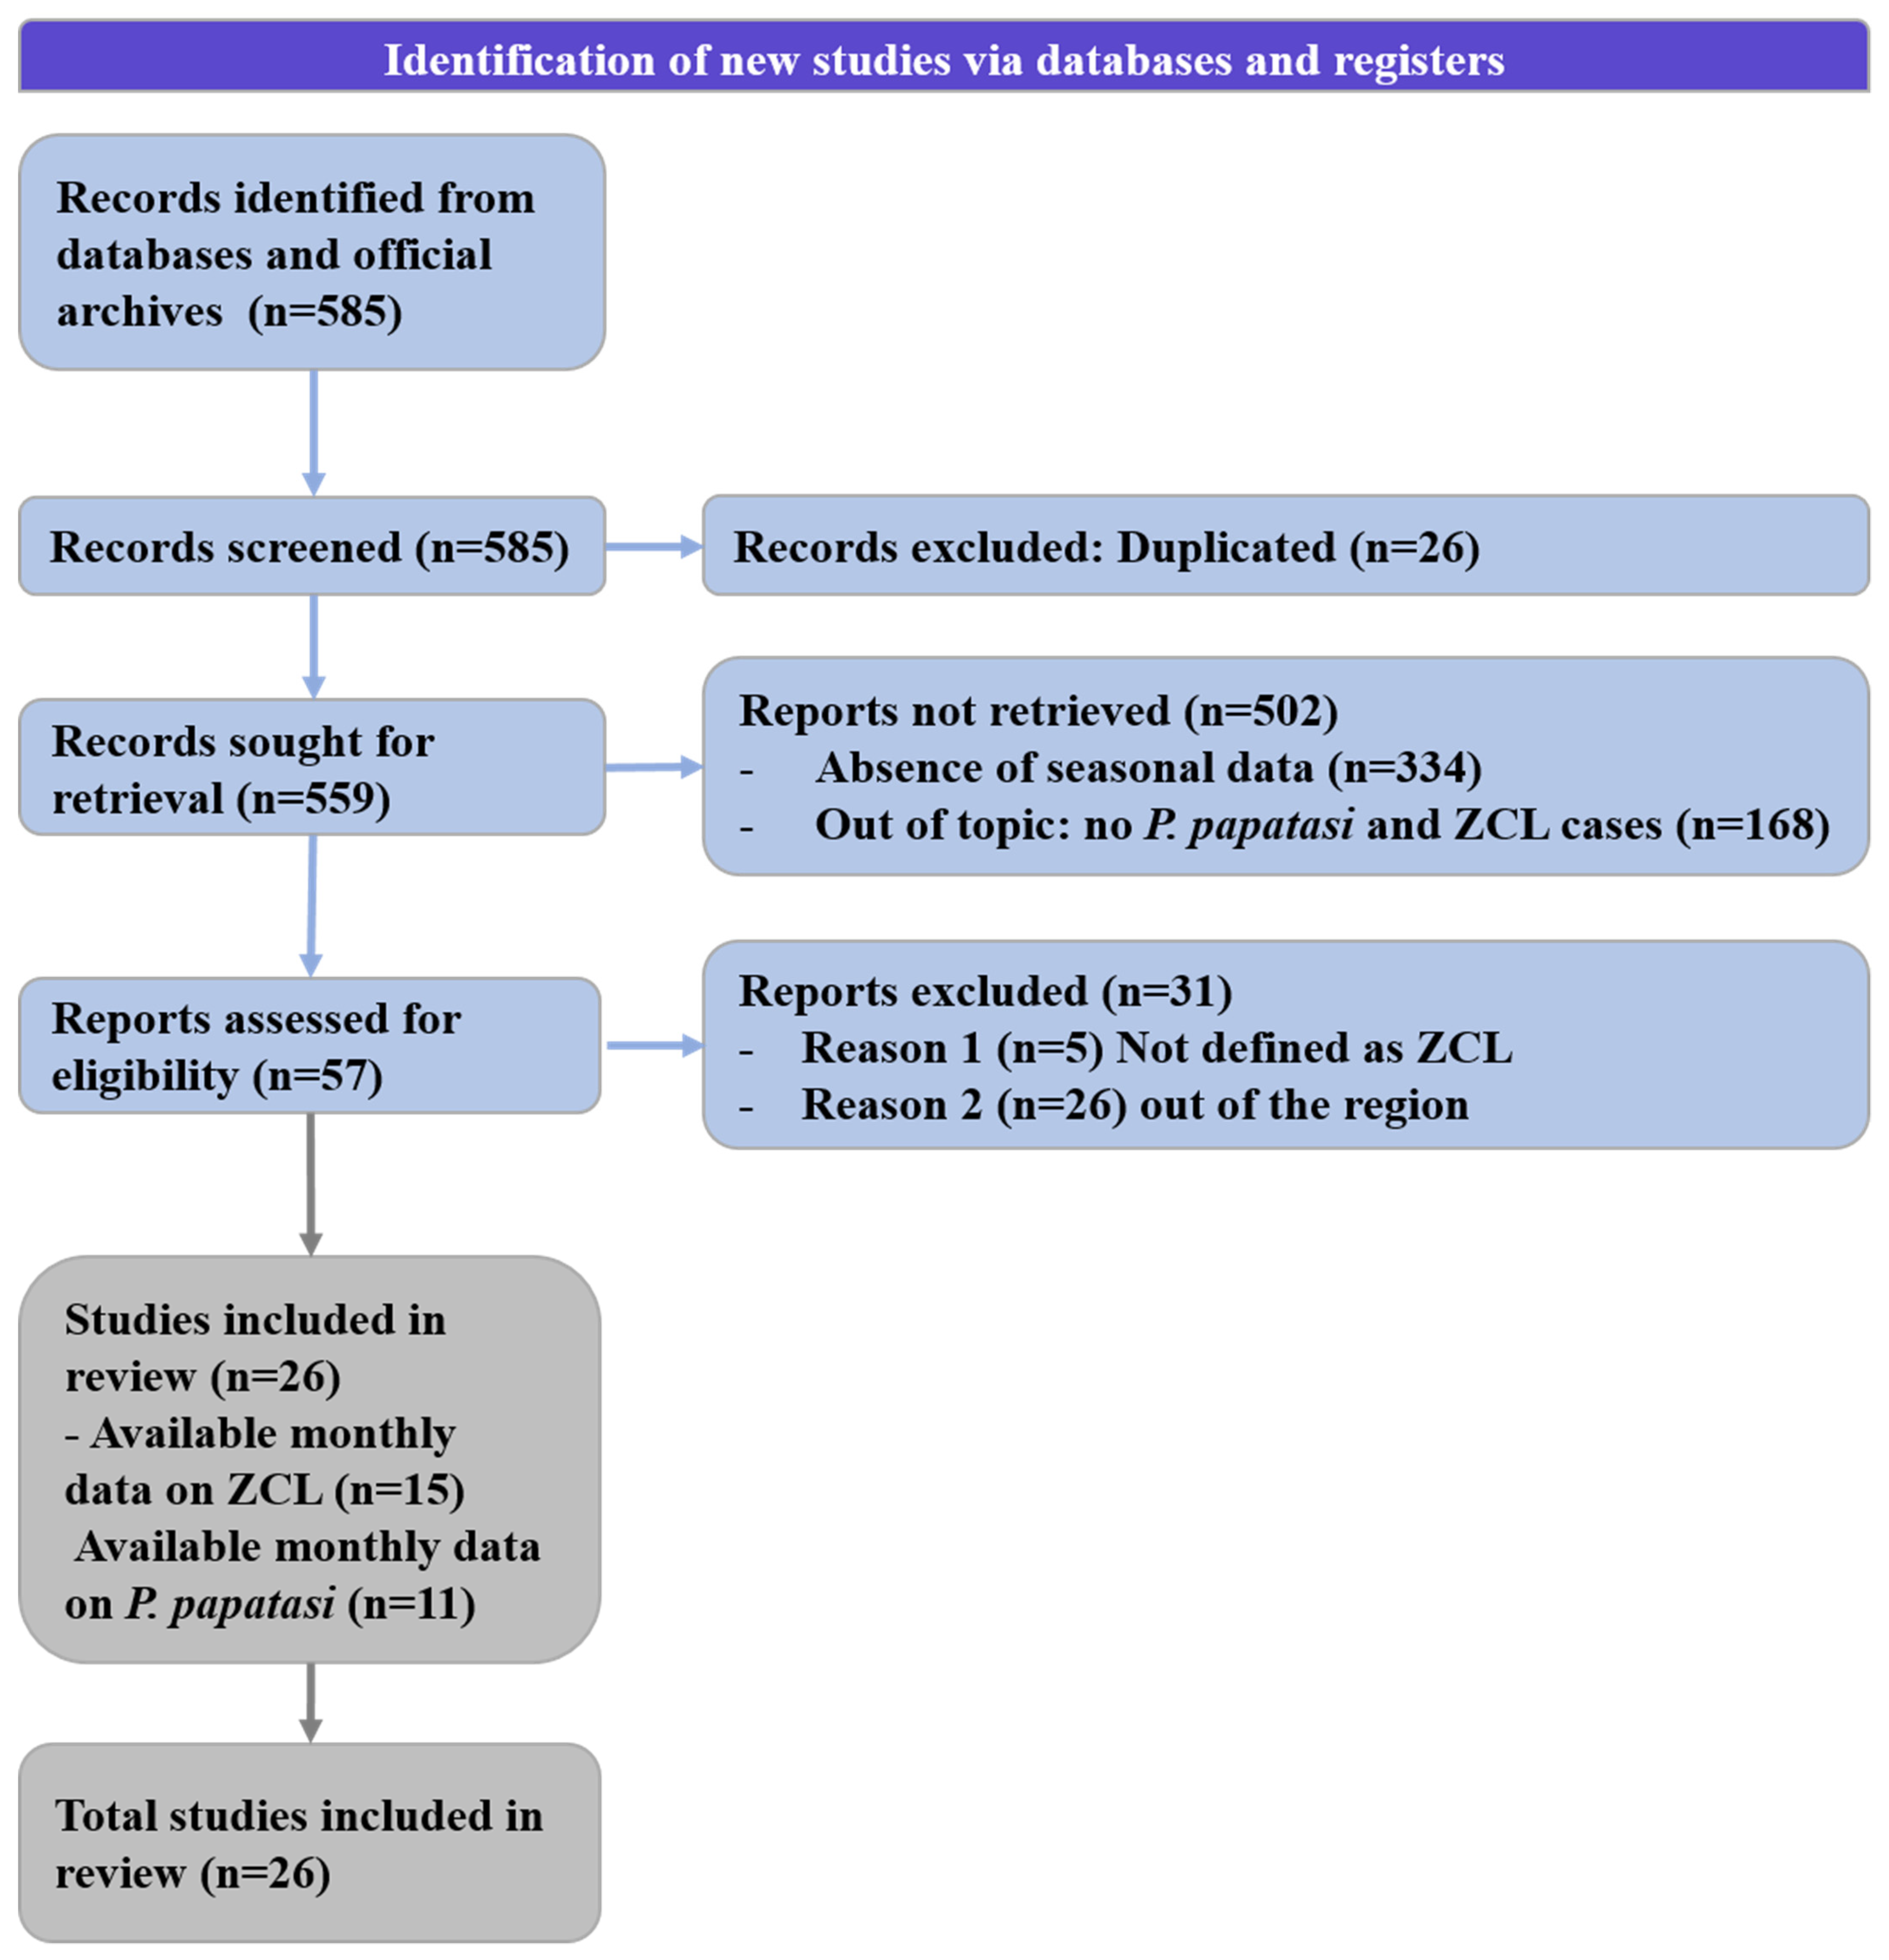
2.1.1. Systematic Review

The current study was based on a systematic review following the guidelines of the PRISMA initiative (2020) [18] (Figure 1) and meta-analyses [19].
Monthly data on ZCL case number (Table 1) and P. papatasi density (Table 2) were extracted from selected publications. The keywords used in this study are “leishmaniasis”, “ZCL seasonal transmission”, “cutaneous leishmaniasis”, “L. major”, “sand fly”, “vectors of Leishmaniasis”, ”P. papatasi” combined with “North Africa”, and the countries of the area, including from north to east “Morocco”, ”Algeria”, “Tunisia”, and “Libya”. The searches were performed on 11–14 July 2022 using PubMed, Web of Science, Scopus, and Google Scholar. Only studies with available monthly data were included from an initial panel of 585 scientific publications published between 1990 and July 2022. From this panel, 15 documents gathered data on the monthly incidence of ZCL, while only 11 presented data on the seasonal dynamic of P. papatasi in African countries. The annual distribution of ZCL cases in the considered area was compiled from 1995 to 2020 (the available data).

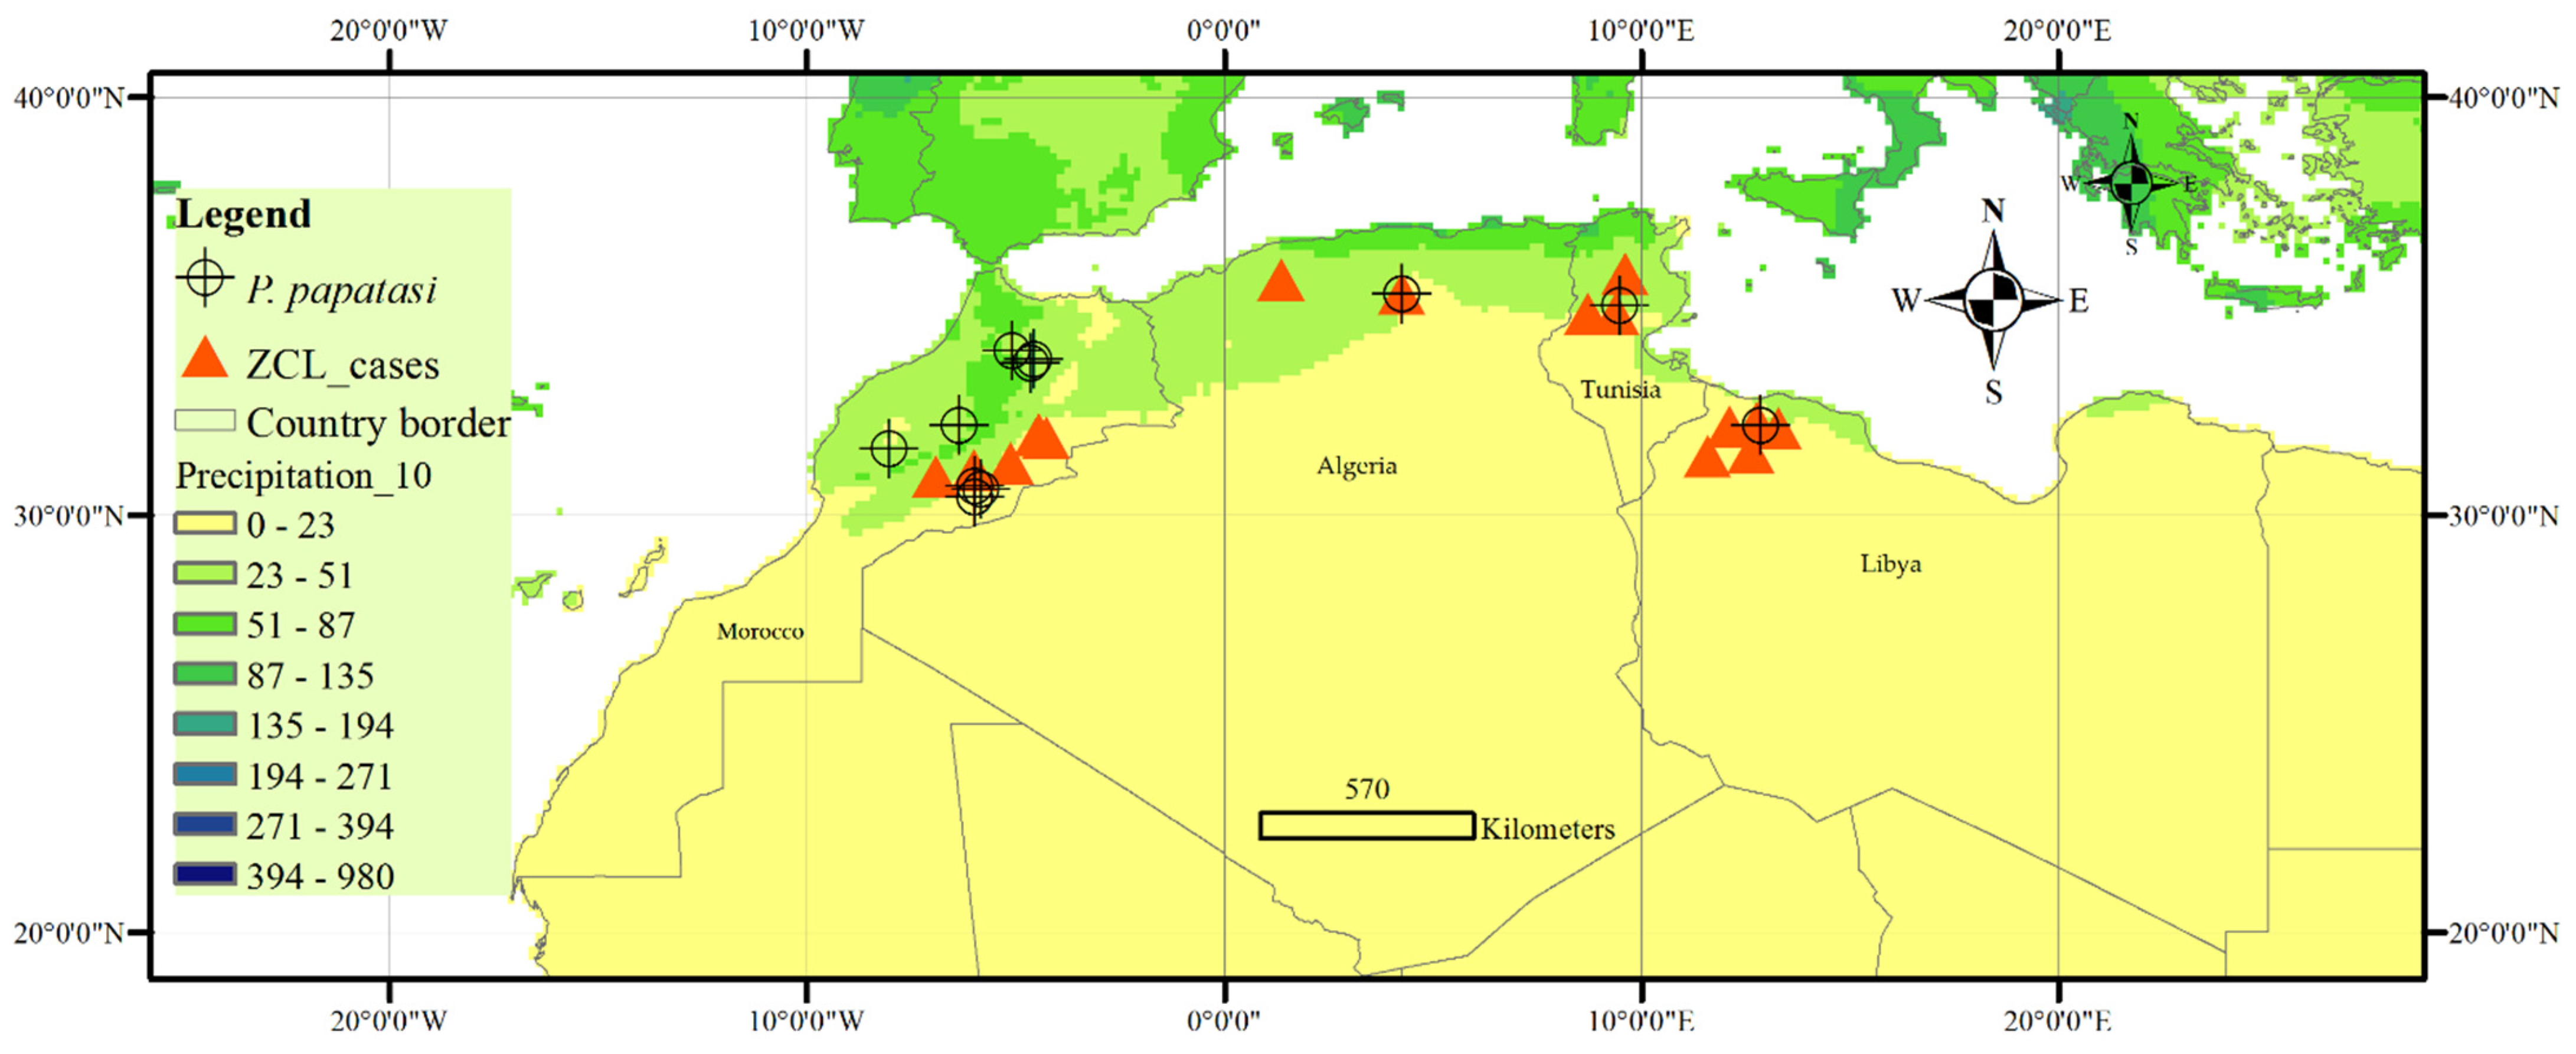
2.1.2. Data Set Collection and Sites Localization

Quantitative and qualitative information from the selected publications were extracted and presented in two tables; a map of the extracted data is shown in Figure 2.
The geographic information, including altitude, latitude, and longitude, was extracted from the literature (Table 1 and Table 2, and Figure 1), and climatic variables (monthly maximum temperature, minimum temperature, precipitation, and relative humidity) in the relevant areas were collected from the Tutiempo Network, S.L.
Data were processed using the Arc-GIS software (Figure 2, Table 1 and Table 2) and combined with the regional annual precipitation (Figure 2). Most sites with available published data are localized in semi-arid to arid areas where the rainfall is low and irregular in time and space, and the temperature ranges from moderate to high.

2.2. Normalization of ZCL Case Number and/Vector Density (Nj)

Data on monthly ZCL cases number and P. papatasi density were extracted from tables or digitized using ‘digitizelt’ software and represented by country. However, the original values of these different sources are heterogeneous, which requires the normalization of data to be comparable. Therefore, equation 1 was used to calculate the normalized incidence value of ZCL standardizing extracted values for monthly ZCL cases and P. papatasi activity on a scale ranging from 0 to 1, where 0 refers to the absence of data or no recorded activity, and 1 indicates the highest activity. For example, the normalized values of a month’s incidence and vector activity are a ratio between the extracted values for that month and the month with the maximal value.
Nj = [ZCL cases or vector activity in a month]/[Month with maximal ZCL cases or vector activity]

2.3. Statistical Analysis

The Pearson correlation coefficient and R2, the coefficient of determination, were analyzed with the social science statistics calculator, R.

3. Results and Discussion

3.1. Annual Distribution of ZCL Cases in the North African Region

We compiled annual data on published ZCL case numbers in North African countries for 26 years (from 1995 to 2020) (Figure 3). In addition, data from four oasis sites (Ouarzazate, Zagora, Errachidia, and Figuig) were considered for Morocco. As a result, three principal peaks were recorded in 2003, 2010, and 2017. In Algeria, data from two sites point to two prominent peaks in 1997 and 2003, while data from Tunisian sites depict three primary peaks in 1999, 2004, and 2013. Finally, data published from Libya shows two major peaks in 2004 and 2008 (Figure 3).
An overall decreasing trend in ZCL incidence was observed during the period studied and in the sites we reviewed (Supplementary Figure S1). However, if the average ZCL case number followed a decreasing trend in Algeria and Tunisia, the opposite is reported in Morocco and Libya; overall, the decreasing trend was recorded in North Africa, which can be related to interventions aimed at combating the disease.

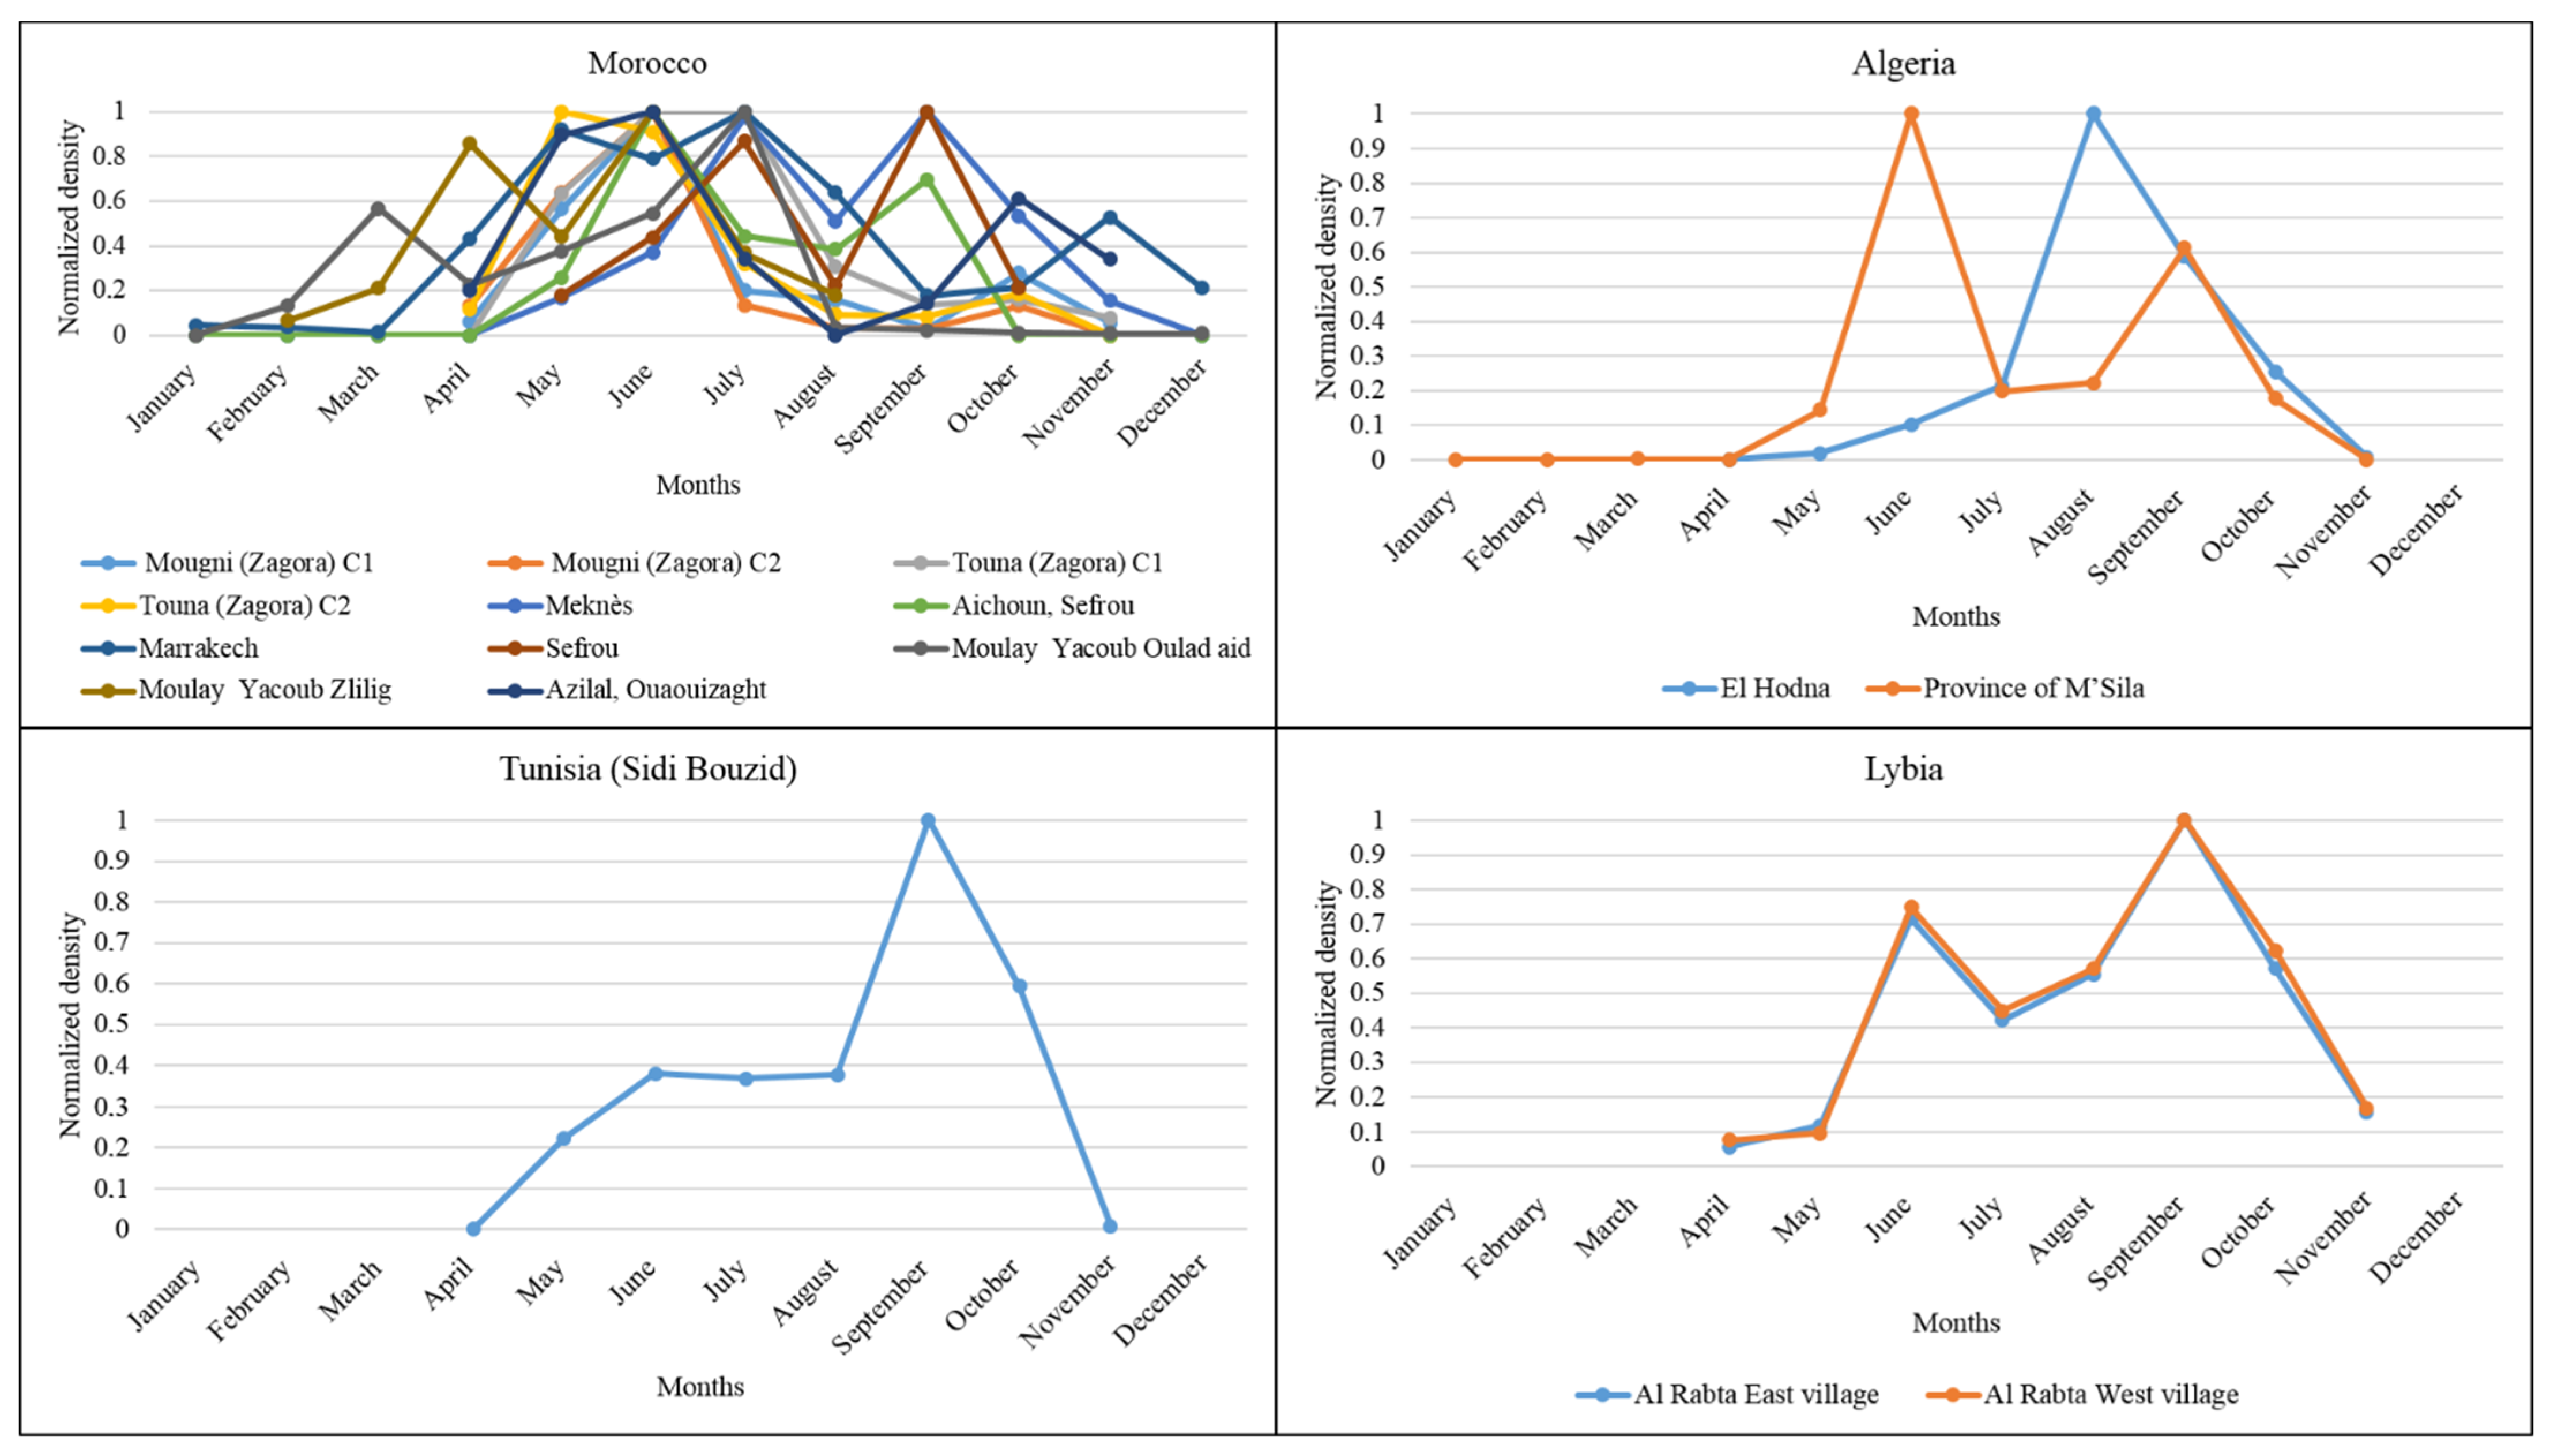
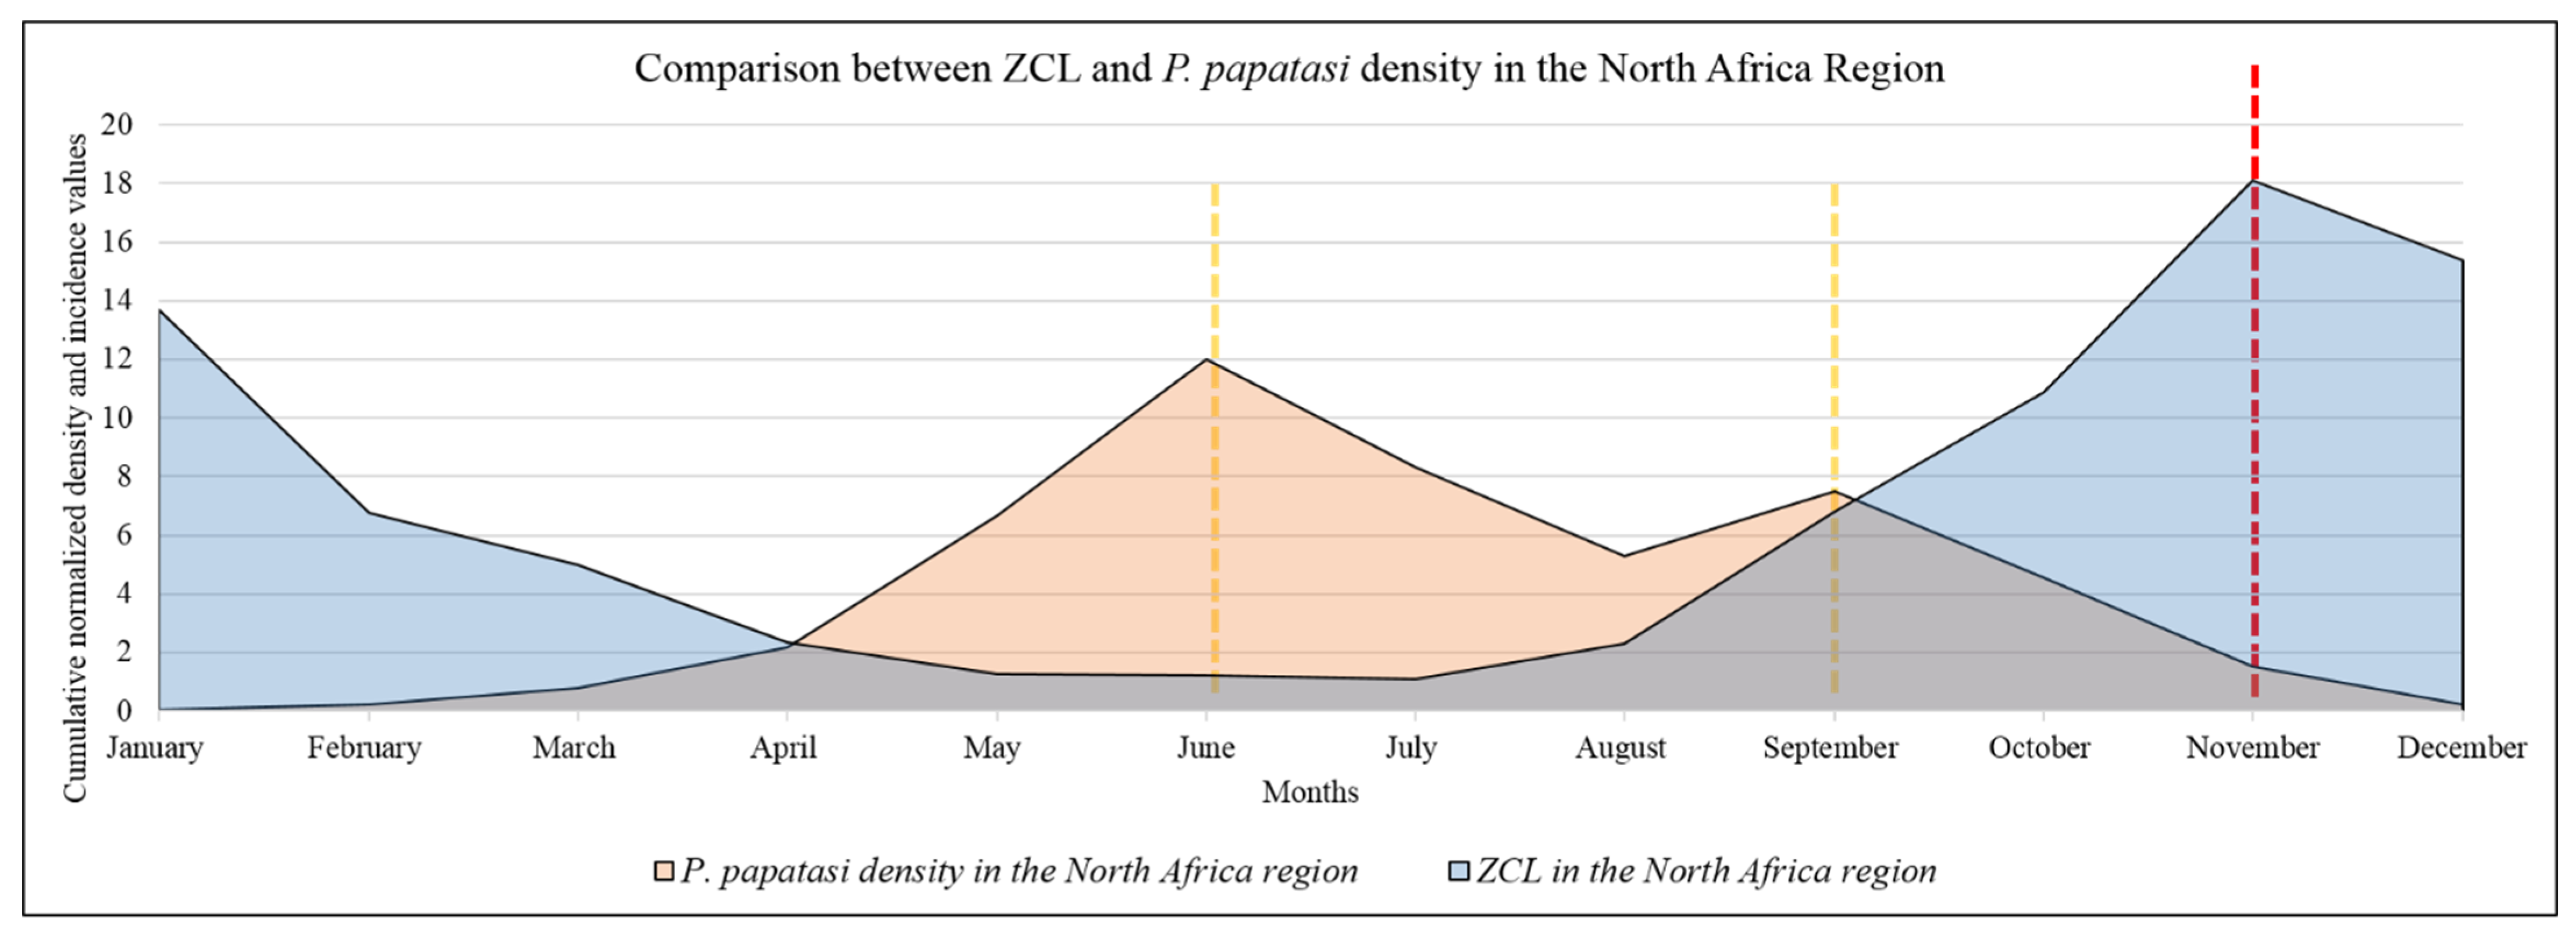
3.2. Monthly Distribution of P. papatasi in the North African Region

Data collected on the seasonal P. papatasi dynamic depicted bi- to tri-modal activity from March to November (Figure 4). They point to a higher P. papatasi density during the hot period in the Moroccan sites. In the Algerian sites studied, El Honda recorded a monomodal activity, with the maximum activity in August. In M’Sila, a bi-modal distribution with a maximal peak in June is recorded. Sidi Bouzid, Tunisia, displays seasonal activity with a density peak in September. The two sites studied in Libya display a bi-modal distribution with maximal density in June and September. These results show P. papatasi density peaks primarily during the hot season in the North African region.
Our analysis at the North African geographic scale depicts a seasonal activity of P. papatasi with maximal densities during the hot season. In North African countries, high densities are recorded in October and November in Marrakech, Morocco [34], and in August and September in Tunisia and Algeria [27,28]. While in Egypt, density peaks are recorded in July [42], while in Saudi Arabia and Iran, they occur in May and August [43].

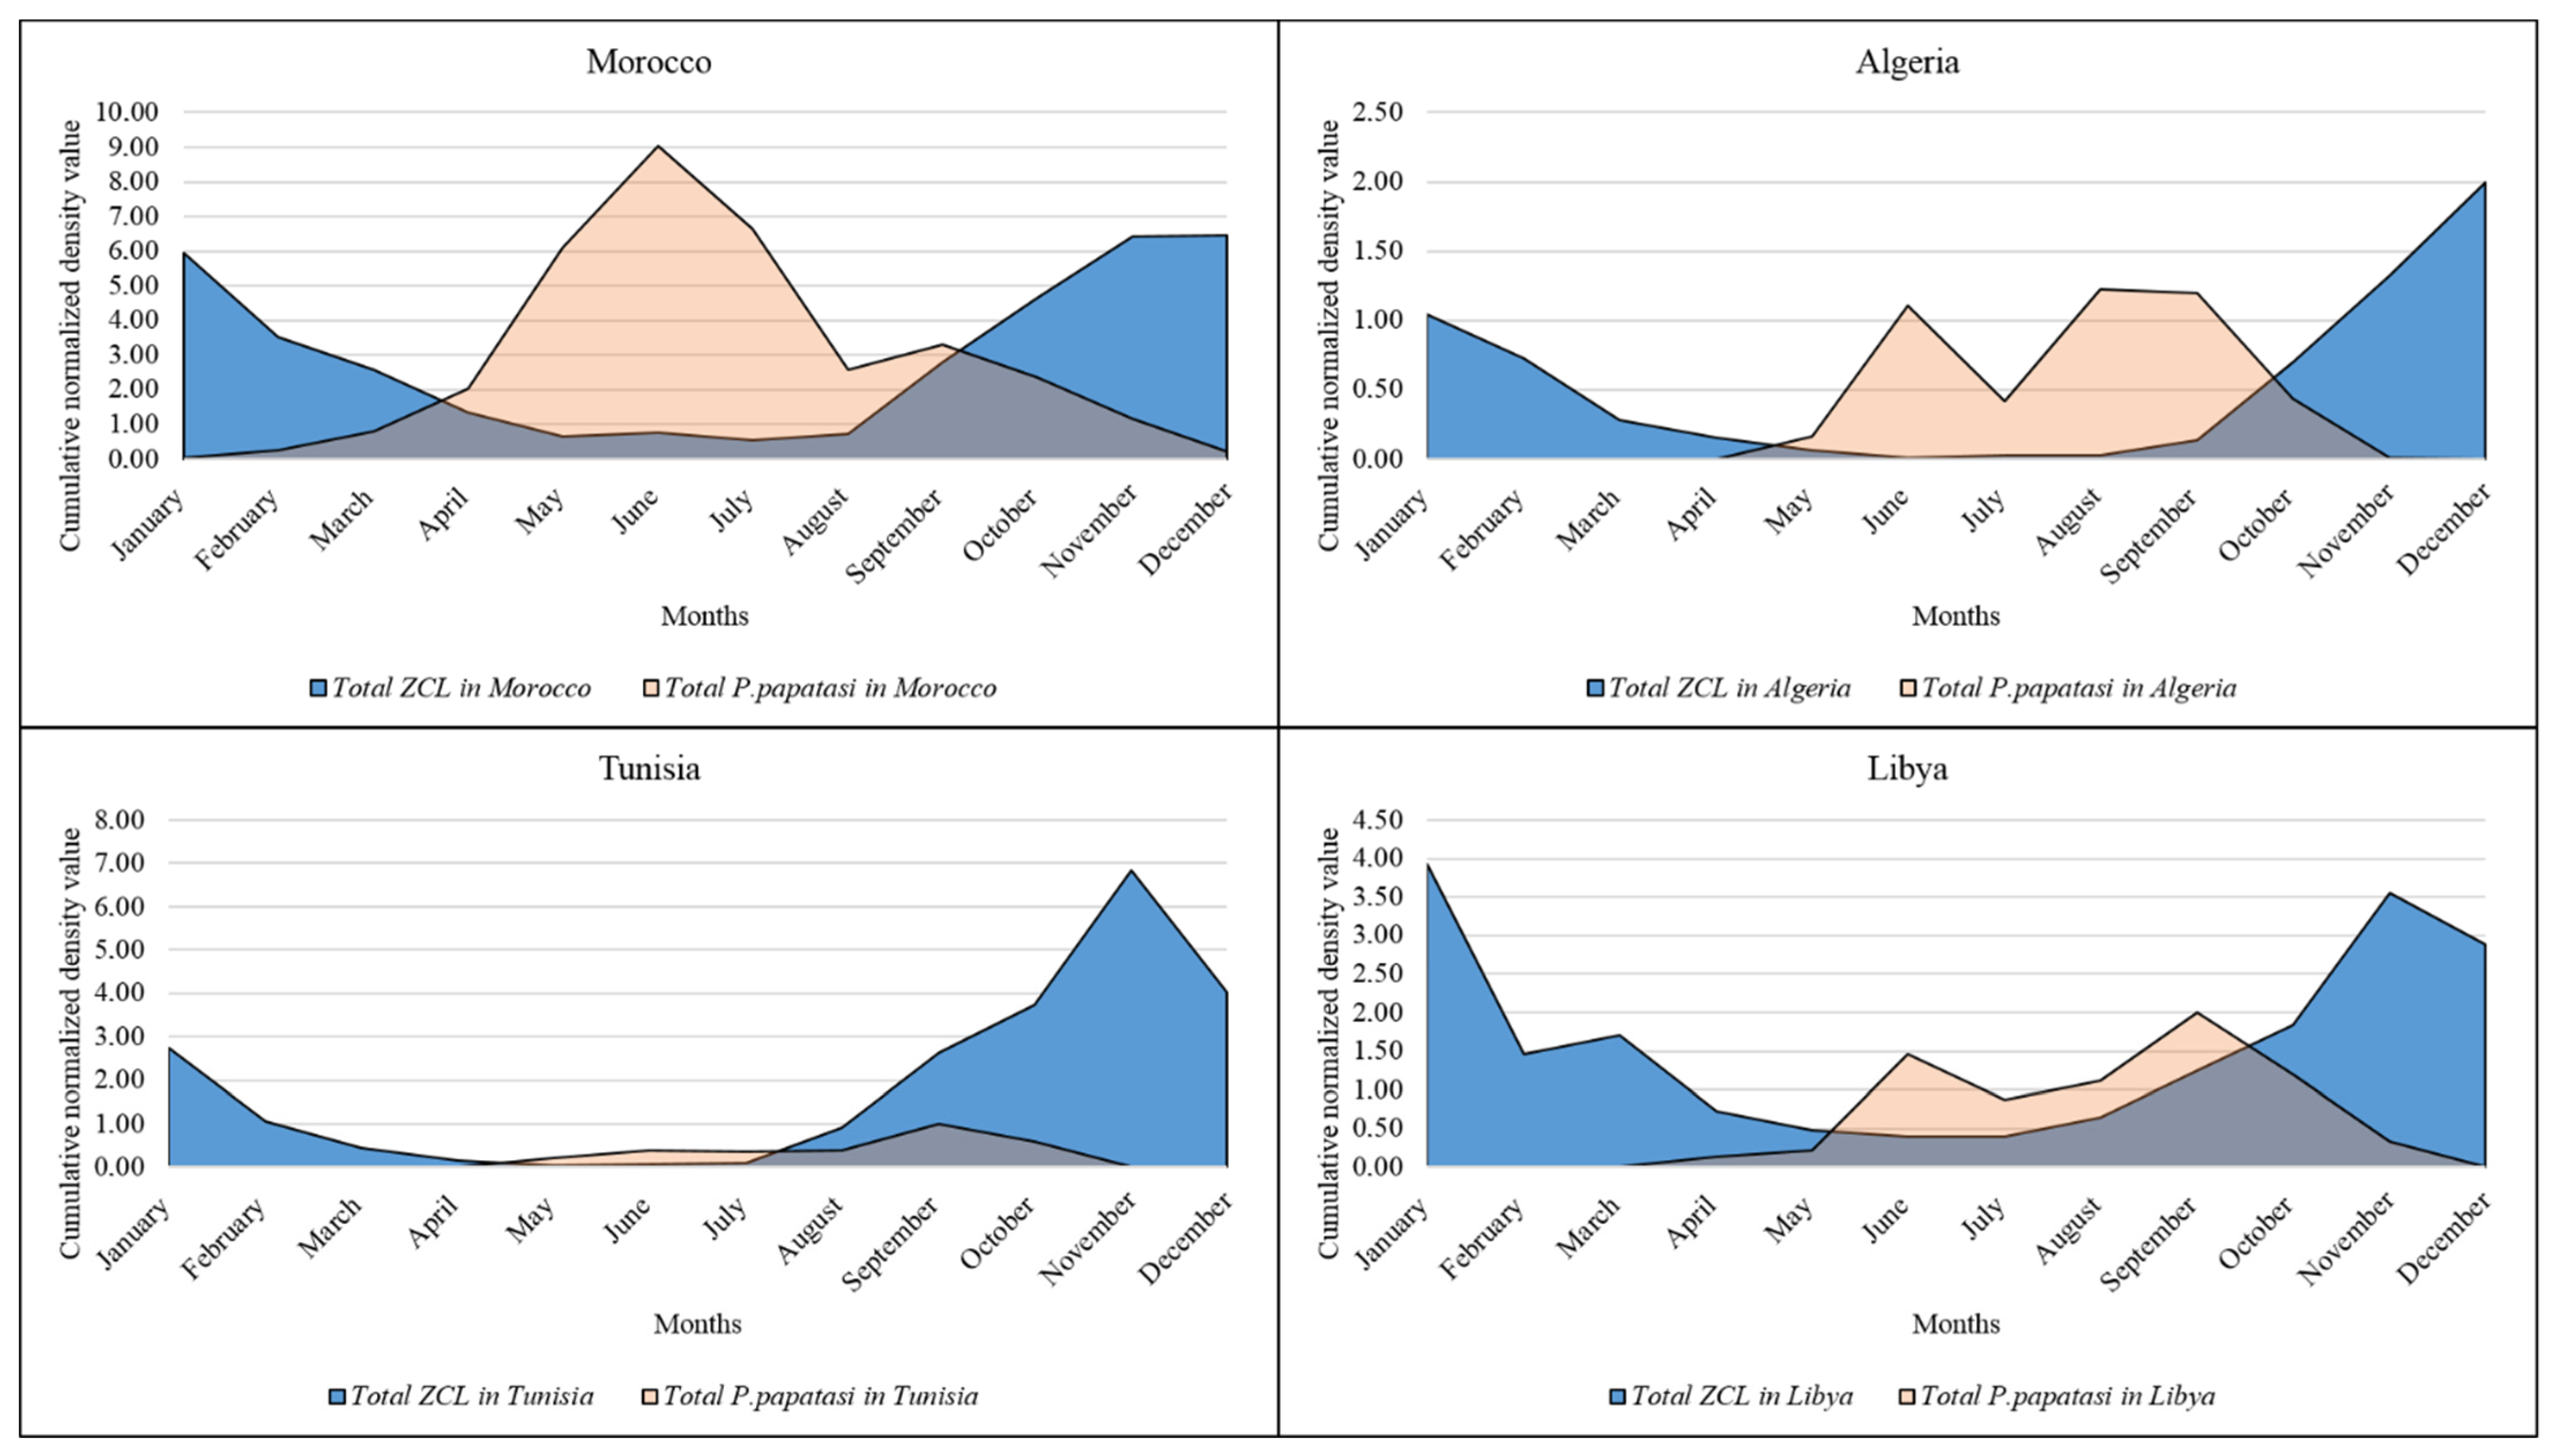
3.3. Monthly Records of ZCL Cases in the North African Region

Morocco and Tunisia are the North African countries with the highest published data, followed by Libya and Algeria. In the Moroccan sites, the high incidence of ZCL was recorded from October to February, coinciding with the vector’s hibernal season. This pattern was also found in the Algerian sites. However, Libyan and Tunisian sites display a pattern with a high incidence ranging from October to January (Figure 5). For the whole region, ZCL recorded a high incidence between October and January (Figure 5). This indicates a contrast between the maximal activity of the vector (P. papatasi) and the apparition of the ZCL lesions.
This increase in seasonal incidence in the North African countries was also found in other regions. For example, in Afghanistan (Mazar-e Sharif), most cases of ZCL occur in mid-October [3], while in Iran (Golestan Province), the high incidence is recorded in September and October [44]. In addition, hot temperatures occurring after a wet season could increase the number of ZCL cases [15].
To highlight differences between the monthly activity of the vector (P. papatasi) and the number of ZCL cases, a combination of the normalized average values per country and within the North African region was performed (Figure 6). Differences may add information helping to delineate the laps between the vector emergence and biting (the infection by the L. major) and the apparition of the lesion(s) following a medical consultation. There are great laps in time between sandfly density and ZCL incidence with differences between region countries. P. papatasi displays a bi-modal pattern of activity, with the highest activity in June and September, while maximum ZCL cases are recorded in November and January (Figure 6).
Data collected from the North African countries included in this study display a bi-modal distribution of P. papatasi in June and September; concomitantly, the peak of ZCL cases was recorded in November (Figure 7).
Overall, in the North African region, two to four months laps are recorded between lesions and scars reminiscent of L. major infection appearance and peak density of P. papatasi. Such a lap was also recorded in Afghanistan (Mazar-e Sharif) with an incubation period of 8–12 weeks. In Germany, the incubation period for ZCL was reported to be seven weeks [3].

3.4. Association of ZCL Incidence and the Climatic Parameters in North Africa

The distribution in time and space of the ZCL follows a seasonal dynamic depending on and following climatic variables, such as rainfall, temperature, or relative humidity. Generally, the rise in cases starts in August and reaches a maximum in September in the Moroccan sites, October in Tunisia and Libya, and December in Algeria. In these countries, the maximum number of cases coincides with the highest amount of rainfall (Figure 8).
In the Moroccan site (Ouarzazate), the peak of ZCL cases was recorded in September and coincided with 32.73 °C (maximum temperature), 18.26 °C (minimum temperature), 30.32 mm (monthly precipitation), and 28.6% (relative humidity) (Figure 8). In the Algerian site (Saida), the peak of ZCL cases was recorded in June and coincided with 15 °C (maximum temperature), 4 °C (minimum temperature), 35.74 mm (monthly precipitation), and 71% (relative humidity). In the Sidi Bouzid site (Tunisia), the peak of ZCL cases density was recorded in October and coincided with 28.79 °C (maximum temperature) and 14.24 °C (minimum temperature), 19.47 mm (monthly precipitation), and 26.04% (relative humidity). In the Libyan site (Al Rabta East), the peak of ZCL cases density was recorded in November. It coincided with 26.35 °C (maximum temperature), 15.15 °C (minimum temperature), 8.76 mm (monthly precipitation), and 55.85% (relative humidity) (Figure 8).
The calculated Pearson correlation coefficient displays a moderate to a substantial likelihood of ZCL cases being associated with maximum temperature, precipitation, and relative humidity in Moroccan sites and a positive correlation and mild likelihood with relative humidity in Algerian sites. In contrast, in the Libyan area, a highly positive association is recorded with precipitation (Table 3). In addition, such associations with rainfall and maximum temperatures [45], minimum temperature [46], and aridity [10] have also been disclosed.

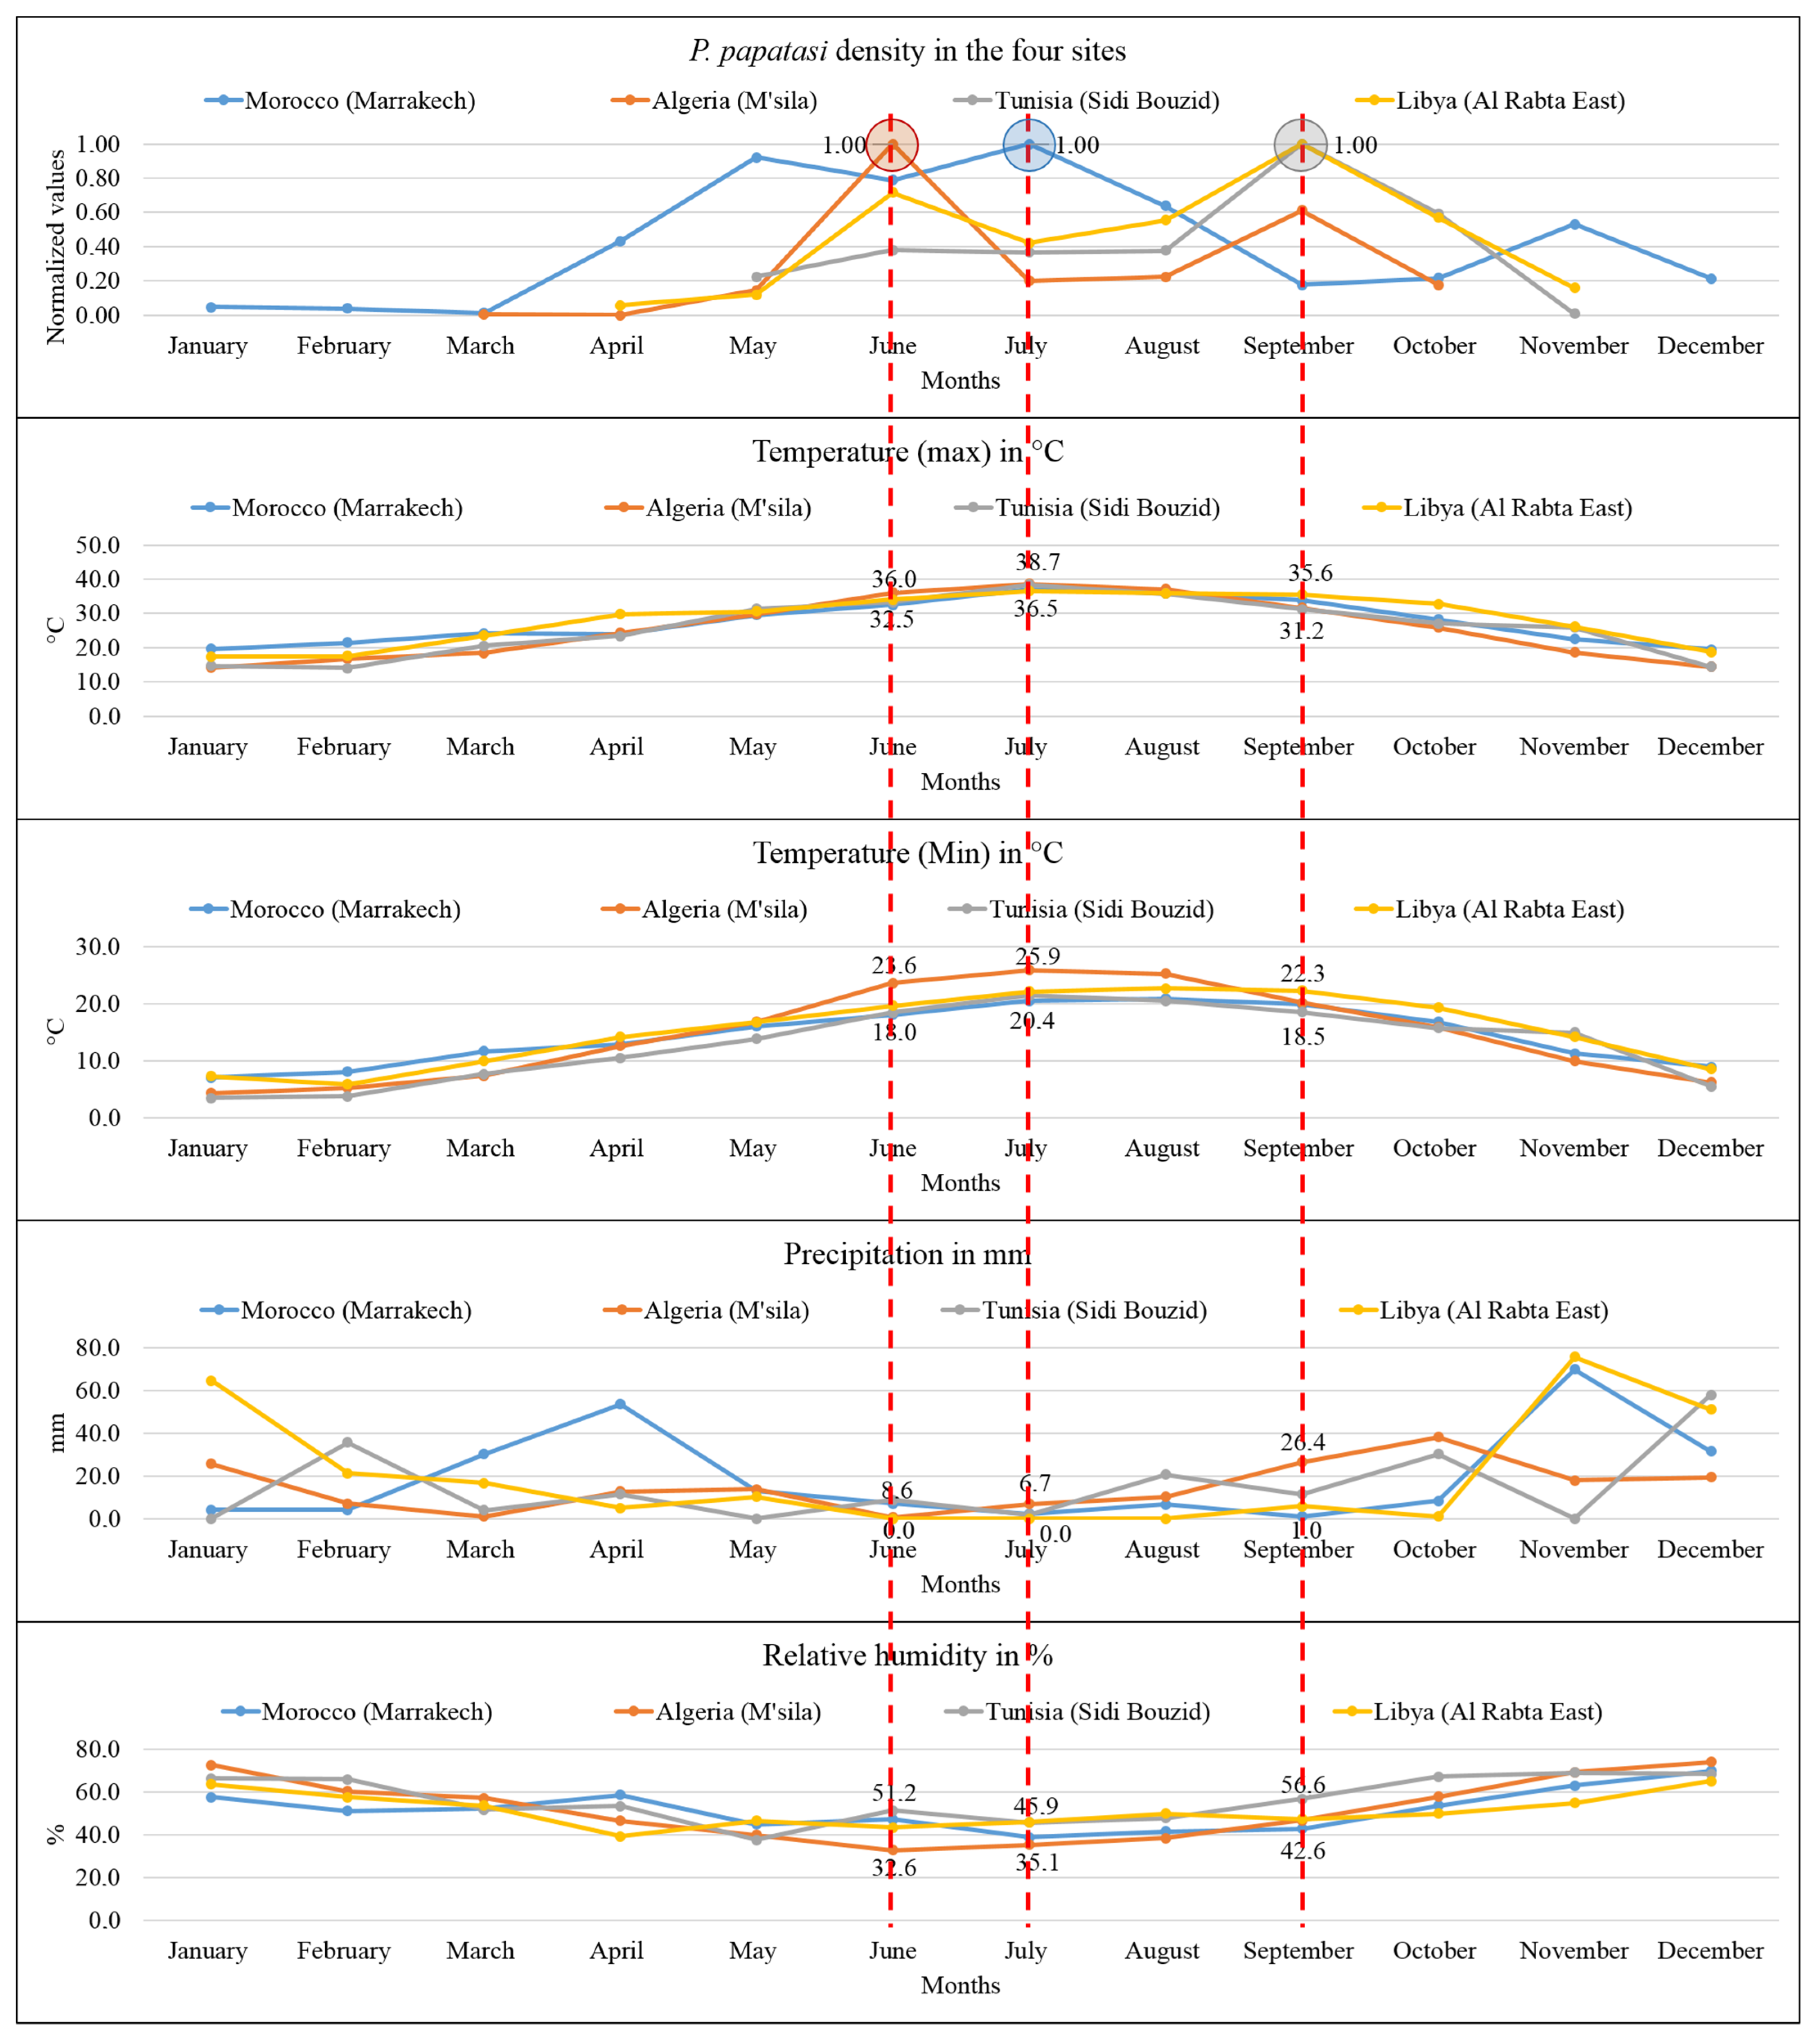
3.5. Association of the P. papatasi Activity and the Climatic Parameters in the North African Region

The distribution in time and space of P. papatasi follows a seasonal fluctuation and is dependent on climatic variables, such as rainfall, temperature, and relative humidity. We tested the correlation of these parameters with the P. papatasi density using the available monthly data from four North African country sites. In these sites, the vector density peaks from May to September. In the Moroccan site (Marrakech), the rise of P. papatasi density was recorded in July and coincided with 37 °C (maximum temperature), 20.4 °C (minimum temperature), 2.2 mm (monthly precipitation), and 38.7% (relative humidity) (Figure 9). In the Algerian site (M’sila), the density peak was recorded in June and coincided with 36 °C (maximum temperature), 23.6 °C (minimum temperature), 0.5 mm (monthly precipitation), and 32.6% (relative humidity). In the site of Sidi Bouzid (Tunisia), the peak was recorded in September and coincided with 31.2 °C (maximum temperature), 18.5 °C (minimum temperature), 11.3 mm (monthly precipitation), and 56.6% (relative humidity). Finally, in the Libyan site (Al Rabta East), the peak of P. papatasi density was recorded in September. It coincided with 35.6 °C (maximum temperature), 22.3 °C (minimum temperature), 5.7 mm (monthly precipitation), and 47.3% (relative humidity) (Figure 9).
These findings support that P. papatasi activity occurs during the hot season, where both minimum and maximum temperatures are high, and low temperatures during the wet season prevent vector activity. Such observation was already reported [40]. In addition, P. papatasi metabolism and the intravectorial development of Leishmania are primarily influenced by temperature [47]. Our study discloses a significant association between P. papatasi density and temperature (maximum and minimum). A moderate positive association is ascertained in Tunisia (Sidi Bouzid) and Libya (Al Rabta East), suggesting a tendency of P. papatasi density to be somewhat linked to high, maximum, and minimum temperatures (Table 4).
Furthermore, a medium to strong positive correlation was recorded for the Moroccan site of Marrakech, while a weak to moderate association was found in the Algerian site. Concerning the precipitation variable, a weak correlation was recorded (Table 4). However, only the Moroccan site showed a moderate positive correlation between P. papatasi and relative humidity.
Data analysis further supports the hypothesis of an intricate association between climatic factors, vector density, and disease incidence. It reinforces previous reports on the seasonal activity of P. papatasi [48,49] and the impact of precipitation and air temperature as significant factors affecting P. papatasi distribution [40,50,51]. In addition, moisture, wind [52], aridity, or surface climate variables [10] also influence vector activity and dispersal capability. All these pieces of evidence forecast climate change as a driver for the expansion of cutaneous leishmaniasis since they can favor contacts between the host, the vector, and human populations [53]. Minimum and maximum temperatures are mainly associated with P. papatasi activity, which points to the interest of these as climatic indicators to predict ZCL incidence. The outputs may be used to set up models to forecast the periods of high vector density and, consequently, the risk of ZCL. Further intercountry research efforts are required to monitor the ZCL incidence, abundance, and seasonal density of P. papatasi and to collect more local climatic variables, including maximum and minimum temperature, relative humidity, and precipitation.

3.6. Strengths and Limitations

North Africa belongs to one of the most impacted geographic areas by ZCL. In this paper, for the first time, the seasonal incidence of L. major infection (ZCL) and the activity of its primary proven vector (P. papatasi) were investigated at the North African geographic scale. Using data from the literature, we explore associations between disease incidence, vector activity, and climatic factors to delineate underlying factors playing a role in the ZCL seasonal dynamic and its spread. Nevertheless, the nature of the data we analyzed, dispersed in terms of time and geographic coverage, as well as the differences in time steps between data, particularly those concerning P. papatasi dynamic, limits the strength of our analyses and, therefore, the conclusions raised by the study.

4. Conclusions

Our analysis points out that peaks of ZCL cases occur from October to February (the hibernal season of the vector), while the density of P. papatasi peaks mainly in the hot seasons in June and September. Therefore, if the presence of P. papatasi does not always imply the existence of ZCL cases, it can be an alert or an indicator of a high risk for ZCL transmission. Therefore, the outputs can be used as a basis for future field studies about ZCL disease risk and management at a regional scale and decision-making in control planning in North Africa.

Supplementary Materials

The following supporting information can be downloaded at: https://www.mdpi.com/article/10.3390/microorganisms10122391/s1, Figure S1. The average evolution of ZCL cases in whole North African region from 1995 to 2020 (26 years).

Author Contributions

Conceptualization, methodology, and software, A.K.; validation, D.S., L.H. and S.E.J.; investigation, A.K.; resources, L.H.; data curation, A.K.; writing—original draft preparation and writing—review and editing, A.K. and D.S.; visualization, A.K.; supervision, L.H. and D.S.; project administration, L.H.; funding acquisition, S.E.J. and L.H. All authors have read and agreed to the published version of the manuscript.

Funding

This research received no external funding.

Institutional Review Board Statement

The study did not require ethical approval.

Informed Consent Statement

Not applicable.

Data Availability Statement

Not applicable.

Acknowledgments

Many thanks to the reviewers for their valuable review comments.

Conflicts of Interest

The authors declare no conflict of interest.

References

  1. WHO. Leishmaniasis. Available online: https://www.who.int/news-room/fact-sheets/detail/leishmaniasis (accessed on 8 January 2022).
  2. Aoun, K.; Bouratbine, A. Cutaneous leishmaniasis in North Africa: A review. Parasite 2014, 21, 1–15. [Google Scholar] [CrossRef] [PubMed] [Green Version]
  3. Faulde, M.K.; Heyl, G.; Amirih, M.L. Zoonotic cutaneous leishmaniasis, Afghanistan. Emerg. Infect. Dis. 2006, 12, 1623. [Google Scholar] [CrossRef] [PubMed]
  4. Jalali, H.; Enayati, A.A.; Fakhar, M.; Motevalli-Haghi, F.; Charati, J.Y.; Dehghan, O.; Hosseini-Vasoukolaei, N. Reemergence of zoonotic cutaneous leishmaniasis in an endemic focus, northeastern Iran. Parasite Epidemiol. Control 2021, 13, e00206. [Google Scholar] [CrossRef] [PubMed]
  5. Abuzaid, A.A.; Abdoon, A.M.; Aldahan, M.A.; Alzahrani, A.G.; Alhakeem, R.F.; Asiri, A.M.; Alzahrani, M.H.; Memish, Z.A. Cutaneous leishmaniasis in Saudi Arabia: A comprehensive overview. Vector-Borne Zoonotic Dis. 2017, 17, 673–684. [Google Scholar] [CrossRef] [Green Version]
  6. Kholoud, K.; Bounoua, L.; Sereno, D.; El Hidan, M.; Messouli, M. Emerging and Re-emerging leishmaniases in the mediterranean area: What can Be learned from a retrospective review analysis of the situation in Morocco during 1990 to 2010? Microorganisms 2020, 8, 1511. [Google Scholar] [CrossRef]
  7. Barhoumi, W.; Chelbi, I.; Fares, W.; Zhioua, S.; Abbas, M.; Derbali, M.; Ramalho-Ortigao, M.; Zhioua, E. Risk Assessment of the Role of the Ecotones in the Transmission of Zoonotic Cutaneous Leishmaniasis in Central Tunisia. Int. J. Environ. Res. Public Health 2021, 18, 9274. [Google Scholar] [CrossRef]
  8. Mollalo, A.; Alimohammadi, A.; Shirzadi, M.R.; Malek, M.R. Geographic information system-based analysis of the spatial and spatio-temporal distribution of zoonotic cutaneous leishmaniasis in Golestan Province, north-east of Iran. Zoonoses Public Health 2015, 62, 18–28. [Google Scholar] [CrossRef]
  9. Bellali, H.; Hchaichi, A.; Harizi, C.; Mrabet, A.; Chahed, M.K. Comparison between active surveillance and passive detection of zoonotic cutaneous leishmaniasis in endemic rural areas in Central Tunisia, 2009 to 2014. Asian Pac. J. Trop. Dis. 2015, 5, 515–519. [Google Scholar] [CrossRef]
  10. Bounoua, L.; Kahime, K.; Houti, L.; Blakey, T.; Ebi, K.L.; Zhang, P.; Imhoff, M.L.; Thome, K.J.; Dudek, C.; Sahabi, S.A.; et al. Linking climate to incidence of zoonotic cutaneous leishmaniasis (L. major) in pre-Saharan North Africa. Int. J. Environ. Res. Public Health 2013, 10, 3172–3191. [Google Scholar] [CrossRef]
  11. Karmaoui, A.; Sereno, D.; Maia, C.; Campino, L.; El Jaafari, S.; Taybi, A.; Hajj, L. A conceptual model for understanding the zoonotic cutaneous leishmaniasis transmission risk in the Moroccan pre-Saharan area. Parasite Epidemiol. Control 2022, 17, e00243. [Google Scholar] [CrossRef]
  12. Karmaoui, A.; El Qorchi, F.; Hajji, L.; Zerouali, S. Eco-epidemiological aspects of Zoonotic cutaneous leishmaniasis in Ouarzazate Province, Morocco. J. Parasit. Dis. 2021, 45, 341–350. [Google Scholar] [CrossRef] [PubMed]
  13. Hunter, P.R. Climate change and waterborne and vectorborne disease. J. Appl. Microbiol. Symp. Suppl. 2003, 94, 37S–46S. [Google Scholar] [CrossRef] [PubMed] [Green Version]
  14. Babaie, E.; Alesheikh, A.A.; Tabasi, M. Spatial modeling of zoonotic cutaneous leishmaniasis with regard to potential environmental factors using ANFIS and PCA-ANFIS methods. Acta Trop. 2022, 228, 106296. [Google Scholar] [CrossRef] [PubMed]
  15. Mohammadbeigi, A.; Khazaei, S.; Heidari, H.; Asgarian, A.; Arsangjang, S.; Saghafipour, A.; Mohammadsalehi, N.; Ansari, H. An investigation of the effects of environmental and ecologic factors on cutaneous leishmaniasis in the old world: A systematic review study. Rev. Environ. Health 2021, 36, 117–128. [Google Scholar] [CrossRef]
  16. Toumi, A.; Chlif, S.; Bettaieb, J.; Alaya, N.B.; Boukthir, A.; Ahmadi, Z.E.; Salah, A.B. Temporal dynamics and impact of climate factors on the incidence of zoonotic cutaneous leishmaniasis in central Tunisia. PLoS Negl. Trop. Dis. 2012, 6, e1633. [Google Scholar] [CrossRef]
  17. WHO EMRO. Cutaneous Leishmaniasis Factsheet. Neglected Tropical Diseases. Available online: http://www.emro.who.int/neglected-tropical-diseases/information-resources-leishmaniasis/cl-factsheet.html (accessed on 14 July 2022).
  18. Page, M.J.; McKenzie, J.E.; Bossuyt, P.M.; Boutron, I.; Hoffmann, T.C.; Mulrow, C.D.; Shamseer, L.; Tetzlaff, J.M.; Akl, E.A.; Brennan, S.E.; et al. The PRISMA 2020 statement: An updated guideline for reporting systematic reviews. Int. J. Surg. 2021, 88, 105906. [Google Scholar] [CrossRef]
  19. Nakagawa, S.; Noble, D.W.; Senior, A.M.; Lagisz, M. Meta-evaluation of meta-analysis: Ten appraisal questions for biologists. BMC Biol. 2017, 15, 1–14. [Google Scholar] [CrossRef] [Green Version]
  20. Archives of the Provincial Health; Delegation of Zagora: Draa Tafilalet Region, Morocco, 2005.
  21. Ben tayeb, R. Etude Epidémiologique de la Leishmaniose Cutanée dans la Province d’Errachidia entre 2012 et 2017. Ph.D. Thesis, University Sid Mohamed Ben Abdellah, Fez city, Morocco, 2019. [Google Scholar]
  22. Bennis, I.; De Brouwere, V.; Ameur, B.; El Idrissi Laamrani, A.; Chichaoui, S.; Hamid, S.; Boelaert, M. Control of cutaneous leishmaniasis caused by Leishmania major in south-eastern Morocco. Trop. Med. Int. Health 2015, 20, 1297–1305. [Google Scholar] [CrossRef]
  23. Archives of the Provincial Health; Delegation of Errachidia: Draa Tafilalet region, Morocco, 2020.
  24. Cherif, K. Étude Éco-Épidémiologique de la Leishmaniose Cutanée dans le Bassin du Hodna (M’SILA). Ph.D. Thesis, Université Ferhat Abbas-Setif, Sétif, Algeria, 2014; 197p. [Google Scholar]
  25. Talmoudi, K.; Bellali, H.; Ben-Alaya, N.; Saez, M.; Malouche, D.; Chahed, M.K. Modeling zoonotic cutaneous leishmaniasis incidence in central Tunisia from 2009-2015: Forecasting models using climate variables as predictors. PLoS Negl. Trop. Dis. 2017, 11, e0005844. [Google Scholar] [CrossRef] [Green Version]
  26. Fichet-Calvet, E.; Jomaa, I.; Ben Ismail, R.; Ashford, R.W. Leishmania major infection in the fat sand rat Psammomys obesus in Tunisia: Interaction of host and parasite populations. Ann. Trop. Med. Parasitol. 2003, 97, 593–603. [Google Scholar] [CrossRef]
  27. Chelbi, I.; Derbali, M.; Al-Ahmadi, Z.; Zaafouri, B.; El Fahem, A.; Zhioua, E. Phenology of Phlebotomus papatasi (Diptera: Psychodidae) relative to the seasonal prevalence of zoonotic cutaneous leishmaniasis in central Tunisia. J. Med. Entomol. 2007, 44, 385–388. [Google Scholar] [CrossRef] [Green Version]
  28. Aoun, K.; Abda, I.B.; Bousslimi, N.; Bettaieb, J.; Siala, E.; Abdallah, R.B.; Benmously, R.; Bouratbine, A. Caractérisation comparative des trois formes de leishmaniose cutanée endémiques en Tunisie. Ann. De Dermatol. Et De Vénéréologie 2012, 139, 452–458. [Google Scholar] [CrossRef]
  29. Amro, A.; Gashout, A.; Al-Dwibe, H.; Zahangir Alam, M.; Annajar, B.; Hamarsheh, O.; Shubar, H.; Schönian, G. First molecular epidemiological study of cutaneous leishmaniasis in Libya. PLoS Negl. Trop. Dis. 2012, 6, e1700. [Google Scholar] [CrossRef] [Green Version]
  30. Amro, A.; Al-Dwibe, H.; Gashout, A.; Moskalenko, O.; Galafin, M.; Hamarsheh, O.; Frohme, M.; Jaeschke, A.; Schönian, G.; Kuhls, K. Spatiotemporal and molecular epidemiology of cutaneous leishmaniasis in Libya. PLoS Negl. Trop. Dis. 2017, 11, e0005873. [Google Scholar] [CrossRef] [Green Version]
  31. Al-Koleeby, Z.; El Aboudi, A.; Aboulfadl, S.; Faraj, C. Diversity and Bionomics of Sandflies (Diptera: Psychodidae) of an Endemic Focus of Cutaneous Leishmaniasis in Zagora Province, Southeast of Morocco. J. Parasitol. Res. 2021, 2021, 8812691. [Google Scholar] [CrossRef]
  32. El Omari, H.; Chahlaoui, A.; Ouarrak, K.; Faraj, C.; Lalami, A.E.O. Surveillance of leishmaniasis: Inventory and seasonal fluctuation of phlebotomine sandflies (Diptera: Psychodidae), at the prefecture of Meknes (center of Morocco). Bull. Soc. Pathol. Exot 2018, 111, 309–315. [Google Scholar] [CrossRef]
  33. Talbi, F.Z.; El Ouali Lalami, A.; Fadil, M.; Najy, M.; Ech-Chafay, H.; Lachhab, M.; Lotfi, S.; Nouayti, N.; Lahouiti, K.; Faraj, C.; et al. Entomological Investigations, Seasonal Fluctuations and Impact of Bioclimate Factors of Phlebotomines Sand Flies (Diptera: Psychodidae) of an Emerging Focus of Cutaneous Leishmaniasis in Aichoun, Central Morocco. J. Parasitol. Res. 2020. [Google Scholar] [CrossRef]
  34. Boussaa, S.; Guernaoui, S.; Pesson, B.; Boumezzough, A. Seasonal fuctuations of phlebotomine sand fy populations (Diptera: Psychodidae) in the urban area of Marrakech, Morocco. Acta Trop. 2005, 95, 86–91. [Google Scholar] [CrossRef]
  35. Talbi, F.Z.; El OualiLalami, A.; Janati Idrissi, A.; Sebti, F.; Faraj, C. Leishmaniasis in central Morocco: Seasonal fuctuations of phlebotomine sand fy in Aichoun locality, from Sefrou province. Pathol. Res. Int. 2015, 438749. [Google Scholar] [CrossRef]
  36. Lahouiti, K.; Maniar, S.; Bekhti, K. Seasonal fuctuations of phlebotomines sand fy populations (Diptera: Psychodidae) in the Moulay Yacoub province, centre Morocco: Efect of ecological factors. Afr. J. Env. Sci. Technol. 2013, 7, 1028–1031. [Google Scholar]
  37. Zouirech, M.; Belghyti, D.; El Kohli, M.; Faraj, C. Entomological investigation of an emerging leishmaniasis focus in Azilal province, Morocco. Pak. Entomol. 2013, 35, 11–15. [Google Scholar]
  38. Boudrissa, A. Étude éco-Epidémiologique de la Leishmaniose Cutanée Dans la Wilaya de M’Sila. Master’s Thesis, Université de Sétif, Sétif, Algérie, 2005. [Google Scholar]
  39. Benikhlef, R.; Aoun, K.; Boudrissa, A.; Ben Abid, M.; Cherif, K.; Aissi, W.; Benrekta, S.; Boubidi, S.C.; Späth, G.F.; Bouratbine, A.; et al. Cutaneous Leishmaniasis in Algeria; Highlight on the Focus of M’Sila. Microorganisms 2021, 9, 962. [Google Scholar] [CrossRef] [PubMed]
  40. Dokhan, M.R.; Kenawy, M.A.; Doha, S.A.; El-Hosary, S.S.; Shaibi, T.; Annajar, B.B. Entomological studies of phlebotomine sand fies (Diptera: Psychodidae) in relation to cutaneous leishmaniasis transmission in Al Rabta, North West of Libya. Acta Trop. 2016, 154, 95–101. [Google Scholar] [CrossRef]
  41. Hijmans, R.J.; Cameron, S.E.; Parra, J.L.; Jones, P.G.; Jarvis, A. Very high resolution interpolated climate surfaces for global land areas. Int. J. Clim. 2005, 25, 1965–1978. [Google Scholar] [CrossRef]
  42. Ali, R.M.; Loutfy, N.F.; Awad, O.M.; Suliman, N.K. Bionomics of phlebotomine sandfy species in west Alexandria, Egypt. J. Entomol. Zool. Stud. 2016, 4, 349–353. [Google Scholar]
  43. Yaghoobi-Ershadi, M.R.; Akhavan, A.A.; Abai, M.R.; Ebrahimi, B.; Zahraei-Ramazani, A.R.; Vafaei-Nezhad, R.; Jafari, R. Epidemiological study in a new focus of cutaneous leishmaniasis in the Islamic Republic of Iran. East. Mediterr. Health J. 2004, 10, 688. Available online: https://www.who.int/iris/handle/10665/119335 (accessed on 19 November 2022). [CrossRef] [PubMed]
  44. Shirzadi, M.R.; Mollalo, A.; Yaghoobi-Ershadi, M.R. Dynamic relations between incidence of zoonotic cutaneous leishmaniasis and climatic factors in Golestan Province, Iran. J. Arthropod-Borne Dis. 2015, 9, 148. [Google Scholar]
  45. Faulde, M.; Schrader, J.; Heyl, G.; Amirih, M.; Hoerauf, A. Zoonotic cutaneous leishmaniasis outbreak in Mazar-e Sharif, northern Afghanistan: An epidemiological evaluation. Int. J. Med. Microbiol. 2008, 298, 543–550. [Google Scholar] [CrossRef] [PubMed]
  46. Kasap, O.E.; Alten, B. Comparative demography of the sand fly Phlebotomus papatasi (Diptera: Psychodidae) at constant temperatures. J. Vector Ecol. 2006, 31, 378–385. [Google Scholar] [CrossRef]
  47. Benkova, I.; Volf, P. Effect of temperature on metabolism of Phlebotomus papatasi (Diptera: Psychodidae). J. Med. Entomol. 2007, 44, 150–154. [Google Scholar] [CrossRef]
  48. Pekağırbaş, M.; Karakuş, M.; Kasap, O.E.; Demir, S.; Nalçacı, M.; Töz, S.; Eren, H.; Özbel, Y. Investigation of Phlebotominae (Diptera: Psychodidae) Fauna, Seasonal Dynamics, and Natural Leishmania spp. Infection in Muğla, Southwest of Turkey. Acta Trop. 2021, 216, 105827. [Google Scholar] [CrossRef]
  49. Karmaoui, A. Seasonal Distribution of Phlebotomus papatasi, Vector of Zoonotic Cutaneous Leishmaniasis. Acta Parasitol. 2020, 65, 585–598. [Google Scholar] [CrossRef]
  50. Hosseini, S.H.; Allah-Kalteh, E.; Sofizadeh, A. The Effect of Geographical and Climatic Factors on the Distribution of Phlebotomus papatasi (Diptera: Psychodidae) in Golestan Province, an Endemic Focus of Zoonotic Cutaneous Leishmaniasis in Iran, 2014. J. Arthropod-Borne Dis. 2021, 15, 225. [Google Scholar] [CrossRef] [PubMed]
  51. Abedi-Astaneh, F.; Akhavan, A.A.; Shirzadi, M.R.; Rassi, Y.; YaghoobiErshadi, M.R.; Hanaf-Bojd, A.A.; Rauf, H. Species diversity of sand fies and ecological niche model of Phlebotomus papatasi in central Iran. Acta Trop. 2015, 149, 246–253. [Google Scholar] [CrossRef]
  52. Boudrissa, A.; Cherif, K.; Kherrachi, I.; Benbetka, S.; Bouiba, L.; Boubidi, S.C.; Harrat, Z. Extension de Leishmania major au nord de l’Alg’erie Spread of Leishmania major to the north of Algeria. Bull. Soc. Pathol. Exot. 2012, 105, 30–35. [Google Scholar] [CrossRef]
  53. Ready, P.D. Leishmaniasis emergence and climate change. Rev. Sci. Tech. 2008, 27, 399–412. [Google Scholar] [CrossRef]
Figure 1. Flow chart of the current study following the recent updates of the PRISMA guidelines of 2020.
Microorganisms 10 02391 g001
Figure 2. Localization of the North African countries with seasonal activity data of ZCL cases and P. papatasi with the annual distribution of precipitation (mm). ZCL seasonal data: the current study. Climatic data source: ESRI grids, resolution 10 min according to WorldClim 1.4 (current conditions) http://worldclim.com/current, accessed on 15 October 2022 [41] is licensed under a Creative Commons Attribution-ShareAlike 4.0 International License.
Microorganisms 10 02391 g002
Figure 3. The evolution of ZCL cases in North African countries from 1995 to 2020 (26 years) as revealed by the systematic review and meta-analysis. The red box refers to the year with the peak of incidence.
Microorganisms 10 02391 g003
Figure 4. The normalized monthly density of the P. papatasi with 0 indicates no data/absence of activity, and 1 shows high density in the studied sites in the Northern African countries.
Microorganisms 10 02391 g004
Figure 5. Seasonal distribution of ZCL cases, total values of all sites of the North African region.
Microorganisms 10 02391 g005
Figure 6. Seasonality of ZCL cases and P. papatasi sand fly vector density in the studied countries. Data were expressed as a cumulative normalized density value of stations under study.
Microorganisms 10 02391 g006
Figure 7. Seasonality in ZCL case number and P. papatasi density at the North African scale. Yellow dotted lines refer to the peaks of P. papatasi density and red dotted line indicates the peak of ZCL cases.
Microorganisms 10 02391 g007
Figure 8. Association between seasonal ZCL incidence and the climatic parameters. Red dotted lines indicate the association between the peaks of ZCL cases and climatic parameters.
Microorganisms 10 02391 g008
Figure 9. Association between P. papatasi activity and climatic variables in the four studied sites, including from top to down; monthly P. papatasi activity, monthly maximum and minimum temperatures in °C, monthly precipitation in mm, and monthly relative humidity in %. Red dotted lines indicate the association between the peaks of P. papatasi density and climatic parameters.
Microorganisms 10 02391 g009
Table 1. Geolocalization of sites whose monthly data of ZCL cases in the North African countries are published. The geographic information includes the latitude, longitude, and altitude (m); for the sites without geographic data, the symbol ‘~’ was used, and the approximate values were estimated from Google Earth.
CountryZoneLatitudeLongitudeAltitude (m)Annual Rainfall (mm)PeriodReferences
MoroccoZagora province (2005)~30°18′27.60″ N~5°52′4.55″ W500802005[20]
Zagora province (2017)~30°40′20.60″ N~5°7′4″ W500802017[20]
Errachidia Province (2012–2017)~31°55′5″ N~4°26′6″ W~10371502012–2017[21]
Errachidia Province (Urban)~31°55′46.27″ N4°26′55.83″ W~10371342004–2013[22]
Errachidia Province (Rural)~31°51′1″ N~4°16′4″ W~10111342004–2013[22]
Errachidia Province (1990–2009)~31°55′46″ N~4°26′55″ W~1037134.281990–2009[10]
Errachidia Province (2012–2020)~31°55′48″ N~4°26′58″ W~10371342012–2020[23]
Ouarzazate province (2002–2009)~30°55′59″ N~6°55′10″ W~1148146.972002–2009[12]
Algeria El Hodna35°18′–35°32′N4°15′–5°06′ E400–1800500–6001995–2000[24]
Saida~34°50′29.47″ N~0°8′44.18″ E~802353.471990–2009[10]
Tunisia Bir Badr, Hichria, and Zefzef (Sidi Bouzid)~34°49′45″ N~9°22′37″ E4072282009–2015[25]
R’milia, Sidi Bouzid (1995)35°46′ N9°36′ E2802601995[26]
R’milia, Sidi Bouzid (1996)35°46′ N9°36′ E2802601996[26]
R’milia, Sidi Bouzid (1997)35°46′ N9°36′ E2802601997[26]
Sidi Bouzid (1991–2007)~35°02′00″ N~9°30′00″ E~373 -1991–2007[16]
Village of Felta, Sidi Bouzid (2005)~34°49′27″ N8°42′09″ E~768 -2004–2005[27]
Central Tunisia (2009–2014)~34°49′45″ N~9°22′37″ E~407~2282009–2014[9]
Center and SouthLarge distribution in the center and south of the country2007–2011[28]
Libya Northwest (1995–2008)Large distribution in the north-western districts of the country.1995–2008[29]
Northwest (2011–2012)Large distribution in the north-western districts of the country, including Jafara, Tripoli, Misrata, and Nalut.2011–2012[30]
Northwest (1995–2008)Large distribution in the north-western districts of the country, including Jafara, Tripoli, Misrata, and Nalut.1995–2008[30]
Northwest (1995–2012)Large distribution in the north-western districts of the country, including Jafara, Tripoli, Misrata, and Nalut.1995–2012[30]
Table 2. Geolocalization of sites whose monthly density data of P. papatasi in the North African countries was extracted. The geographic information includes the latitude, longitude, and altitude (m); for the sites without geographic data, the symbol ‘~’ was used, and the approximate values were estimated from Google Earth.
CountryZoneLatitudeLongitudeAltitude (m)Annual Rainfall (mm)PeriodReferences
MoroccoKsar Mougni, Tinzouline (Zagora) C130°27′3″ N5°58′26″ W775372019[31]
Ksar Mougni, Tinzouline (Zagora) C230°27′3″ N5°58′26″ W775372019[31]
Touna, Tinzouline (Zagora) C130°37′28.2″ N5°49′56.1″ W910262019[31]
Touna, Tinzouline (Zagora) C230°37′28.2″ N5°49′56.1″ W910262019[31]
Meknes (prefecture)~33°45′02″ N~4°34′00″ O5006602016–2017[32]
Aichoun, Tazouta, Sefrou~33°45′22″ N~5°32′26″ O7504002013–2014[33]
Marrakech
Urban
31°36 N8°02 W471 2002–2003[34]
Sefrou33°39 N04°38 W809 2012[35]
Moulay Yacoub Oulad aid~34°05′N~4°45′ W345 2011–2012[36]
Moulay Yacoub Zlilig33°57 N5°05 W500 2011–2012[36]
Azilal province,
Ouaouizaght district
32°09′27.26″ N6° 20′57.58″ O~900–1200 2010[37]
AlgeriaEl Hodna35°18′−35°32′ N4°15′–
5°06′
500–800 2004[38]
Province of M’Sila35°18′ and 35°32′ N4°15′ and 5°06′E 2003/2004[39]
TunisiaSidiBouzid~35°02′01″ N~9°28′54″ E350 2005[27]
LybiaAl Rabta East village32°9′46.59″ N12°50′50.65″ E300 2012–2013[40]
Al Rabta West village32°9′46.59″ N12°50′50.65″ E300 2012–2013[40]
Table 3. Correlation between ZCL cases and climatic parameters in the studied countries.
Correlation MethodTemperature (Maximum)Temperature (Minimum)PrecipitationRelative Humidity
Tunisia (Sidi Bouzid)R0.43260.33090.1890.3225
R20.18710.10950.03570.104
Algeria (Saida)R0.37110.22730.41850.5764
R20.13770.05170.17510.3322
Morocco (Ouarzazate)R0.51970.29890.62540.6715
R20.27010.08930.39110.4509
Libya (Tripoli)R0.34380.24270.86410.3003
R20.11820.05890.74670.0902
R, Pearson correlation coefficient; and R2 is the coefficient of determination.
Table 4. Results of the correlation between P. papatasi and climatic parameters as computed with the social science statistics calculator.
Correlation MethodTemperature (Maximum)Temperature (Minimum)PrecipitationRelative Humidity
Tunisia (Sidi Bouzid)R0.51190.56850.4980.4616
R20.2620.32320.2480.2131
Algeria (M’SILA)R0.4940.55370.48930.3296
R20.2440.30660.23940.1086
Morocco (Marrakech)R0.75090.50610.31470.5725
R20.56390.25610.0990.3278
Libya (Al Rabta East)R0.54050.5309−0.20770.4894
R20.29210.28190.04310.2395
R, Pearson correlation coefficient; and R2 coefficient of determination.
Publisher’s Note: MDPI stays neutral with regard to jurisdictional claims in published maps and institutional affiliations.

