Article

Chickpea Roots Undergoing Colonisation by Phytophthora medicaginis Exhibit Opposing Jasmonic Acid and Salicylic Acid Accumulation and Signalling Profiles to Leaf Hemibiotrophic Models

1
Hawkesbury Institute for the Environment, Western Sydney University, Richmond, NSW 2753, Australia
2
NSW Department of Primary Industries, Tamworth, NSW 2340, Australia
3
Mass Spectrometry Unit, School of Medicine, Western Sydney University, Campbelltown, NSW 2560, Australia
4
NSW Department of Primary Industries, Elizabeth Macarthur Agricultural Institute, Menangle, NSW 2568, Australia
*
Author to whom correspondence should be addressed.
Microorganisms 2022, 10(2), 343; https://doi.org/10.3390/microorganisms10020343
Submission received: 15 December 2021 / Revised: 18 January 2022 / Accepted: 27 January 2022 / Published: 2 February 2022
(This article belongs to the Section Plant Microbe Interactions)

Abstract

:
Hemibiotrophic pathogens cause significant losses within agriculture, threatening the sustainability of food systems globally. These microbes colonise plant tissues in three phases: a biotrophic phase followed by a biotrophic-to-necrotrophic switch phase and ending with necrotrophy. Each of these phases is characterized by both common and discrete host transcriptional responses. Plant hormones play an important role in these phases, with foliar models showing that salicylic acid accumulates during the biotrophic phase and jasmonic acid/ethylene responses occur during the necrotrophic phase. The appropriateness of this model to plant roots has been challenged in recent years. The need to understand root responses to hemibiotrophic pathogens of agronomic importance necessitates further research. In this study, using the root hemibiotroph Phytophthora medicaginis, we define the duration of each phase of pathogenesis in Cicer arietinum (chickpea) roots. Using transcriptional profiling, we demonstrate that susceptible chickpea roots display some similarities in response to disease progression as previously documented in leaf plant–pathogen hemibiotrophic interactions. However, our transcriptomic results also show that chickpea roots do not conform to the phytohormone responses typically found in leaf colonisation by hemibiotrophs. We found that quantified levels of salicylic acid concentrations in root tissues decreased significantly during biotrophy while jasmonic acid concentrations were significantly induced. This study demonstrated that a wider spectrum of plant species should be investigated in the future to understand the physiological changes in plants during colonisation by soil-borne hemibiotrophic pathogens before we can better manage these economically important microbes.

1. Introduction

Plant pathogens display diverse infection strategies during colonisation of a plant host. Biotrophic pathogens such as Puccinia striiformis f.sp. tritici, the causal agent of wheat stripe rust, require a living host to complete their lifecycle [1,2]. Conversely, necrotrophic pathogens such as Botryits cinerea, the cause of grey mould on a broad range of host species, including chickpea, kill host tissues during the colonisation process to obtain nutrients from dead tissue [3]. Between these two opposing lifestyles are hemibiotrophic pathogens such as Phytophthora infestans which display an initial biotrophic colonisation phase followed by a physiologically regulated switch to a necrotrophic phase during later phases of infection [4,5]. During the biotrophic phase, hemibiotrophs can invade their hosts both intercellularly and intracellularly through the formation of haustoria such as in the soybean root pathogen Phytophthora sojae or they can remain strictly intercellular between mesophyll cells as observed for Leptosphaeria maculans, the phoma stem canker pathogen of canola [6,7]. During this biotrophic phase of infection, effector proteins are released to suppress plant defences while nutrients are obtained from living cells or the apoplastic space [8]. Subsequently, a major morphological and physiological switch to the necrotrophic phase occurs (henceforth termed the ‘biotrophy to necrotrophy switch’; BNS), whereby hemibiotrophs begin to kill plant cells through the release of toxins and necrosis-inducing proteins, and digest on dead cells [9,10].
The plant immune response to hemibiotrophic pathogens before and after the switch from biotrophy to necrotrophy is mediated by a series of intracellular signalling cascades that are regulated, in part, by plant phytohormones [11,12]. The phytohormones salicylic acid (SA), jasmonic acid (JA), and ethylene (ET) all play a role during plant–microbe interactions, the relative importance of each depending upon the lifestyle of the pathogen colonising the plant tissue [13]. SA is known as a positive regulator of defence against biotrophs, whereas JA/ET act synergistically as positive regulators of defence against necrotrophy [12,14]. Induction of the SA pathway leads to transcription of NONEXPRESSOR OF PATHOGENESIS-RELATED GENES1 (NPR1), which in turn leads to the production of antimicrobial PATHOGENESIS-RELATED (PR) proteins PR1, PR2 and PR5 locally and systemically [15,16]. SA plays a role during both pattern-triggered immunity and effector-triggered immunity, and in systemic defence response called systemic acquired resistance [17]. Conversely, the JA pathway activates the induction of plant defensin 1.2 (PDF1.2), PR3, PR4 and PR12, which accumulate locally [12,15]. JA and ET function in both resistance to necrotrophic pathogens and wound responses [18,19]. Accordingly, when a hemibiotrophic pathogen is encountered, a biphasic hormonal response ensues, with SA observed during the biotrophic phase and JA/ET during the necrotrophic phase [20,21,22].
The above-mentioned phytohormone response model stems mainly from research aimed at deciphering the molecular response of foliar tissues [11,23,24,25,26,27,28]. From these model systems, it is evident that defence induction involving pathogen recognition receptors and receptor-like kinases, and alterations in primary metabolism is among some of the responses specific to the biotrophic phase. Conversely, cell wall lignification, secondary metabolism and cell death-associated pathways are some of the responses specific to the necrotrophic phase. The molecular mechanisms underlying plant defences in leaves and stems are better understood than for below-ground root responses to soil-borne hemibiotrophic pathogens. Previous work has postulated that root responses to pathogens differ to those induced in leaves [29,30,31]. However, some similarities in root responses to those of leaves have been observed during similar phases of hemibiotrophic infection. For instance, during biotrophic growth of P. parasitica in Arabidopsis roots, both primary metabolism, e.g., glycolysis and receptor kinase were observed to be down-regulated [32]. Primary metabolism is also altered in Arabidopsis during this phase of infection by Verticillium dahlia with amino acid metabolism observed down-regulated while sugar metabolism was up-regulated [33]. During the necrotrophic phase, induction of secondary metabolism related to phytoalexin and defence-related gene expression have been observed in the soybean/P. sojae pathosystem [34,35]. While some similarities in root responses to leaf responses exist, the role played by phytohormones in roots is less understood. During infection of Arabidopsis roots by Phytophthora parasitica, SA and JA responses are both activated transiently during penetration but down-regulated during further invasive growth, whereas ET responses were up-regulated during these phases [36]. In addition, Arabidopsis roots infected with root hemibiotroph Fusarium oxysporum display an induction of JA and ET pathways while SA pathways are repressed during both biotrophic and BNS phases [30]. This suggests that root responses to hemibiotrophic pathogens may not reflect results found in foliar pathosystems.
With the increasing number of sequenced plant genomes, new model systems should be considered to broaden our understanding of root responses to hemibiotrophic pathogens, especially within agriculturally relevant systems. An emerging model for root hemibiotrophic pathogenesis is the interaction between Cicer arietinum (chickpea) and Phytophthora medicaginis [37,38]. Chickpea is an agronomically important crop worldwide due to its high nutritional value and in developing countries, where it provides an inexpensive source of protein [39]. P. medicaginis is a root rot pathogen of chickpea causing losses of >50% during above-average rainfall conditions [40]. During early phases of infection, P. medicaginis hyphae grow intercellularly while haustoria develop intracellularly, suggesting an initial phase of biotrophy as has been observed for other root Phytophthora spp. such as P. sojae [41,42]. Later in infection, P. medicaginis then switches to cause root rot associated with hyphal ramification and sporulation within diseased roots [43,44,45]. To date, the timing of the phases of P. medicaginis hemibiotrophic infection in chickpea roots have not been mapped out. The availability of the chickpea Desi genome has provided a valuable resource to decipher the plant response to abiotic stress, i.e., drought and salt stress [46] and, thus far, the defence response of chickpea to P. medicaginis has only been reported for early stages of infection [37,47]. The enriched pathways in susceptible chickpea var. ‘Sonali’ that were repressed at this stage of infection included secondary metabolism and the hormone biosynthetic process while glucose homeostasis and response to ethylene stimulus were examples of induced pathways [37]. In susceptible chickpea var. ‘Rupali’ during early infection by P. medicaginis, some of the enriched pathways that were induced included catalytic activity, receptor activity and cell communication which were absent in resistant [47].
Using the C. arietinum/P. medicaginis root pathosystem, we sought to define the timing of the lifestyle switches from biotrophy to BNS to necrotrophy and then investigate the plant response during each of these phases. We chose to use a microcosm-based system to improve our control of the inoculation and to improve the reproducibility of the timing of the three phases. Based on previous research considering plant responses to hemibiotrophic pathogens, we initially hypothesized that: 1) defence responses would be suppressed during the biotrophic phases and induced during the necrotrophic phase, and 2) chickpea would display a biphasic response involving SA and JA during the biotrophic and necrotrophic phases, whereby SA would be highest during biotrophy and JA would be highest in necrotrophic tissues. Our results only partially supported these hypotheses, suggesting that a wider spectrum of plant–hemibiotrophic interactions need to be considered to better understand the basis of plant susceptibility to hemibiotrophic pathogens.

2. Materials and Methods

2.1. Plant Material and Phytophthora Inoculations

Seeds of the P. medicaginis root rot-susceptible Desi chickpea var. ‘Sonali’ were obtained from the New South Wales Departments of Primary Industries (NSW DPI, Tamworth, NSW, Australia). Seeds were surface sterilised (4% NaOCl solution for 15 min, 70% EtOH for ten minutes and sterile ddH2O rinse three times) before sowing on modified full-strength Murashige and Skoog agar plates (4.4% MS; 3% CaCO3, pH 7, 1.1% bacto agar) supplemented with Gamborg’s vitamins. Seedlings were grown in controlled growth chambers with a 15 h light/9 h dark cycle at 18 °C, 70% relative humidity and 500 μmol m−2 s−1 light intensity. Fifteen-day-old seedlings were used for inoculation.
P. medicaginis isolate TR7831 was isolated from soil collected from a chickpea paddock by the New South Wales Department of Primary Industries, Tamworth, Australia, and propagated on V8 juice agar plates (containing 200 mL L−1 V8TM bottled juice; 3.0 g L−1 CaCO3, 15.0 g L−1 agar) supplemented with ampicillin (100 μg mL−1) at 25 °C in the dark. Prior to inoculations, P. medicaginis was passaged through the host to ensure pathogenicity, and after reisolating on V8 juice agar plates supplemented with ampicillin (100 ug mL−1), the second re-culturing of P. medicaginis was used to prepare inoculum. P. medicaginis inoculum (third re-culturing) was prepared one day before inoculations by aseptically transferring mycelial agar blocks taken from the edge of an actively growing culture onto 0.5 × 0.5 mm2 sterile membranes overlaid on V8 juice agar plates. For mock plant inoculations, agar blocks without mycelia were transferred onto 0.5 × 0.5 mm2 sterile membranes blocks overlaid onto V8 agar plates. For P. medicaginis axenic cultures, agar blocks carrying mycelium were transferred onto membranes overlaid on V8 agar plates. All plates were incubated for 12 h overnight at 25 °C in the dark. For inoculations, membranes carrying agar blocks with P. medicaginis mycelium were placed in direct physical contact with the root (to ensure a definitive “0 h” time for all experiments), at a point 1.5 cm from the tip of fifteen-day-old seedlings. For mock inoculations, membranes carrying agar blocks without mycelium were placed as above onto the roots of seedlings. After inoculations, seedlings were replaced into growth chamber using the same conditions as above.

2.2. Electrolyte Leakage Root Cell Death Assay

Relative electrolyte leakage from P. medicaginis inoculated and mock-inoculated chickpea roots was performed according to the method by [48] with modifications. Briefly, two 1.5 cm root segments, with the P. medicaginis inoculated site centred in the segment, were harvested alongside mock-inoculated roots at 12, 24, 36, 48, 60, 72 and 120 h post-inoculation (hpi) and submerged in 5 mL of ddH20 for one h. The two 1.5 cm segments constituted a single sample unit/biological replicate. The electrolyte conductivity of three technical replicates per plant were measured using an Ohaus 300C portable conductivity meter with an IC-STCON3 electrode (Instrument Choice, Adelaide, Australia), with these samples taken from six control and six inoculated plants at each timepoint (i.e., 6 biological replicates per timepoint). Samples were then placed at 95 °C for one h to lyse all cells. After cooling samples to room temperature, electrolyte conductivity was again measured for all samples. The relative electrolyte conductivity was determined by calculating the percentage of electrolyte leakage before boiling relative to post-boiling of root samples. Larger ion conductivity in pre-boiled samples indicated greater cell disruption/death. The relative electrolyte leakage values were converted to a proportion and arcsine transformed due to the uneven variance of the non-transformed data. The data were analysed using ANOVA, with values for each plant considered a replicate for the factors time in hpi and P. medicaginis treatment (inoculated or mock-inoculated control). All analyses were conducted in GenStat [49]. Significant difference between inoculated and mock-inoculated control was determined using Least significant difference (LSD). The data were visualised in R v.4.0.0 [50].

2.3. Macroscopic Assessment of Symptoms

Macroscopic observation of symptoms in roots of chickpea seedlings following P. medicaginis inoculation and mock inoculation was performed every 12 h over five days as above. The biotrophic phase was defined as the time from inoculation until just before the first appearance of water soaking. Water soaking is when a wet, translucent, and sunken appearance appears on the root at the site of inoculation. The period during which a dark brown necrotic lesion was observed was defined as the necrotrophic phase. The ‘switch’ phase was defined as the period between the first appearance of water soaking and the first appearance of necrotic lesions in combination with electrolyte leakage analysis as described above. None of the images taken at the mentioned timepoints were modified.

2.4. Root Cell Viability Analysis

Chickpea var. ‘Sonali’ root segments of 1.5 cm in length were harvested from an area of the root surrounding the P. medicaginis inoculated site at 12, 24 and 72 hpi, alongside mock-inoculated site. All roots were washed three times with 1× phosphate-buffered saline (PBS; pH 7.4) and stained with a combined fluorescein diacetate (FDA; 10 µg mL−1) and propidium iodide (PI; 50 µg mL−1) live/dead cell staining solution for 15 min. The roots were washed three times with 1x PBS (pH 7.4) for 3 min at each wash and observed by confocal microscopy using a TCS SP5 confocal laser scanning microscope (Leica, Sydney, Australia). To detect FDA, the argon laser was used with an excitation wavelength of 488 nm and emission detection wavelengths of 500–550 nm. Detection of PI was carried out with a 561 DPSS laser with an excitation wavelength of 561 nm and emission detection wavelengths of 580–660 nm. Using a 20× objective the number of living cells and dead cells were counted in one field of view, the first layer of epidermal cells. The proportion of living to dead cells were determined for each timepoint and mock-inoculation. Data visualisation was performed in excel and statistical analysis of data was performed using ANOVA with the Tukey method and car package in R v.4.1.0 [51,52]. Post hoc comparison among groups was performed using the emmeans package in R v4.1.0 [51,53].

2.5. Propidium Iodide/Wheat Germ Agglutinin Staining and Confocal Microscopy

Root segments of 1.5 cm in length surrounding the inoculated site were harvested from P. medicaginis inoculated and mock-inoculated seedlings at 12, 24, and 72 hpi as above and fixed in 4% paraformaldehyde (Sigma-Aldrich, Castle Hill, Australia) at 4 °C. A portion of roots from each treatment were further rinsed three times with 1× PBS (pH 7.4) and cut into approximately 0.5 cm portions before embedding in 6% agarose and stored at 4 °C for 24 h, after which they were sectioned. Longitudinal root sections (30 µm in thickness) were cut using a vibratome 7000smz-2 (Campden Instruments, Lafayette, Indiana) and stored in 1× PBS (pH 7.4) at 4 °C until staining. For staining, roots were rinsed three times with 1× PBS (pH 7.4) prior to co-staining with Wheat Germ Agglutinin labelled fluorescein isothiocyanate (WGA-FITC; 100 µg mL−1) for 15 min and PI (20 µg mL−1) for 10 min. WGA-FITC stains the cell walls of certain oomycetes while PI stains the cell walls of plant cells [54,55]. The roots were washed 3 times with 1× PBS (pH 7.4), then transferred to new PBS (pH 7.4) and stored at 4 °C in the dark until analysis by confocal microscopy. Confocal microscopy was carried out on a TCS SP5 confocal laser scanning microscope (Leica, Sydney, Australia). To detect WGA-FITC, the argon laser was used with an excitation wavelength of 488 nm and emission detection wavelengths of 500–550 nm. Detection of PI was carried out with a 561 DPSS laser with an excitation wavelength of 561 nm and emission detection wavelengths of 580–660 nm. Z-stack images were taken to generate a 3D reconstruction of the inoculated site with a Z step size of 0.5–1 and frame average of 3.

2.6. RNA-Sequencing and Data Analysis

Root segments of 1.5 cm in total length from above and below the inoculated site were harvested from P. medicaginis inoculated seedlings at 12, 24, and 72 hpi, and mock-inoculated controls before snap freezing samples in liquid N2 and storing at −80 °C. P. medicaginis axenic cultures that had been growing on modified full-strength MS media (same media as used for chickpea growth and pathogenesis experiments) for 12 h were harvested, snap frozen in liquid N2 and stored at −80 °C. RNA was extracted from four independent biological replicate samples for inoculated and mock-inoculated controls using the Bioline Plant II RNA extraction kit (Bioline, Eveleigh, Australia) according to the manufacturer’s guidelines. Poly-A RNA libraries were prepared and sequenced by GENEWIZ (Suzhou, China) using an Illumina HiSeq 2000 platform and 150 bp paired-end configuration. Raw RNA-seq reads were trimmed to remove low-quality sequences and adapters, and then aligned to the primary transcripts of the Cicer arietinum Desi genome [46] using CLC Genomics Workbench v.10.0.0 (Qiagen, Victoria, Australia). For the alignment, the minimum length fraction was set to 0.9, the minimum similarity fraction 0.9 and the maximum number of hits per read was 10. The total read counts for each transcript was determined and normalised to reads per kilobase of transcript, per million mapped reads using the RNA-Seq Analysis function in CLC Genomics Workbench v.10.0.0 (Qiagen, Victoria, Australia). Only transcripts that had an average normalised count of more than 10 in at least one of the timepoints or control were considered for further analysis. The Bioconductor package DESeq2 v.1.26.0 [56] was used to normalise raw transcript counts and identify statistically significant C. arietinum differentially expressed genes (DEGs) using the Benjamini–Hochberg test for multiple testing with a false discovery rate (FDR) to control for false positives and negatives. A principal component analysis (PCA) was performed using the C. arietinum transcripts to assess the variability between samples in R v.4.0.0 [50]. Only transcripts with a log2-fold change of −1 < log2FC > 1 compared to control and FDR-corrected p < 0.05 were kept for further analysis. The number of significantly differentially regulated genes at each of the timepoints was determined and visualised using R v.4.0.0 [50]. The log2-transformed data of differentially regulated genes as compared to control that were significant in at least one of the timepoints were visualised by heatmap using Morpheus and hierarchical clustered using Euclidean distance by genes according to the expression patterns (https://software.broadinstitute.org/morpheus/, accessed on 25 April 2020).

2.7. Quantitative PCR Expression Validation of RNA Sequencing

Root samples from the timecourse of colonisation were snap frozen in liquid nitrogen and their RNA extracted as described above. RNA transcript quantitation by Q-PCR was used to verify that a selection of genes showing different expression patterns were differentially regulated as expected. Briefly, total RNA (1 μg) was used for generation of cDNA using the Tetro cDNA Synthesis kit using only the Oligo dT18 primer (Bioline, Sydney, Australia). Q-PCR performed using 5× diluted cDNA and Bioline SensiFast no ROX Q-PCR mix using the primers detailed in Supplementary Table S1. Two genes were utilized to normalise all results (Ca_00593, Ca_08899). At the end of each Q-PCR run, a dissociation curve assay (from 95 to 65 °C) was performed to ensure the specificity of each reaction. A total of three biological replicates per treatment were used to determine expression levels of each gene. Relative expression was determined using the 2−ΔΔCT method, whereby mock-inoculated chickpea roots were used as a control for the timecourse.

2.8. Gene Ontology (GO) Enrichment Analysis of the Unique Gene Sets at Each Phase

Significantly DEGs were identified from the above analysis for the timepoints 12, 24, and 72 h post-P. medicaginis inoculation to identify unique responses during successive phases in disease progression. Gene lists that were up-regulated or down-regulated in each of the timepoints were uploaded into Venny v.2.1.0 (https://bioinfogp.cnb.csic.es/tools/venny/, accessed on 25 April 2020) to identify the genes that were uniquely regulated in each of the timepoints. The uniquely regulated gene lists for each of the timepoints were then combined and used to perform GO enrichment using the TopGO v.2.36.0 package in R v.4.0.0 [50,57]. Enrichment was also performed separately for the up-regulated and down-regulated gene lists at each of the timepoints. The classic algorithm was used to run the GO enrichment test in the biological process category. Enrichment was performed with the C. arietinum Desi genome as the gene universe, and the gene-to-GO map file used was generated from the C. arietinum annotation file in R. Fisher’s exact test was used to calculate p-value’s and the topNodes parameter was set to 50 to return the top 50 GO terms. Only GO terms with a p < 0.05 were used for further investigation. The top 20 GO terms for each timepoint with the number of significant genes and p-values for each term were visualised using R v.4.0.0 [50].

2.9. Expression Analysis of Chickpea Hormone Pathway Related Genes

Genes relating to the biosynthesis, signalling and downstream response for defence phytohormones, SA, JA and ET were identified from previous publications and the chickpea Desi genome annotation [46]. We also validated a selection of these annotations within the hormone perception/signalling pathways through BLAST search of the chickpea genome with Arabidopsis genes (Supplementary Tables S2 and S3). Only those genes that were differentially regulated as compared to the control were used for further analysis. The log2-transformed data of the differentially regulated phytohormone-related genes as compared to control were visualised by heatmap using Morpheus (https://software.broadinstitute.org/morpheus/).

2.10. In Vivo Root Salicylic and Jasmonic Acid Measurements

Roots from the same timepoints used for RNA sequencing were snap frozen in liquid N2 and stored at −80 °C prior to hormone extraction. SA and JA were extracted from four replicate samples for both inoculated and control seedlings according to the method of Hall et al. 2019 with modifications. Briefly, approximately 50 mg ground root tissue per sample was extracted with 70% methanol spiked with [2H4]-Salicylic acid (Olchemim, Olomouc, Czech Republic), Jasmonic-d5 Acid (2,4,-d3; acetyl-2,2-d2; CND isotopes, Quebec, Canada), and [2H2]N-[(-)-Jasmonoyl-Isoleucine (OIChemIm, Czech Republic), to yield a final concentration of 100 ppb. Subsequently, the samples were mixed using a rotor mixer at 80 rpm for 30 min at 4 °C and then centrifuging at 12,000 rpm for 5 min at room temperature. The extracts were analysed by UPLC/ESI-MS/MS using Acquity UHPLC coupled to a Xevo triple quadrupole mass spectrometer (Waters Corporation, Milford, Massachusetts). Five microlitres of extract were injected into a 2.1 mm × 50 mm × 1.7 µm, C18 reverse phase column. To identify SA, JA, and JA-Ile, comparisons were made to the fragmentation pattern of pure standards. A standard calibration curve was used to quantify the amount of each hormone and adjusted for sample recovery as compared to the internal standard. Fresh weight of each sample was used to standardise the final concentrations, and data were analysed and visualised using R v.4.0.0 [50].

3. Results

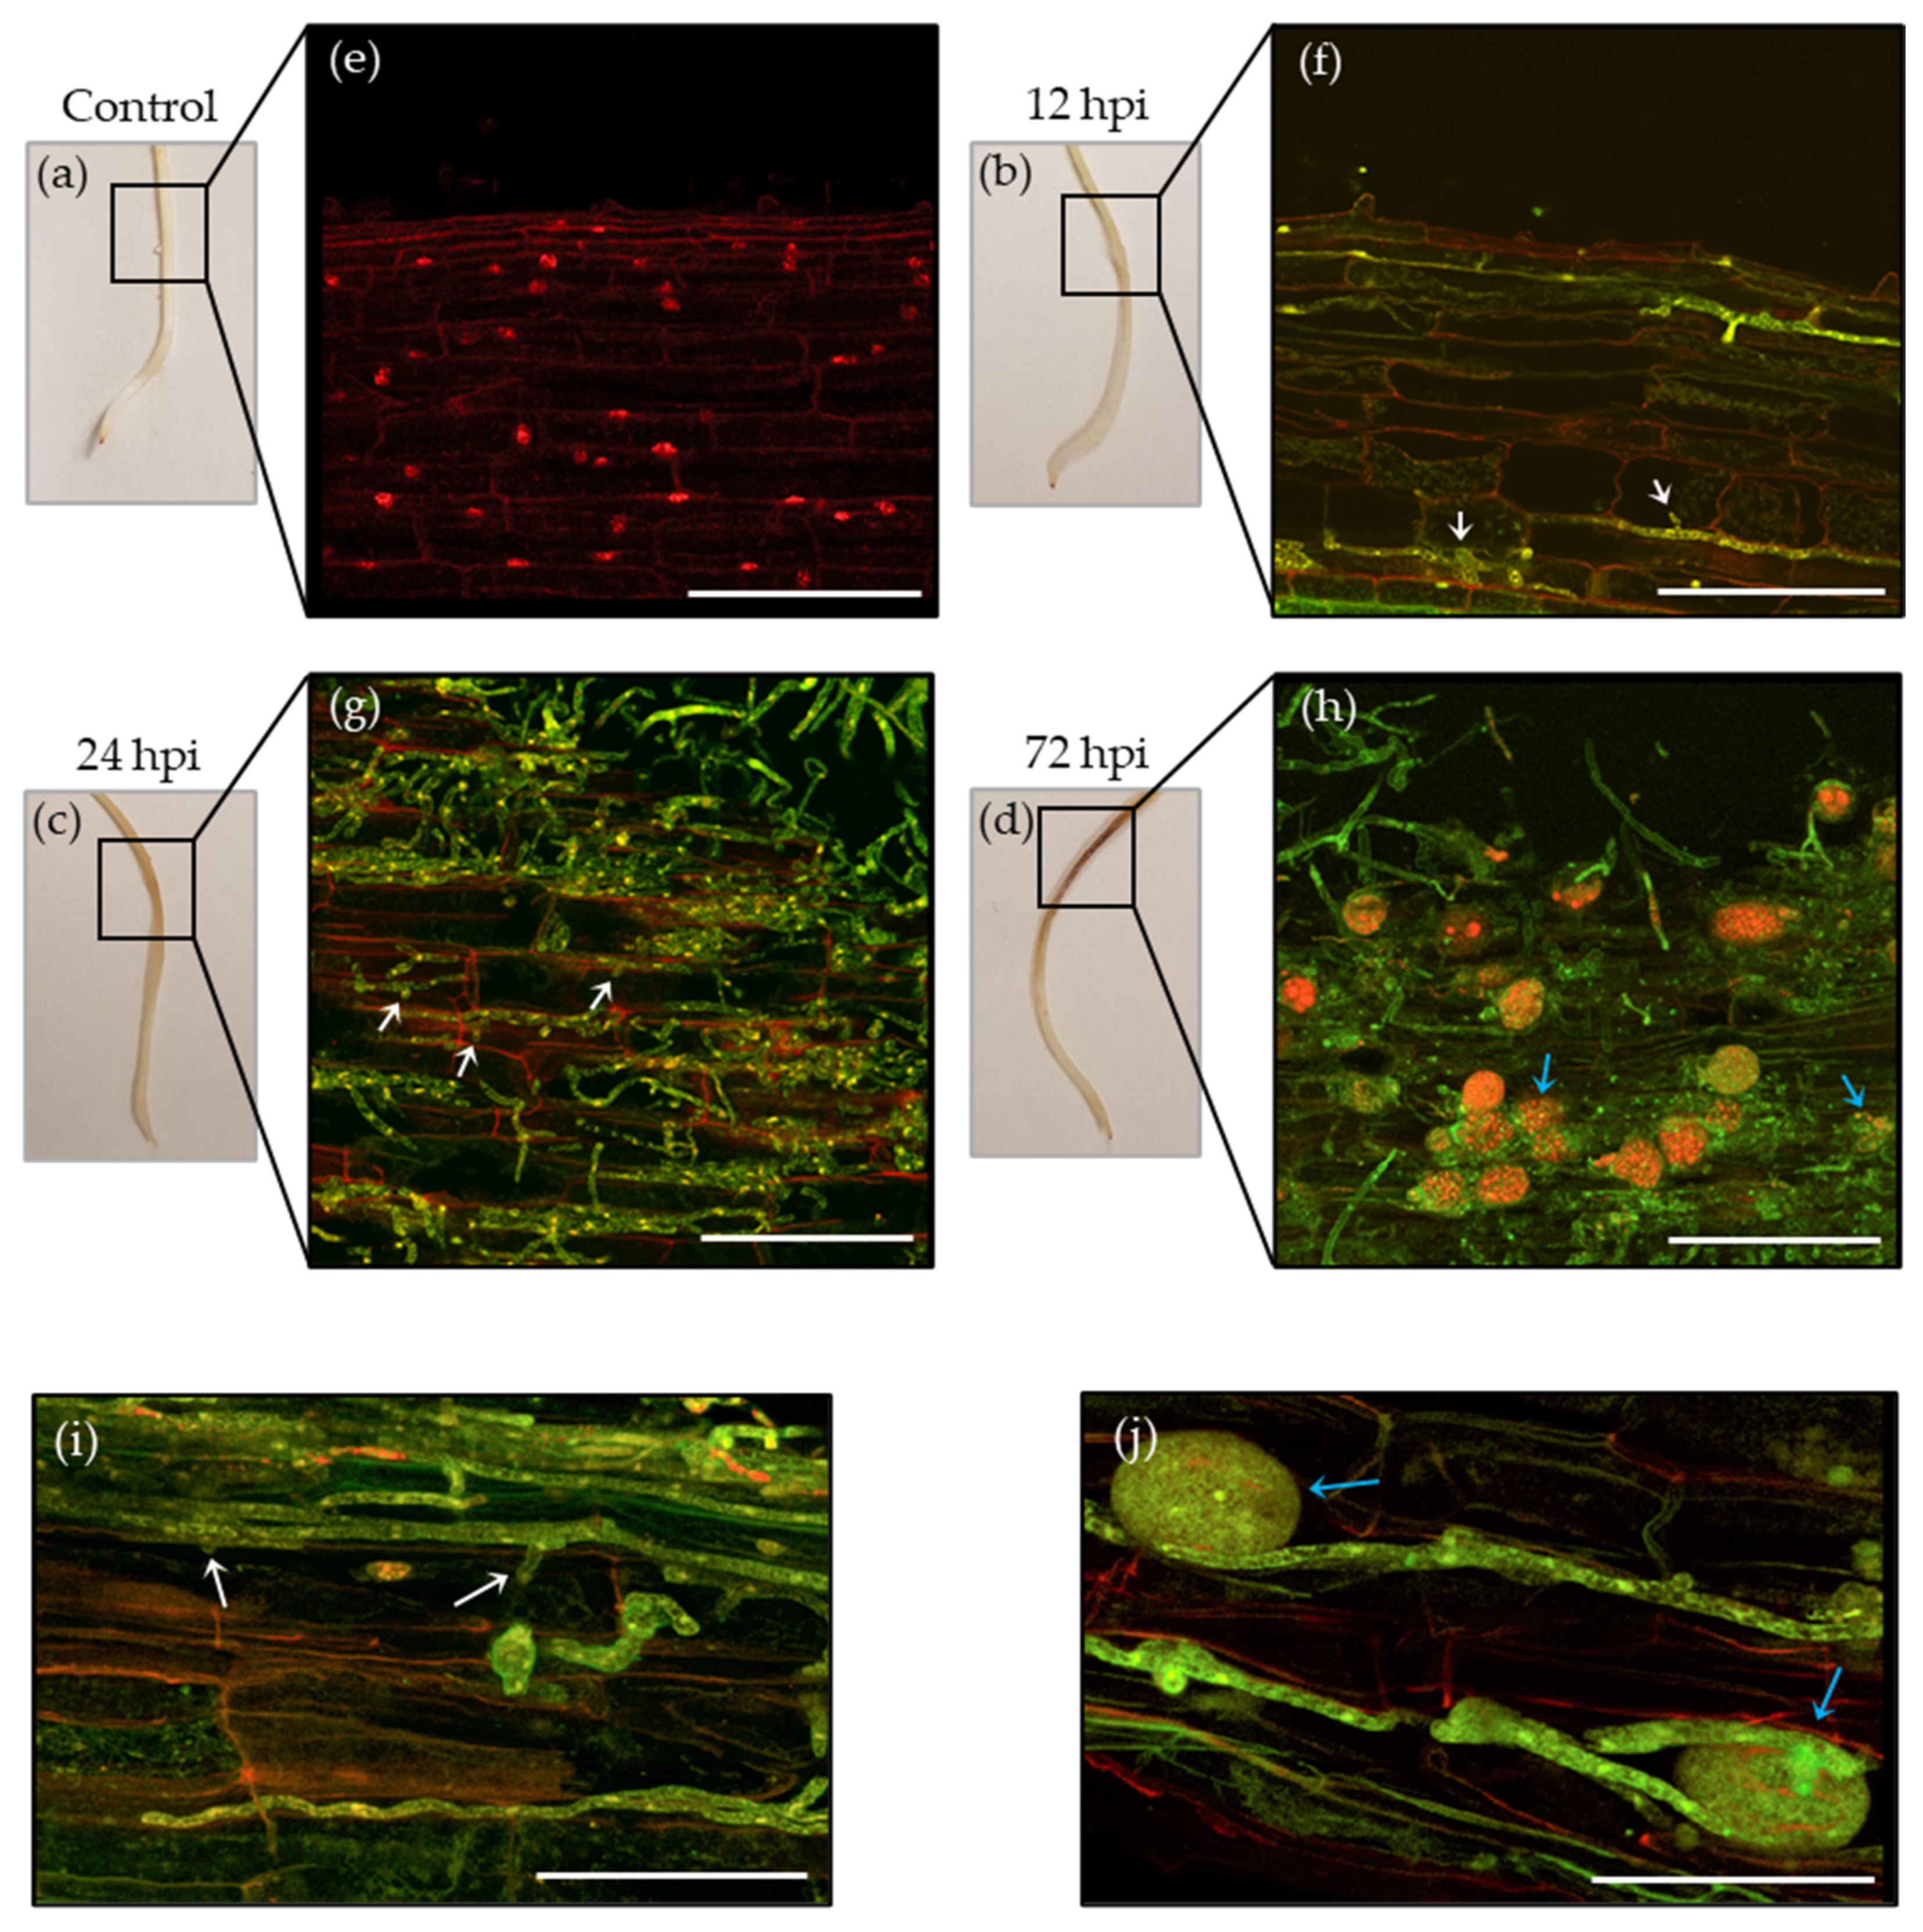
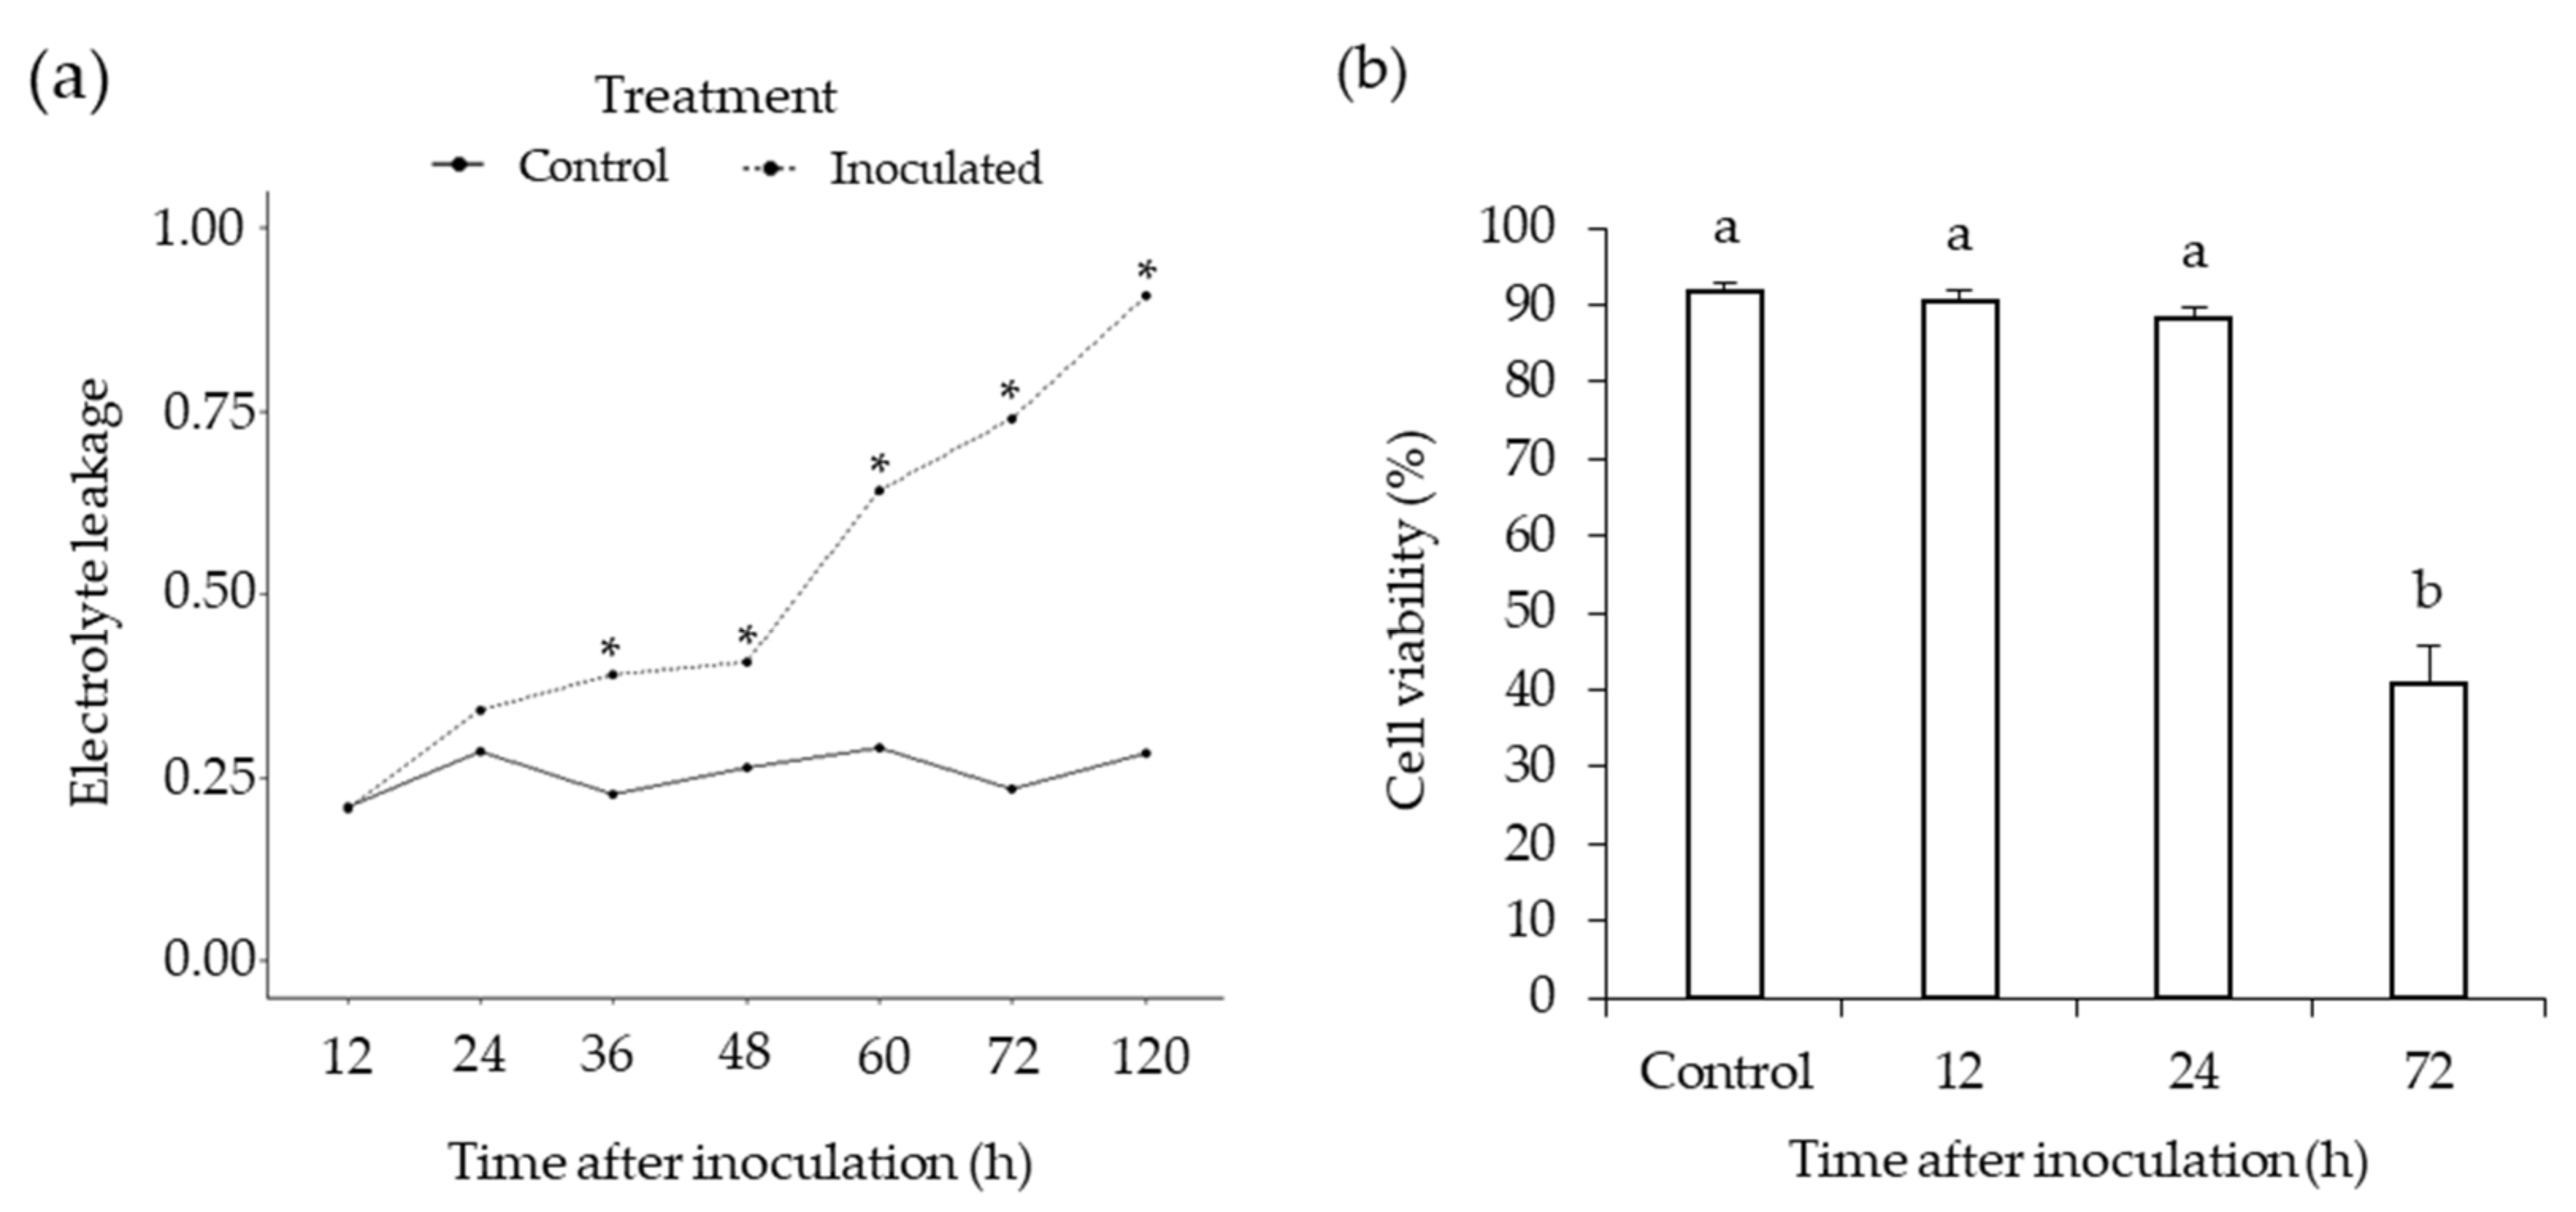
3.1. Phytophthora Medicaginis Infection of Chickpea Roots Features an Early Switch from Biotrophy to Necrotrophy

To establish the timeline during which P. medicaginis exhibited a biotrophic phase, and when the switch occurred to necrotrophy in the Desi chickpea var. ‘Sonali’, we used four methods: macroscopic assessment of symptoms on roots, microscopic evaluation of P. medicaginis development, ion leakage analysis, and cell viability stains to determine when significant root cell death occurred. From the macroscopic assessment of chickpea roots, no symptoms were observed at the inoculated site until after 12 hpi as compared to the mock-inoculated control (Figure 1a,b). At 24 hpi, water soaking was evident, whereby roots exhibited a wet, sunken, and translucent appearance in the infected area (Figure 1c). By 72 hpi, a dark brown lesion was observed which indicated that necrosis had occurred at the inoculated site (Figure 1d). Invading hyphae of P. medicaginis stained green with fluorescently tagged WGA were observed penetrating the cortical cell layer of chickpea roots at 12 hpi with haustoria-like penetrating root cells indicated by white arrows (Figure 1e,f). At 24 hpi, P. medicaginis hyphae were observed penetrating deeper into the cortical cell layer of chickpea roots with both intracellular and intercellular hyphal growth visibly present (Figure 1g). Furthermore, haustoria-like structures indicated by white arrows were also observed within root cells at 24 hpi (Figure 1g,i). By 72 hpi intercellular and intracellular hyphal ramification and sporulation (blue arrows) was observed between plant cells and root surface (Figure 1h,j).
Plant cell death assays, based on the percentage of ion leakage from the roots, were performed to quantitatively verify when P. medicaginis switched to the necrotrophic phase. A baseline level of ~25% electrolyte leakage was observed in the control (Figure 2a), likely due to the excision sites from where the root was removed from the plant. We observed a similar level of leakage until 36 hpi after which there was significantly higher electrolyte leakage in the P. medicaginis inoculated roots compared to mock-inoculated tissues indicating the necrotrophic phase of infection had begun (Figure 2a). At 24 hpi, non-significant, but higher, electrolyte leakage was observed in P. medicaginis inoculated roots (Figure 2a), suggesting that this was the timepoint at which P. medicaginis began to switch from biotrophy to necrotrophy in our experimental system. We then performed cell viability staining of roots 12, 24, and 72 hpi to validate the timepoints for the phases of hemibiotrophic infection. The percentage of cell viability did not significantly differ between the control, 12 and 24 h timepoints post-inoculation indicating the cells were still living at these timepoints (p > 0.05, Figure 2b). While non-significant, cell viability was 3.4% lower at 24 hpi compared to the control, corroborating the ion leakage results and macroscopic observation that the switch from biotrophy to necrotrophy was in the process of occurring (p > 0.05, Figure 2b). At 72 hpi we found that, compared to the control, 51% fewer cells were alive (p < 0.0001; Figure 2b). These data suggest that through the first 24 h, P. medicaginis remains biotrophic before switching to necrotrophy (Figure 2b). Based on these results, we continued with further investigation of differences in chickpea root physiology at 12, 24, and 72 hpi as they represented the biotrophic, BNS, and necrotrophic phases of infection for P. medicaginis, respectively.

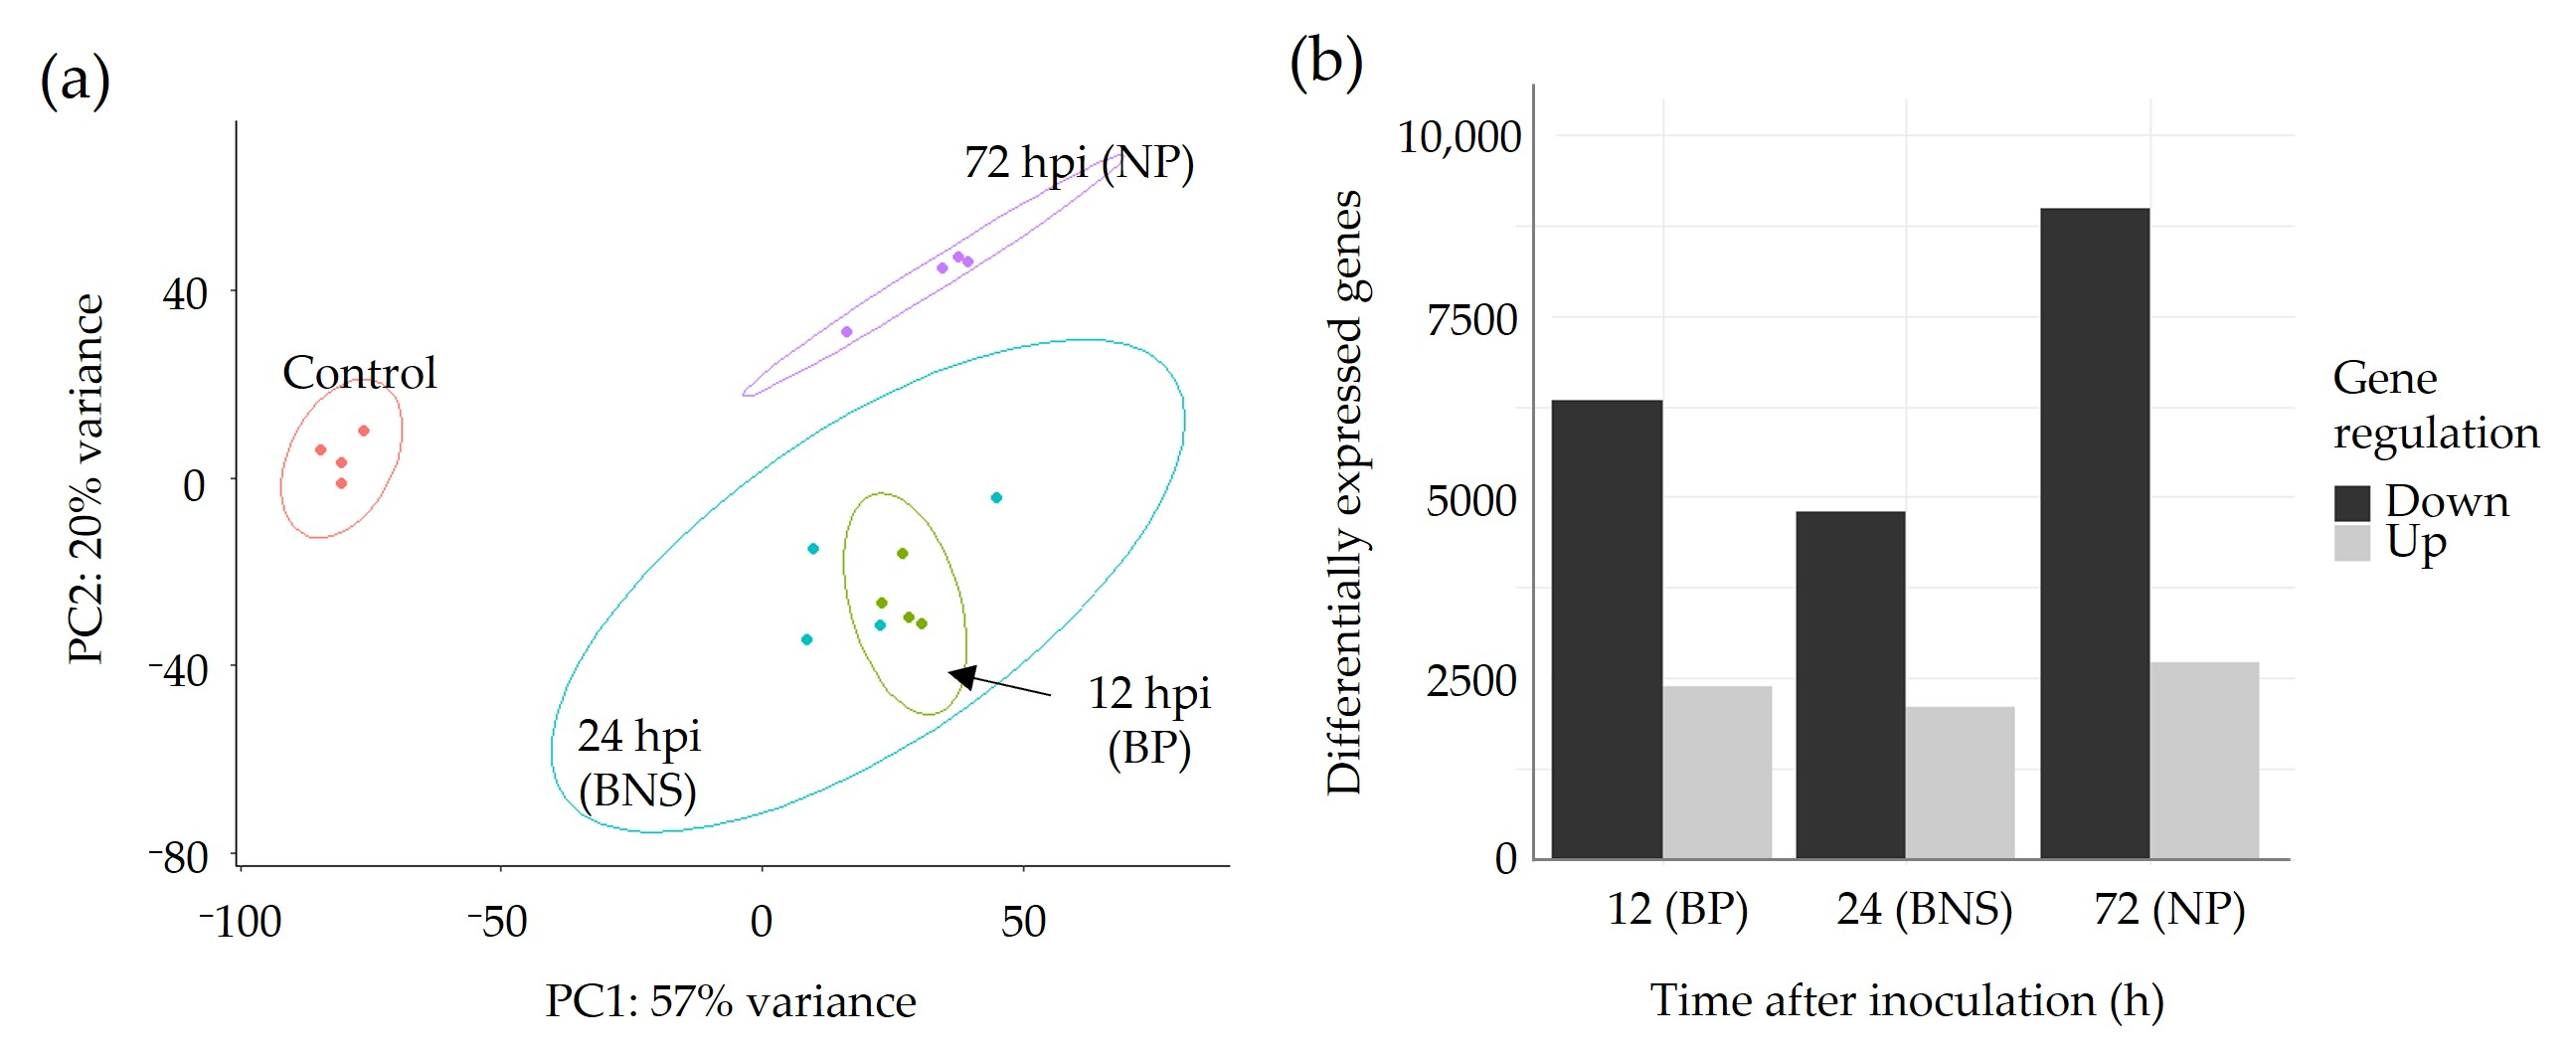
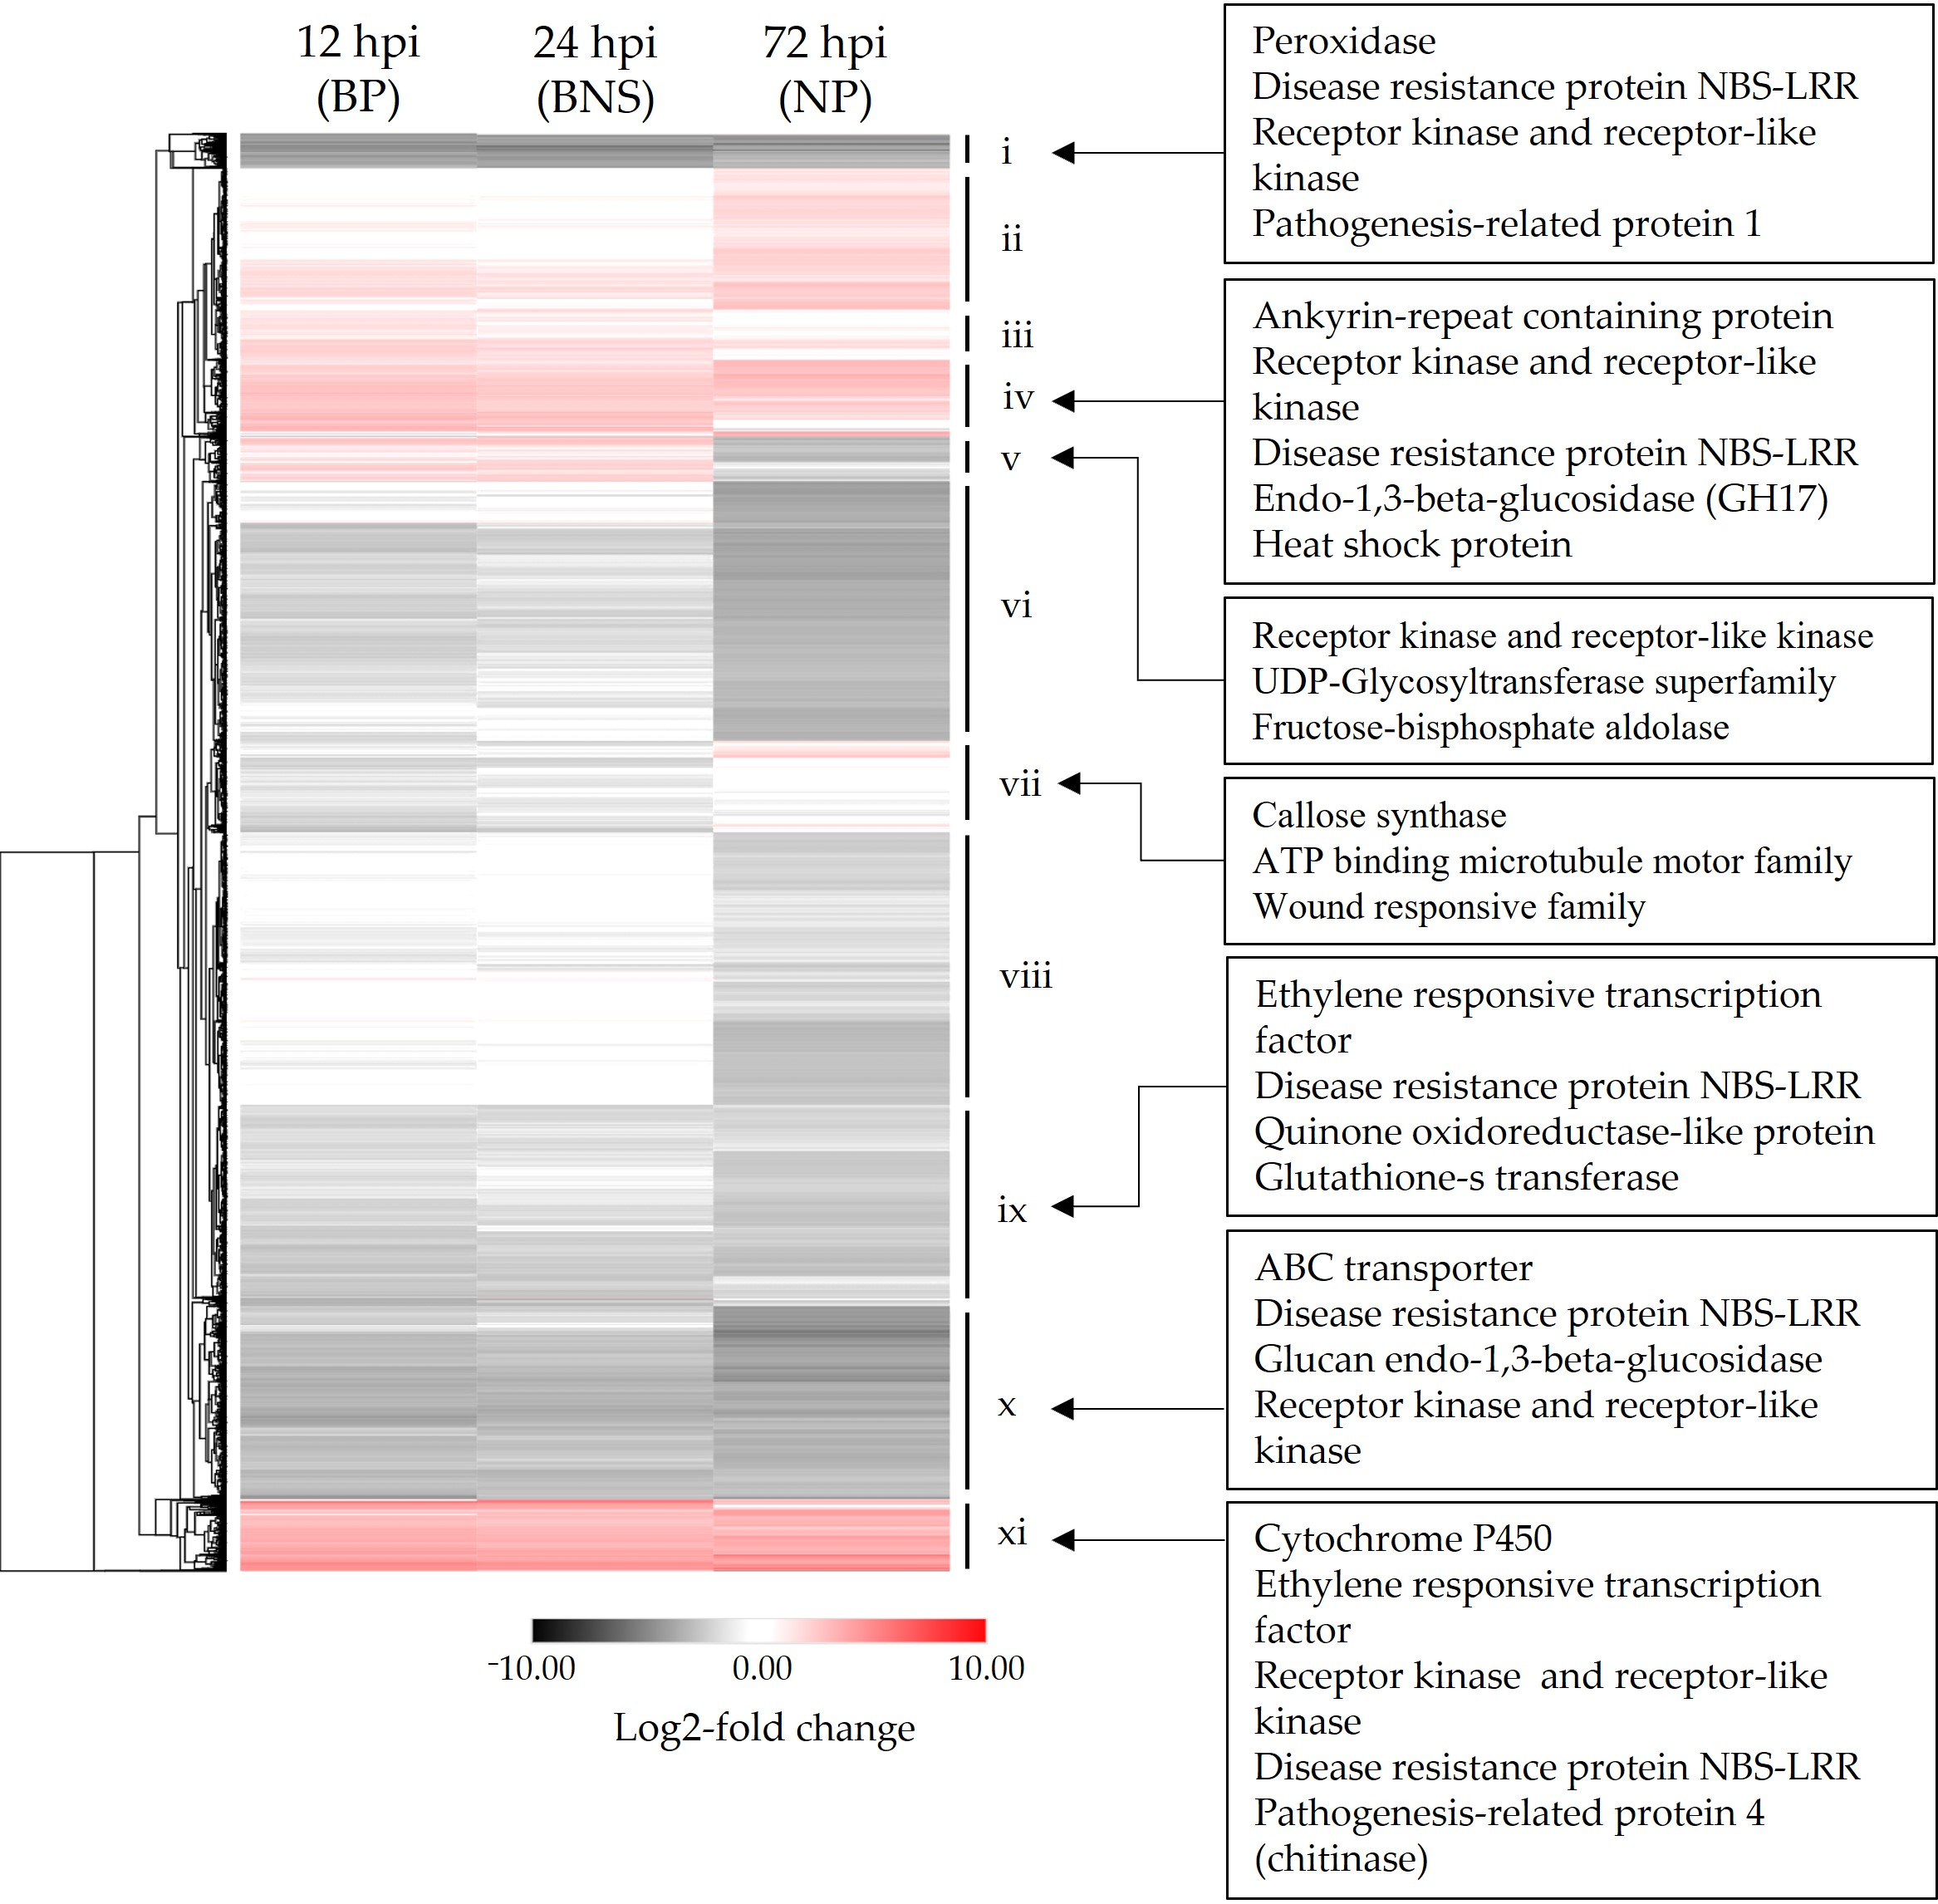
3.2. A Large Percentage of the Chickpea Genome Is Responsive to Phytophthora Infection

To investigate the transcriptomic response of chickpea roots during the three phases of P. medicaginis colonisation, RNA was sequenced from mock-inoculated roots, and from P. medicaginis inoculated roots at 12, 24, and 72 hpi. A PCA, annotated with 95% confidence ellipses, was performed to explore the degree of transcriptional similarity between samples. PC1 explained 57% of the variation, separating the samples by inoculated versus control (Figure 3a). This indicates that the major source of variation among the samples was the presence of P. medicaginis. Samples from the biotrophic and BNS phases (i.e., 12 and 24 hpi, respectively) clustered together, but were distinct from mock inoculation and the 72 hpi necrotrophic phase samples. Assessment of the significantly DEGs (1 < log2FC > −1; p < 0.05) across all the timepoints revealed that a total of 13,568 genes, or ~45% of the chickpea genome, were significantly differentially expressed in chickpea roots following P. medicaginis inoculation in at least one of the timepoints (Supplementary Table S4). The expression of a number of chickpea DEGs were chosen for verification using quantitative PCR (Supplementary Figure S1). The trends of gene expression patterns were corroborated using this technique.
During the biotrophic phase, 2385 chickpea genes were up-regulated, and 6331 genes were down-regulated (12 hpi; Figure 3b). The lowest number of chickpea DEGs during the timecourse were observed during the BNS phase with 2109 genes up-regulated and 4795 genes down-regulated (24 hpi; Figure 3b). The highest number of chickpea DEGs were found during the necrotrophic phase with 2708 genes up-regulated and 8984 genes down-regulated (72 hpi; Figure 3b). We then sought to investigate the expression patterns of the DEGs to identify gene expression clusters. In total, eleven clusters (i–xi) were identified. Clusters ii, iii, v-viii displayed opposing regulation between the necrotrophic phase and the biotrophic/BNS phases (Figure 4, Supplementary Table S4). Genes within cluster vi were induced during biotrophic and BNS phases while being repressed during necrotrophy with functions in signal transduction (e.g., receptor kinase) and primary metabolism (e.g., UDP-glycosyltransferase superfamily and fructose-bisphosphate aldolase; Figure 4, Supplementary Table S4). Cluster vii contained genes that were induced during necrotrophy and repressed during the earlier phases, with functions in cell growth (e.g., microtubule motor protein) and defence (e.g., callose synthase, wound responsive genes families; Figure 4, Supplementary Table S4). Clusters iv and xi contained 1397 genes that displayed significant up-regulation across the three phases and included genes with known disease function such as LysM- and chitin-domain receptor kinases, disease resistance proteins, glucan endo-1,3-beta-glucosidases and PR-4 (chitinase; Figure 4, Supplementary Table S4). Clusters i, ix, and x contained 4045 genes that displayed significant down-regulation across the three phases and included genes with known disease function such as ethylene responsive transcription factor, PR-1, glutathione-s-transferase, ABC transporters, and disease resistance proteins (Figure 4, Supplementary Table S4).
A Venn analysis found that approximately 40% of the significantly up-regulated genes were unique to a phase of infection irrespective of timepoint (red Venn diagram), a similar observation in the case of the significantly down-regulated genes (black Venn diagram; Figure 5a). GO analysis based on biological process classifications revealed that the combined unique up- and down-regulated DEGs during the biotrophic phase at 12 hpi were principally involved in protein modification (e.g., protein phosphorylation) and primary metabolic processes (e.g., tricarboxylic acid cycle and glutamine family amino acid biosynthetic process; Figure 5b, Supplementary Table S5). Further investigation revealed that these processes were also among the enriched terms for the uniquely up-regulated genes at the biotrophic phase (12 hpi), whereas the glucan biosynthetic process, the organic cyclic compound metabolic process, the sucrose biosynthetic process and the cellulose biosynthetic process were among the top significant terms enriched for the uniquely down-regulated genes (Supplementary Table S5). The top pathways with functional enrichment during the BNS phase include nucleotide biosynthesis (i.e., the purine ribonucleoside monophosphate biosynthetic process) and metabolic processes (e.g., the fructose 6-phosphate metabolic process; Figure 5b, Supplementary Table S5). In addition to the above-mentioned processes, gas transport and regulation of response to stimulus were among the most significantly enriched terms during the BNS while the pyrimidine nucleoside catabolic process, the arginine biosynthetic process and the Mo-molybdopterin cofactor biosynthetic process were among the significantly enriched terms for the uniquely down-regulated genes at this timepoint (Supplementary Table S5). During the necrotrophic phase at 72 hpi, GO analysis revealed that pathways principally involved in both primary and secondary metabolic processes and plant defence phytohormone pathways including salicylic acid signalling were significantly enriched for the combined unique genes (Figure 5b, Supplementary Table S5). The significant terms enriched for the uniquely up-regulated genes at the phase included the spermine metabolic process, response to wounding, cellular response to oxygen-containing compounds and the lipid metabolic process, whereas for the uniquely down-regulated genes, the peptide biosynthetic process, gene expression, cell redox homeostasis and intracellular transport were among the terms significantly enriched (Supplementary Table S5).

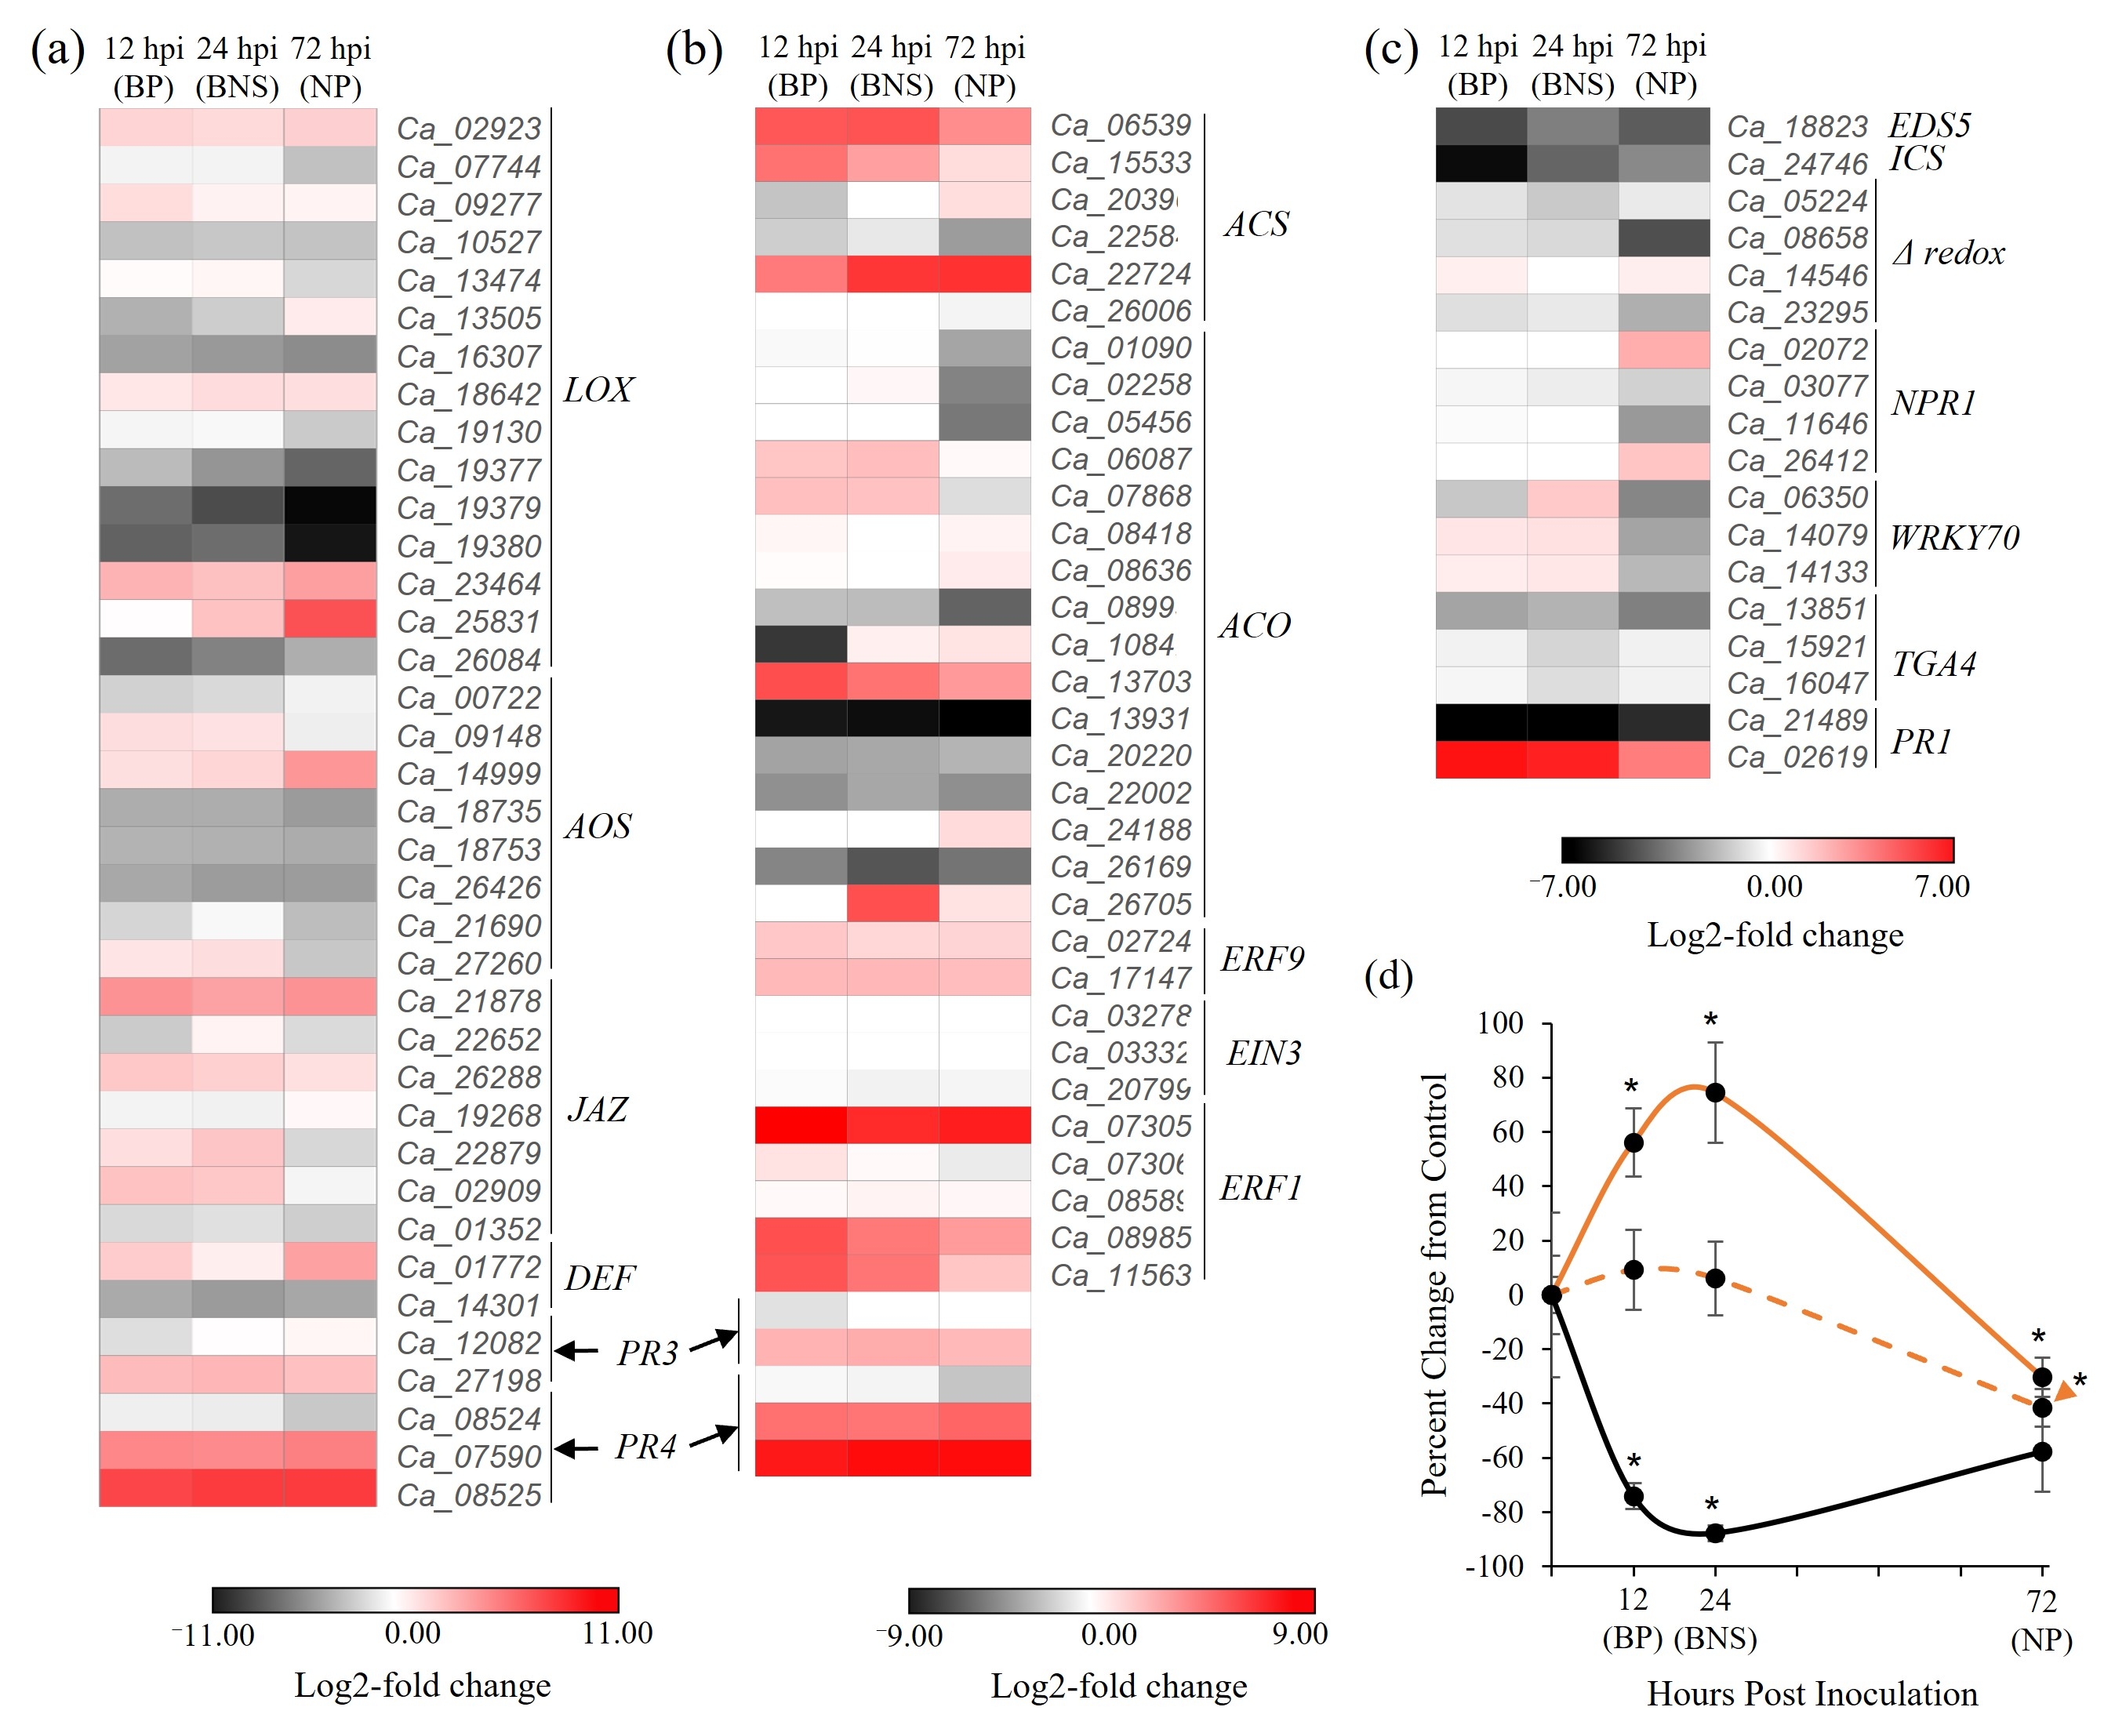
3.3. Chickpea Root Phytohormone Responses Do Not Conform to the Classical Leaf Model for Hemibiotrophic Pathogenesis

To gain further insight into phytohormone signalling in chickpea roots during the biotrophic to necrotrophic switch of P. medicaginis, an expression analysis of marker genes involved in the synthesis, signal transduction, and downstream responses of the JA, ET, and SA signalling pathways was extracted from the RNA-seq dataset. Orthologous genes involved in JA biosynthesis showed a mixture of expression across the timepoints with some LIPOXYGENASE (LOX) genes such as Ca_19377, Ca_19379, and Ca_19380 showing increasing repression along the progression of P. medicaginis infection, while others such was Ca_02923, Ca_18642, and Ca_23464 all showed universal induction during pathogenesis. Two ALLENE OXIDE SYNTHASE (AOS; Ca_09148, Ca_27206), meanwhile, exhibited higher induction during the early phases of colonisation. Within the JA signalling pathways, one defensin-like gene (Ca _01772), one PR3 (Ca_27198) and two PR4 (Ca_07590, Ca_08525) were highly up-regulated across the timecourse (Figure 6a). Within the ET pathway, two genes involved in the first step of biosynthesis (ACC SYNTHASE; ACS, Ca_06539, Ca_15533) were highly induced in the biotrophic and BNS phases while a third showed increasing expression across the timecourse (Ca_22724; Figure 6b). With respect to genes involved in the rate-limiting step of biosynthesis, the step controlled by ACC OXIDASE (ACO), four genes were most highly induced in the biotrophic and BNS phases while the remainder showed either no differential expression across the three phases, or were down-regulated. One of the key families of ethylene response factors (ETHYLENE RESPONSE FACTOR1; ERF1) showed the highest expression during biotrophy followed by attenuated induction across the BNS and necrotrophic phases (Figure 6b). Analysis of the SA pathway revealed that the genes associated with hormone biosynthesis were most heavily repressed during biotrophy (Figure 6c). Similarly, genes encoding orthologues of the SA receptor NPR1 were not regulated during the biotrophic phases of P. medicaginis colonisation, but two were induced during necrotrophy (i.e., Ca_02072, Ca_26412). Inversely, however, several SA-responsive genes were induced most during the biotrophic and BNS phases: these included all WALL-ASSOCIATED RECEPTOR KINASE70 (WRKY70) genes and one PR1 (Ca_02619) while another PR1 (Ca_21489) was down-regulated at all phases (Figure 6c).
We metabolically quantified levels of JA, the active form of JA (JA-Isoleucine), and SA during the different infection phases while we were unable to quantify ET. Total root JA increased significantly through the biotrophic and BNS phases (56.2 ± 12.5% and 74.4 ± 18.5% above control concentrations, respectively; Figure 6d). This level then declined to a significant repression of −30 ± 7.2% at 72 hpi. The active form, JA-Ile, showed a similar trend, but the only significant repression of this hormone occurred at 72 hpi (p < 0.05; −41.5 ± 6.9%; Figure 6d). SA, meanwhile, was significantly repressed during the biotrophic and BNS phases (−74.1 ± 30.4% and −87.7 ± 4.8%, respectively). The levels of recovered SA were still slightly, but were non-significantly, repressed during necrotrophy.

4. Discussion

Hemibiotrophic pathogens, as a broad group, are able to colonise many agronomically important plant species where they threaten yield, profitability, and sustainability. While the lifestyle of hemibiotrophs may afford multiple avenues by which we could control disease development, as they show both biotrophic and necrotrophic nutritional phases, this complexity has meant greater challenge in understanding what renders plants susceptible during each phase of disease. Using a susceptible host, we characterized the chickpea–P. medicaginis pathosystem to better understand what transcriptomic and hormonal changes occur in a plant host of agronomic importance during colonisation by a hemibiotrophic root pathogen. Confirming our first hypothesis, RNA-sequencing analysis of root tissue revealed that downstream defence responses were largely not induced during the biotrophic phase and were induced at a higher level during the necrotrophic phase similarly to what has been observed in both roots and leaves of other plant species. However, while we observed a biphasic SA/JA accumulation during hemibiotrophic colonisation, the timing of hormones accumulation during pathogenesis was not as predicted from leaf-based hemibiotrophic model systems, thereby negating our second hypothesis.
The length of the biotrophic infection phase in hemibiotrophic pathogens appears to be genus or species specific [11,26,58]. Attard and colleagues [36] found that the biotrophic infection phase of susceptible Arabidopsis Col-0 ecotype roots by Phytophthora parasitica lasted for approximately 30 hpi. The switch to necrotrophy was observed to be at 24 and 96 hpi for P. capsici and P. infestans, respectively, during the infection of detached susceptible tomato leaves [22,25]. This suggests that, while the exact timing of the BNS can vary between species, it is generally a relatively short-lived phase during colonisation of plant tissues. Variability in the duration of the biotrophic phase has been attributed to different nutrient requirements between unrelated pathogens [5,28,59], host genetics [60,61], and differences in the number and type of effectors produced by hemibiotrophic pathogens during the biotrophic phase [8]. Based on our observations of haustoria and on cell death, the biotrophic phase of P. medicaginis in our experimental system continued through the first 24 hpi followed by the beginnings of the necrotrophic phase from 36 hpi based on increased cell damage, hyphal ramification, sporulation, and necrosis within the roots. Therefore, P. medicaginis acts similarly to other hemibiotrophic pathogens when colonising the roots of chickpea, although the factors signalling the exit from biotrophy are currently unknown.
Plants can display unique transcriptional responses to each phase of hemibiotrophic colonisation [25,26], although these phase-specific genes generally form a minority of the total number of genes differentially regulated across all stages of pathogenesis [22]. We found that during the biotrophic phase of P. medicaginis infection, processes involved in energy generation such as the tricarboxylic acid cycle (TCA) and sugar biosynthesis were up-regulated. These findings are different to previous findings, whereby glycolysis, a closely linked pathway to the TCA cycle, was repressed in the Arabidopsis/P. parasitica pathosystem during biotrophy while sugar metabolism was repressed in Arabidopsis during V. dahliae biotrophic infection [32,33]. Infection of susceptible detached tomato leaves by P. capsici featured down-regulation of receptor-like kinases, a similar observation seen in Arabidopsis roots during P. parasitica biotrophy [25,32]. Like these studies, we also found differential expression of receptor-like kinases although this large class was both induced and repressed. In tomato, infection with Phytophthora infestans resulted in the induction of many uncharacterized genes, glycoside hydrolase family 17 (GH17), and thaumatin-like proteins while chalcone synthases, genes involved in reactive oxygen species production and defensins were down-regulated [22]. Similar to the tomato/P. infestans pathosystem, we also found that GH17 was induced, although this showed increased transcription more globally across pathogenesis, while thaumatin-like proteins and peroxidases were generally repressed. While fewer studies have investigated the transcriptional regulation during the BNS, we found enrichment for purine and carbohydrate pathways as previously found in the P. infestans pathosystem by [22]. Similar to [11] we found differential expression of proteases during the BNS phase. However, in our study these proteases were induced across all phases of P. medicaginis infection. We found evidence for differential gene expression associated with carbohydrate metabolism and molybdopterin biosynthesis during the BNS phase, as opposed to these pathways preferentially being found during necrotrophy [11,22]. Molybdopterin is a required factor in the nutrition of many pathogens [62]. In our study we found induction of calmodulin encoding genes during the BNS phase which are known to regulate Ca2+-dependent induction of plant immunity [63]. Similar induction of calmodulin genes were induced during the BNS phase in the soybean/P. sojae pathosystem but contrary to our study peroxidases were generally induced [34]. Therefore, while our work with chickpea shows a number of similarities to previously described host responses to hemibiotrophic pathogens, especially in the regulation of nutrition and defence signalling, there are distinct differences in how chickpea responds during the biotrophic/BNS phases of P. medicaginis disease progression.
In the necrotrophic disease phase, the host transcriptome changes significantly. During the necrotrophic phase of L. maculans, lignin biosynthesis were induced in canola seedlings [11], while [26] also found that leaves of susceptible wheat seedlings displayed lignification during necrotrophy. Induction of the lignin pathway during disease has previously been linked to physical reinforcement of cell walls against penetration while also preventing spread of pathogenic toxins and enzymes [64]. Increased transcription of genes associated with secondary metabolism was also observed during this phase in the canola/L. maculans and in the sesame/M. phaseolina pathosystems [11,21]. We also found that genes associated with these broad functional classes were also significantly regulated in chickpea in the latter phases of infection, suggesting that necrotrophy is generally characterized by the induction of downstream plant defences in an effort to ward off the invading pathogen. In the Arabidopsis/V. dahliae interaction and maize/Colletotrichum graminicola interaction, peptide biosynthesis is regulated during necrotrophy [27,65]. Similarly, we found enrichment for a repression of peptide biosynthesis during this phase. These results are logical as the plant cells are dying at this stage. Together, our results show that there are more overlaps in how a host responds at the transcriptomic level during necrotrophy than during biotrophy. The similarities at this latter stage of disease are present regardless of the plant tissue attacked, the phylogentic background of the pathogen, or the basis of plant recognition of the pathogen (i.e., qualitative vs. quantitative resistance; [38,66]).
Plants make use of phytohormones to mount a defence against hemibiotrophic pathogens [12,14]. Originally characterized in plant leaves, the classical model of plant responses to hemibiotrophic pathogens found that the biotrophic phase is regulated by SA, whereas necrotrophy is regulated by JA/ET [67,68]. Supporting this model in crops, is the whole-plant infection of susceptible canola cotyledons by L. maculans [11]. In our system, the colonisation of chickpea roots by P. medicaginis led to opposing accumulation of JA and SA hormone levels, but in a manner opposite to what has been found in leaf hemibiotrophic models: JA biosynthesis was highly induced during biotrophy while concentrations of SA were repressed during biotrophy with levels returning to pre-infection levels during necrotrophy. Other root pathosystems have also shown SA-JA responses dissimilar to leaf model systems such as in the Arabidopsis/P. parasitica and Fagus sylvatica:Phytophthora criticola interactions [29,36]. Transcriptionally, we found that genes associated with JA, and its partner hormone ET, were more highly induced during biotrophy while SA signalling was repressed. Similar to our study, in A. thaliana, JA/ET are induced and SA repressed during biotrophy and the BNS phase of F. oxysporum [30]. Surprisingly, we found WRKY70 genes were weakly induced during biotrophic and BNS phases. Previous reports show that WRKY70 is induced by SA, suggesting that other pathways may regulate WRKY70 induction in chickpea [69]. We found that genes with GO annotations related to SA signalling showed significant enrichment at the necrotrophic phase, cogent with an increase in SA hormone accumulation. The SA-associated gene induction during the necrotrophic phase has also been described in pathosystems including maize/Z. tritici [26] and rose/Diplocarpon rosae [70]. It would be of interest, however, to determine if similar SA/JA/ET hormonal and transcriptional profiles are observed in P. medicaginis resistant varieties of chickpea and if, as found by [21], the speed and intensity of hormonal regulation are more of a factor in disease resistance.
Altogether, we have demonstrated that there are both consistencies in how chickpea roots respond on a transcriptomic level to a hemibiotrophic pathogen, but also unique aspects not well characterised in other plant models. Specifically, our finding of the unexpected phytohormone regulation in chickpea roots during pathogenesis suggests that further investigation is needed to understand the role of phytohormones in negotiating pathogen defence in roots across a broader range of plant systems and argues for the importance of studying specific plant–pathogen interactions to understand and improve diseases resistance within agronomic pathosystems.

Supplementary Materials

The following are available online at https://www.mdpi.com/article/10.3390/microorganisms10020343/s1, Figure S1: Quantitative PCR verification of RNA-seq differential expression profiles. Average fold-change of expression as determined by RNA-seq (black bars) and using quantitative PCR (white bars) at 12 and 72 hpi, left- and right-hand side of each graph, respectively, as compared to mock-inoculated control. ± SE. Table S1: Primers used in this study. Table S2: Fold-change expression of all genes showing significant differential expression in at least one timepoint. Table S3: Listing of all significantly enriched GO-terms found within those genes uniquely expressed at each phase of pathogenesis. Table S4: Reverse BLAST results of chickpea proteins Ca_21489 and Ca_02619 to Arabidopis PR1. Table S5: BLASTp results of Arabidopsis IC1 (AT1G74710.2) and IC2 (AT1G18870.1) to chickpea proteome.

Author Contributions

Conceptualization, D.W.C., S.L.B., W.S.C. and J.M.P.; methodology, D.W.C., M.M. and J.M.P.; software, D.W.C., M.M. and J.M.P.; validation, D.W.C., M.M. and J.M.P.; formal analysis, D.W.C.; investigation, D.W.C. and J.M.P.; data curation, D.W.C., M.M. and J.M.P.; writing—original draft preparation, D.W.C. and J.M.P.; writing—review and editing, D.W.C., S.L.B., W.S.C. and J.M.P.; visualisation, D.W.C. and J.M.P.; supervision, W.S.C. and J.M.P.; project administration, D.W.C., W.S.C. and J.M.P. All authors have read and agreed to the published version of the manuscript.

Funding

This research was funded by a scholarship to DWC by Western Sydney University.

Institutional Review Board Statement

Not applicable.

Informed Consent Statement

Not applicable.

Data Availability Statement

The sequencing datasets generated for this study can be found at https://www.ncbi.nlm.nih.gov/geo/query/acc.cgi?acc=GSE182741 (accessed date 31 January 2022).

Acknowledgments

The authors would like to thank Kristy Hobson at NSW DPI, Tamworth, NSW for supplying experimental seeds. We thank the Grains Research and Development Corporation and NSW DPI for access to Phytophthora isolates for research purposes. Many thanks to J. Waterman, F. Snijders, and C. Hall for technical assistance with the phytohormone extraction protocol. The authors would like to acknowledge the Western Sydney University Confocal Bio-Imaging Facility and the Mass Spectrometry Facility (MSF) of Western Sydney University for access to its instrumentation and staff.

Conflicts of Interest

The authors declare no conflict of interest.

References

  1. Schwessinger, B.; Sperschneider, J.; Cuddy, W.S.; Garnica, D.P.; Miller, M.E.; Taylor, J.M.; Dodds, P.N.; Figueroa, M.; Park, R.F.; Rathjen, J.P. A Near-Complete Haplotype-Phased Genome of the Dikaryotic Wheat Stripe Rust Fungus Puccinia striiformis f. sp. tritici Reveals High Interhaplotype Diversity. mBio 2018, 9, e02275-17. [Google Scholar] [CrossRef] [PubMed] [Green Version]
  2. Spanu, P.D.; Panstruga, R. Editorial: Biotrophic Plant-Microbe Interactions. Front. Plant Sci. 2017, 8, 192. [Google Scholar] [CrossRef] [PubMed] [Green Version]
  3. Van Kan, J.A.L.; Shaw, M.W.; Grant-Downton, R.T. Botrytis species: Relentless necrotrophic thugs or endophytes gone rogue? Mol. Plant Pathol. 2014, 15, 957–961. [Google Scholar] [CrossRef] [PubMed]
  4. Turner, R.S. After the famine: Plant pathology, Phytophthora infestans, and the late blight of potatoes, 1845–1960. Hist. Stud. Phys. Biol. Sci. 2005, 35, 341–370. [Google Scholar] [CrossRef]
  5. Rodenburg, S.Y.A.; Seidl, M.F.; Judelson, H.S.; Vu, A.L.; Govers, F.; de Ridder, D. Metabolic Model of the Phytophthora infestans-Tomato Interaction Reveals Metabolic Switches during Host Colonization. mBio 2019, 10, e00454-19. [Google Scholar] [CrossRef] [Green Version]
  6. Fawke, S.; Doumane, M.; Schornack, S. Oomycete interactions with plants: Infection strategies and resistance principles. Microbiol. Mol. Biol. Rev. 2015, 79, 263–280. [Google Scholar] [CrossRef] [Green Version]
  7. Stotz, H.U.; Mitrousia, G.K.; de Wit, P.J.G.M.; Fitt, B.D.L. Effector-triggered defence against apoplastic fungal pathogens. Trends Plant Sci. 2014, 19, 491–500. [Google Scholar] [CrossRef] [PubMed] [Green Version]
  8. Lo Presti, L.; Lanver, D.; Schweizer, G.; Tanaka, S.; Liang, L.; Tollot, M.; Zuccaro, A.; Reissmann, S.; Kahmann, R. Fungal effectors and plant susceptibility. Annu. Rev. Plant Biol. 2015, 66, 513–545. [Google Scholar] [CrossRef]
  9. Lee, S.-J.; Rose, J.K.C. Mediation of the transition from biotrophy to necrotrophy in hemibiotrophic plant pathogens by secreted effector proteins. Plant Signal. Behav. 2010, 5, 769–772. [Google Scholar] [CrossRef]
  10. Qutob, D.; Kamoun, S.; Gijzen, M. Expression of a Phytophthora sojae necrosis-inducing protein occurs during transition from biotrophy to necrotrophy. TPJ 2002, 32, 361–373. [Google Scholar] [CrossRef] [Green Version]
  11. Haddadi, P.; Ma, L.; Wang, H.; Borhan, M.H. Genome-wide transcriptomic analyses provide insights into the lifestyle transition and effector repertoire ofLeptosphaeria maculansduring the colonization ofBrassica napusseedlings. Mol. Plant Pathol. 2016, 17, 1196–1210. [Google Scholar] [CrossRef] [PubMed] [Green Version]
  12. Glazebrook, J. Contrasting Mechanisms of Defense Against Biotrophic and Necrotrophic Pathogens. Annu. Rev. Phytopathol. 2005, 43, 205–227. [Google Scholar] [CrossRef] [PubMed]
  13. Li, N.; Han, X.; Feng, D.; Yuan, D.; Huang, L.-J. Signaling crosstalk between salicylic acid and ethylene/jasmonate in plant defense: Do we understand what they are whispering? Int. J. Mol. Sci. 2019, 20, 671. [Google Scholar] [CrossRef] [PubMed] [Green Version]
  14. Huang, S.; Zhang, X.; Fernando, W.G.D. Directing trophic divergence in plant-pathogen interactions: Antagonistic phytohormones with NO doubt? Front. Plant Sci. 2020, 11, 600063. [Google Scholar] [CrossRef] [PubMed]
  15. Ali, S.; Mir, Z.A.; Tyagi, A.; Bhat, J.A.; Chandrashekar, N.; Papolu, P.K.; Rawat, S.; Grover, A. Identification and comparative analysis of Brassica juncea pathogenesis-related genes in response to hormonal, biotic and abiotic stresses. Acta Physiol. Plant. 2017, 39, 268. [Google Scholar] [CrossRef]
  16. Cao, H.; Bowling, S.A.; Gordon, A.S.; Dong, X. Characterization of an Arabidopsis Mutant That Is Nonresponsive to Inducers of Systemic Acquired Resistance. Plant Cell 1994, 6, 1583–1592. [Google Scholar] [CrossRef]
  17. Ding, Y.; Sun, T.; Ao, K.; Peng, Y.; Zhang, Y.; Li, X.; Zhang, Y. Opposite roles of salicylic acid receptors NPR1 and NPR3/NPR4 in transcriptional regulation of plant immunity. Cell 2018, 173, 1454–1467. [Google Scholar] [CrossRef]
  18. Ali, S.; Ganai, B.A.; Kamili, A.N.; Bhat, A.A.; Mir, Z.A.; Bhat, J.A.; Tyagi, A.; Islam, S.T.; Mushtaq, M.; Yadav, P.; et al. Pathogenesis-related proteins and peptides as promising tools for engineering plants with multiple stress tolerance. Microbiol. Res. 2018, 212, 29–37. [Google Scholar] [CrossRef]
  19. Zhou, C.; Zhang, L.; Duan, J.; Miki, B.; Wu, K. HISTONE DEACETYLASE19 Is Involved in Jasmonic Acid and Ethylene Signaling of Pathogen Response in Arabidopsis. Plant Cell 2005, 17, 1196–1204. [Google Scholar] [CrossRef] [Green Version]
  20. Onkokesung, N.; Gális, I.; von Dahl, C.C.; Matsuoka, K.; Saluz, H.-P.; Baldwin, I.T. Jasmonic Acid and Ethylene Modulate Local Responses to Wounding and Simulated Herbivory in Nicotiana attenuata leaves. Plant Physiol. 2010, 153, 785–798. [Google Scholar] [CrossRef] [Green Version]
  21. Chowdhury, S.; Basu, A.; Kundu, S. Biotrophy-necrotrophy switch in pathogen evoke differential response in resistant and susceptible sesame involving multiple signaling pathways at different phases. Sci. Rep. 2017, 7, 1–17. [Google Scholar] [CrossRef] [Green Version]
  22. Zuluaga, A.P.; Vega-Arreguin, J.; Fei, Z.; Matas, A.J.; Patev, S.; Fry, W.E.; Rose, J.K.C. Analysis of the tomato leaf transcriptome during successive hemibiotrophic stages of a compatible interaction with the oomycete pathogen Phytophthora infestans. Mol. Plant Pathol. 2015, 17, 42–54. [Google Scholar] [CrossRef]
  23. Spoel, S.H.; Koornneef, A.; Claessens, S.M.C.; Korzelius, J.P.; Van Pelt, J.A.; Mueller, M.J.; Buchala, A.J.; Métraux, J.-P.; Brown, R.; Kazan, K.; et al. (NPR1 modulates cross-talk between salicylate- and jasmonate-dependent defense pathways through a novel function in the cytosol. Plant Cell 2003, 15, 760–770. [Google Scholar] [CrossRef] [Green Version]
  24. Bhadauria, V.; Bett, K.E.; Zhou, T.; Vandenberg, A.; Wei, Y.; Banniza, S. Identification of Lens culinaris defense genes responsive to the anthracnose pathogen Colletotrichum truncatum. BMC Genet. 2013, 14, 31. [Google Scholar] [CrossRef] [PubMed] [Green Version]
  25. Jupe, J.; Stam, R.; Howden, A.J.M.; Morris, J.A.; Zhang, R.; Hedley, P.E.; Huitema, E. Phytophthora capsici-tomato interaction features dramatic shifts in gene expression associated with a hemi-biotrophic lifestyle. Genome Biol. 2013, 14, 1–18. [Google Scholar] [CrossRef] [PubMed] [Green Version]
  26. Rudd, J.J.; Kanyuka, K.; Hassani-Pak, K.; Derbyshire, M.; Andongabo, A.; Devonshire, J.; Lysenko, A.; Saqi, M.; Desai, N.M.; Powers, S.J.; et al. Transcriptome and Metabolite Profiling of the Infection Cycle of Zymoseptoria tritici on Wheat Reveals a Biphasic Interaction with Plant Immunity Involving Differential Pathogen Chromosomal Contributions and a Variation on the Hemibiotrophic Lifestyle Definition. Plant Physiol. 2015, 167, 1158–1185. [Google Scholar] [CrossRef] [Green Version]
  27. Vargas, W.A.; Martín, J.M.S.; Rech, G.E.; Rivera, L.P.; Benito, E.P.; Díaz-Mínguez, J.M.; Thon, M.R.; Sukno, S.A. Plant Defense Mechanisms Are Activated during Biotrophic and Necrotrophic Development of Colletotricum graminicola in Maize. Plant Physiol. 2012, 158, 1342–1358. [Google Scholar] [CrossRef] [PubMed] [Green Version]
  28. Yang, F.; Li, W.; Jørgensen, H.J.L. Transcriptional Reprogramming of Wheat and the Hemibiotrophic Pathogen Septoria tritici during Two Phases of the Compatible Interaction. PLoS ONE 2013, 8, e81606. [Google Scholar] [CrossRef] [PubMed] [Green Version]
  29. Schlink, K. Down-regulation of defense genes and resource allocation into infected roots as factors for compatibility between Fagus sylvatica and Phytophthora citricola. Funct. Integr. Genomics 2010, 10, 253–264. [Google Scholar] [CrossRef]
  30. Lyons, R.; Stiller, J.; Powell, J.; Rusu, A.; Manners, J.M.; Kazan, K. Fusarium oxysporum Triggers Tissue-Specific Transcriptional Reprogramming in Arabidopsis thaliana. PLoS ONE 2015, 10, e0121902. [Google Scholar] [CrossRef]
  31. Marcel, S.; Sawers, R.; Oakeley, E.; Angliker, H.; Paszkowski, U. Tissue-adapted invasion strategies of the rice blast fungus Magnaporthe oryzae. Plant Cell 2010, 22, 3177–3187. [Google Scholar] [CrossRef] [PubMed] [Green Version]
  32. Le Berre, J.-Y.; Gourgues, M.; Samans, B.; Keller, H.; Panabières, F.; Attard, A. Transcriptome dynamic of Arabidopsis roots infected with Phytophthora parasitica identifies VQ29, a gene induced during the penetration and involved in the restriction of infection. PLoS ONE 2017, 12, e0190341. [Google Scholar] [CrossRef] [PubMed] [Green Version]
  33. Scholz, S.S.; Schmidt-Heck, W.; Guthke, R.; Furch, A.C.U.; Reichelt, M.; Gershenzon, J.; Oelmüller, R. Verticillium dahliae-Arabidopsis Interaction Causes Changes in Gene Expression Profiles and Jasmonate Levels on Different Time Scales. Front. Microbiol. 2018, 9, 217. [Google Scholar] [CrossRef] [PubMed]
  34. Moy, P.; Qutob, D.; Chapman, B.P.; Atkinson, I.; Gijzen, M. Patterns of Gene Expression Upon Infection of Soybean Plants by Phytophthora sojae. Mol. Plant. Microbe Interact. 2004, 17, 1051–1062. [Google Scholar] [CrossRef] [PubMed] [Green Version]
  35. Zhou, L.; Mideros, S.X.; Bao, L.; Hanlon, R.; Arredondo, F.D.; Tripathy, S.; Krampis, K.; Jerauld, A.; Evans, C.; St Martin, S.K.; et al. Infection and genotype remodel the entire soybean transcriptome. BMC Genom. 2009, 10, 49. [Google Scholar] [CrossRef] [Green Version]
  36. Attard, A.; Gourgues, M.; Callemeyn-Torre, N.; Keller, H. The immediate activation of defense responses in Arabidopsis roots is not sufficient to prevent Phytophthora parasitica infection. New Phytol. 2010, 187, 449–460. [Google Scholar] [CrossRef]
  37. Plett, J.M.; Plett, K.L.; Bithell, S.L.; Mitchell, C.; Moore, K.; Powell, J.R.; Anderson, I.C. Improved Phytophthora resistance in commercial chickpea (Cicer arietinum) varieties negatively impacts symbiotic gene signalling and symbiotic potential in some varieties. Plant Cell Environ. 2016, 39, 1858–1869. [Google Scholar] [CrossRef]
  38. Amalraj, A.; Taylor, J.; Bithell, S.; Li, Y.; Moore, K.; Hobson, K.; Sutton, T. Mapping resistance to Phytophthora root rot identifies independent loci from cultivated (Cicer arietinum L.) and wild (Cicer echinospermum PH Davis) chickpea. Theor. Appl. Genet. 2019, 132, 1017–1033. [Google Scholar] [CrossRef]
  39. Merga, B.; Haji, J. Economic importance of chickpea: Production, value, and world trade. Cogent Food Agric. 2019, 5, 1615718. [Google Scholar] [CrossRef]
  40. Bithell, S.; Moore, K.; McKay, A.; Harden, S.; Simpfendorfer, S. Phytophthora root rot of chickpea: Inoculum concentration and seasonally dependent success for qPCR based predictions of disease and yield loss. Australas. Plant Pathol. 2021, 50, 91–103. [Google Scholar] [CrossRef]
  41. Miller, S.A.; Maxwell, D.P. Ultrastructure of susceptible, host resistant and nonhost resistant interactions of alfalfa with Phytophthora megasperma. Can. J. Bot. 1984, 62, 117–128. [Google Scholar] [CrossRef]
  42. Enkerli, K.; Mims, C.; Hahn, M. Ultrastructure of compatible and incompatible interactions of soybean roots infected with the plant pathogenic oomycete Phytophthora sojae. Can. J. Bot. 1997, 75, 1493–1508. [Google Scholar] [CrossRef]
  43. Vock, N.T.; Langdon, P.W.; Pegg, K.G. Root rot of chickpea caused by Phytophthora megasperma var. sojae in Queensland. Australas. Plant Pathol. 1980, 9, 117. [Google Scholar] [CrossRef]
  44. Beakes, G.W.; El-Hamalawi, Z.A.; Erwin, D.C. Ultrastructure of mature oospores of Phytophthora megasperma f.sp. medicaginis: Preparation protocols and effects of MTT vital staining and permanganate pre-treatment. Trans. Br. Mycol. Soc. 1986, 86, 195–206. [Google Scholar] [CrossRef]
  45. El-Hamalawi, Z.A.; Erwin, D. Components in alfalfa root extract and root exudate that increase oospore germination of Phytophthora megasperma f. sp. medicaginis. Phytopathology 1986, 76, 508–513. [Google Scholar] [CrossRef]
  46. Jain, M.; Misra, G.; Patel, R.K.; Priya, P.; Jhanwar, S.; Khan, A.W.; Shah, N.; Singh, V.K.; Garg, R.; Jeena, G.; et al. A draft genome sequence of the pulse crop chickpea (Cicer arietinum L.). TPJ 2013, 74, 715–729. [Google Scholar] [CrossRef] [PubMed]
  47. Amalraj, A. Molecular Genetics and Genomics Approaches to Improve Phytophthora Root Rot Resistance in Chickpea. Ph.D. Thesis, University of Adelaide, Adelaide, SA, Australia, 2019. [Google Scholar]
  48. Feng, G.; Yang, H.; Li, Y. Kinetics of relative electrical conductivity and correlation with gas composition in modified atmosphere packaged bayberries (Myrica rubra Siebold and Zuccarini). LWT-Food Sci. Technol. 2005, 38, 249–254. [Google Scholar] [CrossRef]
  49. GenStat Committee. The Guide to GenStat Release 12–Parts 1–3; VSN International: Oxford, UK, 2009. [Google Scholar]
  50. R Core Team. R: A Language and Environment for Statistical Computing; R Foundation for Statistical Computing: Vienna, Austria, 2020; Available online: https://www.R-project.org/ (accessed on 25 April 2020).
  51. R Core Team. R: A Language and Environment for Statistical Computing; R Foundation for Statistical Computing: Vienna, Austria, 2021; Available online: https://www.R-project.org/ (accessed on 13 June 2021).
  52. Fox, J.; Friendly, M.; Weisberg, S. Hypothesis Tests for Multivariate Linear Models Using the car Package. R J. 2013, 5, 39. [Google Scholar] [CrossRef] [Green Version]
  53. Lenth R Emmeans: Estimated Marginal Means, aka Least-Squares Means. R package version 1.1. 2020. Available online: https://CRAN.R-project.org/package=emmeans (accessed on 10 April 2021).
  54. Cheng, W.; Lin, M.; Qiu, M.; Kong, L.; Xu, Y.; Li, Y.; Wang, Y.; Ye, W.; Dong, S.; He, S.; et al. Chitin synthase is involved in vegetative growth, asexual reproduction and pathogenesis of Phytophthora capsici and Phytophthora sojae. Environ. Microbiol. 2019, 21, 4537–4547. [Google Scholar] [CrossRef]
  55. Jones, K.; Kim, D.W.; Park, J.S.; Khang, C.H. Live-cell fluorescence imaging to investigate the dynamics of plant cell death during infection by the rice blast fungus Magnaporthe oryzae. BMC Plant Biol. 2016, 16, 69. [Google Scholar] [CrossRef] [Green Version]
  56. Love, M.I.; Huber, W.; Anders, S. Moderated estimation of fold change and dispersion for RNA-seq data with DESeq2. Genome Biol. 2014, 15, 550. [Google Scholar] [CrossRef] [PubMed] [Green Version]
  57. Alexa, A.; Rahnenführer, J. Gene set enrichment analysis with topGO. Bioconductor. Improv. 2009, 27, 1–26. [Google Scholar]
  58. Zuluaga, A.P.; Vega-Arreguín, J.C.; Fei, Z.; Ponnala, L.; Lee, S.J.; Matas, A.J.; Patev, S.; Fry, W.E.; Rose, J.K.C. Transcriptional dynamics of Phytophthora infestansduring sequential stages of hemibiotrophic infection of tomato. Mol. Plant Pathol. 2015, 17, 29–41. [Google Scholar] [CrossRef] [PubMed]
  59. Keon, J.; Antoniw, J.; Carzaniga, R.; Deller, S.; Ward, J.L.; Baker, J.M.; Beale, M.H.; Hammond-Kosack, K.; Rudd, J.J. Transcriptional Adaptation of Mycosphaerella graminicola to Programmed Cell Death (PCD) of Its Susceptible Wheat Host. Mol. Plant. Microbe Interact. 2007, 20, 178–193. [Google Scholar] [CrossRef] [Green Version]
  60. Diniz, I.; Figueiredo, A.; Loureiro, A.; Batista, D.; Azinheira, H.; Várzea, V.; Pereira, A.P.; Gichuru, E.; Moncada, P.; Guerra-Guimarães, L.; et al. A first insight into the involvement of phytohormones pathways in coffee resistance and susceptibility to Colletotrichum kahawae. PLoS ONE 2017, 12, e0178159. [Google Scholar] [CrossRef] [Green Version]
  61. Smart, C.D.; Myers, K.L.; Restrepo, S.; Martin, G.B.; Fry, W.E. Partial Resistance of Tomato to Phytophthora infestans is not dependent upon ethylene, jasmonic acid, or salicylic acid signaling pathways. Mol. Plant-Microbe Interact. 2003, 16, 141–148. [Google Scholar] [CrossRef] [Green Version]
  62. Mehta, A.P.; Abdelwahed, S.H.; Begley, T.P. Molybdopterin biosynthesis—Mechanistic studies on a novel MoaA catalyzed insertion of a purine carbon into the ribose of GTP. Biochim. Biophys. Acta (BBA)-Proteins Proteom. 2015, 1854, 1073–1077. [Google Scholar] [CrossRef] [Green Version]
  63. Cheval, C.; Aldon, D.; Galaud, J.-P.; Ranty, B. Calcium/calmodulin-mediated regulation of plant immunity. Biochim. Biophys. Acta 2013, 1833, 1766–1771. [Google Scholar] [CrossRef] [Green Version]
  64. Smith, A.H.; Gill, W.M.; Pinkard, E.; Mohammed, C.L. Anatomical and histochemical defence responses induced in juvenile leaves of Eucalyptus globulus and Eucalyptus nitens by Mycosphaerella infection. For. Pathol. 2007, 37, 361–373. [Google Scholar] [CrossRef]
  65. Su, X.; Lu, G.; Guo, H.; Zhang, K.; Li, X.; Cheng, H. The dynamic transcriptome and metabolomics profiling in Verticillium dahliae inoculated Arabidopsis thaliana. Sci. Rep. 2018, 8, 15404. [Google Scholar] [CrossRef] [Green Version]
  66. Raman, H.; Raman, R.; Diffey, S.; Qiu, Y.; McVittie, B.; Barbulescu, D.M.; Salisbury, P.A.; Marcroft, S.; Delourme, R. Stable Quantitative Resistance Loci to Blackleg Disease in Canola (Brassica napus L.) Over Continents. Front. Plant Sci. 2018, 9, 1622. [Google Scholar] [CrossRef] [PubMed] [Green Version]
  67. Vlot, A.C.; Dempsey, D.M.A.; Klessig, D.F. Salicylic acid, a multifaceted hormone to combat disease. Annu. Rev. Phytopathol. 2009, 47, 177–206. [Google Scholar] [CrossRef] [PubMed] [Green Version]
  68. Browse, J. Jasmonate passes muster: A Receptor and Targets For The Defense Hormone. Annu. Rev. Plant Biol. 2009, 60, 183–205. [Google Scholar] [CrossRef]
  69. Ren, C.; Zhu, Q.; Gao, B.-D.; Ke, S.-Y.; Yu, W.-C.; Xie, D.-X.; Peng, W. Transcription factor WRKY70 displays important but no indispensable roles in jasmonate and salicylic acid signaling. J. Integr. Plant Biol. 2008, 50, 630–637. [Google Scholar] [CrossRef] [PubMed]
  70. Neu, E.; Domes, H.S.; Menz, I.; Kaufmann, H.; Linde, M.; Debener, T. Interaction of roses with a biotrophic and a hemibiotrophic leaf pathogen leads to differences in defense transcriptome activation. Plant Mol. Biol. 2019, 99, 299–316. [Google Scholar] [CrossRef] [PubMed] [Green Version]
Figure 1. Phytophthora medicaginis pathogenesis is associated with a fast rate of necrosis and hemibiotrophic development. (ad) Macroscopic symptoms of chickpea var. ‘Sonali’ either mock-inoculated with pathogen free agar blocks (control) or 12, 24 and 72 h post-inoculation (hpi) with P. medicaginis isolate 7831. (eh) Confocal microscopy images of the 0.5 cm root segment that was sampled either from a mock-inoculated control or from the P. medicaginis inoculated site at 12, 24 and 72 hpi (sampled segment denoted by a black box). P. medicaginis hyphae are observed by green fluorescence while root cell walls are observed by red fluorescence. Intracellular haustoria development are indicated with white arrows while intracellular and extracellular chlamydospores are indicated by blue arrows. (i) Confocal microscopy images showing close up of P. medicaginis haustoria (white arrows) and (j) chlamydospores (blue arrows) photographed at 12 and 72 hpi, respectively. Scale bars: (e,f) 150 µm; (g,h) 1100 µm; (i) 70 µm; (j) 60 µm. The confocal microscopy images were taken using a TCS SP5 confocal laser scanning microscope. For imaging, a Z-stack was taken of the inoculated site using whole-roots roots for (e, hj), whereas 30 µm in thickness longitudinal sections of cortical cell layer were imaged at the inoculated site for (f,g).
Microorganisms 10 00343 g001
Figure 2. Phytophthora medicaginis displays a short biotrophic phase up to 24 h post-inoculation (hpi) before switching to a necrotrophic phase. (a) P. medicaginis induces significant root cell death from 36 hpi onwards. The x-axis shows the timepoints post-inoculation in hours (h) and the y-axis shows the arcsine-transformed electrolyte leakage proportions of pre-boiled relative to post-boiled root samples. * = significant differences in arcsine-transformed electrolyte leakage proportions between the inoculated and mock-inoculated control roots at a specific timepoints (p < 0.001, LSD = 0.08). (b) P. medicaginis causes significantly lower root cell viability at 72 hpi. The x-axis shows the control and timepoints post-inoculation in hours (h), and the y-axis shows the ratio of living to dead cells. Lower-case letters indicate significant difference between treatments (ANOVA, p < 0.05; n = 6).
Microorganisms 10 00343 g002
Figure 3. Genome-wide evaluation of RNA-sequencing data in chickpea var. ‘Sonali’ roots undergoing colonisation by Phytophthora medicaginis. (a) Principal component analysis of RNA-seq samples at 12, 24 and 72 h post-inoculation (hpi), and mock-inoculated control. (b) Number of significantly up-regulated and down-regulated genes in chickpea var. ‘Sonali’ roots at 12, 24 and 72 hpi (p < 0.05, 1 < log2FC > −1). BP: biotrophic phase, BNS: biotrophy to necrotrophy switch and NP: necrotrophic phase.
Microorganisms 10 00343 g003
Figure 4. Clusters of significantly differentially regulated chickpea genes display conserved expression patterns across three phases of Phytophthora medicaginis colonisation. Hierarchical clustering of the log2-transformed data of 13,568 significantly regulated genes of chickpea variety ‘Sonali’ during the three phases of colonisation by P. medicaginis are represented (padj-value < 0.05, 1 < log2FC > −1). All data points are the ratio of transcript abundance in colonised roots as compared to control plants grown under the same conditions where red value indicates increased gene expression and black/grey indicates decreased gene expression. The heat map is annotated on the left-hand side with the hierarchical cluster groupings denoted i–xi. BP: biotrophic phase, BNS: biotrophy to necrotrophy switch, hpi: hours post-inoculation, NBS-LRR: nucleotide-binding site-leucine-rich repeat and NP: necrotrophic phase.
Microorganisms 10 00343 g004
Figure 5. Chickpea unique responses at each of the phases reveal similar and different responses observed in other models. (a) Venn diagrams showing the number of common and unique significantly regulated genes in chickpea var. ‘Sonali’ varies during three timepoints of Phytophthora medicaginis colonisation (12, 24, and 72 h post-inoculation (hpi)), pertaining to the biotrophic phases (BP), biotrophy to necrotrophy switch (BNS) phase and necrotrophic phase (NP), respectively. The red and black Venn diagrams show the common and unique genes pertaining to the significantly up-regulated and down-regulated gene sets, respectively. The white, brown and gold circles pertain to the uniquely regulated genes that were used for gene ontology (GO) enrichment analysis at a specific phase of infection. (b) Enriched GO biological processes associated with differentially expressed genes in Sonali roots unique to each of the three phases of P. medicaginis pathogenesis. The GO terms associated with each timepoint are shown on the Y axes and the number of genes associated with each GO term are shown on the X axes. The Fisher’s exact test p-value statistic for each GO term are shown based on a blue–yellow gradient. GO terms discussed within the text are highlighted in orange.
Microorganisms 10 00343 g005
Figure 6. Jasmonic acid (JA), ethylene (ET), and salycilic acid (SA) signalling pathways in chickpea roots during the biotrophic to necrotrophic switch of Phytophthora medicaginis. (a) Expression profiles of the log2-transformed data of differentially regulated genes pertaining to the JA signalling pathways in chickpea var. ‘Sonali’ at 12, 24 and 72 h post-inoculation (hpi). Genes are annotated with Arabidopsis orthologue: LOX, lipoxygenase (Biosynthesis); AOS, allene oxide synthase (Biosynthesis); JAZ, jasmonate zim domain protein (Perception); DEF, defensin-like gene (Signalling); PR3, pathogenesis-related 3 (Signalling); PR4, pathogenesis-related 4 (Signalling). These latter two genes are also involved in ET signalling. (b) Expression profiles of the log2-transformed data of differentially regulated genes pertaining to the ET pathway in chickpea var. ‘Sonali’ at 12, 24, 72 hpi. Genes are annotated with the Arabidopsis orthologue: ACS, acc synthase (Biosynthesis); ACO, acc oxidase (Biosynthesis); ERF9, ethylene response factor 9 (Signalling); EIN3, ethylene insensitive 3 (Signalling); ERF1, ethylene response factor 1 (Ssignalling). (c) Expression profiles of the log2-transformed data of differentially regulated genes pertaining to the SA signalling pathways in chickpea variety ‘Sonali’ at 12, 24 and 72 hpi. Down-regulated genes and up-regulated genes are presented as black (low) or red (high), respectively. Genes are annotated with Arabidopsis orthologue: EDS5, enhanced disease susceptibility 5 (Biosynthesis); ICS, isochorismate synthase (Biosynthesis); NPR1, nonexpressor of pathogenesis-related 1 (Perception); WRKY70, wall-associated receptor kinase 70 (Signalling); TGA4, tcagc-binding factor 4 (Signalling); PR1, pathogenesis-related 1 (Signalling). (d) Percent change in hormone concentrations in roots undergoing colonisation by P. medicaginis (compared to axenically grown control roots) for JA (orange solid line), JA-Ile (orange dashed line), and SA (black solid line). The error bars indicate standard error between 9–12 biological replicates at each timepoint; * = Significant difference from control values (p < 0.05; Student’s T-test). BP: biotrophic phase, BNS: biotrophy to necrotrophy switch, NP: necrotrophic phase.
Microorganisms 10 00343 g006
Publisher’s Note: MDPI stays neutral with regard to jurisdictional claims in published maps and institutional affiliations.

