
Gene Overlapping as a Modulator of Begomovirus Evolution


Abstract
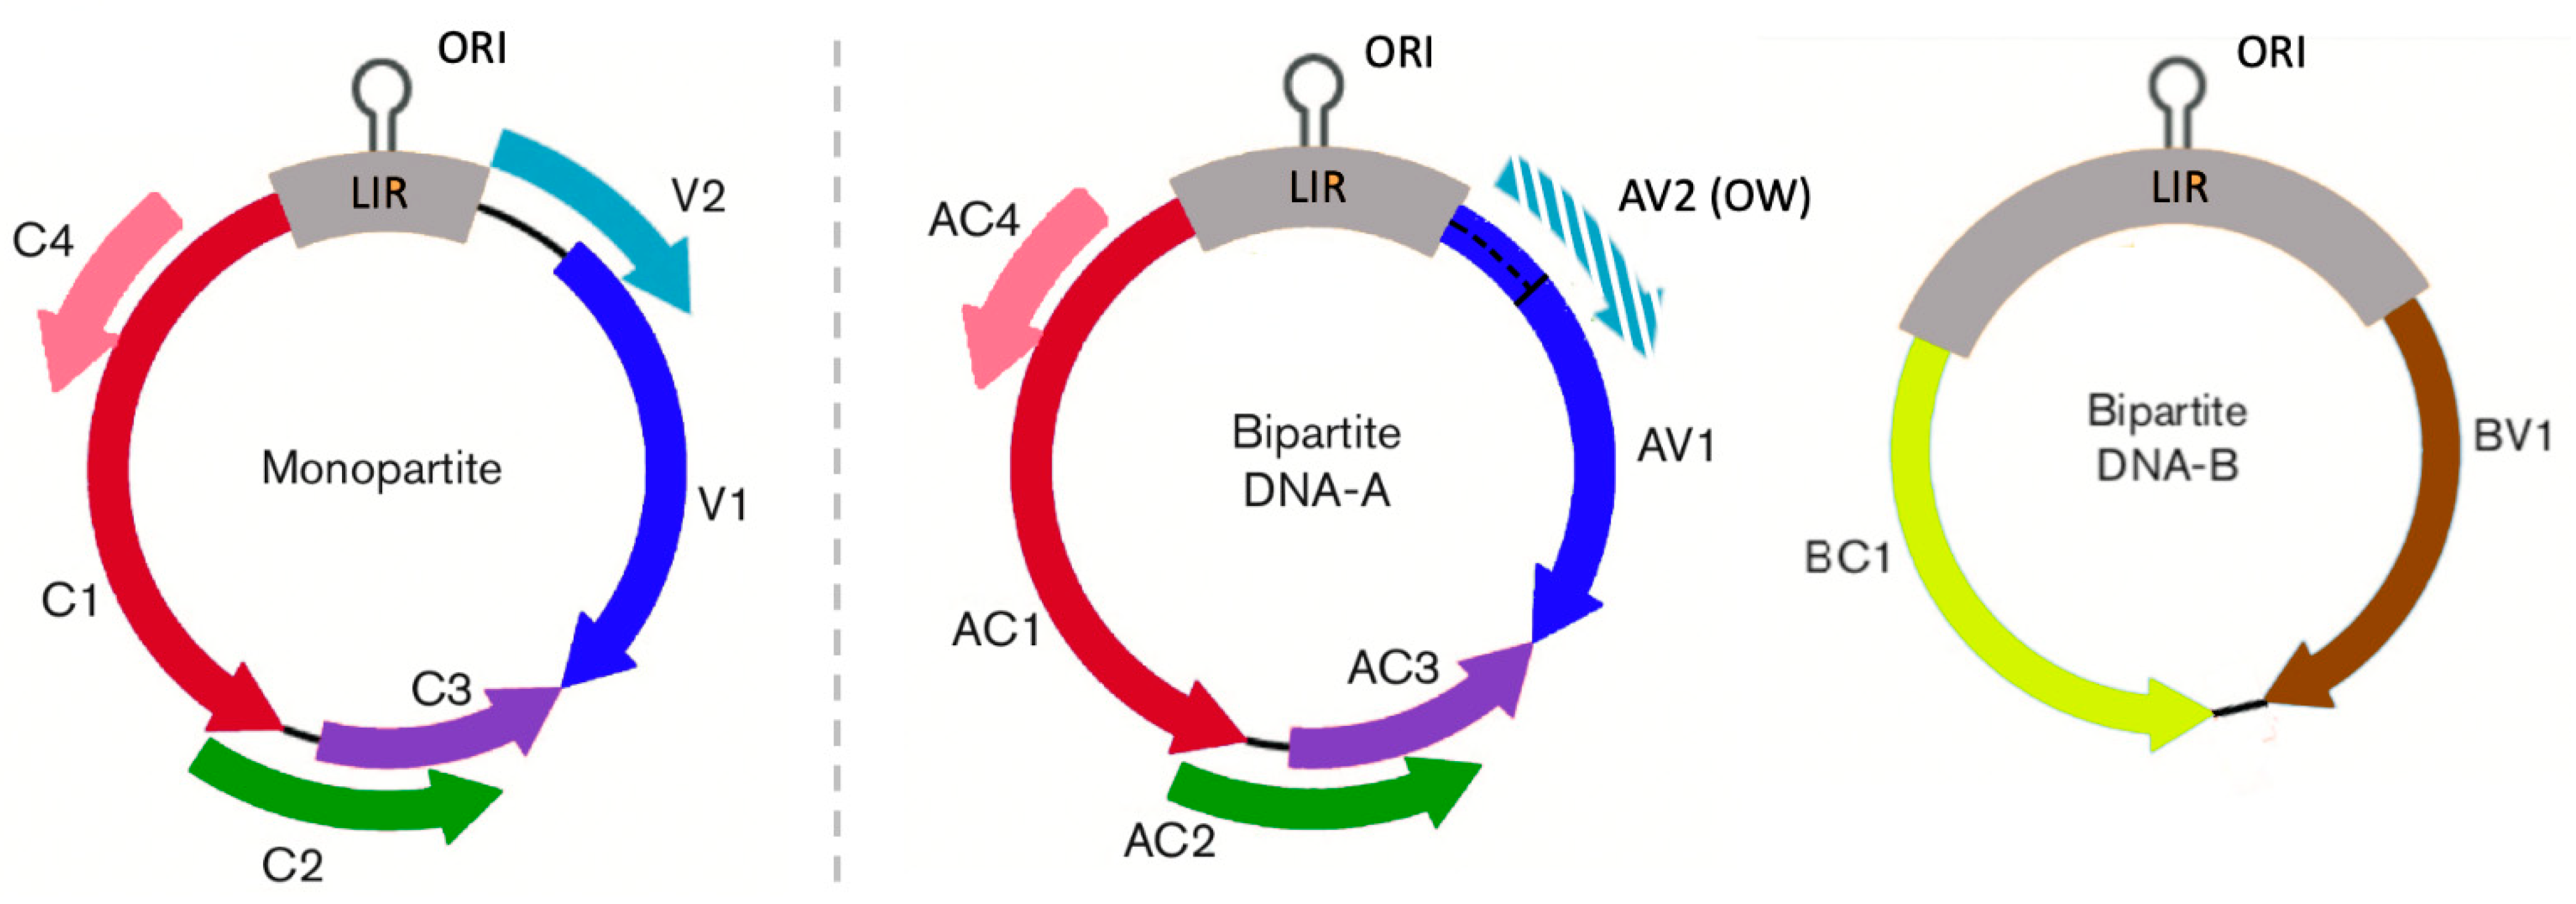
:1. Introduction
2. Materials and Methods
2.1. Sequence Data
2.2. Estimation of Tree Length
2.3. Selection Pressures
2.4. Detection of Recombination
2.5. Statistical Analysis
3. Results
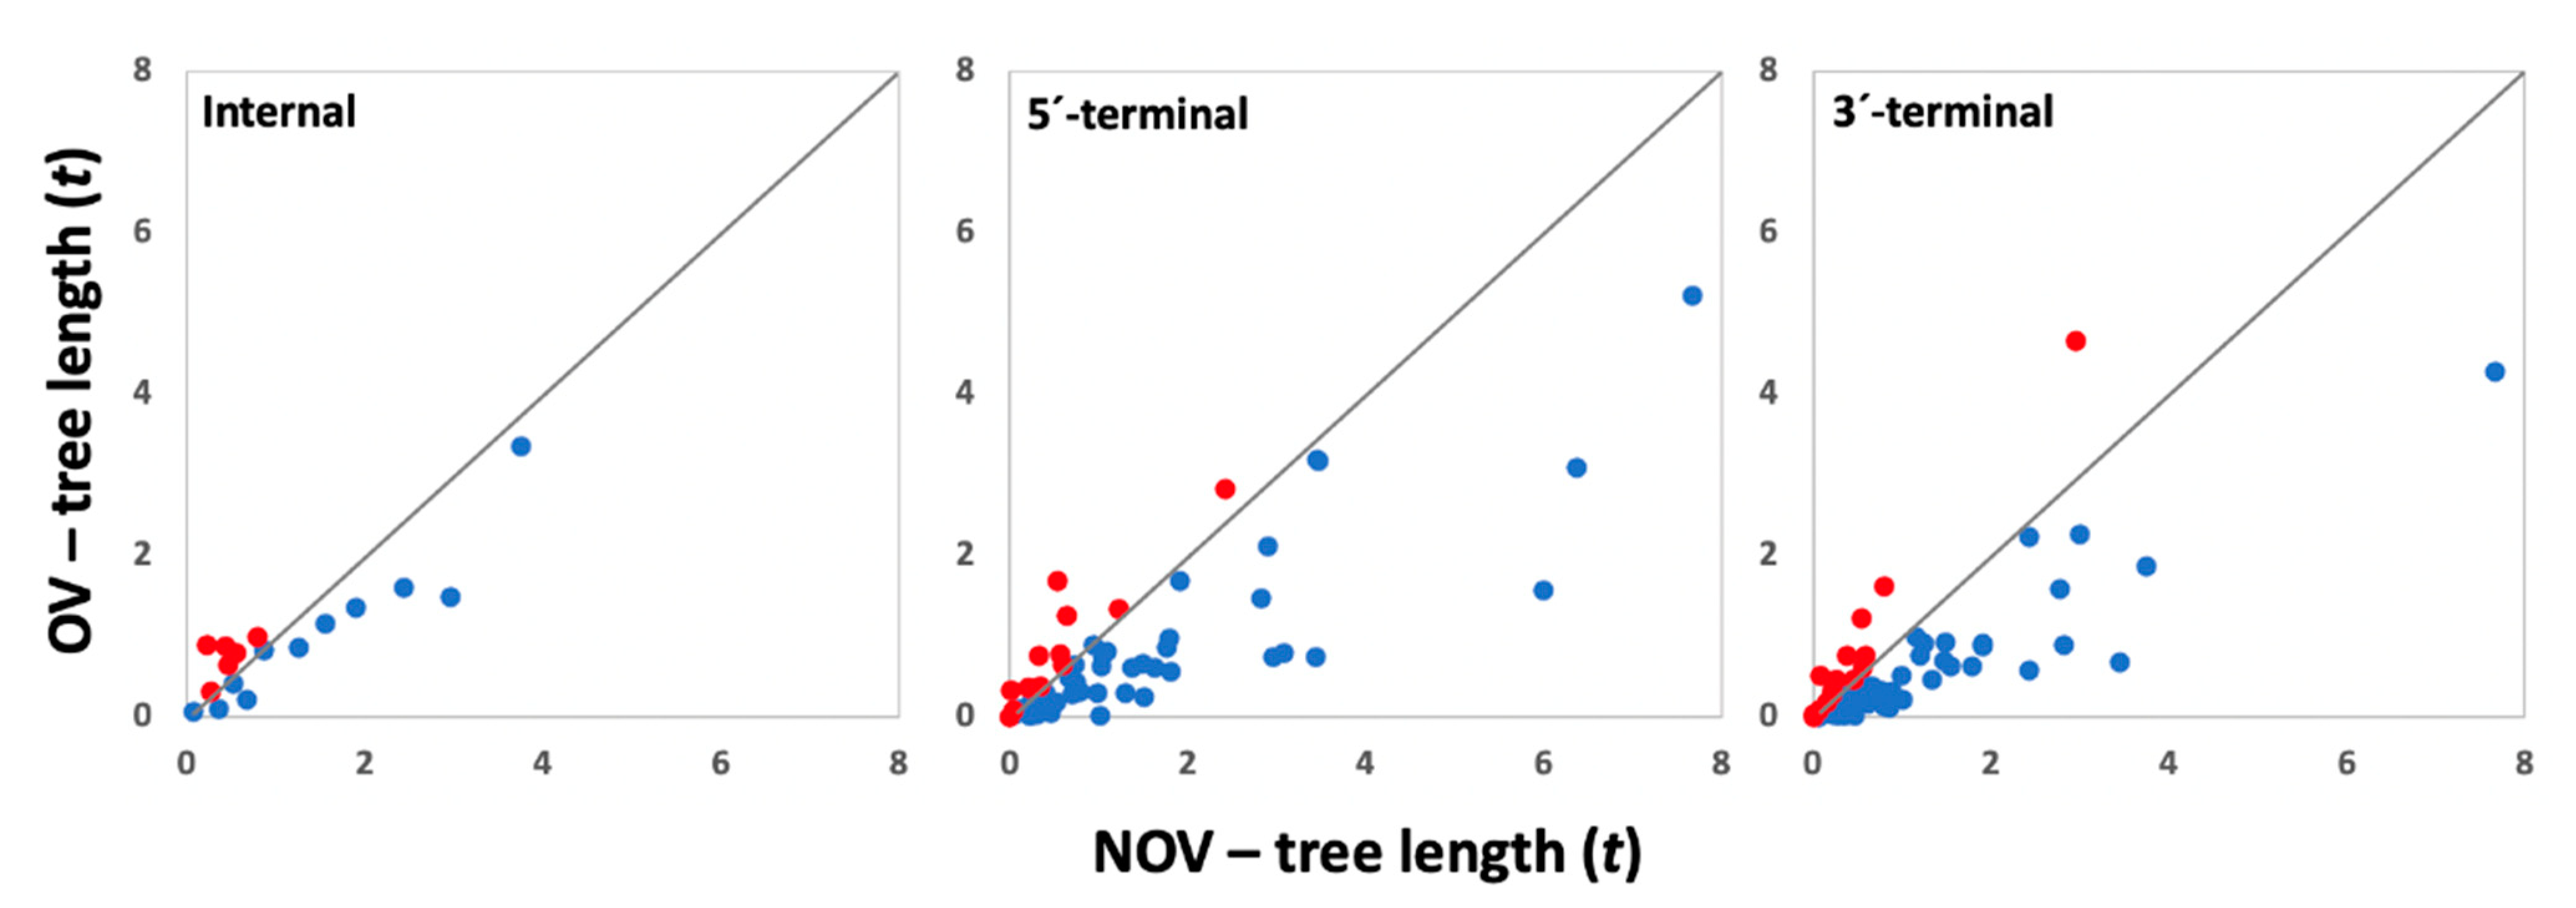
3.1. Effect of the Presence and Type of Gene Overlapping on Gene Evolution
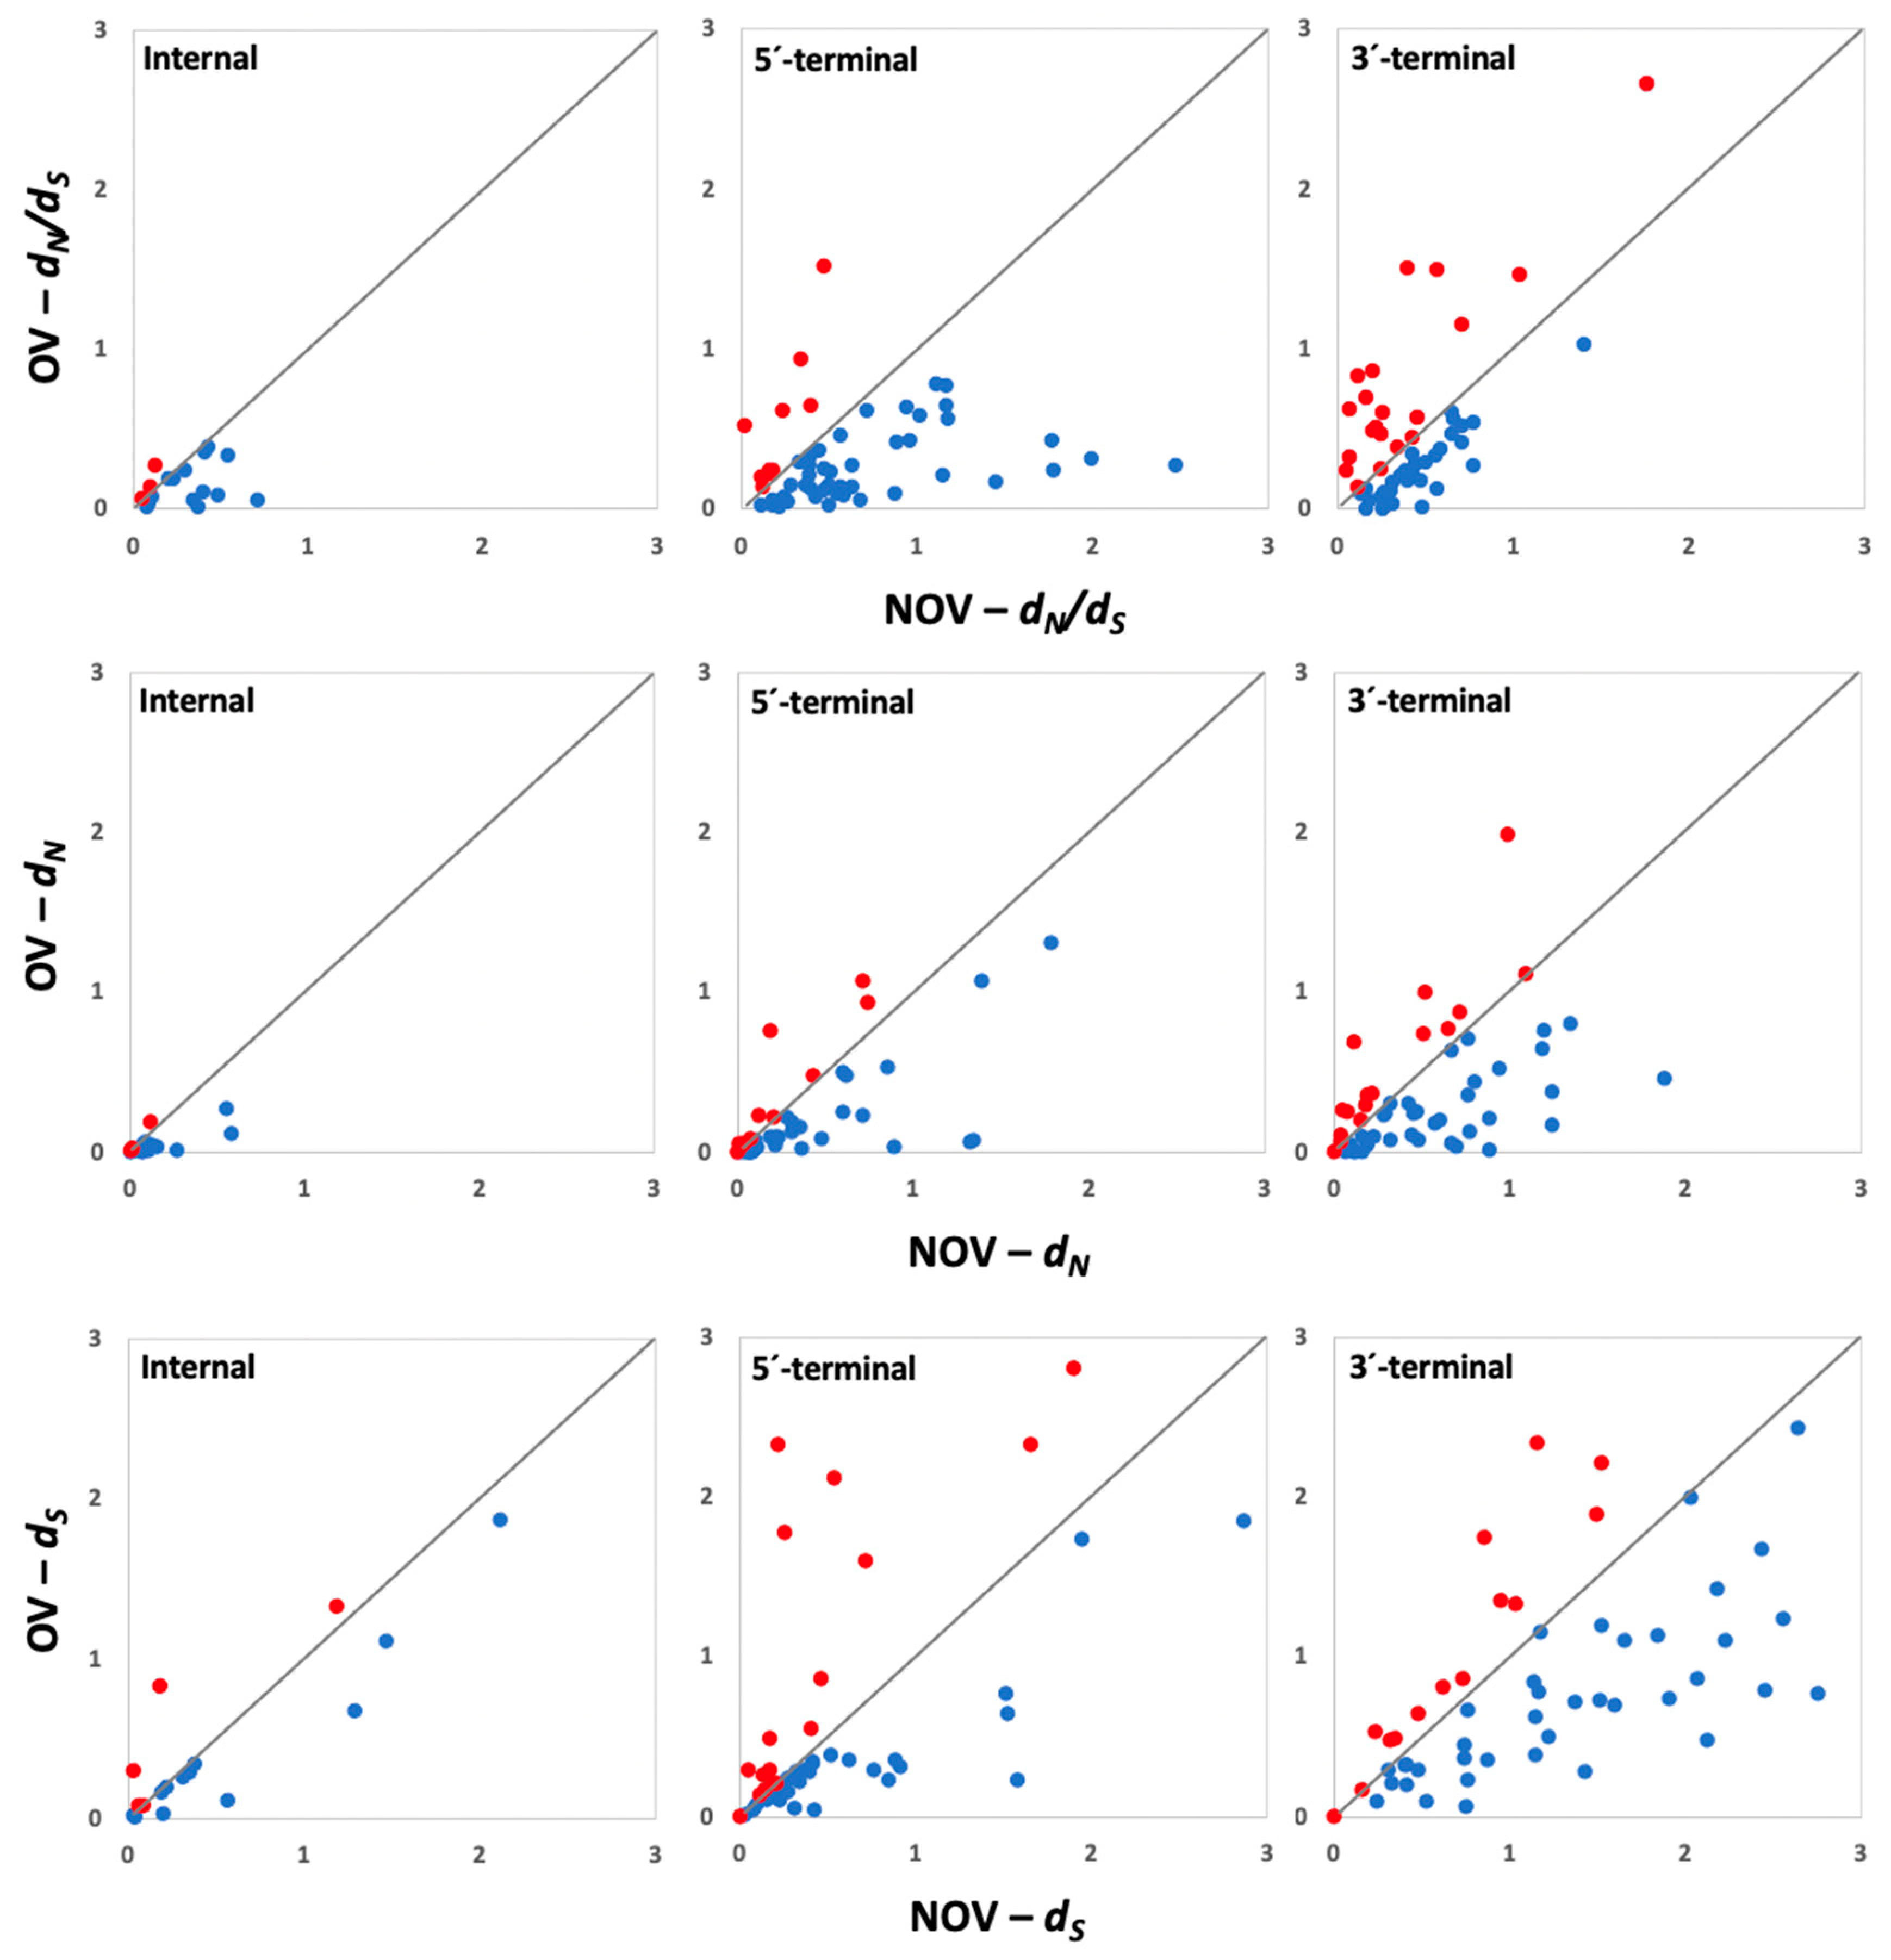
3.2. Association between Selection Pressures and Gene Evolution
3.3. Association between Proportion of Overlap and Gene Evolution
4. Discussion
Supplementary Materials
Author Contributions
Funding
Institutional Review Board Statement
Informed Consent Statement
Data Availability Statement
Conflicts of Interest
Appendix A

| Species 1 | N 2 | Overlapping 3 | Gene Length 4 | t5 | dN/dS | |||
|---|---|---|---|---|---|---|---|---|
| ORF | Length | NOV | OV | NOV | OV | |||
| Internal (11/17) | ||||||||
| African cassava mosaic virus (B) | 27 (4%) | AC1-AC4 | 423 | 1077 | 0.53 | 0.41 | 0.39 | 0.11 |
| Alternanthera yellow vein virus (M) | 11 (8%) | AC1-AC4 | 291 | 1086 | 0.47 | 0.64 | 0.54 | 0.33 |
| Bean golden mosaic virus (B) | 121 (0%) | AC1-AC4 | 258 | 1086 | 0.44 | 0.86 | 0.34 | 0.06 |
| Bhendi yellow vein mosaic virus* (M) | 39 (98%) | AC1-AC4 | 294 | 1092 | 1.25 | 0.85 | 0.48 | 0.09 |
| Bhendi yellow vein mosaic virus (M) | 32 (99%) | AC1-AC4 | 303 | 1092 | 1.90 | 1.35 | 0.11 | 0.08 |
| Chilli leaf curl virus (M) | 16 (28%) | AC1-AC4 | 300 | 1086 | 0.86 | 0.83 | 0.22 | 0.20 |
| Cotton leaf curl Gezira virus (M) | 21 (9%) | AC1-AC4 | 294 | 1089 | 0.22 | 0.89 | 0.37 | 0.02 |
| Cotton leaf curl Multan virus (M) | 50 (2%) | AC1-AC4 | 303 | 1092 | 0.67 | 0.21 | 0.07 | 0.02 |
| East African cassava mosaic Kenya virus (B) | 50 (0%) | AC1-AC4 | 297 | 1065 | 0.27 | 0.31 | 0.05 | 0.07 |
| East African cassava mosaic Malawi virus (B) | 13 (0%) | AC1-AC4 | 234 | 1080 | 0.07 | 0.06 | 0.20 | 0.19 |
| East African cassava mosaic virus (B) | 153 (2%) | AC1-AC4 | 234 | 1080 | 1.55 | 1.15 | 0.41 | 0.36 |
| East African cassava mosaic Zanzibar virus (B) | 14 (29%) | AC1-AC4 | 258 | 1080 | 0.35 | 0.09 | 0.08 | 0.03 |
| Okra enation leaf curl virus (M) | 60 (92%) | AC1-AC4 | 308 | 1089 | 2.96 | 1.48 | 0.29 | 0.24 |
| South African cassava mosaic virus (B) | 125 (0%) | AC1-AC4 | 297 | 1080 | 0.55 | 0.79 | 0.09 | 0.14 |
| Sweet potato leaf curl virus (M) | 17 (41%) | AC1-AC4 | 258 | 1095 | 0.79 | 0.99 | 0.12 | 0.28 |
| Tomato leaf curl New Delhi virus (B) | 97 (3%) | AC1-AC4 | 303 | 1086 | 3.75 | 3.34 | 0.43 | 0.39 |
| Tomato yellow leaf curl virus (M) | 397 (68%) | AC1-AC4 | 294 | 1074 | 2.43 | 1.60 | 0.70 | 0.05 |
| 5′-terminal (42/54) | ||||||||
| African cassava mosaic virus (B) | 32 (3%) | AC1-AC2 | 93 | 408 | 0.21 | 0.37 | 0.11 | 0.20 |
| 31 (3%) | AC2-AC3 | 260 | 405 | 0.31 | 0.03 | 0.50 | 0.03 | |
| 26 (0%) | AV1-AV2 | 193 | 777 | 0.39 | 0.26 | 0.37 | 0.15 | |
| Alternanthera yellow vein virus (M) | 11 (18%) | AC1-AC2 | 98 | 406 | 0.22 | 0.01 | 0.22 | 0.02 |
| 13 (0%) | AC2-AC3 | 260 | 405 | 0.71 | 0.27 | 0.11 | 0.03 | |
| 10 (60%) | AV1-AV2 | 189 | 771 | 0.33 | 0.76 | 1.15 | 0.21 | |
| Bean golden mosaic virus (B) | 158 (0%) | AC1-AC2 | 89 | 390 | 1.30 | 0.29 | 0.40 | 0.13 |
| 158 (0%) | AC2-AC3 | 254 | 399 | 1.50 | 0.25 | 0.26 | 0.05 | |
| Bhendi yellow vein mosaic virus* (M) | 51 (71%) | AC1-AC2 | 104 | 453 | 1.91 | 1.68 | 0.33 | 0.29 |
| 51 (20%) | AC2-AC3 | 308 | 405 | 3.44 | 0.74 | 0.28 | 0.14 | |
| 50 (40%) | AV1-AV2 | 206 | 771 | 1.76 | 0.85 | 0.63 | 0.14 | |
| Bhendi yellow vein mosaic virus (M) | 57 (54%) | AC1-AC2 | 104 | 453 | 2.42 | 2.82 | 1.01 | 0.58 |
| 57 (2%) | AC2-AC3 | 308 | 405 | 1.80 | 0.56 | 1.18 | 0.56 | |
| 56 (16%) | AV1-AV2 | 206 | 771 | 1.63 | 0.61 | 0.38 | 0.21 | |
| Chilli leaf curl virus (M) | 18 (33%) | AC1-AC2 | 98 | 405 | 0.99 | 0.30 | 0.17 | 0.02 |
| 23 (17%) | AC2-AC3 | 260 | 405 | 3.08 | 0.79 | 0.47 | 0.25 | |
| 22 (18%) | AV1-AV2 | 197 | 771 | 1.22 | 1.33 | 0.18 | 0.24 | |
| Cotton leaf curl Gezira virus (M) | 32 (6%) | AC1-AC2 | 101 | 405 | 0.01 | 0.33 | 0.02 | 0.52 |
| 32 (0%) | AC2-AC3 | 257 | 402 | 0.47 | 0.04 | 0.42 | 0.07 | |
| 31 (0%) | AV1-AV2 | 209 | 777 | 0.35 | 0.37 | 0.16 | 0.24 | |
| Cotton leaf curl Multan virus (M) | 58 (2%) | AC1-AC2 | 104 | 453 | 0.59 | 0.65 | 0.12 | 0.14 |
| 59 (2%) | AC2-AC3 | 308 | 405 | 1.08 | 0.80 | 1.11 | 0.78 | |
| 59 (15%) | AV1-AV2 | 206 | 771 | 1.04 | 0.75 | 0.44 | 0.37 | |
| East African cassava mosaic Kenya virus (B) | 71 (0%) | AC1-AC2 | 77 | 408 | 0.40 | 0.29 | 0.25 | 0.08 |
| 71 (0%) | AC2-AC3 | 260 | 405 | 0.34 | 0.22 | 0.18 | 0.06 | |
| 64 (0%) | AV1-AV2 | 197 | 774 | 0.23 | 0.18 | 0.55 | 0.10 | |
| East African cassava mosaic Malawi virus (B) | 9 (0%) | AC1-AC2 | 92 | 408 | 0.00 | 0.00 | - | - |
| 10 (0%) | AC2-AC3 | 260 | 405 | 0.06 | 0.03 | 0.57 | 0.14 | |
| 12 (0%) | AV1-AV2 | 191 | 777 | 0.05 | 0.08 | 0.17 | 0.22 | |
| East African cassava mosaic virus (B) | 166 (2%) | AC1-AC2 | 92 | 405 | 1.79 | 0.97 | 2.47 | 0.27 |
| 162 (0%) | AC2-AC3 | 260 | 405 | 1.38 | 0.60 | 0.67 | 0.05 | |
| 105 (0%) | AV1-AV2 | 197 | 775 | 0.79 | 0.31 | 0.58 | 0.09 | |
| East African cassava mosaic Zanzibar virus (B) | 15 (27%) | AC1-AC2 | 92 | 408 | 0.23 | 0.01 | 0.50 | 0.15 |
| 15 (0%) | AC2-AC3 | 260 | 405 | 0.11 | 0.10 | 1.76 | 0.42 | |
| 15 (0%) | AV1-AV2 | 197 | 775 | 0.20 | 0.07 | 0.63 | 0.27 | |
| Okra enation leaf curl virus (M) | 67 (97%) | AC1-AC2 | 104 | 453 | 3.45 | 3.18 | 0.51 | 0.23 |
| 68 (32%) | AC2-AC3 | 308 | 405 | 1.04 | 0.63 | 1.44 | 0.17 | |
| 41 (58%) | AV1-AV2 | 188 | 771 | 0.64 | 1.26 | 0.24 | 0.62 | |
| Pepper golden mosaic virus (B) | 54 (57%) | AC1-AC2 | 59 | 390 | 1.49 | 0.66 | 0.47 | 0.12 |
| 54 (0%) | AC2-AC3 | 254 | 399 | 0.94 | 0.89 | 0.34 | 0.94 | |
| Pepper huasteco yellow vein virus (B) | 19 (5%) | AC1-AC2 | 80 | 417 | 1.01 | 0.01 | 0.38 | 0.28 |
| 45 (0%) | AC2-AC3 | 254 | 399 | 0.74 | 0.42 | 1.99 | 0.32 | |
| South African cassava mosaic virus (B) | 131 (0%) | AC1-AC2 | 92 | 408 | 0.56 | 0.77 | 0.47 | 1.52 |
| 130 (0%) | AC2-AC3 | 260 | 405 | 0.67 | 0.48 | 0.40 | 0.64 | |
| 126 (4%) | AV1-AV2 | 191 | 777 | 0.73 | 0.64 | 1.17 | 0.65 | |
| Sweet potato leaf curl virus (M) | 18 (39%) | AC1-AC2 | 92 | 452 | 0.54 | 1.68 | 0.39 | 0.33 |
| 14 (7%) | AC2-AC3 | 278 | 435 | 2.96 | 0.73 | 1.78 | 0.25 | |
| 18 (9%) | AV1-AV2 | 176 | 765 | 0.52 | 0.17 | 0.87 | 0.10 | |
| Tomato leaf curl New Delhi virus (B) | 88 (4%) | AC1-AC2 | 98 | 420 | 2.83 | 1.47 | 0.71 | 0.62 |
| 113 (1%) | AC2-AC3 | 281 | 411 | 5.99 | 1.56 | 0.57 | 0.46 | |
| 115 (0%) | AV1-AV2 | 179 | 771 | 2.90 | 2.12 | 1.16 | 0.77 | |
| Tomato yellow leaf curl virus (M) | 588 (9%) | AC1-AC2 | 92 | 408 | 7.68 | 5.22 | 0.96 | 0.43 |
| 521 (10%) | AC2-AC3 | 260 | 405 | 6.37 | 3.08 | 0.95 | 0.64 | |
| 593 (10%) | AV1-AV2 | 191 | 777 | 3.47 | 3.16 | 0.89 | 0.42 | |
| 3′-terminal (39/54) | ||||||||
| African cassava mosaic virus (B) | 27 (3%) | AC1-AC2 | 93 | 1077 | 0.53 | 0.36 | 0.50 | 0.29 |
| 32 (3%) | AC2-AC3 | 260 | 408 | 0.21 | 0.03 | 0.44 | 0.20 | |
| 33 (0%) | AV1-AV2 | 193 | 342 | 0.54 | 0.24 | 0.47 | 0.18 | |
| Alternanthera yellow vein virus (M) | 11 (18%) | AC1-AC2 | 98 | 1086 | 0.47 | 0.01 | 0.48 | 0.02 |
| 11 (0%) | AC2-AC3 | 260 | 406 | 0.22 | 0.27 | 0.45 | 0.57 | |
| 12 (60%) | AV1-AV2 | 189 | 348 | 1.21 | 0.76 | 0.57 | 0.13 | |
| Bean golden mosaic virus (B) | 121 (0%) | AC1-AC2 | 89 | 1086 | 0.44 | 0.10 | 0.56 | 0.34 |
| 158 (0%) | AC2-AC3 | 254 | 390 | 0.30 | 0.28 | 0.65 | 0.61 | |
| Bhendi yellow vein mosaic virus* (M) | 39 (92%) | AC1-AC2 | 104 | 1092 | 1.25 | 0.91 | 0.58 | 0.38 |
| 51 (20%) | AC2-AC3 | 308 | 453 | 1.91 | 0.91 | 0.27 | 0.03 | |
| 50 (40%) | AV1-AV2 | 206 | 366 | 1.34 | 0.46 | 0.13 | 0.10 | |
| Bhendi yellow vein mosaic virus (M) | 23 (98%) | AC1-AC2 | 104 | 1092 | 1.90 | 0.88 | 0.16 | 0.70 |
| 57 (2%) | AC2-AC3 | 308 | 453 | 2.42 | 0.57 | 0.21 | 0.51 | |
| 55 (16%) | AV1-AV2 | 206 | 366 | 0.89 | 0.32 | 0.78 | 0.54 | |
| Chilli leaf curl virus (M) | 16 (38%) | AC1-AC2 | 98 | 1086 | 0.86 | 0.10 | 0.30 | 0.12 |
| 18 (17%) | AC2-AC3 | 260 | 405 | 0.99 | 0.50 | 0.66 | 0.57 | |
| 16 (19%) | AV1-AV2 | 197 | 357 | 0.26 | 0.45 | 1.76 | 2.67 | |
| Cotton leaf curl Gezira virus (M) | 21 (9%) | AC1-AC2 | 101 | 1089 | 0.22 | 0.33 | 0.07 | 0.33 |
| 32 (0%) | AC2-AC3 | 257 | 405 | 0.01 | 0.03 | 0.24 | 0.47 | |
| 29 (0%) | AV1-AV2 | 209 | 369 | 0.08 | 0.50 | 0.07 | 0.63 | |
| Cotton leaf curl Multan virus (M) | 50 (2%) | AC1-AC2 | 104 | 1092 | 0.67 | 0.38 | 0.27 | 0.03 |
| 58 (2%) | AC2-AC3 | 308 | 453 | 0.59 | 0.75 | 0.11 | 0.14 | |
| 57 (16%) | AV1-AV2 | 206 | 366 | 0.45 | 0.46 | 0.24 | 0.26 | |
| East African cassava mosaic Kenya virus (B) | 50 (0%) | AC1-AC2 | 77 | 1065 | 0.27 | 0.01 | 0.38 | 0.25 |
| 71 (0%) | AC2-AC3 | 260 | 408 | 0.40 | 0.25 | 0.25 | 0.61 | |
| 56 (0%) | AV1-AV2 | 197 | 357 | 0.16 | 0.18 | 0.42 | 0.45 | |
| East African cassava mosaic Malawi virus (B) | 13 (0%) | AC1-AC2 | 92 | 1080 | 0.07 | 0.00 | 0.16 | 0.00 |
| 9 (0%) | AC2-AC3 | 260 | 408 | 0.00 | 0.00 | - | - | |
| 12 (0%) | AV1-AV2 | 191 | 351 | 0.06 | 0.08 | 0.34 | 0.39 | |
| East African cassava mosaic virus (B) | 153 (3%) | AC1-AC2 | 92 | 1080 | 1.55 | 0.62 | 0.43 | 0.25 |
| 166 (0%) | AC2-AC3 | 260 | 405 | 1.79 | 0.62 | 0.43 | 0.35 | |
| 136 (0%) | AV1-AV2 | 197 | 357 | 0.75 | 0.32 | 0.36 | 0.22 | |
| East African cassava mosaic Zanzibar virus (B) | 14 (29%) | AC1-AC2 | 92 | 1080 | 0.35 | 0.01 | 0.32 | 0.17 |
| 15 (0%) | AC2-AC3 | 260 | 408 | 0.23 | 0.10 | 0.77 | 0.28 | |
| 13 (0%) | AV1-AV2 | 197 | 357 | 0.15 | 0.07 | 0.65 | 0.47 | |
| Okra enation leaf curl virus (M) | 60 (92%) | AC1-AC2 | 104 | 1089 | 2.96 | 4.66 | 0.05 | 0.25 |
| 67 (33%) | AC2-AC3 | 308 | 453 | 3.45 | 0.68 | 0.32 | 0.04 | |
| 45 (53%) | AV1-AV2 | 188 | 348 | 0.38 | 0.75 | 0.21 | 0.50 | |
| Pepper golden mosaic virus (B) | 54 (57%) | AC1-AC2 | 59 | 1050 | 1.47 | 0.68 | 0.25 | 0.01 |
| 54 (0%) | AC2-AC3 | 254 | 390 | 1.49 | 0.92 | 0.44 | 0.29 | |
| Pepper huasteco yellow vein virus (B) | 44 (2%) | AC1-AC2 | 80 | 1050 | 0.81 | 0.12 | 0.26 | 0.11 |
| 19 (0%) | AC2-AC3 | 254 | 417 | 1.01 | 0.21 | 1.40 | 1.03 | |
| South African cassava mosaic virus (B) | 125 (0%) | AC1-AC2 | 92 | 1080 | 0.55 | 0.60 | 1.04 | 1.47 |
| 131 (0%) | AC2-AC3 | 260 | 408 | 0.56 | 0.42 | 0.70 | 0.43 | |
| 128 (4%) | AV1-AV2 | 191 | 351 | 1.16 | 0.99 | 0.24 | 0.08 | |
| Sweet potato leaf curl virus (M) | 17 (41%) | AC1-AC2 | 92 | 1095 | 0.79 | 1.61 | 0.57 | 1.50 |
| 18 (6%) | AC2-AC3 | 278 | 452 | 0.54 | 1.21 | 0.70 | 1.16 | |
| 18 (9%) | AV1-AV2 | 176 | 345 | 0.62 | 0.16 | 0.18 | 0.06 | |
| Tomato leaf curl New Delhi virus (B) | 97 (3%) | AC1-AC2 | 98 | 1086 | 3.75 | 1.86 | 0.16 | 0.13 |
| 88 (1%) | AC2-AC3 | 281 | 420 | 2.83 | 0.88 | 0.12 | 0.84 | |
| 105 (0%) | AV1-AV2 | 179 | 339 | 2.78 | 1.58 | 0.71 | 0.52 | |
| Tomato yellow leaf curl virus (M) | 397 (8%) | AC1-AC2 | 92 | 1074 | 2.43 | 2.23 | 0.40 | 1.52 |
| 588 (9%) | AC2-AC3 | 260 | 408 | 7.67 | 4.27 | 0.20 | 0.87 | |
| 623 (9%) | AV1-AV2 | 191 | 351 | 3.01 | 2.27 | 0.40 | 0.18 | |
References
- Simon-Loriere, E.; Holmes, E.C.; Pagán, I. The effect of gene overlapping on the rate of RNA virus evolution. Mol. Biol. Evol. 2013, 30, 1916–1928. [Google Scholar] [CrossRef] [PubMed] [Green Version]
- Schlub, T.E.; Holmes, E.C. Properties and abundance of overlapping genes in viruses. Virus Evol. 2020, 6, veaa009. [Google Scholar] [CrossRef] [PubMed] [Green Version]
- Gogarten, J.P.; Townsend, J.P. Horizontal Gene Transfer, Genome Innovation and Evolution. Nat. Rev. Microbiol. 2005, 3, 679–687. [Google Scholar] [CrossRef] [PubMed]
- Fernandes, J.D.; Faust, T.B.; Strauli, N.B.; Smith, C.; Crosby, D.C.; Nakamura, R.L.; Hernandez, R.D.; Frankel, A.D. Functional Segregation of Overlapping Genes in HIV. Cell 2016, 167, 1762–1773. [Google Scholar] [CrossRef] [PubMed] [Green Version]
- Nelson, C.W.; Ardern, Z.; Goldberg, T.L.; Meng, C.; Kuo, C.-H.; Ludwig, C.; Kolokotronis, S.-O.; Wei, X. Dynamically evolving novel overlapping gene as a factor in the SARS-CoV-2 pandemic. eLife 2020, 9, e59633. [Google Scholar] [CrossRef] [PubMed]
- Wright, B.W.; Ruan, J.; Molloy, M.P.; Jaschke, P.R. Genome modularization reveals overlapped gene topology is necessary for efficient viral reproduction. ACS Synth. Biol. 2020, 9, 3079–3090. [Google Scholar] [CrossRef]
- Krakauer, D.C. Stability and evolution of overlapping genes. Evolution 2000, 54, 731–739. [Google Scholar] [CrossRef]
- Belshaw, R.; Gardner, A.; Rambaut, A.; Pybus, O.G. Pacing a small cage: Mutation and RNA viruses. Trends Ecol. Evol. 2008, 23, 188–193. [Google Scholar] [CrossRef]
- Brandes, N.; Linial, M. Gene overlapping and size constraints in the viral world. Biol. Direct 2016, 11, 26. [Google Scholar] [CrossRef] [Green Version]
- Belshaw, R.; Pybus, O.G.; Rambaut, A. The evolution of genome compression and genomic novelty in RNA viruses. Genome Res. 2007, 17, 1496–1504. [Google Scholar] [CrossRef] [Green Version]
- Sanjuán, R.; Domingo-Calap, P. Mechanisms of viral mutation. Cell Mol. Life Sci. 2016, 73, 4433–4448. [Google Scholar] [CrossRef] [Green Version]
- Duffy, S.; Shackelton, L.A.; Holmes, E.C. Rates of evolutionary change in viruses: Patterns and determinants. Nat. Rev. Genet. 2008, 9, 267–276. [Google Scholar] [CrossRef] [PubMed]
- Cui, J.; Schlub, T.E.; Holmes, E.C. An Allometric Relationship between the Genome Length and Virion Volume of Viruses. J. Virol. 2014, 88, 6403–6410. [Google Scholar] [CrossRef] [PubMed] [Green Version]
- Wu, M.; Wei, H.; Tan, H.; Pan, S.; Liu, Q.; Bejarano, E.R.; Lozano-Durán, R. Plant DNA polymerases α and δ mediate replication of geminiviruses. Nat. Commun. 2021, 12, 2780. [Google Scholar] [CrossRef] [PubMed]
- Fiallo-Olivé, E.; Lett, J.-M.; Martin, D.P.; Roumagnac, P.; Varsani, A.; Zerbini, F.M.; Navas-Castillo, J. ICTV Report Consortium. ICTV Virus Taxonomy Profile: Geminiviridae 2021. J. Gen. Virol. 2021, 102, 001696. [Google Scholar] [CrossRef] [PubMed]
- Hanley-Bowdoin, L.; Bejarano, E.R.; Robertson, D.; Mansoor, S. Geminiviruses: Masters at redirecting and reprogramming plant processes. Nat. Rev. Microbiol. 2013, 11, 777–788. [Google Scholar] [CrossRef]
- Zerbini, F.M.; Briddon, R.W.; Idris, A.; Martin, D.P.; Moriones, E.; Navas-Castillo, J.; Rivera-Bustamante, R.; Roumagnac, P.; Varsani, A.; ICTV Report Consortium. ICTV Virus Taxonomy Profile: Geminiviridae. J. Gen. Virol. 2017, 98, 131–133. [Google Scholar] [CrossRef]
- Pagán, I.; García-Arenal, F. Population Genomics of Plant Viruses. In Population Genomics: Microorganisms; Polz, M.F., Rajora, O.P., Eds.; Springer International Publishing: New York, NY, USA, 2018. [Google Scholar]
- Ge, L.; Zhang, J.; Zhou, X.; Li, H. Genetic Structure and Population Variability of Tomato Yellow Leaf Curl China Virus. J. Virol. 2007, 81, 5902–5907. [Google Scholar] [CrossRef] [Green Version]
- Rodelo-Urrego, M.; García-Arenal, F.; Pagán, I. The effect of ecosystem biodiversity on virus genetic diversity depends on virus species: A study of chiltepin-infecting begomoviruses in Mexico. Virus Evol. 2015, 1, vev004. [Google Scholar] [CrossRef] [Green Version]
- Edgar, R.C. MUSCLE: Multiple sequence alignment with high accuracy and high throughput. Nucleic Acids Res. 2004, 32, 1792–1797. [Google Scholar] [CrossRef] [Green Version]
- Larsson, A. AliView: A fast and lightweight alignment viewer and editor for large data sets. Bioinformatics 2014, 30, 3276–3278. [Google Scholar] [CrossRef] [PubMed]
- Kosakovsky Pond, S.L.; Frost, S.D. Datamonkey: Rapid detection of selective pressure on individual sites of codon alignments. Bioinformatics 2005, 21, 2531–2533. [Google Scholar] [CrossRef] [PubMed]
- Kosakovsky Pond, S.L.; Frost, S.D.; Grossman, Z.; Gravenor, M.B.; Richman, D.D.; Leigh Brown, A.J. Adaptation to different human populations by HIV-1 revealed by codon-based analyses. PLoS Comp. Biol. 2006, 2, e62. [Google Scholar] [CrossRef] [PubMed] [Green Version]
- Martin, D.P.; Varsani, A.; Roumagnac, P.; Botha, G.; Maslamoney, S.; Schwab, T.; Kelz, Z.; Kumar, V.; Murrell, B. RDP5: A computer program for analyzing recombination in, and removing signals of recombination from, nucleotide sequence datasets. Virus Evol. 2020, 7, veaa087. [Google Scholar] [CrossRef] [PubMed]
- Lefeuvre, P.; Lett, J.-M.; Reynaud, B.; Martin, D.P. Avoidance of protein fold disruption in natural virus recombinants. PLoS Pathog 2007, 3, e181. [Google Scholar] [CrossRef] [PubMed] [Green Version]
- Belgorodski, N.; Greiner, M.; Tolksdorf, K.; Schueller, K.; rriskDistributions: Fitting Distributions to Given Data or Known Quantiles. R Package v.2.1. Available online: https://CRAN.R-project.org/package=rriskDistributions (accessed on 16 December 2021).
- Sokal, R.R.; Rohlf, F.J. Biometry: The Principles and Practices of Statistics in Biological Research; W.H. Freeman & Company: New York, NY, USA, 1995. [Google Scholar]
- R Core Team. R: A Language and Environment for Statistical Computing; R Foundation for Statistical Computing: Vienna, Austria, 2021; Available online: https://www.R-project.org/ (accessed on 16 December 2021).
- Luna, A.P.; Lozano-Durán, R. Geminivirus-Encoded Proteins: Not All Positional Homologs Are Made Equal. Front. Microbiol. 2020, 11, 878. [Google Scholar] [CrossRef]
- Chirico, N.; Vianelli, A.; Belshaw, R. Why genes overlap in viruses. Proc. Biol. Sci. 2010, 277, 3809–3817. [Google Scholar] [CrossRef] [Green Version]
- Rancurel, C.; Khosravi, M.; Dunker, A.K.; Romero, P.R.; Karlin, D. Overlapping Genes Produce Proteins with Unusual Sequence Properties and Offer Insight into De Novo Protein Creation. J. Virol. 2009, 83, 10719–10736. [Google Scholar] [CrossRef] [Green Version]
- Sabath, N.; Wagner, A.; Karlin, D. Evolution of Viral Proteins Originated De Novo by Overprinting. Mol. Biol. Evol. 2012, 29, 3767–3780. [Google Scholar] [CrossRef] [Green Version]
- Krakauer, D.C. Evolutionary principles of genomic compression. Comments Theor. Biol. 2002, 7, 215–236. [Google Scholar] [CrossRef]
- Elena, S.F.; Carrasco, P.; Darós, J.A.; Sanjuán, R. Mechanisms of genetic robustness. EMBO Rep. 2006, 7, 168–173. [Google Scholar] [CrossRef] [PubMed] [Green Version]
- Holmes, E.C. Error thresholds and the constraints to RNA virus evolution. Trends Microbiol. 2003, 11, 543–546. [Google Scholar] [CrossRef] [PubMed]
- Lillo, F.; Krakauer, D.C. A statistical analysis of the three-fold evolution of genomic compression through frame overlaps in prokaryotes. Biol. Direct 2007, 2, 22. [Google Scholar] [CrossRef] [PubMed] [Green Version]
- Krakauer, D.C.; Plotkin, J.B. Redundancy, antiredundancy, and the robustness of genomes. Proc. Natl. Acad. Sci. USA 2002, 99, 1405–1409. [Google Scholar] [CrossRef] [PubMed] [Green Version]
- Peleg, O.; Kirzhner, V.; Trifonov, E.; Bolshoy, A. Overlapping messages and survivability. J. Mol. Evol. 2004, 59, 520–527. [Google Scholar] [CrossRef]
- Hughes, A.L.; Westover, K.; da Silva, J.; O’Connor, D.H.; Watkins, D.I. Simultaneous positive and purifying selection on overlapping reading frames of the tat and vpr genes of simian immunodeficiency virus. J. Virol. 2001, 75, 7966–7972. [Google Scholar] [CrossRef] [Green Version]
- Guyader, S.; Ducray, D.G. Sequence analysis of potato leafroll virus isolates reveals genetic stability, major evolutionary events and differential selection pressure between overlapping reading frame products. J. Gen. Virol. 2002, 83, 1799–1807. [Google Scholar] [CrossRef]
- Pagán, I.; Holmes, E.C. Long-term evolution of the Luteoviridae: Time scale and mode of virus speciation. J. Virol. 2010, 84, 6177–6187. [Google Scholar] [CrossRef] [Green Version]
- Schneider, W.L.; Roossinck, M.J. Genetic diversity in RNA viral quasispecies is controlled by host-virus interactions. J. Virol. 2001, 75, 6566–6571. [Google Scholar] [CrossRef] [Green Version]
- Deem, A.; Keszthelyi, A.; Blackgrove, T.; Vayl, A.; Coffey, B.; Mathur, R.; Chabes, A.; Malkova, A. Break-induced replication is highly inaccurate. PLoS Biol. 2011, 9, e1000594. [Google Scholar] [CrossRef] [Green Version]
- Hicks, W.M.; Kim, M.; Haber, J.E. Increased mutagenesis and unique mutation signature associated with mitotic gene conversion. Science 2010, 329, 82–85. [Google Scholar] [CrossRef] [PubMed] [Green Version]
- Fondong, V.N. Geminivirus protein structure and function. Mol. Plant. Pathol. 2013, 14, 635–649. [Google Scholar] [CrossRef] [PubMed]
- Luna, A.P.; Romero-Rodríguez, B.; Rosas-Díaz, T.; Cerero, L.; Rodríguez-Negrete, E.A.; Castillo, A.G.; Bejarano, E.R. Characterization of Curtovirus V2 protein, a functional homolog of Begomovirus V2. Front. Plant Sci. 2020, 11, 835. [Google Scholar] [CrossRef] [PubMed]
- Lacatus, G.; Sunter, G. The Arabidopsis PEAPOD2 transcription factor interacts with geminivirus AL2 protein and the coat protein promoter. Virology 2009, 392, 196–202. [Google Scholar] [CrossRef] [Green Version]
- Pagán, I.; Betancourt, M.; de Miguel, J.; Piñero, d.; Fraile, A.; García-Arenal, F. Genomic and biological characterization of chiltepín yellow mosaic virus, a new tymovirus infecting Capsicum annuum var. aviculare in Mexico. Arch. Virol. 2010, 155, 675–684. [Google Scholar] [CrossRef] [Green Version]
- Deom, C.M.; Brewer, M.T.; Severns, P.M. Positive selection and intrinsic disorder are associated with multifunctional C4(AC4) proteins and geminivirus diversification. Sci. Rep. 2021, 11, 11150. [Google Scholar] [CrossRef]
- Fondong, V.N. The ever-expanding role of C4/AC4 in Geminivirus infection: Punching above its weight? Mol. Plant 2019, 12, 145–147. [Google Scholar] [CrossRef] [Green Version]
- Martin, D.P.; Lefeuvre, P.; Varsani, A.; Hoareau, M.; Semegni, J.-Y.; Dijoux, B.; Vincent, C.; Reynaud, B.; Lett, J.-M. Complex recombination patterns arising during geminivirus coinfections preserve and demarcate biologically important intra-genome interaction networks. PLoS Pathog. 2011, 7, e1002203. [Google Scholar] [CrossRef] [Green Version]
- Simon-Loriere, E.; Holmes, E.C. Why do RNA viruses recombine? Nat. Rev. Microbiol. 2011, 9, 617–626. [Google Scholar] [CrossRef]

Publisher’s Note: MDPI stays neutral with regard to jurisdictional claims in published maps and institutional affiliations. |
© 2022 by the authors. Licensee MDPI, Basel, Switzerland. This article is an open access article distributed under the terms and conditions of the Creative Commons Attribution (CC BY) license (https://creativecommons.org/licenses/by/4.0/).
Share and Cite
Martín-Hernández, I.; Pagán, I. Gene Overlapping as a Modulator of Begomovirus Evolution. Microorganisms 2022, 10, 366. https://doi.org/10.3390/microorganisms10020366
Martín-Hernández I, Pagán I. Gene Overlapping as a Modulator of Begomovirus Evolution. Microorganisms. 2022; 10(2):366. https://doi.org/10.3390/microorganisms10020366
Chicago/Turabian StyleMartín-Hernández, Iván, and Israel Pagán. 2022. "Gene Overlapping as a Modulator of Begomovirus Evolution" Microorganisms 10, no. 2: 366. https://doi.org/10.3390/microorganisms10020366