
Lysinibacillus sp. GG242 from Cattle Slurries Degrades 17β-Estradiol and Possible 2 Transformation Routes


Abstract
:
1. Introduction
2. Materials and Methods
2.1. Chemicals and Culture Mediums
2.2. Morphology and Growth Curve of Strain GG242
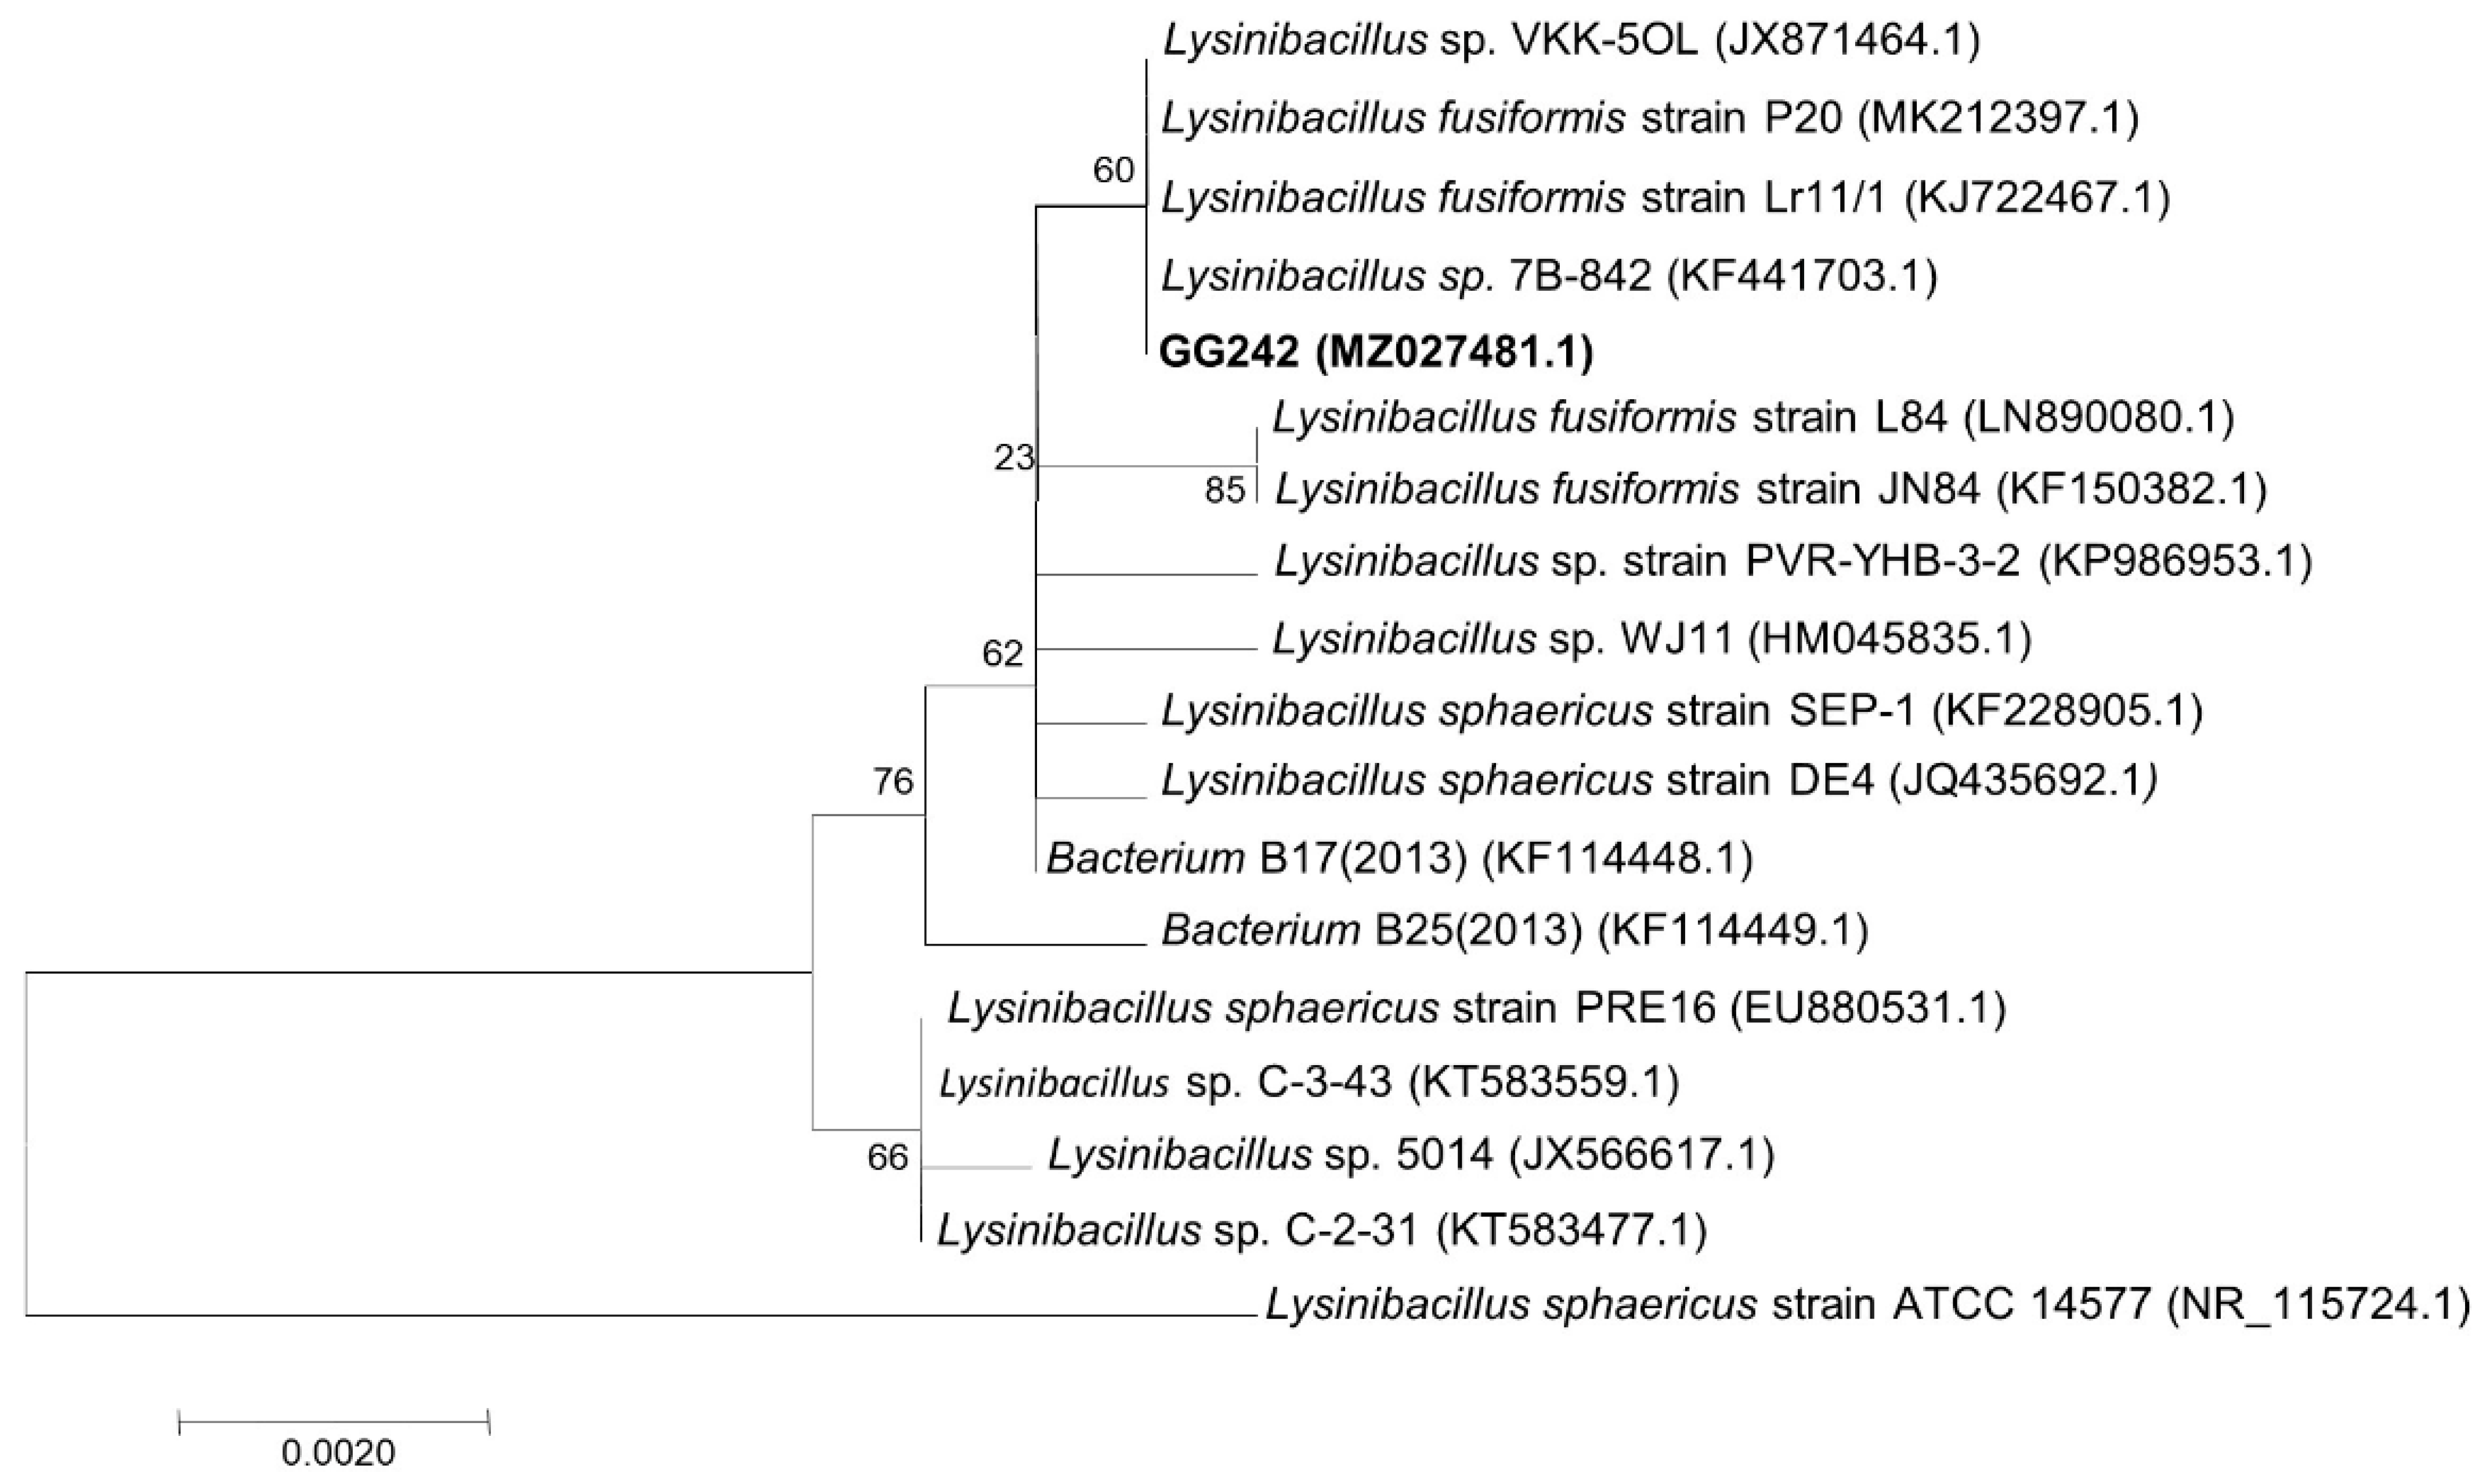
2.3. Identification of Strain GG242
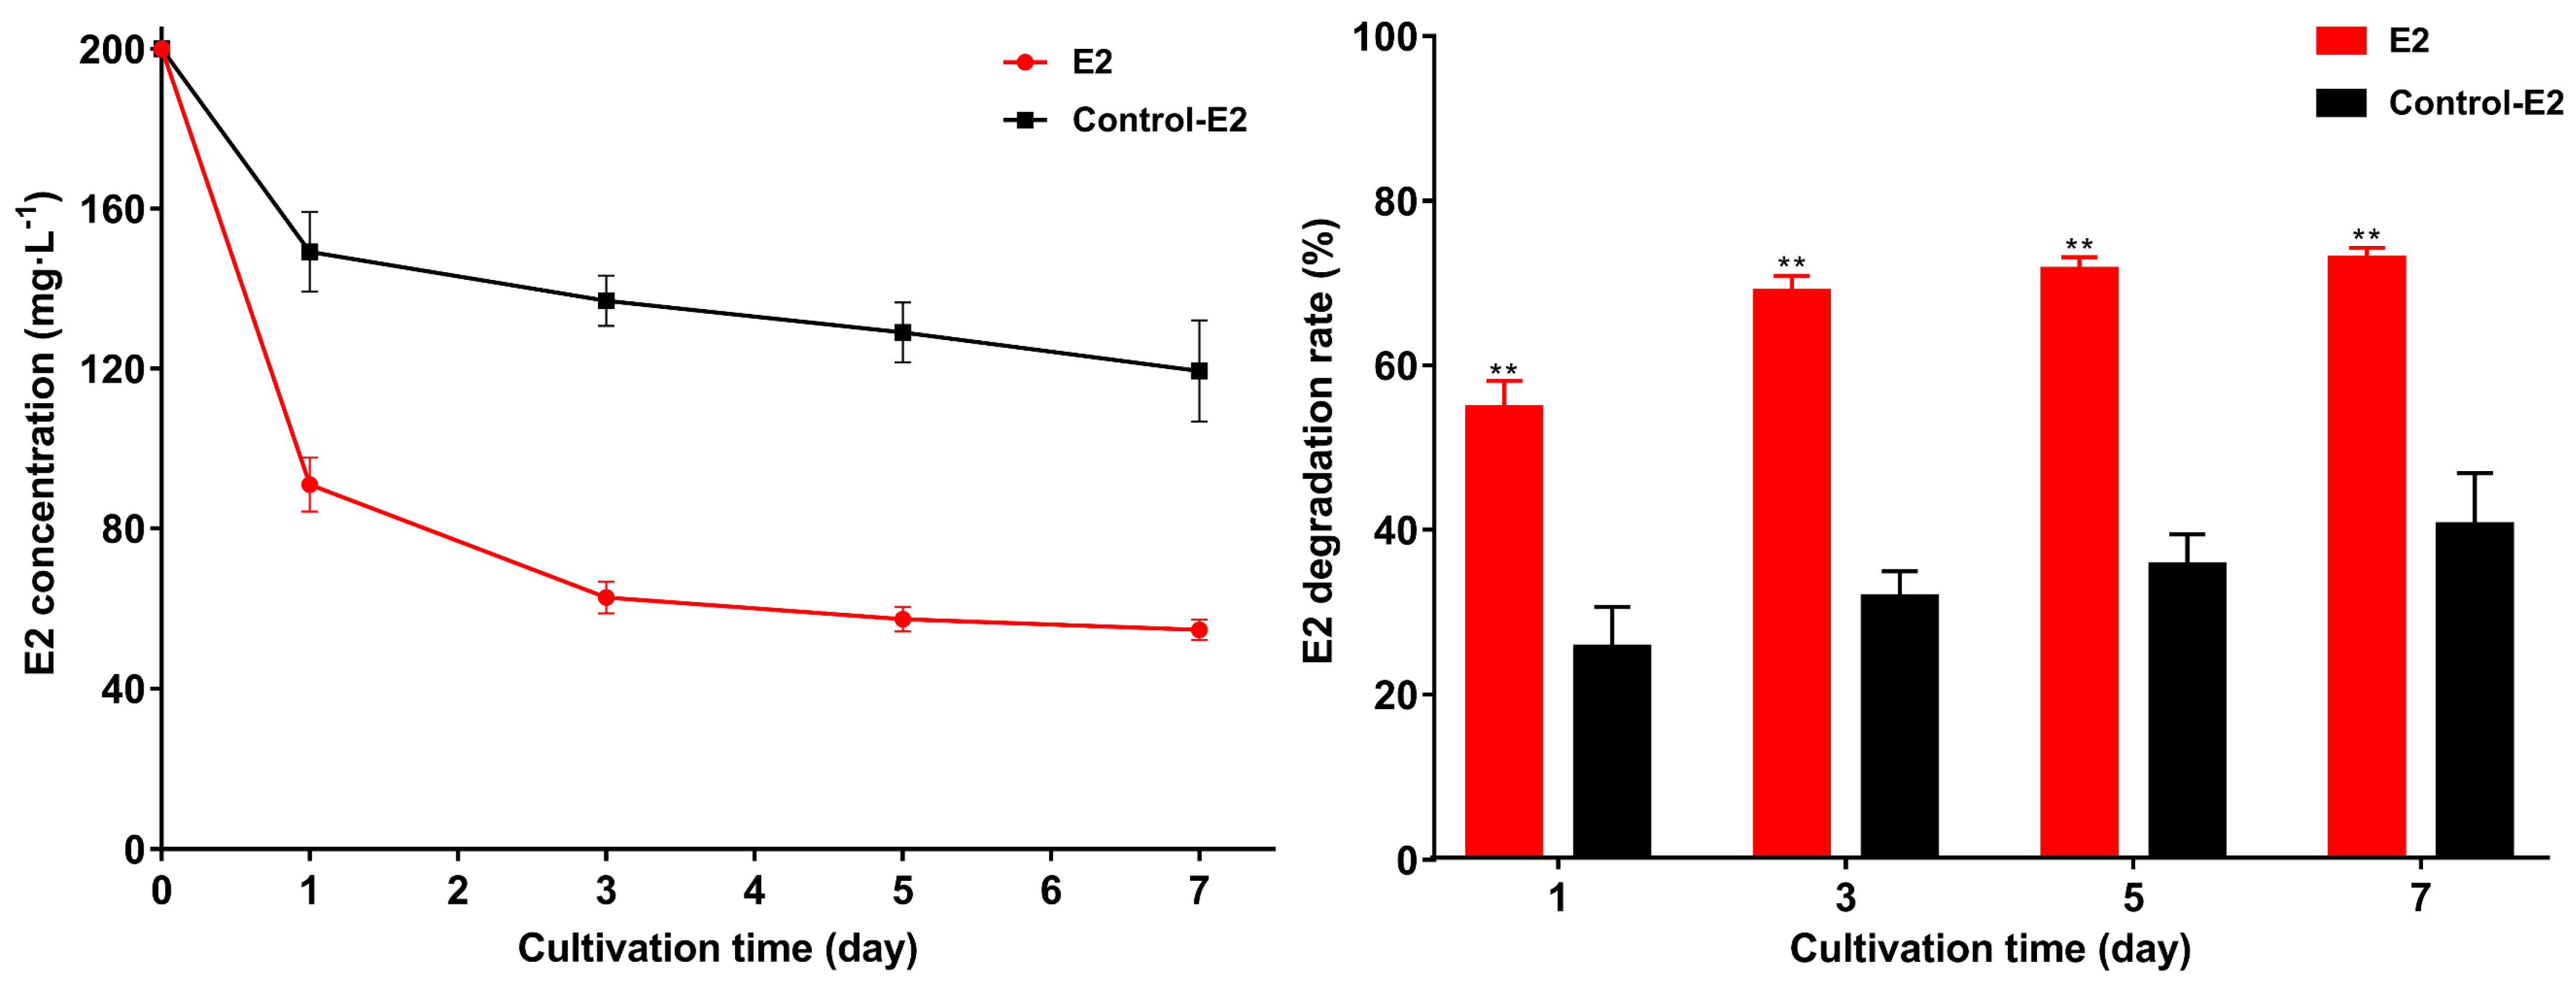
2.4. Exploring the E2 Degradation Performance of Strain GG242 and the Ability of Intracellular and Extracellular Enzymes to Degrade E2
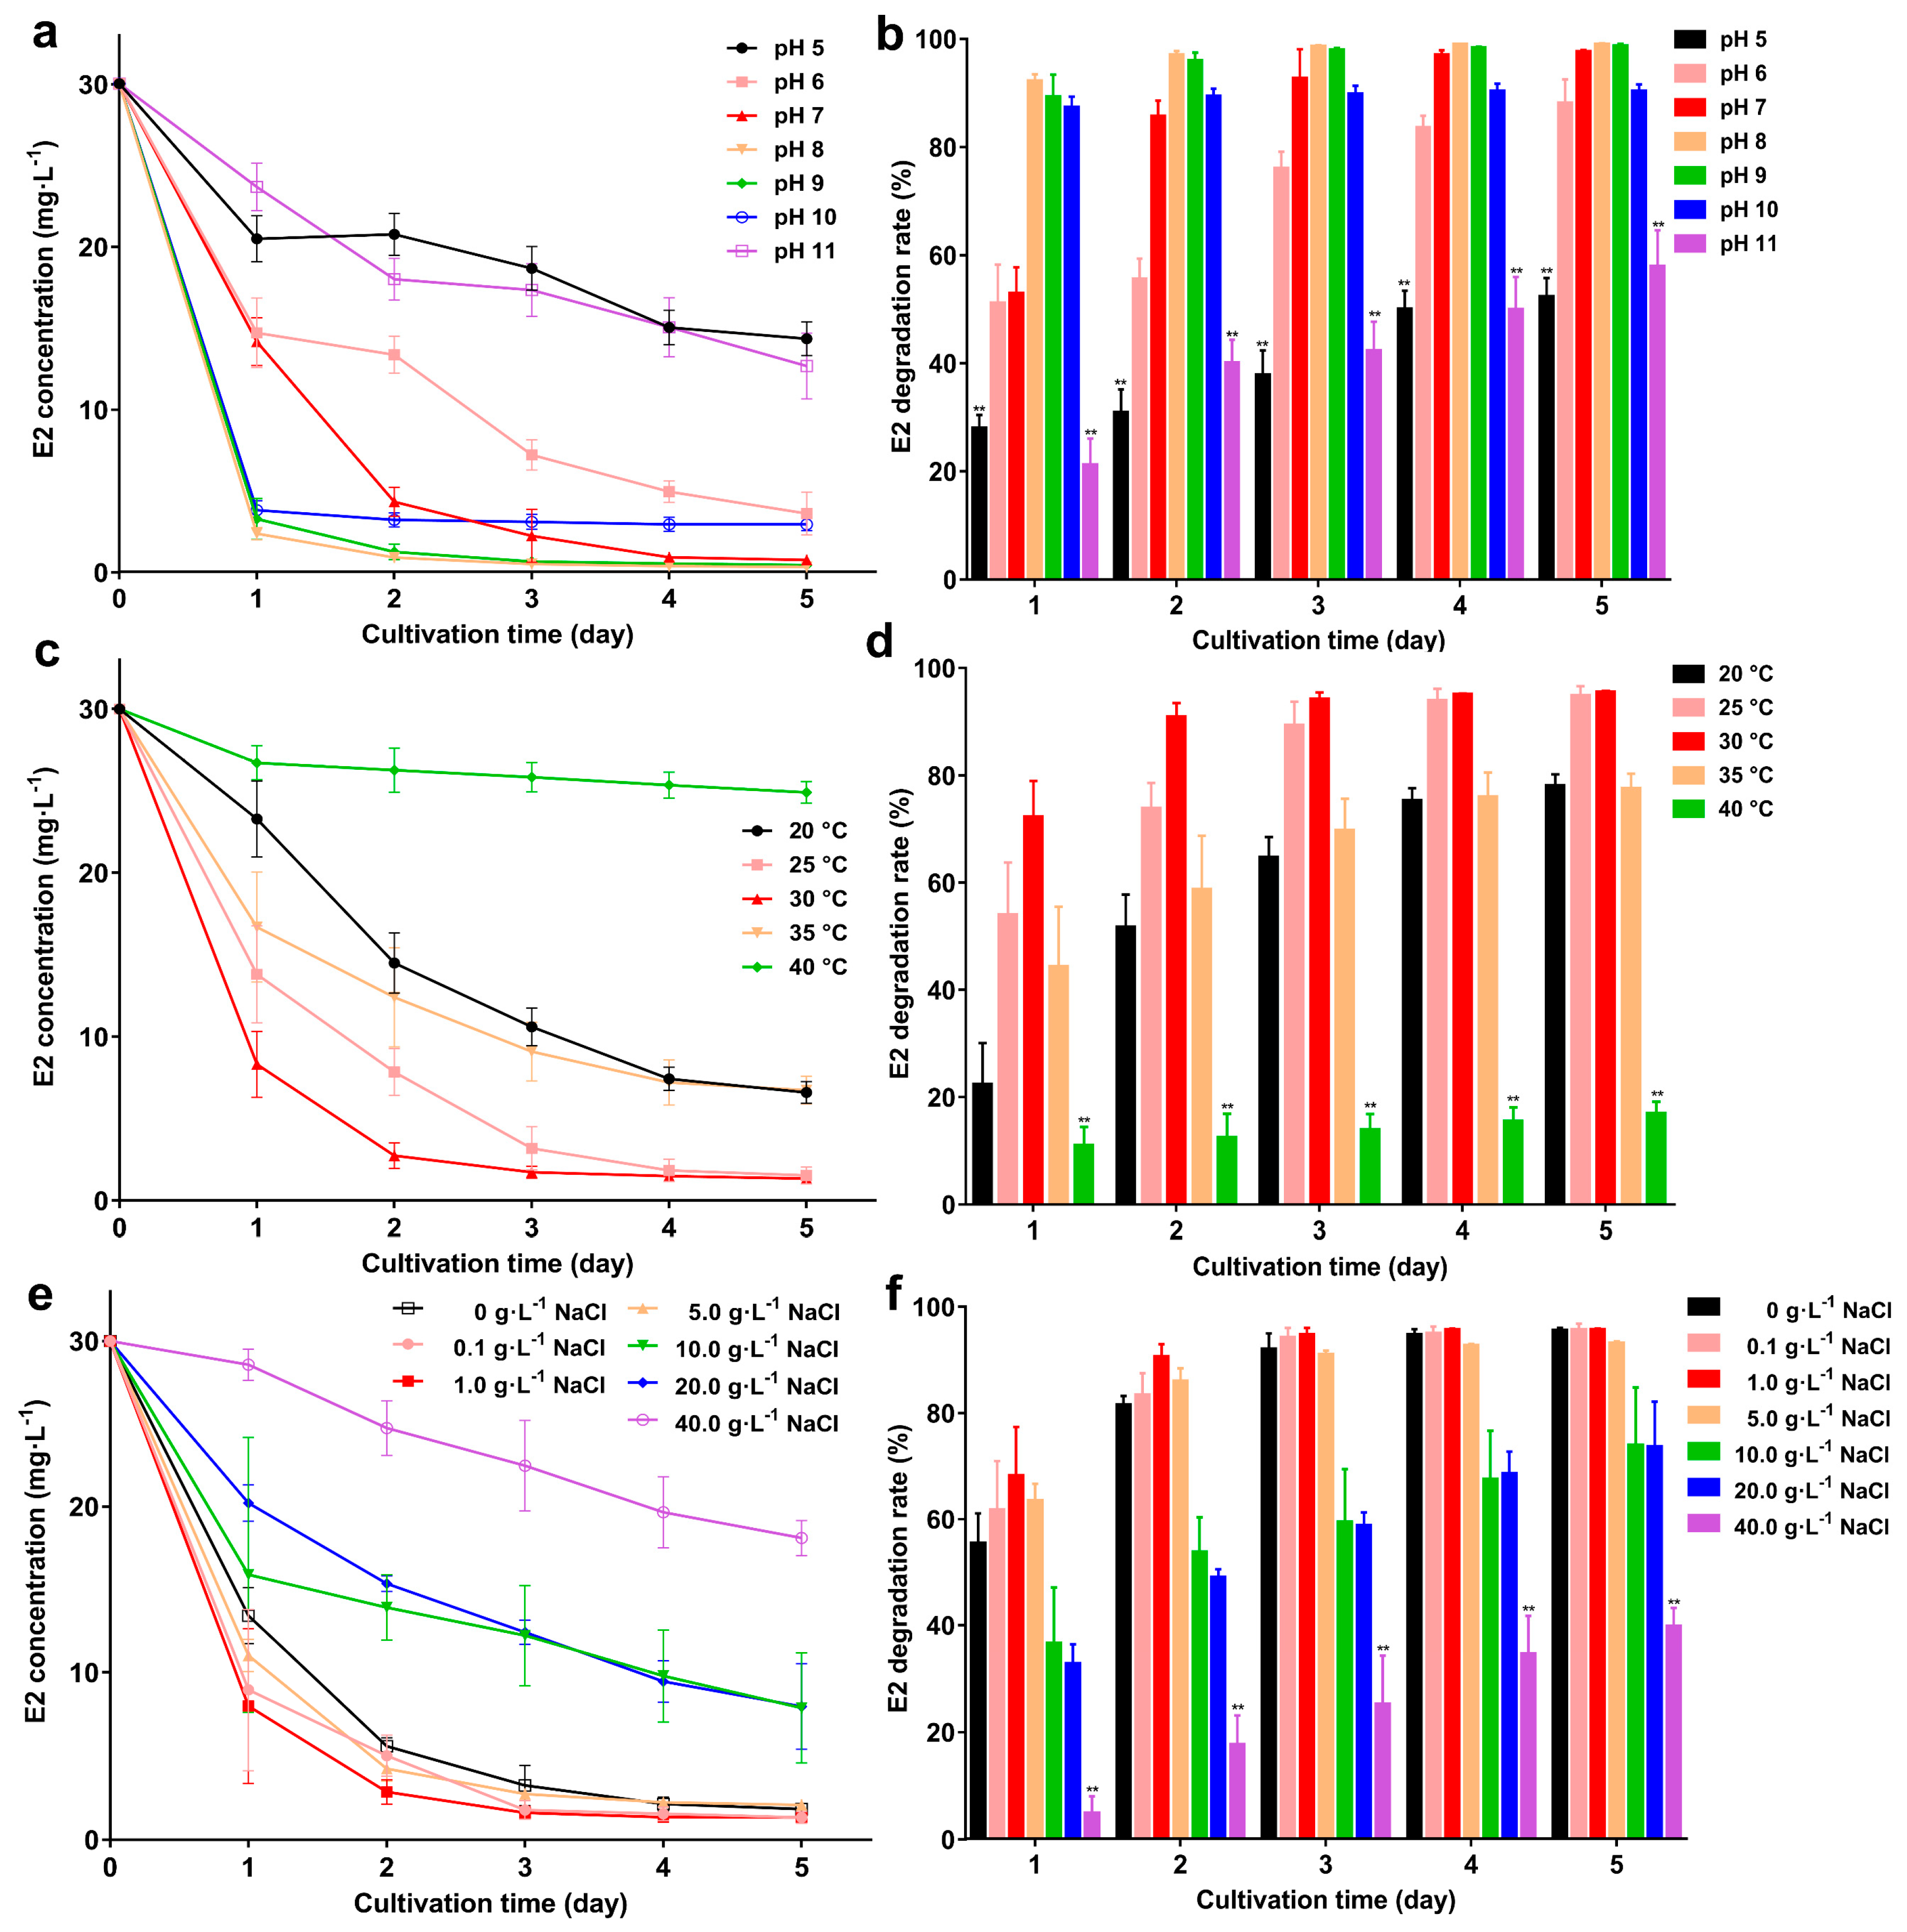
2.5. Exploring E2 Degradation Performance at Different pH, Temperature, and Salinity
2.6. Detection of E2 Transformation Products by LC-ESI-MS
2.7. Statistical Analyses and E2 Detection Methods
3. Results
3.1. Characterization and Identification of the Strain GG242
3.2. E2 Degradation by Strain GG242, Intracellular and Extracellular Enzymes
3.3. Effects of Temperature, pH, and Salinity on the Degradation Ability of Strain GG242
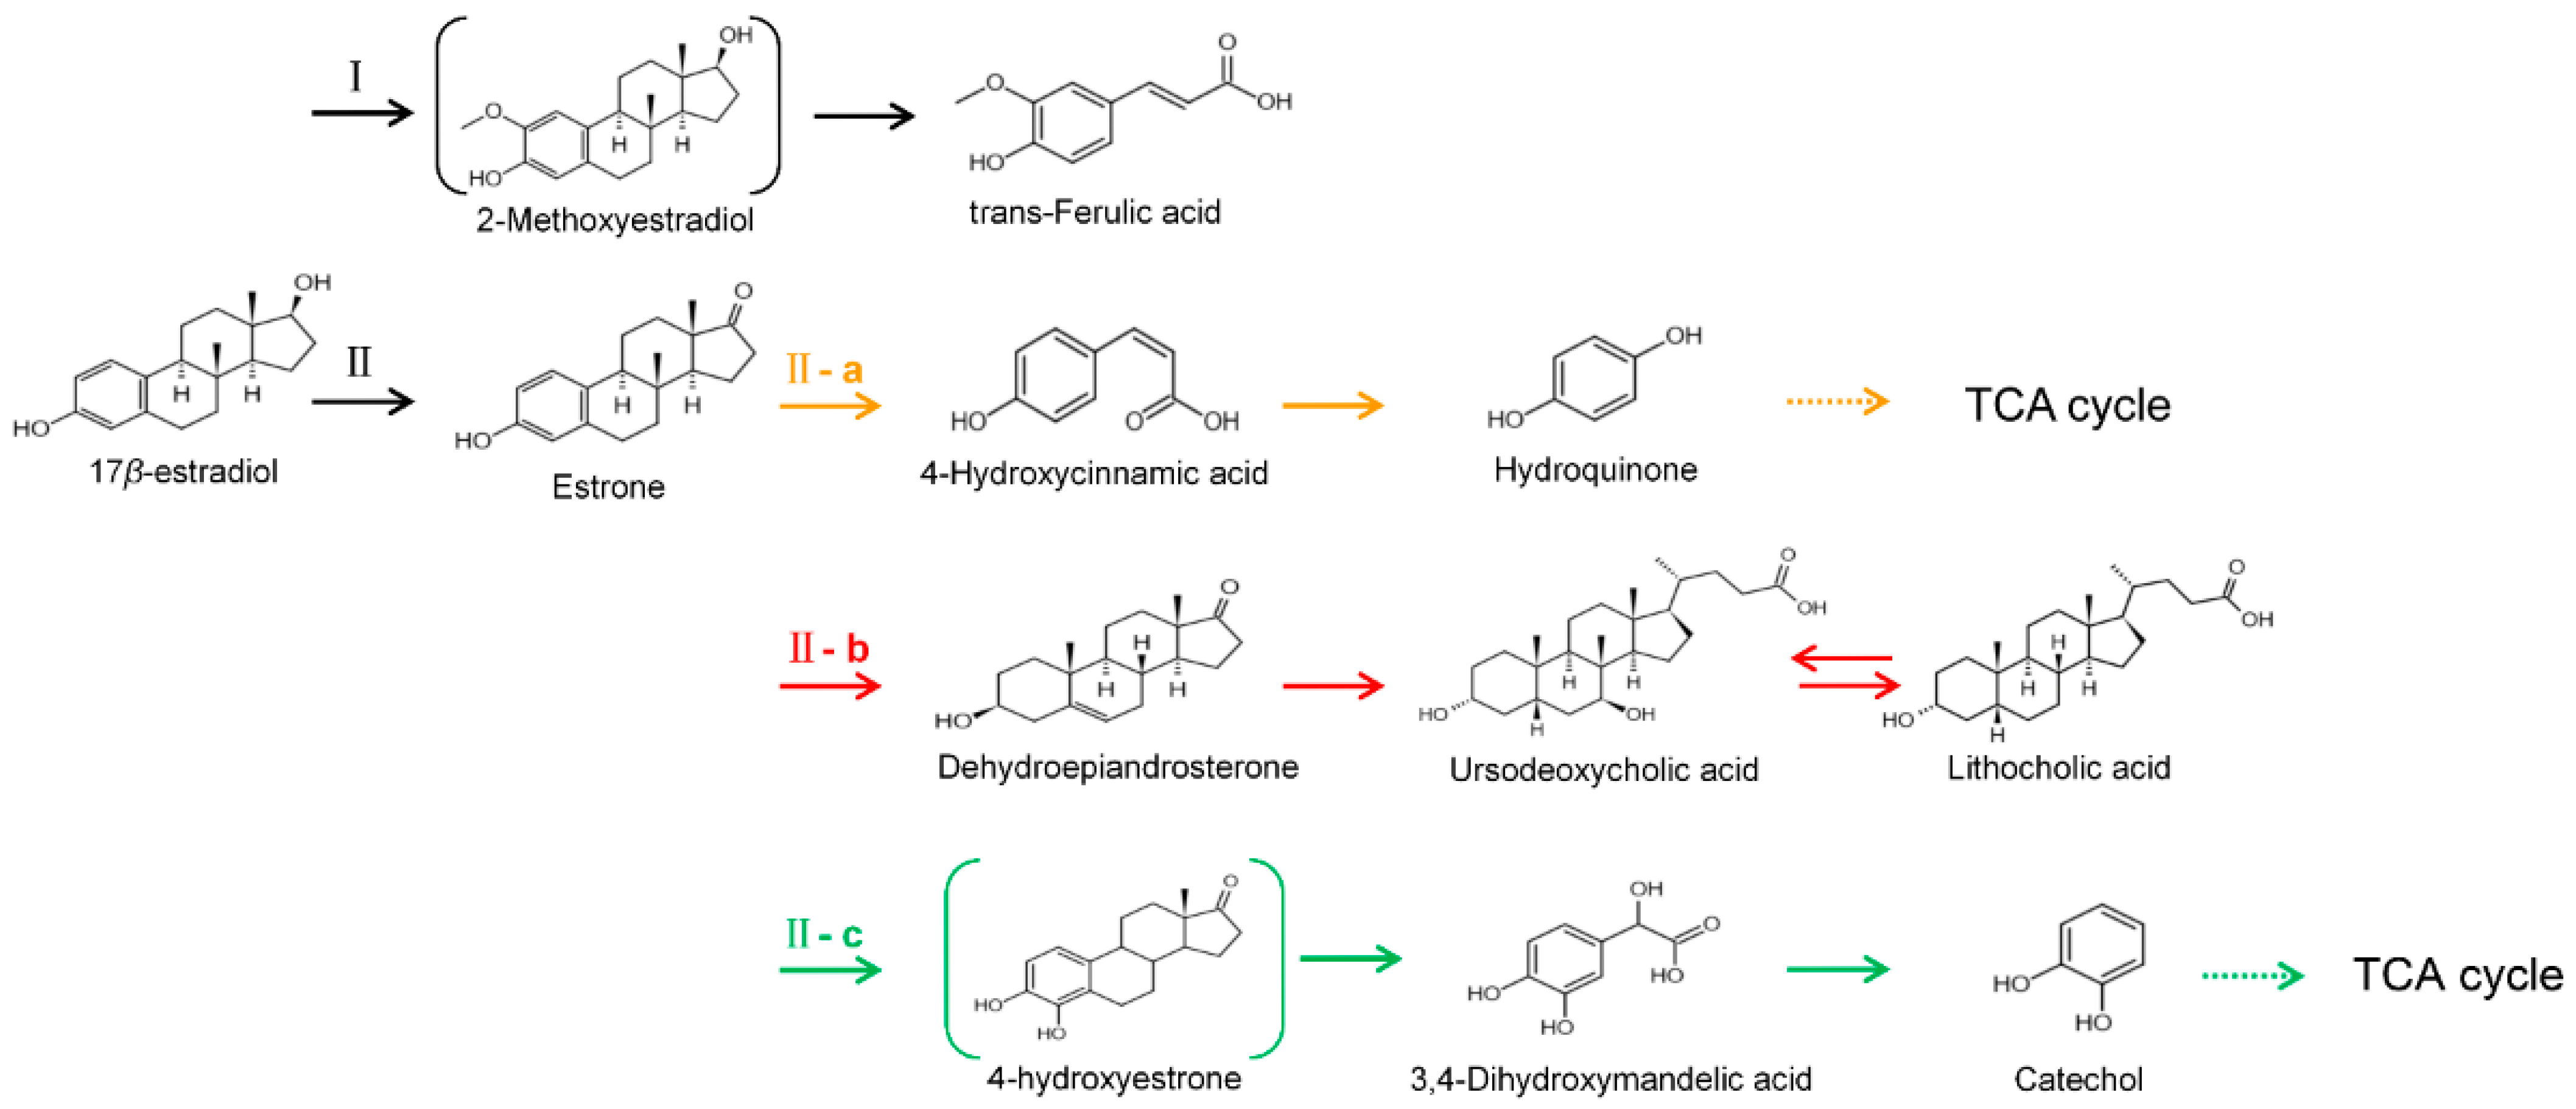
3.4. The Proposed E2 Transformation Route
4. Discussion
5. Conclusions
Author Contributions
Funding
Institutional Review Board Statement
Informed Consent Statement
Data Availability Statement
Acknowledgments
Conflicts of Interest
References
- Paraso, M.G.; Morales, J.K.; Clavecillas, A.A.; Lola, M.S. Estrogenic Effects in Feral Male Common Carp (Cyprinus carpio) from Laguna de Bay, Philippines. Bull. Environ. Contam. Toxicol. 2017, 98, 638–642. [Google Scholar] [CrossRef]
- Li, Y.; Gao, S.; Liu, S.; Liu, B.; Zhang, X.; Gao, M.; Cheng, L.; Hu, B. Excretion of manure-borne estrogens and androgens and their potential risk estimation in the Yangtze River Basin. J. Environ. Sci. 2015, 37, 110–117. [Google Scholar] [CrossRef]
- Kolodziej, E.P.; Gray, J.L.; Sedlak, D.L. Quantification of steroid hormones with pheromonal properties in municipal wastewater effluent. Environ. Toxicol. Chem. 2010, 22, 2622–2629. [Google Scholar] [CrossRef]
- Jiang, L.; Yang, J.; Chen, J. Isolation and characteristics of 17beta-estradiol-degrading Bacillus spp. strains from activated sludge. Biodegradation 2010, 21, 729–736. [Google Scholar] [CrossRef]
- Fernández, L.; Louvado, A.; Esteves, V.; Gomes, N.; Almeida, A.; Cunha, Â. Biodegradation of 17β-estradiol by bacteria isolated from deep sea sediments in aerobic and anaerobic media. J. Hazard. Mater. 2017, 323, 359–366. [Google Scholar] [CrossRef]
- Kurisu, F.; Ogura, M.; Saitoh, S.; Yamazoe, A.; Yagi, O. Degradation of natural estrogen and identification of the metabolites produced by soil isolates of Rhodococcus sp. and Sphingomonas sp. J. Biosci. Bioeng. 2010, 109, 576–582. [Google Scholar] [CrossRef]
- Combalbert, S.; Hernandez-Raquet, G. Occurrence, fate, and biodegradation of estrogens in sewage and manure. Appl. Microbiol. Biotechnol. 2010, 86, 1671–1692. [Google Scholar] [CrossRef]
- Sun, K.; Cheng, X.; Yu, J.; Chen, L.; Wei, J.; Chen, W.; Wang, J.; Li, S.; Liu, Q.; Si, Y. Isolation of Trametes hirsuta La-7 with high laccase-productivity and its application in metabolism of 17β-estradiol. Environ. Pollut. 2020, 263, 114381. [Google Scholar] [CrossRef]
- Chen, Y.L.; Fu, H.Y.; Lee, T.H.; Shih, C.J.; Chiang, Y.R. Identification of estrogen degradation pathway and estrogen degraders in an activated sludge. Appl. Environ. Microbiol. 2018, 84, 00001–00018. [Google Scholar] [CrossRef]
- Zheng, W.; Li, X.; Yates, S.R.; Bradford, S.A. Anaerobic transformation kinetics and mechanism of steroid estrogenic hormones in dairy lagoon water. Environ. Sci. Technol. 2012, 46, 5471–5478. [Google Scholar] [CrossRef] [Green Version]
- Adeel, M.; Song, X.; Wang, Y.; Francis, D.; Yang, Y. Environmental impact of estrogens on human, animal and plant life: A critical review. Environ. Int. 2017, 99, 107–119. [Google Scholar] [CrossRef]
- Li, Y.; Han, W.; Lin, C.; Li, W.; Zhang, F. Excretion of estrogens in the livestock and poultry production and their environmental behaviors. Acta Ecol. Sin. 2010, 30, 1058–1065. [Google Scholar]
- Bartelt-Hunt, S.L.; Snow, D.D.; Kranz, W.L.; Mader, T.L.; Shapiro, C.A.; Donk, S.J.; Shelton, D.P.; Tarkalson, D.D.; Zhang, T.C. Effect of growth promotants on the occurrence of endogenous and synthetic steroid hormones on feedlot soils and in runoff from beef cattle feeding operations. Environ. Sci. Technol. 2012, 46, 1352–1360. [Google Scholar] [CrossRef]
- Fujii, K.; Kikuchi, S.; Satomi, M.; Ushio-Sata, N.; Morita, N. Degradation of 17beta-estradiol by a gram-negative bacterium isolated from activated sludge in a sewage treatment plant in Tokyo, Japan. Appl. Environ. Microbiol. 2002, 68, 2057–2060. [Google Scholar] [CrossRef]
- Chen, W.; Hu, D.; Feng, Z.; Liu, Z. Atn effecive Synthesis of ursodeoxycholic acid from Dehydroepiandrosterone. Steroids 2021, 172, 108870. [Google Scholar] [CrossRef]
- Garcia, A.; Fulton, J.E. The Combination of Glycolic Acid and Hydroquinone or Kojic Acid for the Treatment of Melasma and Related Conditions. Dermatol. Surg. 2013, 22, 443–447. [Google Scholar] [CrossRef]
- Gong, S.Z.; Deng, X.Q.; Li, S.-M. Kinetics of tyrosinase inhibition by 4-hydroxycinnamic acid. China Surfactant Deterg. Cosmet. 2006, 36, 159. [Google Scholar] [CrossRef]
- Huang, T.; Xu, Y.; Meng, M.; Li, C. PVDF-based molecularly imprinted ratiometric fluorescent test paper with improved visualization effect for catechol monitoring. Microchem. J. 2022, 178, 107369. [Google Scholar] [CrossRef]
- Kamanda, S.N.; Jacobs, A. Multicomponent crystals of p-coumaric acid and trans-ferulic acid: Structures and physicochemical properties. J. Mol. Struct. 2021, 1244, 130830. [Google Scholar] [CrossRef]
- Matkovics, B.; Samuelsson, B.; Evans, W.; Sim, G.A.; Theander, O. Formation of Lithocholic Acid from Ursodeoxycholic Acid in the Rat. Bile Acids and Steroids 116. Acta Chem. Scand. 1962, 16, 673–677. [Google Scholar] [CrossRef]
- Orr, A.A.; Yang, J.; Sule, N.; Chawla, R.; Tamamis, P. Molecular Mechanism for Attractant Signaling to DHMA by E. coli Tsr. Biophys. J. 2019, 118, 492–504. [Google Scholar] [CrossRef] [PubMed]
- Su, J.F.; Shi, J.X.; Ma, F. Aerobic denitrification and biomineralization by a novel heterotrophic bacterium, Acinetobacter sp. H36. Mar. Pollut. Bull. 2017, 116, 209–215. [Google Scholar] [CrossRef]
- Wiebke, A.; Hans-Georg, J.; Frank, C.; Martin, R.; Doris, H.; Michael, O.; Michael, E.; Maria, S.H.; Bruno, A. Oral dehydroepiandrosterone for adrenal androgen replacement: Pharmacokinetics and peripheral conversion to androgens and estrogens in young healthy females after dexamethasone suppression. J. Clin. Endocrinol. Metab. 1998, 83, 1928–1934. [Google Scholar] [CrossRef]
- Yang, B.; Zha, R.; Zhao, W.; Gong, D.; Wang, B. Comparative transcriptome analysis of the fungus Gibberella zeae transforming lithocholic acid into ursodeoxycholic acid. Biotechnol. Lett. 2021, 43, 415–422. [Google Scholar] [CrossRef]
- Zhang, S.; Zhou, J.; Li, L.; Pan, X.; Lin, J.; Li, C.; Leung, W.; Wang, L. Effect of dehydroepiandrosterone on atherosclerosis in postmenopausal women. BioSci. Trends 2022, 15, 353–364. [Google Scholar] [CrossRef] [PubMed]
- Kamath Miyar, H.; Pai, A.; Goveas, L.C. LysinibacillusAdsorption of Malachite Green by extracellular polymeric substance of sp. SS1: Kinetics and isotherms. Heliyon 2021, 7, e07169. [Google Scholar] [CrossRef]
- Oliveira, M.M.; Proenca, A.M.; Moreira-Silva, E.; de Castro, A.M.; Dos Santos, F.M.; Marconatto, L.; Medina-Silva, R. Biofilms of Pseudomonas and Lysinibacillus Marine Strains on High-Density Polyethylene. Microb. Ecol. 2021, 81, 833–846. [Google Scholar] [CrossRef]
- Cao, L.; Zhang, J.; Zhao, R.; Deng, Y.; Li, B. Genomic characterization, kinetics, and pathways of sulfamethazine biodegradation by Paenarthrobacter sp. A01. Environ. Int. 2019, 131, 104961. [Google Scholar] [CrossRef]
- Li, S.; Liu, J.; Sun, M.; Ling, W.; Zhu, X. Isolation, Characterization, and Degradation Performance of the 17β-Estradiol-Degrading Bacterium Novosphingobium sp. E2S. Int. J. Environ. Res. Public Health 2017, 14, 115. [Google Scholar] [CrossRef]
- Zhou, N.A.; Lutovsky, A.C.; Andaker, G.L.; Gough, H.L.; Ferguson, J.F. Cultivation and characterization of bacterial isolates capable of degrading pharmaceutical and personal care products for improved removal in activated sludge wastewater treatment. Biodegradation 2013, 24, 813–827. [Google Scholar] [CrossRef]
- Zhang, S.; Wang, J. Biodegradation of chlortetracycline by Bacillus cereus LZ01: Performance, degradative pathway and possible genes involved. J. Hazard. Mater. 2022, 434, 128941. [Google Scholar] [CrossRef] [PubMed]
- Noszczyńska, M.; Piotrowska-Seget, Z. A comprehensive study on bisphenol A degradation by newly isolated strains Acinetobacter sp. K1MN and Pseudomonas sp. BG12. Biodegradation 2020, 32, 1–15. [Google Scholar] [CrossRef] [PubMed]
- Vipotnik, Z.; Michelin, M.; Tavares, T. Ligninolytic enzymes production during polycyclic aromatic hydrocarbons degradation: Effect of soil pH, soil amendments and fungal co-cultivation. Biodegradation 2021, 32, 193–215. [Google Scholar] [CrossRef] [PubMed]
- Zhang, M.; Luo, Z.; Luo, Y.; Zhai, J.; Wang, Z. pH influence on 2,4,6-trichlorophenol degradation by ferrate(VI). Environ. Technol. Innov. 2021, 23, 101683. [Google Scholar] [CrossRef]
- Liu, N.; Shi, Y.; Li, J.; Zhu, M.; Zhang, T. Isolation and characterization of a new highly effective 17β-estradiol-degrading Gordonia sp. strain R9. 3 Biotech 2020, 10, 174. [Google Scholar] [CrossRef]
- Taghizadeh, T.; Talebian-Kiakalaieh, A.; Jahandar, H.; Amin, M.; Tarighi, S.; Faramarzi, M.A. Biodegradation of bisphenol A by the immobilized laccase on some synthesized and modified forms of zeolite Y. J. Hazard. Mater. 2020, 386, 121950. [Google Scholar] [CrossRef]
- Camacho-Montealegre, C.M.; Rodrigues, E.M.; Morais, D.K.; Tótola, M. Prokaryotic community diversity during bioremediation of crude oil contaminated oilfield soil: Effects of hydrocarbon concentration and salinity. Braz. J. Microbiol. 2021, 52, 787–800. [Google Scholar] [CrossRef]
- Chaochon, A.; Sirianuntapiboon, S. Biodegradation mechanism of direct blue 15 (DB15) and effect of NaCl on the removal efficiency in anoxic/oxic SBR system with synthetic textile wastewater containing DB15 (STWW+DB15). Desalin. Water Treat. 2018, 102, 289–299. [Google Scholar] [CrossRef]
- Kalvert, M.; Bloch, E. Conversion of 4-14C-dehydroepiandrosterone to estrone and 17-beta-estradiol by the rat ovary with observations on variations during the estrous cycle. Endocrinology 1968, 82, 1021–1026. [Google Scholar] [CrossRef]
- Chen, Y.L.; Yu, C.P.; Lee, T.H.; Goh, K.S.; Chu, K.H.; Wang, P.H.; Ismail, W.; Shih, C.J.; Chiang, Y.R. Biochemical Mechanisms and Catabolic Enzymes Involved in Bacterial Estrogen Degradation Pathways. Cell Chem. Biol. 2017, 24, 712–724. [Google Scholar] [CrossRef] [Green Version]


| Chemical Names | Chemical Structure | Rt | m/z | Exacted Mass | Type | Elemental Formula | Reported by Others |
|---|---|---|---|---|---|---|---|
| 3,4-Dihydroxymandelic acid |  | 6.07 | 184.1692364 | 184.037 | [M]+ | C8H8O5 | [21] |
| Catechol |  | 8.74 | 110.0210549 | 110.0368 | [M]+ | C6H6O2 | [18] |
| 4-Hydroxycinnamic acid |  | 12.78 | 146.9804529 | 164.0473 | [M+H-H2O]+ | C9H8O3 | [17] |
| Hydroquinone | 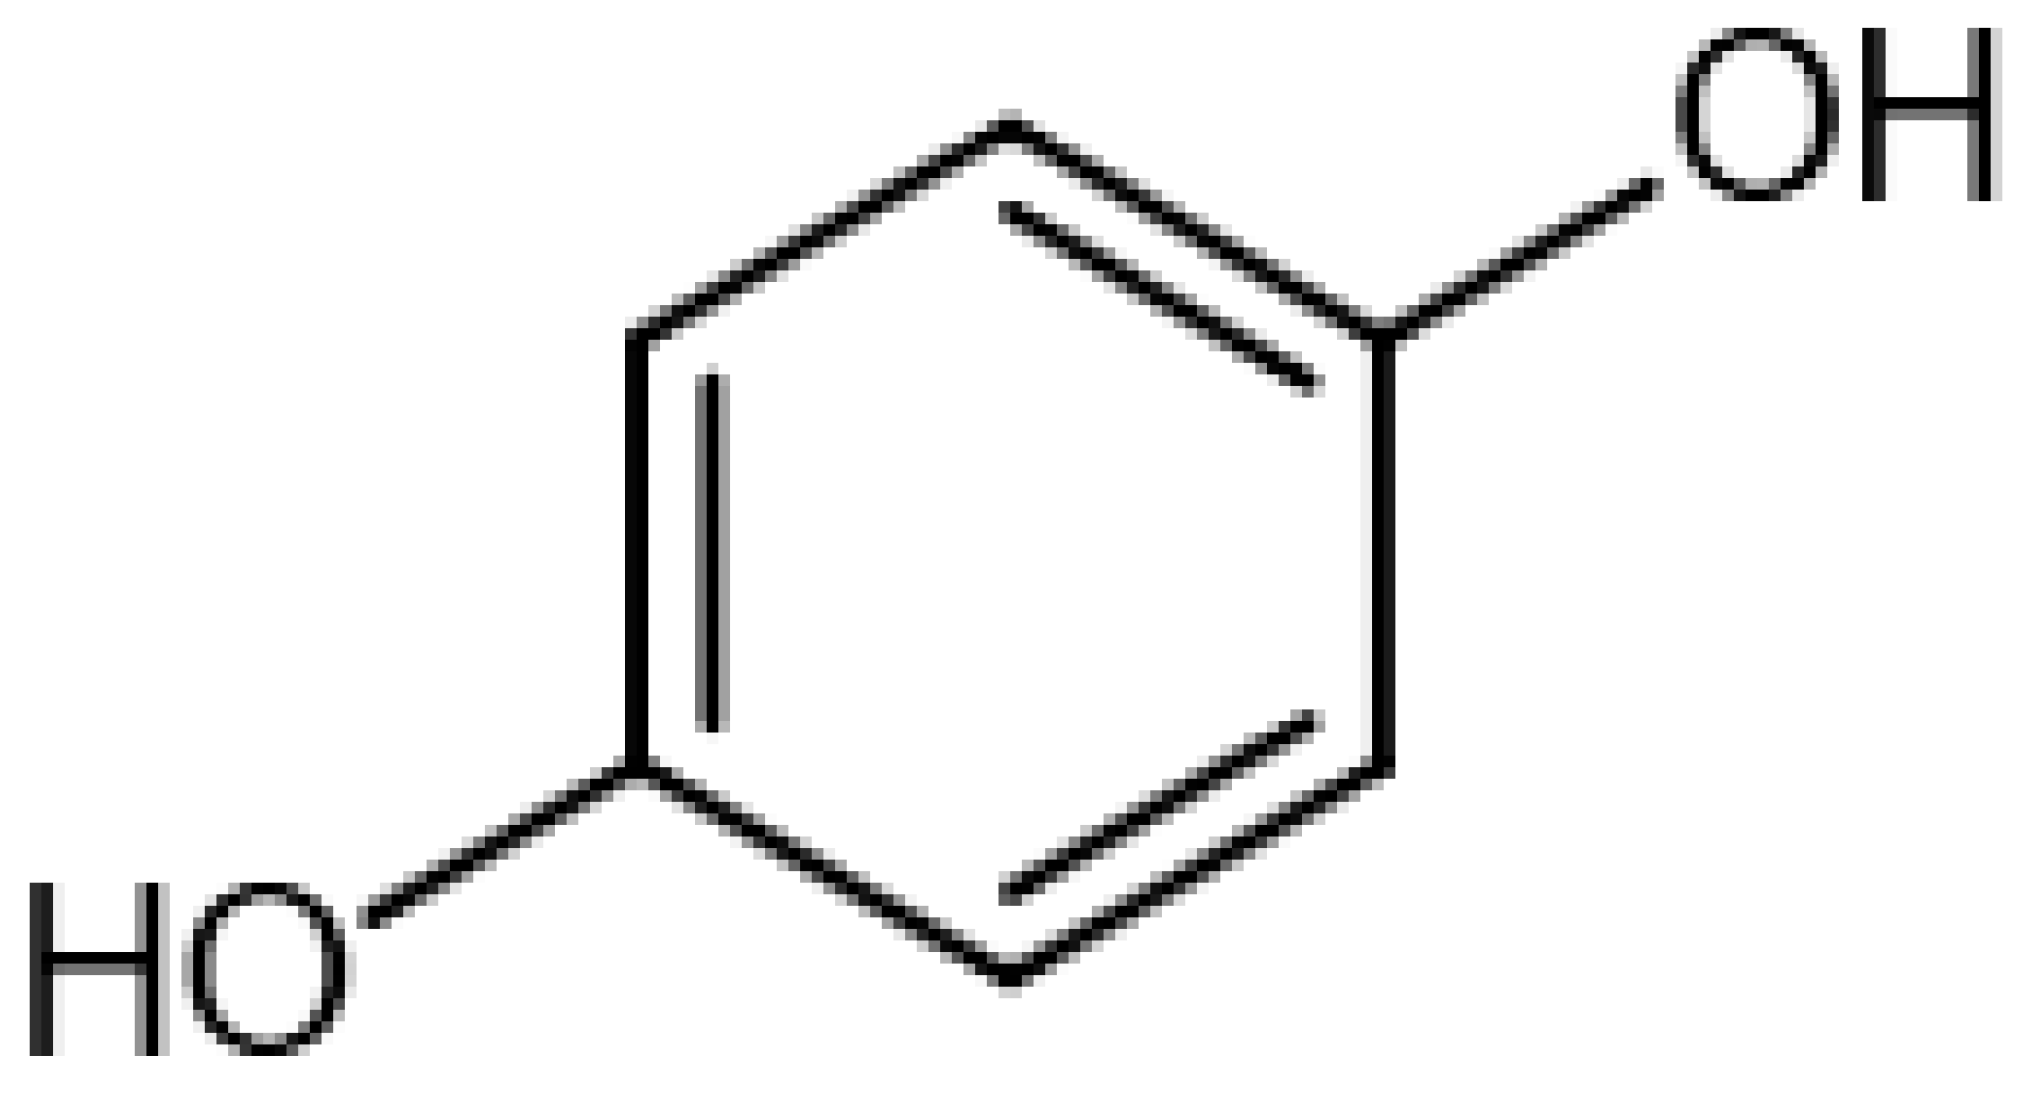 | 13.06 | 110.0208651 | 110.0368 | [M]+ | C6H6O2 | [16] |
| Lithocholic acid | 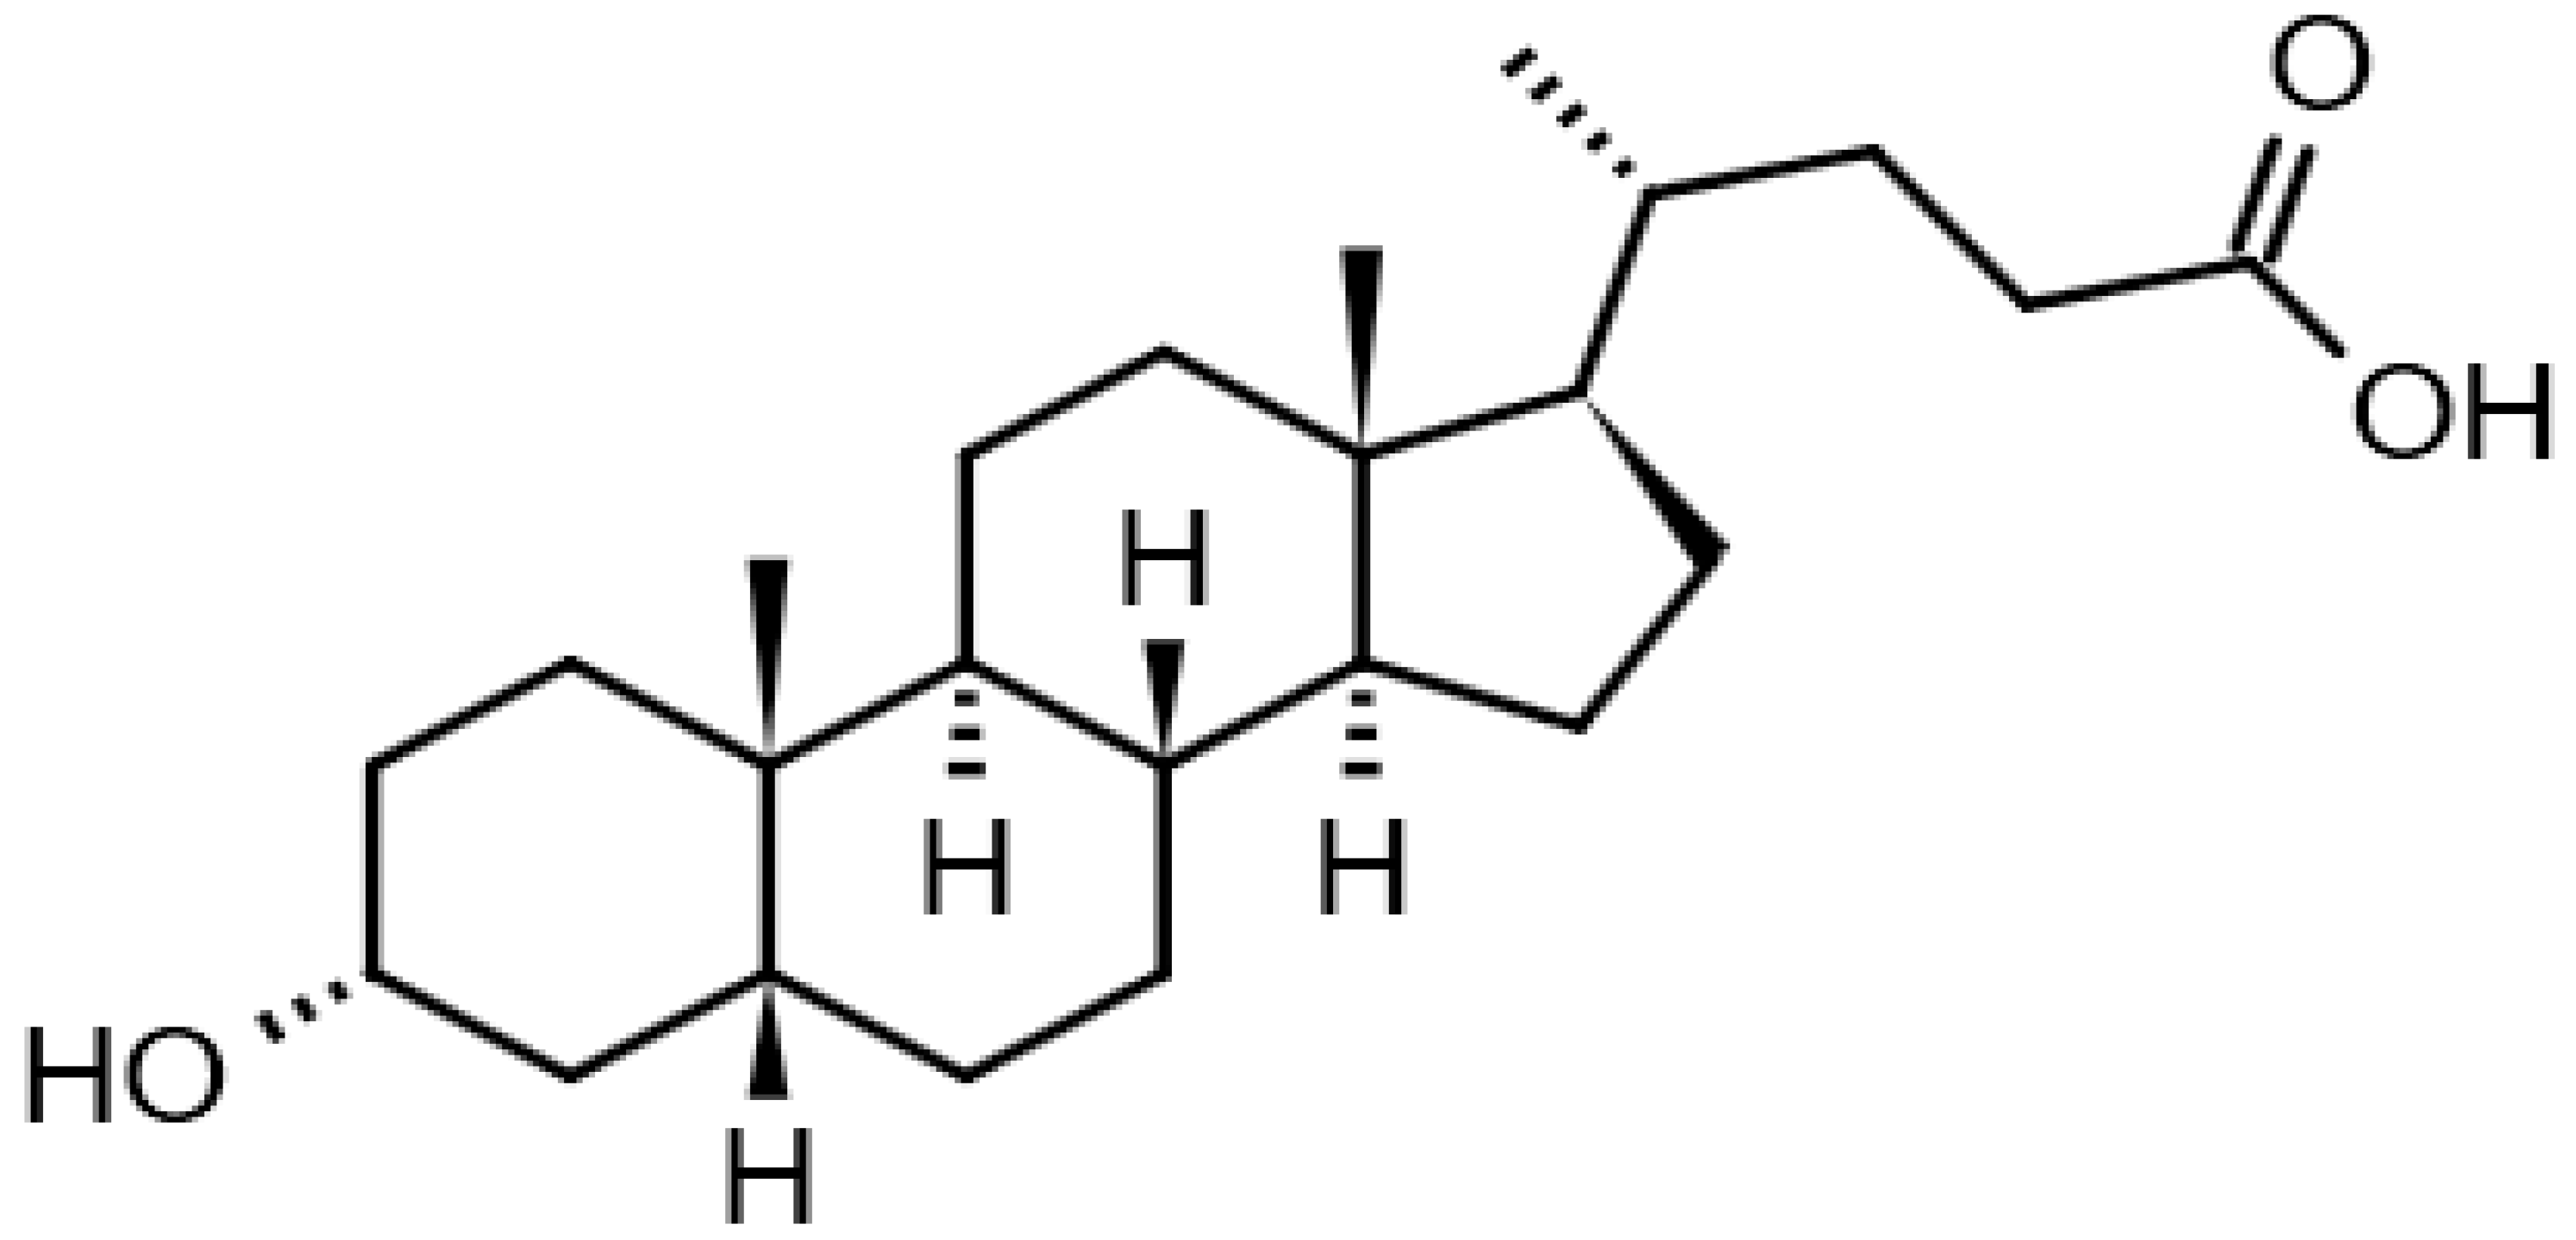 | 13.39 | 377.26 22 | 376.2977 | [M+H]+ | C24H40O3 | [24] |
| trans-Ferulic acid | 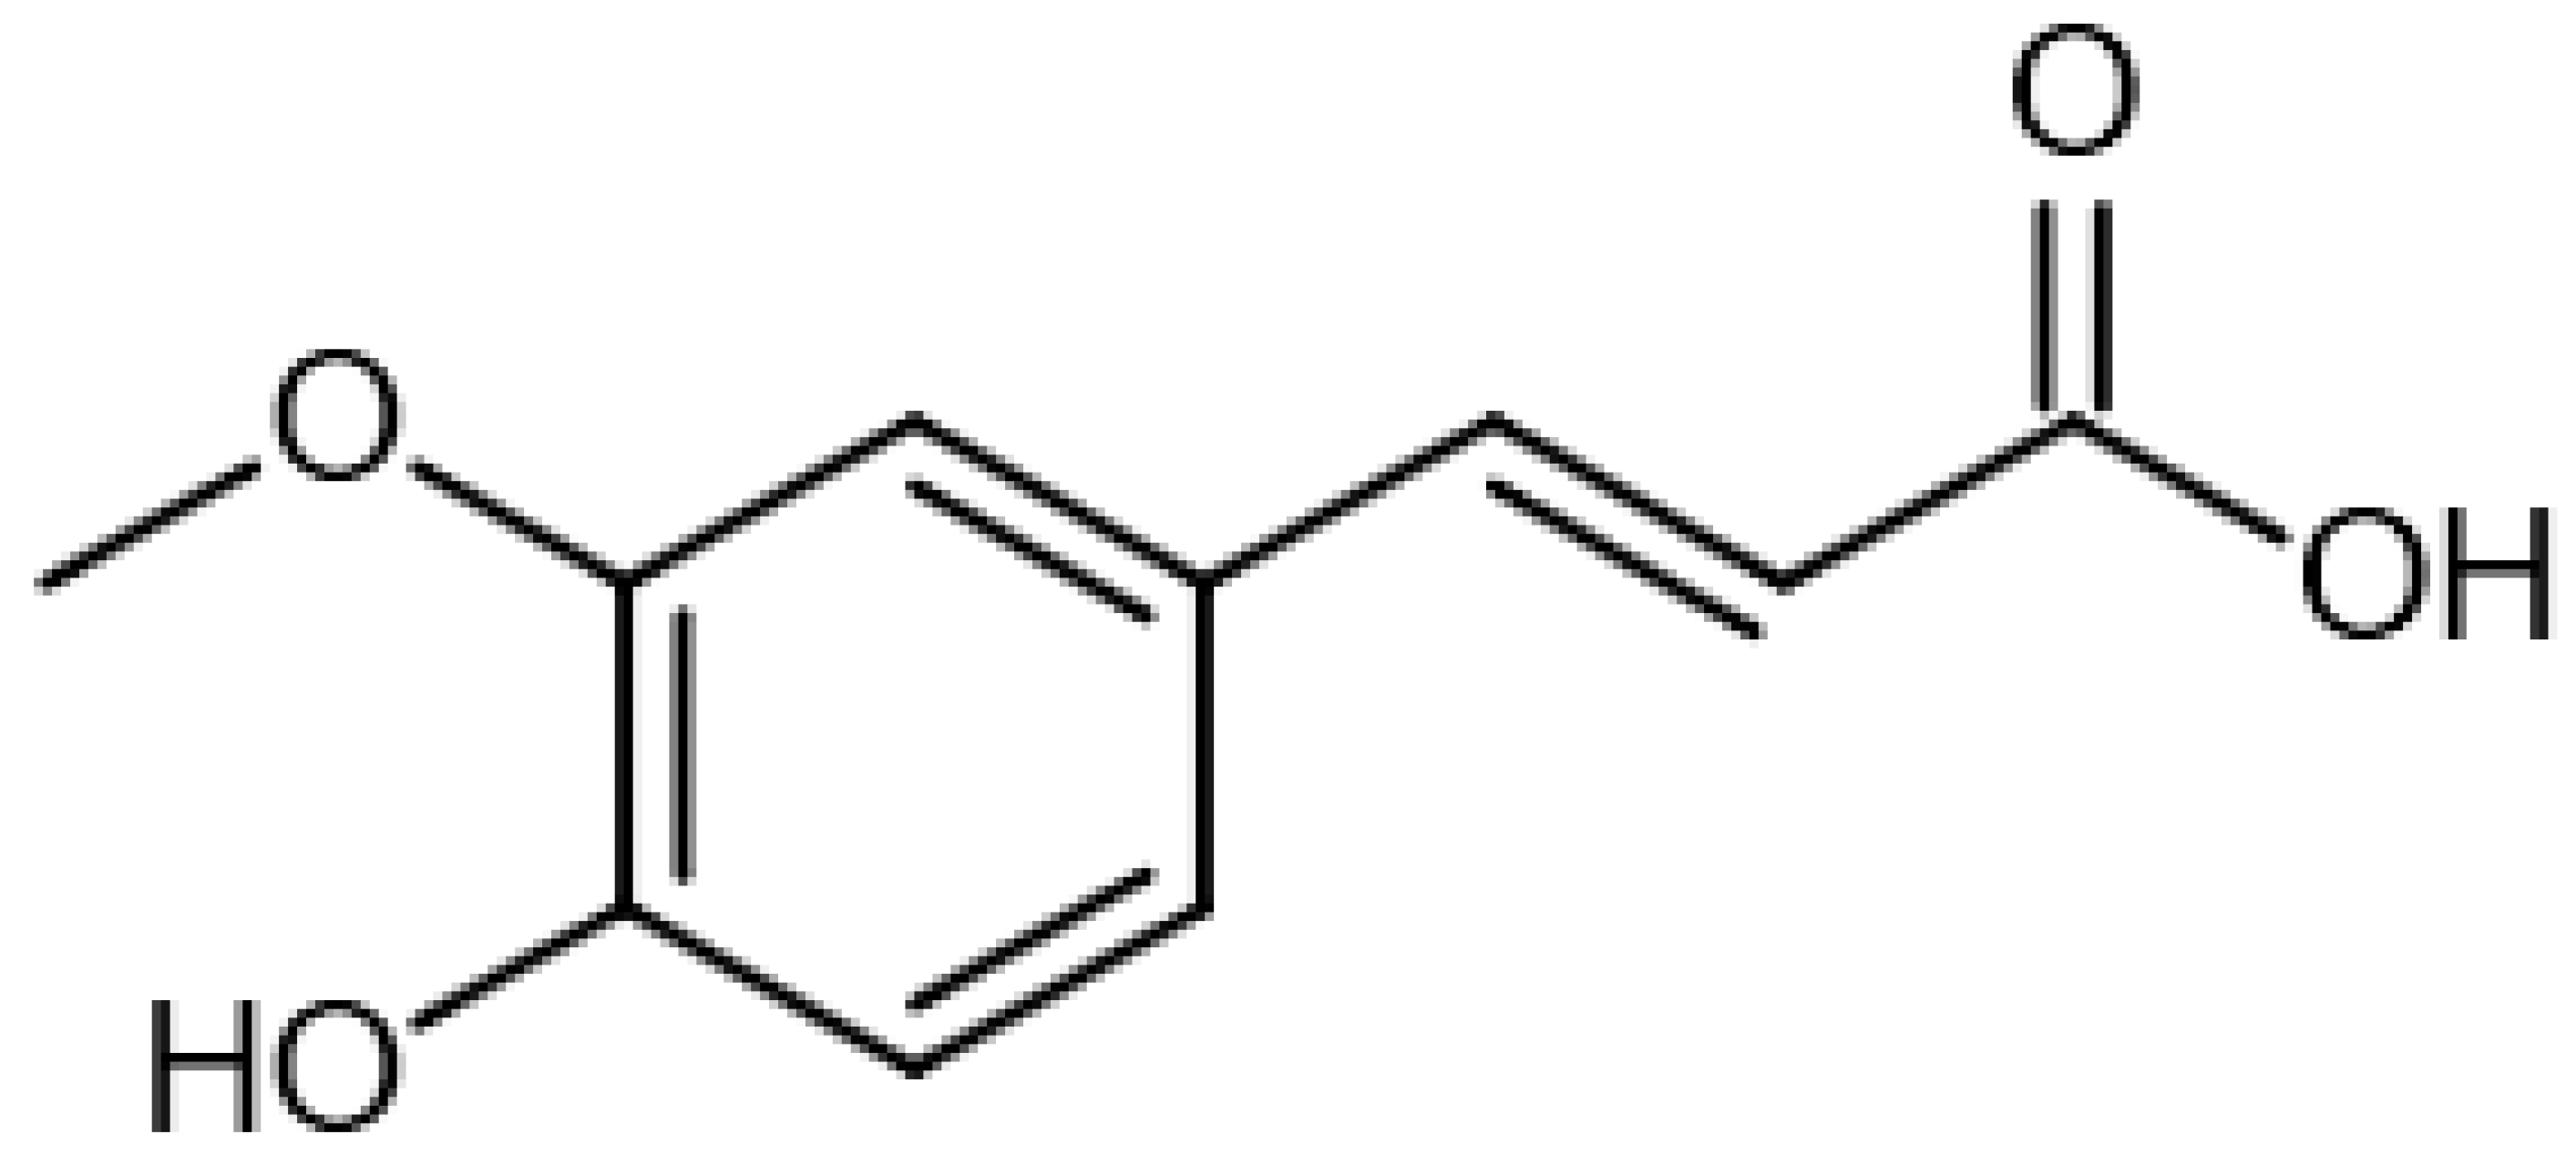 | 13.87 | 193.1232725 | 194.0579 | [M-H]− | C10H10O4 | [19] |
| Dehydroepiandrosterone | 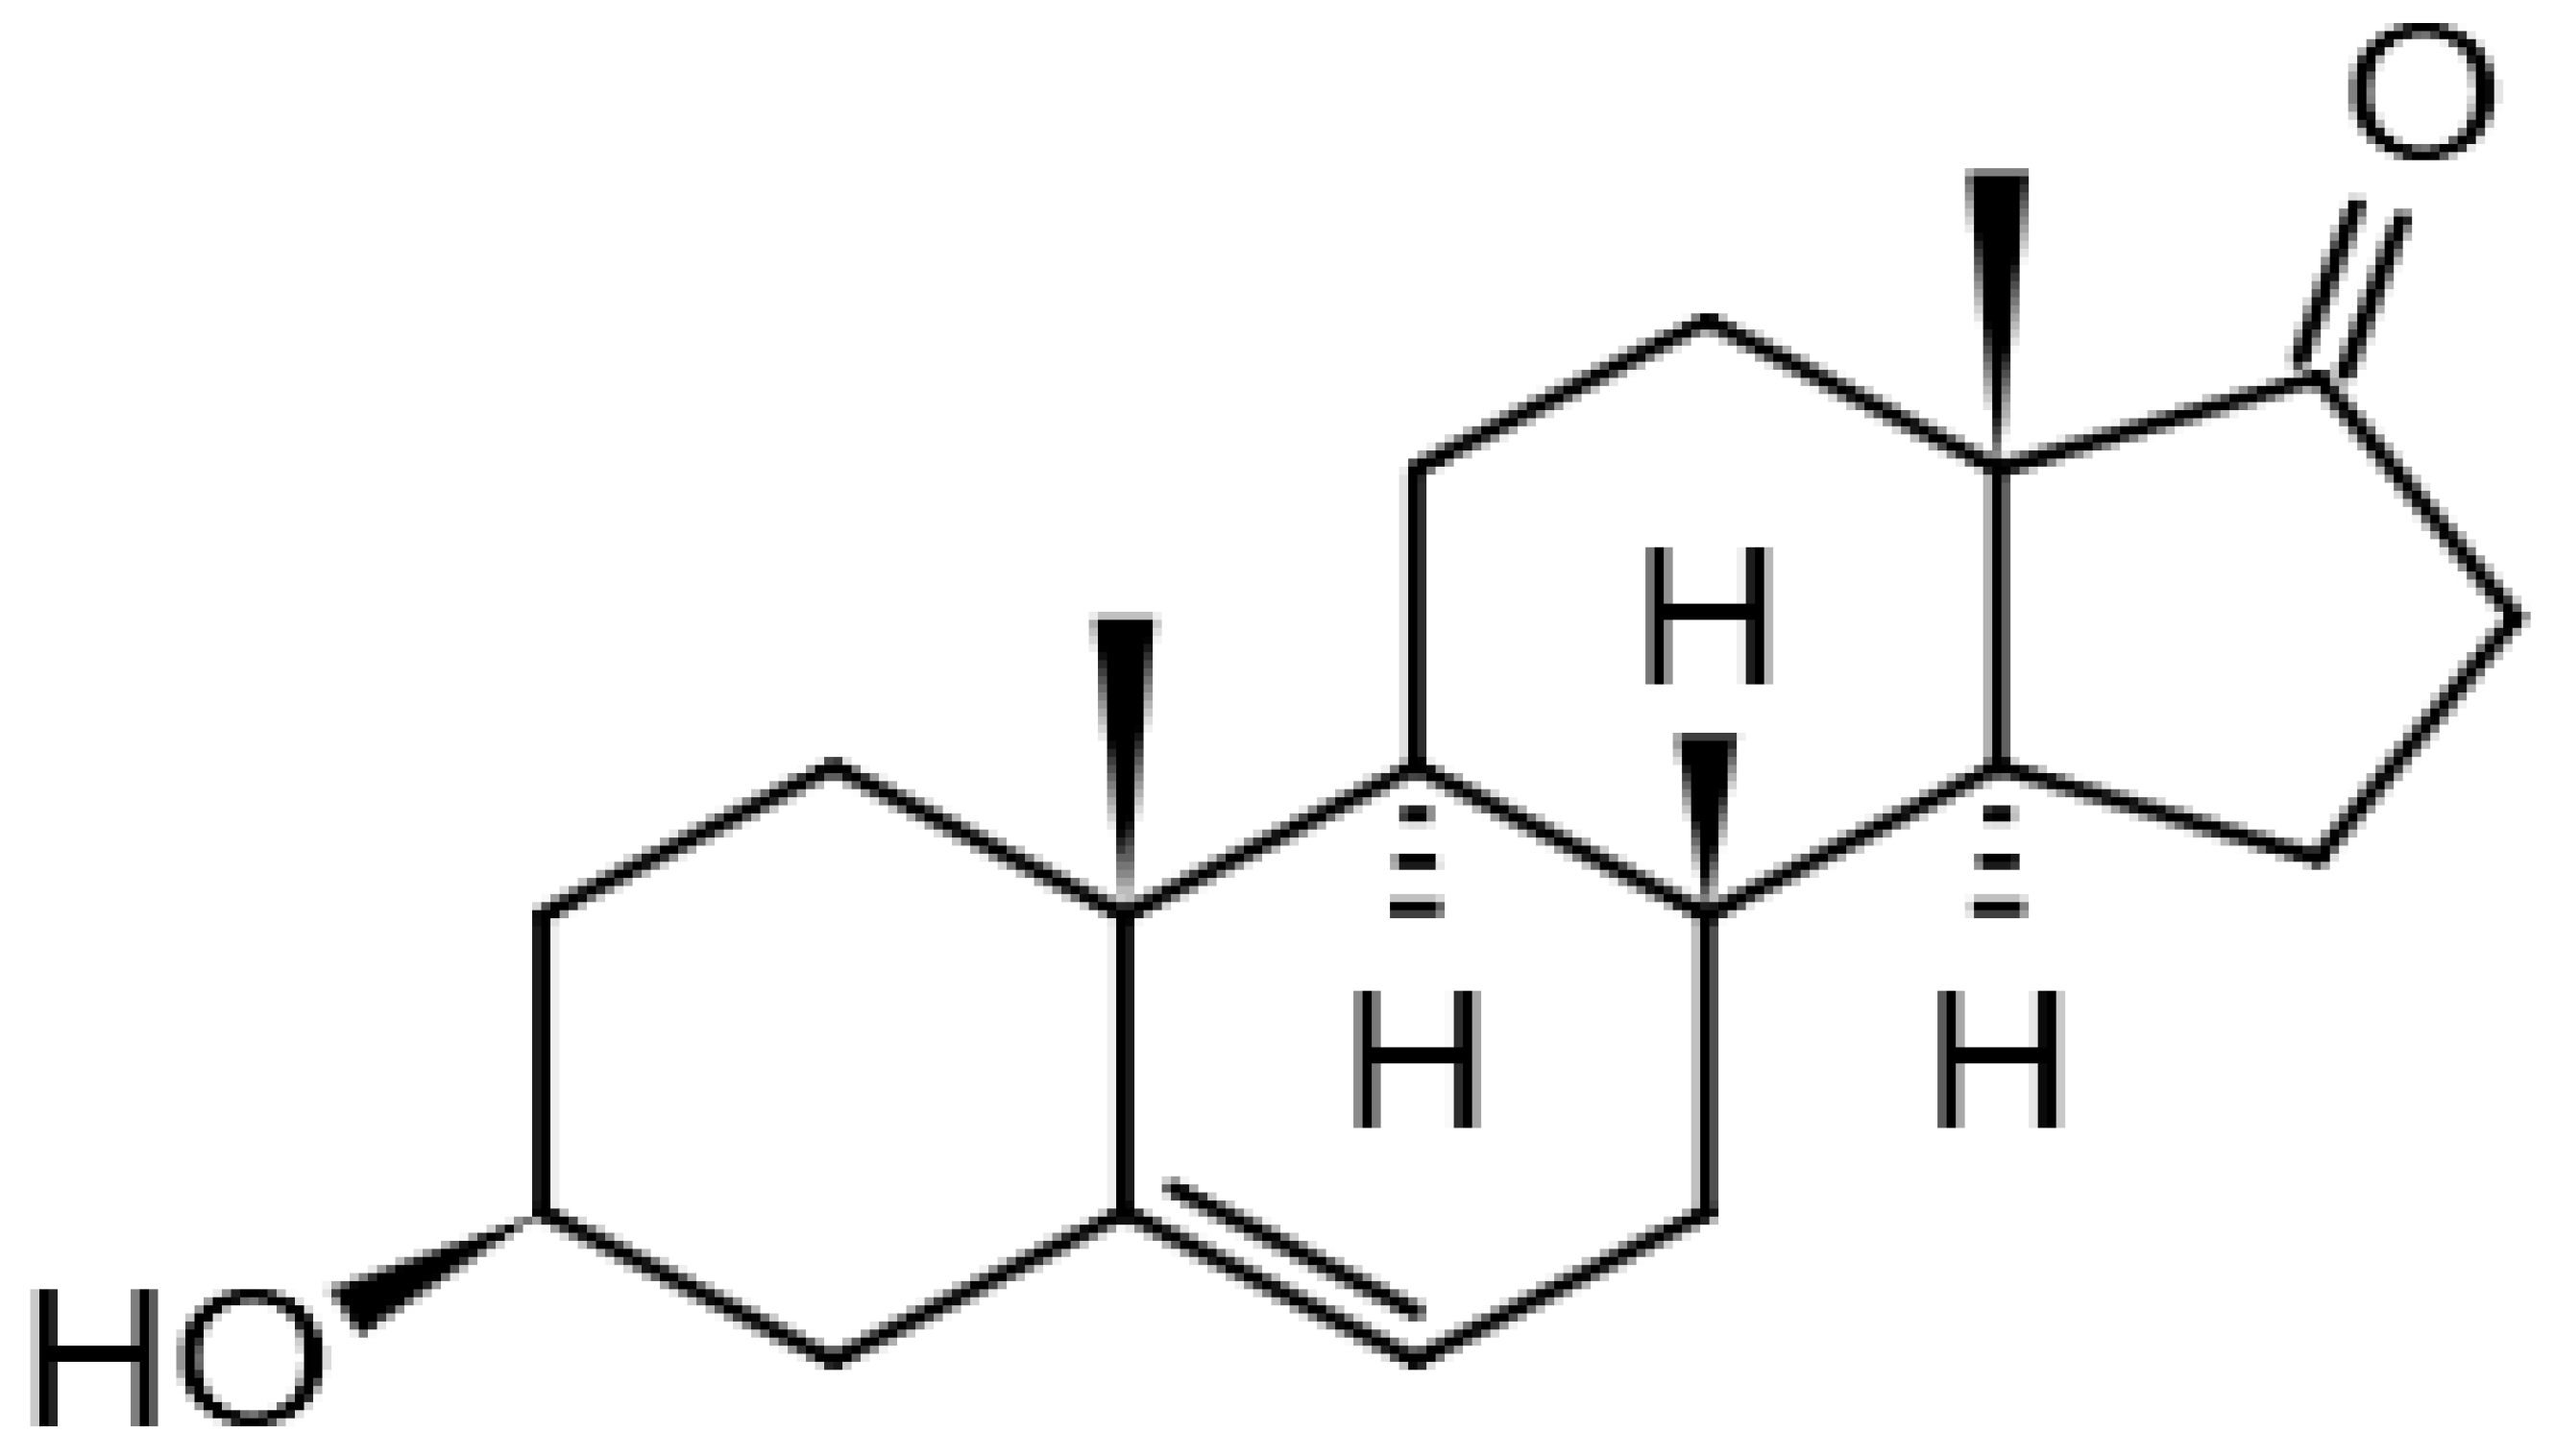 | 13.97 | 269.2142118 | 288.2089 | [M-H2O-H]− | C19H28O2 | [15,25] |
| Ursodeoxycholic acid |  | 13.98 | 392.2858849 | 392.2927 | [M]+ | C24H40O4 | [15,24] |
Publisher’s Note: MDPI stays neutral with regard to jurisdictional claims in published maps and institutional affiliations. |
© 2022 by the authors. Licensee MDPI, Basel, Switzerland. This article is an open access article distributed under the terms and conditions of the Creative Commons Attribution (CC BY) license (https://creativecommons.org/licenses/by/4.0/).
Share and Cite
Wu, S.; Hao, P.; Gou, C.; Zhang, X.; Wang, L.; Basang, W.; Zhu, Y.; Gao, Y. Lysinibacillus sp. GG242 from Cattle Slurries Degrades 17β-Estradiol and Possible 2 Transformation Routes. Microorganisms 2022, 10, 1745. https://doi.org/10.3390/microorganisms10091745
Wu S, Hao P, Gou C, Zhang X, Wang L, Basang W, Zhu Y, Gao Y. Lysinibacillus sp. GG242 from Cattle Slurries Degrades 17β-Estradiol and Possible 2 Transformation Routes. Microorganisms. 2022; 10(9):1745. https://doi.org/10.3390/microorganisms10091745
Chicago/Turabian StyleWu, Sicheng, Peng Hao, Changlong Gou, Xiqing Zhang, Lixia Wang, Wangdui Basang, Yanbin Zhu, and Yunhang Gao. 2022. "Lysinibacillus sp. GG242 from Cattle Slurries Degrades 17β-Estradiol and Possible 2 Transformation Routes" Microorganisms 10, no. 9: 1745. https://doi.org/10.3390/microorganisms10091745