Article

Effect of Parthenium hysterophorus L. Invasion on Soil Microbial Communities in the Yellow River Delta, China

1
School of Biological and Environmental Engineering, Binzhou University, Binzhou 256600, China
2
School of Environmental & Municipal Engineering, Qingdao University of Technology, Qingdao 266000, China
3
Binzhou Shell Dike Island and Wetland National Nature Reserve Management Service Center, Binzhou 256600, China
*
Authors to whom correspondence should be addressed.
Microorganisms 2023, 11(1), 18; https://doi.org/10.3390/microorganisms11010018
Submission received: 8 December 2022 / Accepted: 15 December 2022 / Published: 21 December 2022
(This article belongs to the Special Issue Plant-Bacteria Interactions)

Abstract

:
Parthenium hysterophorus L., as an invasive plant, has negatively impacted the ecosystem functioning and stability of the terrestrial ecosystem in China. However, little information was available for its effects on microorganisms in the Yellow River Delta (YRD), the biggest newly-formed wetland in China. In the present study, high-throughput sequencing technology was used to obtain the bacterial community in soils and roots of different plant species, including P. hysterophorus and some native ones in the YRD. Our results showed that the Proteobacteria, Acidobacteriota, Gemmatimonadota, and Actinobacteriota were dominant in the rhizosphere soils of P. hysterophorus (84.2%) and Setaria viridis (86.47%), and the bulk soils (80.7%). The Proteobacteria and Actinobacteriota were dominant within the root of P. hysterophorus. A total of 2468 bacterial OTUs were obtained from different groups among which 140 were observed in all the groups; 1019 OTUs were shared by P. hysterophorus non-rhizosphere soil bacteria (YNR) P. hysterophorus rhizosphere soil bacteria (YRR) groups. The indexes of the ACE (823.1), Chao1 (823.19), Simpson (0.9971), and Shannon (9.068) were the highest in the YRR groups, showing the greatest bacterial community diversity. Random forest analysis showed that the Methylomirabilota and Dadabacteria (at the phylum level) and the Sphingomonas, and Woeseia (at the genus level) were identified as the main predictors among different groups. The LEfSe results also showed the essential role of the Acidobacteriota in the YRR group. The SourceTracker analysis of the bacterial community of the YRR group was mainly from GBS groups (average 53.14%) and a small part was from YNR groups (average 6.56%), indicating that the P. hysterophorus invasion had a more significant effect on native plants’ rhizosphere microorganisms than soil microorganisms. Our observations could provide valuable information for understanding the bacterial diversity and structure of the soil to the invasion of P. hysterophorus.

1. Introduction

With the intensification of global environmental change, plant invasion has become an urgent problem and has attracted significant attention [1]. In China, coastal wetlands are faced with severe exotic species invasion problems. The Yellow River Delta (YRD) is a typical wetland ecosystem in China that supports high biodiversity [2] and has a very important ecological function. However, the invasive plant has negatively impacted the ecosystem functioning and stability of the YRD [3]. The invasive plants gradually replaced native plants with faster growth rates and more vital reproductive abilities, which further caused changes in soil physicochemical properties and microbial community structure, posing a severe threat to biodiversity and nutrient cycling in the YRD [4]. P. hysterophorus, native to America and the Gulf of Mexico, is an annual or short-lived perennial herb belonging to Asteraceae [5]. It is considered one of the worst weeds in the world; thus, once introduced to an alien environment, it can cause ecological and agricultural losses and serious environmental problems and damage to the biodiversity of native ecosystems [6]. It has a fast growth rate and solid reproductive ability, and its seeds are spread in various ways, leading to wide distribution as well as difficult removal [7]. In China, it was first identified in Yunnan Province. This weed was first found in Shandong Province in 2004, posing threats to the native plants and causing ecological and agricultural problems. Understanding the invasion mechanism of P. hysterophorus can help us to take appropriate control measures to protect the ecosystem and the biodiversity of the YRD.
Soil microorganisms are essential to wetland ecosystems [8]. They are sensitive to variations in biotic and abiotic factors and can be used as an indicator of ecosystem stability [9]. Changes in plant species and plant community diversity can affect soil microbial community structure and diversity [10]. Moreover, many studies have focused on the effect of soil properties on soil microorganisms. For example, soil pH significantly correlated with bacterial community structure [8]. Qu et al. reported that the low soil pH could inhibit soil bacterial enzymatic and metabolic activities, which hinders the growth of bacteria [11]. In addition, soil nutrients are considered an essential factor influencing soil microbial community diversity in wetlands.
Invasive plants can alter soil microbial community composition and diversity, creating a favorable soil environment and contributing to the success of their invasion [12]. Therefore, studying the influence of plant invasion on the soil microbial community can broaden our understanding of the effective mechanisms of invasive plants on wetland ecosystems. An increasing number of researchers have explored the response of soil microbial communities to invasive plants, such as Spartina alterniflora [2] and Ageratina Adenophora [12]. However, the response of soil microorganisms to invasive species P. hysterophorus has not yet been known. Different root exudates and litters of different invasive plants resulted in a heterogeneous soil microenvironment, which caused different soil microbial communities. Bulk soil, rhizosphere and root are important microhabitats that microorganisms inhabit and play different roles in the nutrient cycling of the wetland ecosystem. The different changes in these microhabitats due to the invasive plant may cause responses in the microbial communities residing at different microhabitats [12]. How the soil bacterial community residing at P. hysterophorus root, rhizosphere, bulk soil, and native plants differed in functional diversity is unknown. In this study, we selected three communities (P. hysterophorus community; a diverse community of P. hysterophorus and native plants; native plants community) in the YRD and explored their associated soil bacterial communities using high-throughput sequencing technology. By comparing bacterial community differences in invaded and non-invaded areas, this study can help to understand the response of soil bacterial diversity and structure to the invasion of P. hysterophorus. Moreover, it also provides a theoretical basis for invasive-plant control and wetland protection. In this study, we hypothesized that the bacterial community diversity and structure in the invaded area significantly differed from that in non-invaded areas.

2. Materials and Methods

2.1. Sampling Site

Soil samples were collected near Siyuan Lake, located in the Yellow River Delta (37°16′ N–38°16′ N, 118°20′ E–119°20′ E). The region has a warm temperate monsoon climate zone, with prominent continental meteorological characteristics and significant differences in the four seasons. The annual average maximum temperature is 18.3 °C, and the minimum temperature is 6.8 °C. The soil type is mainly saline soil, and the widely distributed vegetation includes Suaeda salsa, and Tamarix chinensis Lour. The sample plot is a plot of the P. hysterophorus seriously damaged, and the damage time is three years. The P. hysterophorus is a single population in the sample plot, and the density of the P. hysterophorus in the plot is 58, sporadically accompanied by Setaria viridis (L.) Beauv.

2.2. Sampling Collection, Determination of Soil Physical and Chemical Properties

In August 2022, P. hysterophorus rhizosphere soil, bulk soils, and S.viridis rhizosphere soils were collected in the study area. Five 1 m × 1 m quadrats with a distance of 20 m from the invasion plot were randomly selected, and five subsamples were collected in each quadrat using the 5-point sampling method. The five subsamples were mixed as the soil in the quadrat samples to reduce interference from soil heterogeneity. The soil adhering to the surface of the roots of P. hysterophorus by light brushing is the rhizosphere soil of each sub-sample. The rhizosphere soil of 5 sub-samples collected from each quadrat is thoroughly mixed to be the rhizosphere soil sample of 1 quadrat. If the rhizosphere soil collected from each quadrat is mixed, it is one rhizosphere soil sample. When the rhizosphere soil was collected, the bulk soil was also collected, and the bulk soil of the five plots was thoroughly mixed to obtain one bulk soil. The soil samples were divided into two parts. One part has been used to determine the soil’s physical and chemical properties. The other part was placed in a cooling box (temperature 4 °C) and immediately transferred to the laboratory −80 °C low-temperature refrigerator. Soil pH, electrical conductivity (EC) and the content of Total Organic Carbon (TOC) was determined in our previous studies [13].

2.3. High-Throughput Sequencing of Soil Microbe

The soil samples stored at −80 °C were divided into 1.5 mL centrifuge tubes in an ultra-clean workbench. The 4 replicates of each treatment resulted in a total of 16 soil samples. The root endophytes bacteria samples of P. hysterophorus were numbered Root group (Root1, Root2, Root3, Root4); the rhizosphere soil bacteria samples of P. hysterophorus were numbered YRR group (YRR1, YRR2, YRR3, YRR4); the bulk soils bacteria samples of P. hysterophorus were numbered YNR group (YNR1, YNR2, YNR3, YNR4); the soil bacteria samples of native plants were numbered GBS group (GBS1, GBS2, GBS3, GBS4). The V4 region of the 16S rRNA gene was amplified by PCR using 515F 5′~GTGCCAGCCGGTAA~3′ and 907R 5′~CCGTCAATTCTTRACTTT~3′. The PCR products of the same sample were mixed and then recovered with 2% agarose gel. The library was constructed using the Illumina NovaSeq for sequencing. The data that support the findings of this study are available in NCBI (https://www.ncbi.nlm.nih.gov/ (accession number PRJNA897086)) (accessed on 4 November 2022).

2.4. Data Analysis

The Alpha diversity index was calculated using Qiime software (Version 1.9.1) [14]. One-way analysis of variance (ANOVA) was used to determine the variances of soils properties among different groups. The PCoA graph was drawn by R (Version 3.4.4) [15]. The Alpha diversity index group differences and Beta diversity were calculated by Student’s t-test using SPSS (IBM SPSS Inc., Chicago, IL, USA) [16]. The Chao1 and Ace indices measure species abundance as the number of species. Shannon and Simpson’s indices are used to estimate species diversity, which is affected by species abundance and Community evenness in the sample community. The differences in bacterial community composition among different groups were identified by using LDA effect size (LEfSe). The difference in microbial community structure was tested using permutational multivariate analysis of variance (PERMANOVA). Significant differences were defined as p < 0.05. Random forest analyses were used to identify the essential dominant taxa in the non-rhizosphere soil for P. hysterophorus with the random forest package in R [17]. The SourceTracker was used to explore the composition proportion of sink samples from each Source [18].

3. Results

3.1. Soil Physical and Chemical Properties

In the present study, the pH was highest in the YNR group and lowest in the GBS group(Table 1). The pH was significantly different between the YNR and GBS groups (p < 0.05), while the pH was not entirely different between the YRR and YNR groups. The EC was highest in the YRR group, and lowest in the GBS group. The EC was not significantly different among different groups. The TOC content was highest in the YNR group, and lowest in the YRR group. The TOC content was significantly different between the YRR and YNR groups (p < 0.05), while the TOC content was not significantly different between the YNR and GBS groups.

3.2. Alpha Diversity Index Difference Analysis among Different Groups

Alpha diversity, including the species richness and diversity of single samples, was reflected by many measuring indexes, including Chao1, ACE, Shannon, Simpson, and coverage (Figure 1). Our results showed that the index of the ACE (823.1), Chao1 (823.19), Simpson (0.9971), and Shannon (9.068) are highest in the YRR groups, indicating the bacteria community diversity of the P. hysterophorus rhizosphere was higher in the rhizosphere than in other groups. The Chao1 index (156.68), ACE index (156.25), Simpson (0.605), and Shannon (2.543) are the lowest in root groups, which indicated that the abundance of root bacteria was lower than in other groups. The coverage ratios of all samples were more significant than 0.999, indicating that the sequences of samples were detected and indicating that the sequencing results could reflect the actual condition of the samples.

3.3. OTU Abundance Analysis

In the present study, 1653 OTUs were identified in the YRR group; 1567 OTUs were identified in the YNR group; 1677 OTUs were identified in the GBS group; 377 OTUs were identified in the root group (Figure 2). A total of 2468 bacterial OTUs were obtained from different groups among which 140 were observed in all the groups; 1019 OTUs were shared by YNR and YRR groups; 1311 OTUs were shared by YRR and GBS groups; and 1083 OTUs were shared by YNR and GBS groups. The number of OTUs specific to rhizosphere and non-rhizosphere soil bacteria was higher than that of root bacteria.

3.4. Soil Microbial Community Structure Analysis

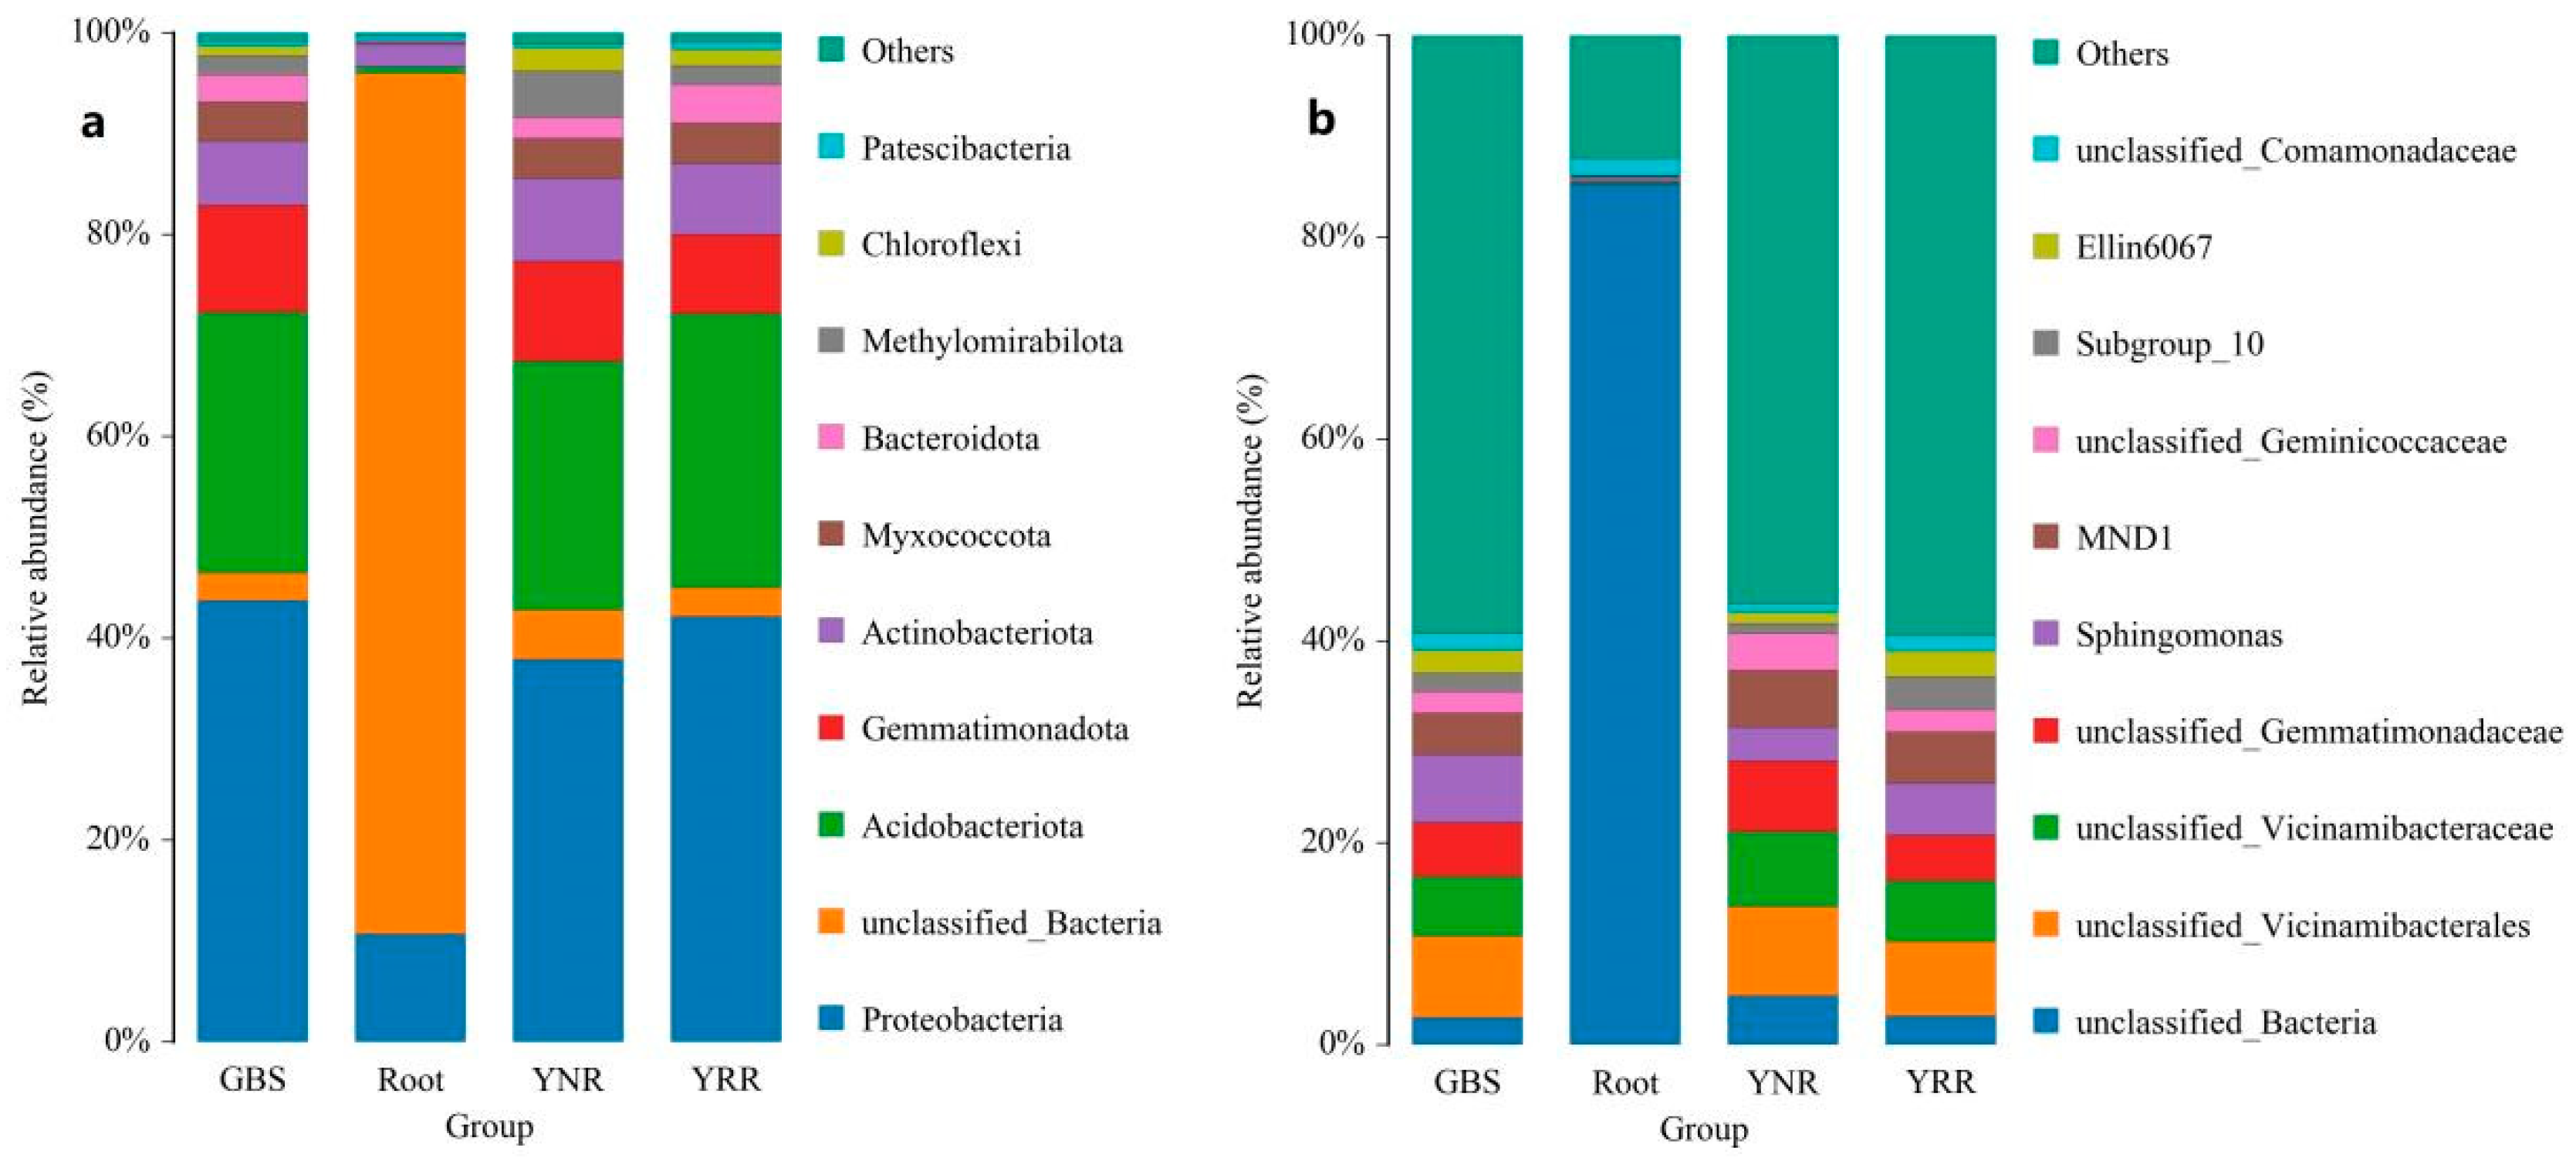
At the phylum level, the dominant bacteria in the rhizosphere and non-rhizosphere of P. hysterophorus were Proteobacteria, Acidobacteriota, Gemmatimonadota, and Actinobacteriota, and the total relative abundance was 84.2% and 80.7%, respectively. The dominant bacteria of S. viridis root soil were Proteobacteria, Acidobacteriota, Gemmatimonadota, and Actinobacteriota, and the total relative abundance of the four bacteria was 86.47%. The dominant bacteria within the P. hysterophorus root were Proteobacteria and Actinobacteriota, and the total relative abundance of the two bacteria in the rhizosphere of the P. hysterophorus root was 13% (Figure 3). At the genus level, except the unclassified species, the dominant bacteria were Sphingomonas, MND1, Subgroup_10 and Ellin6067 in the rhizosphere and non-rhizosphere of the P. hysterophorus, and the rhizosphere of the S.viridis (Figure 3).

3.5. PCoA Analysis

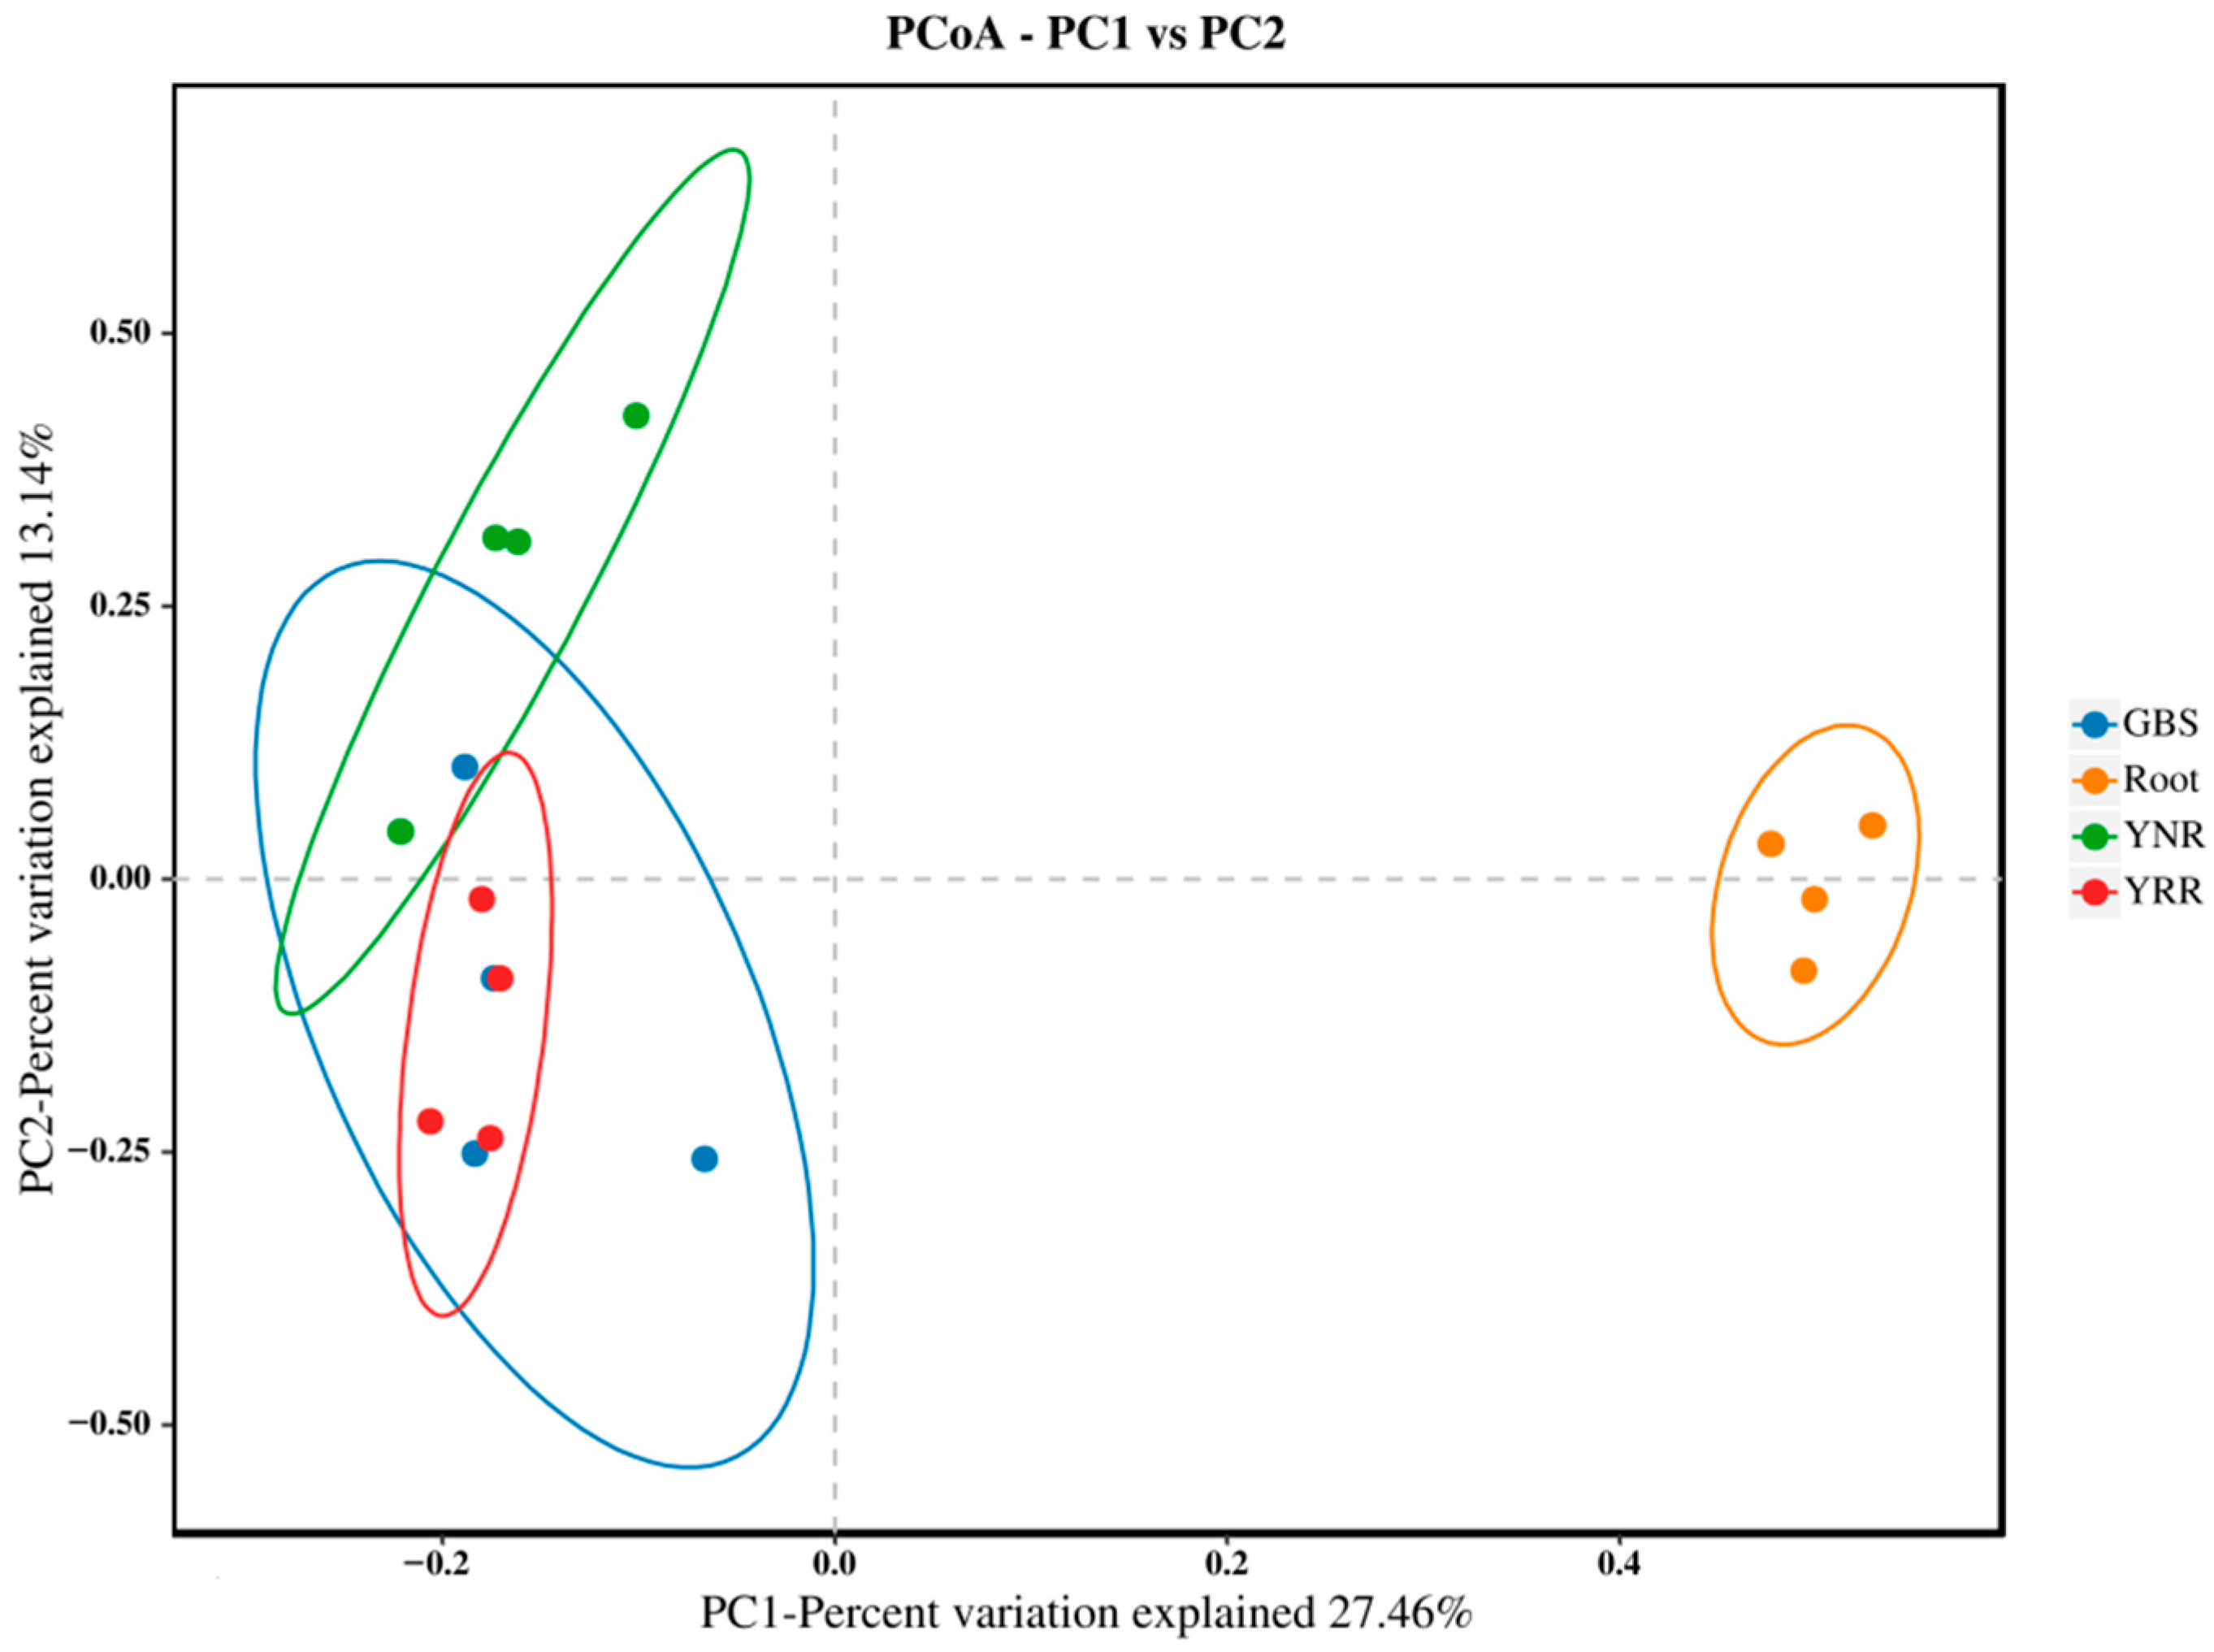
PCoA analysis can intuitively reflect the differences or similarities among different groups. Our results showed that the contribution rates of PC1 and PC2 were 27.46% and 13.14%, respectively (Figure 4). The distance between the bacterial communities in the rhizosphere soil of P. hysterophorus is relatively close, indicating their community composition is similar. In contrast, the root bacterial communities are more dispersed, meaning their community composition is quite different, and the community similarity is low. The comparison shows that the distribution distances of communities are quite different, indicating significant differences in the composition of the rhizosphere and root-soil bacterial communities of P. hysterophorus.

3.6. Correlation between Soil Bacterial Species and Soil Physicochemical Properties

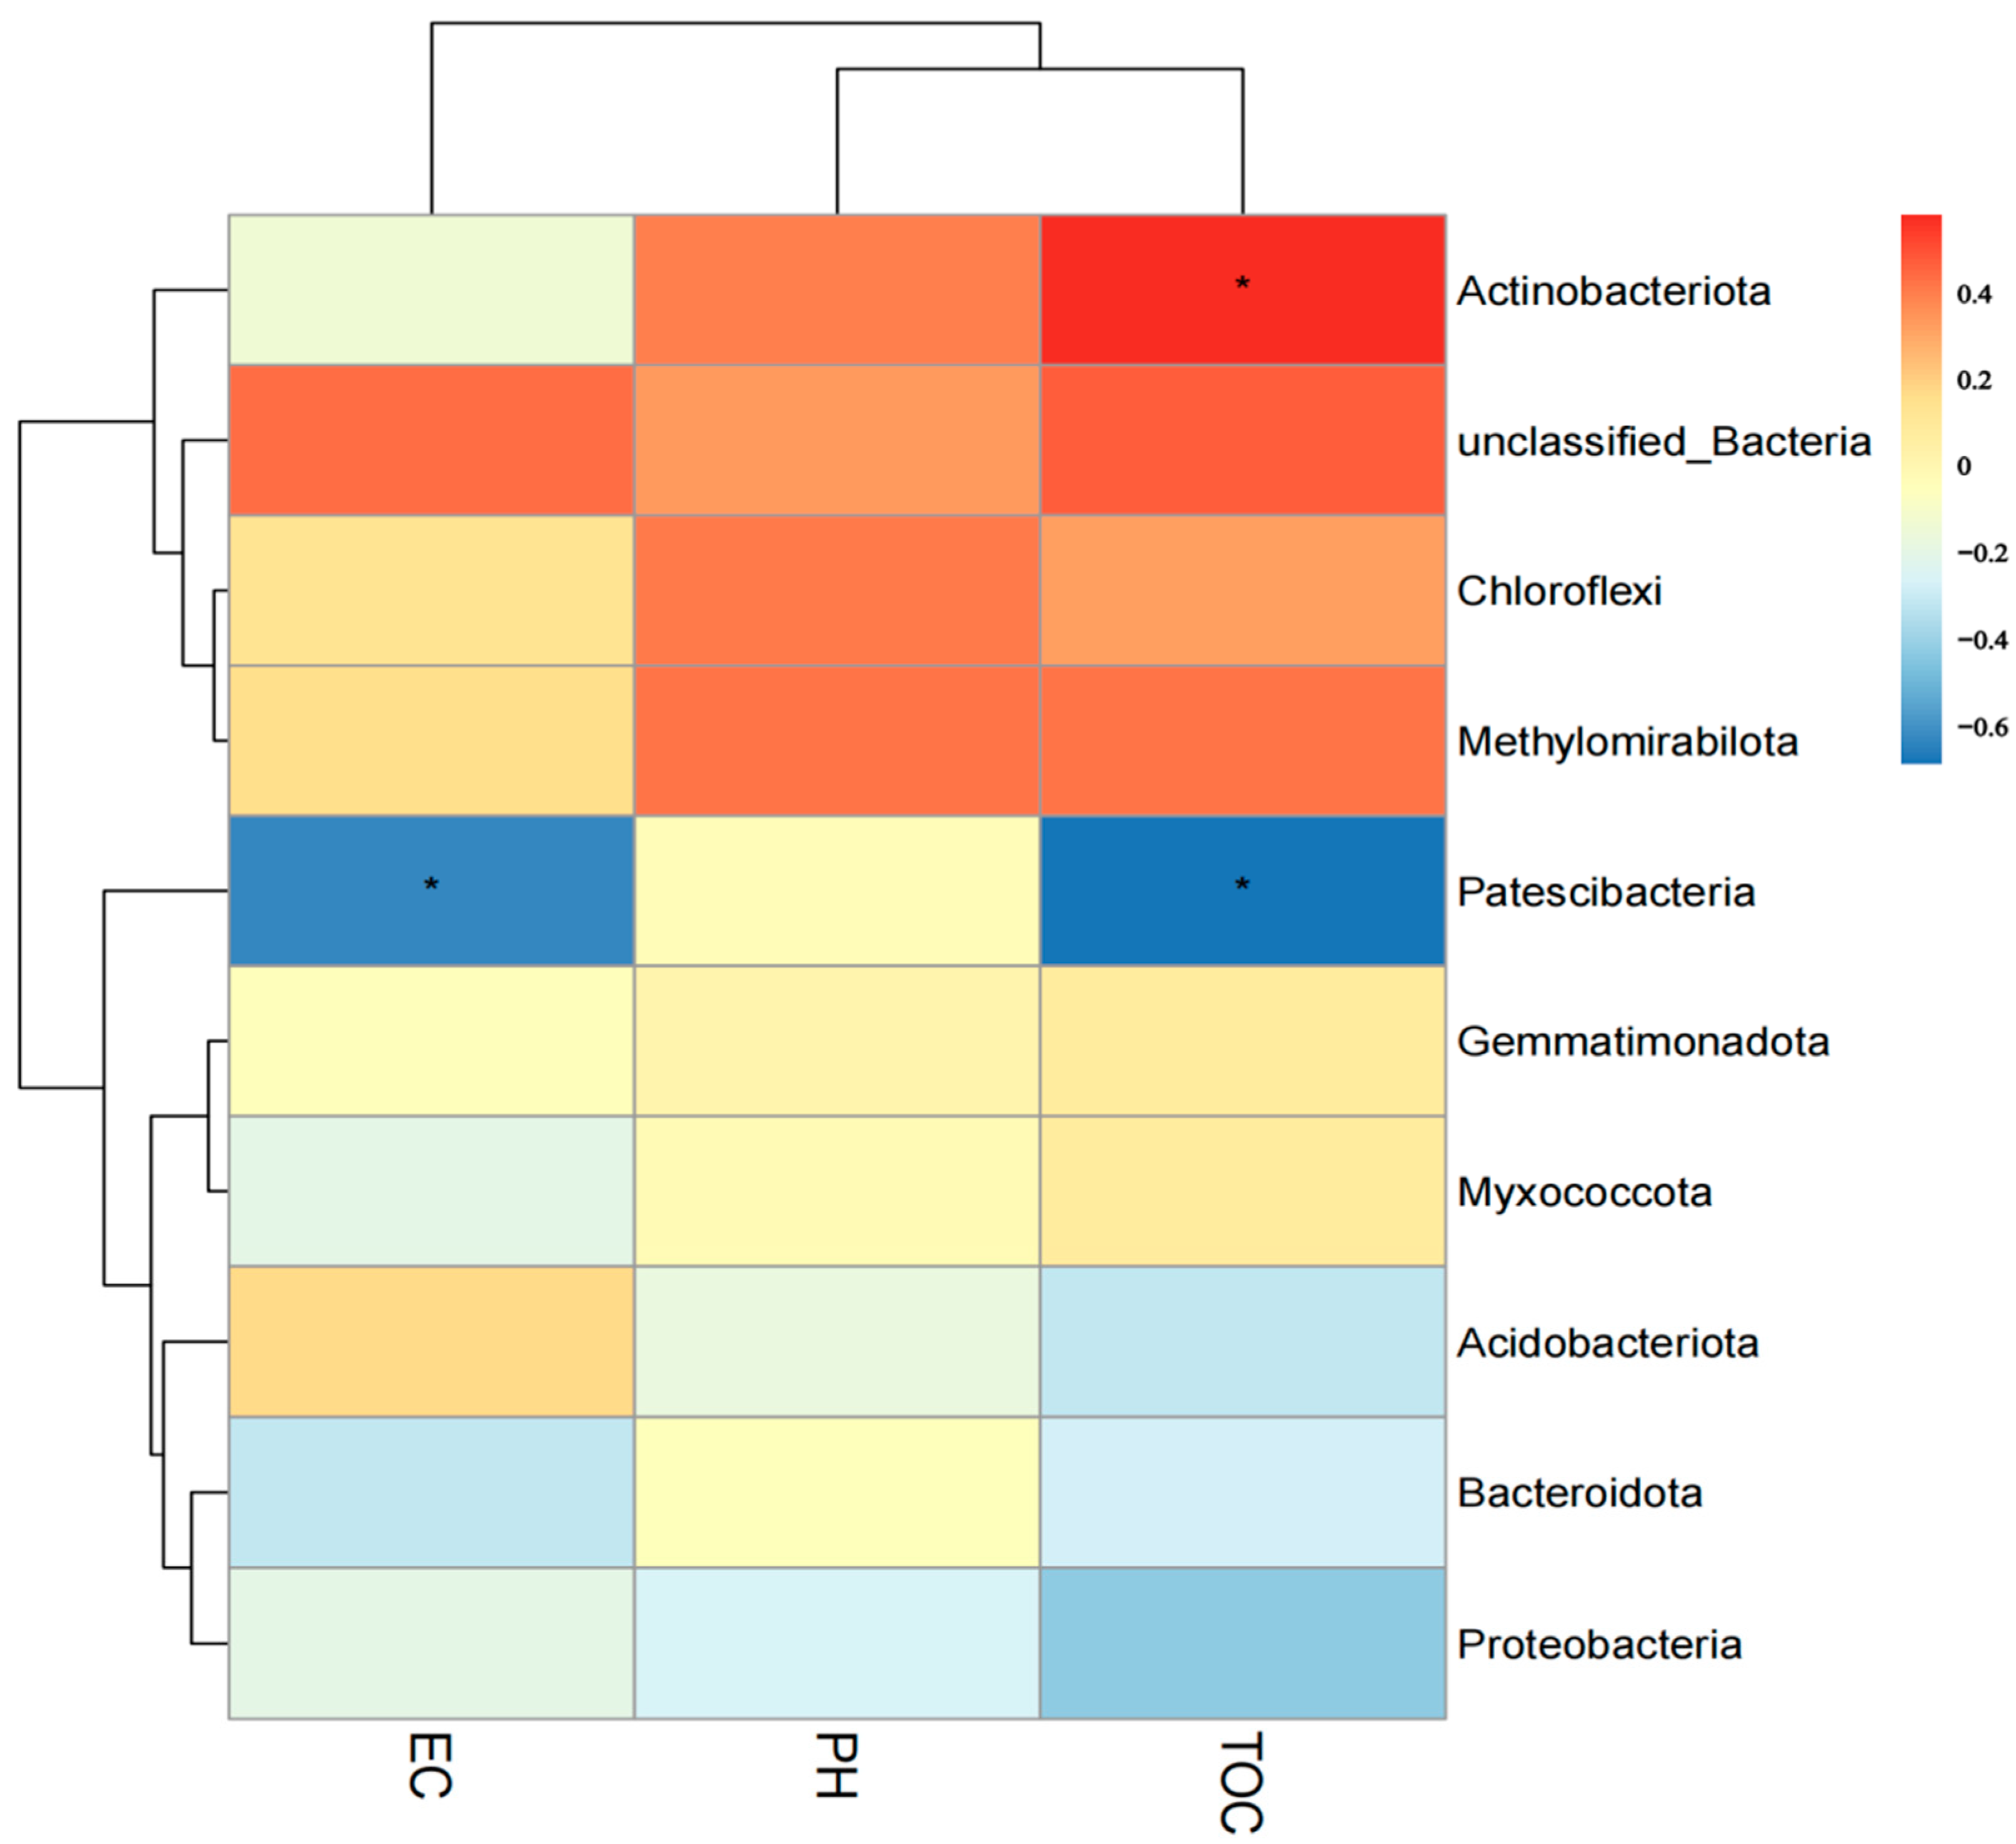
The results show that different environmental factors have other effects on soil microorganisms. The bacterial phyla in relative abundance and the soil physicochemical factors of pH, TOC, and EC were used as parameters, respectively. Our results showed that the Patescibacteria was correlated with the TOC and EC, and the Acitinobacteriota was correlated with the TOC (Figure 5).
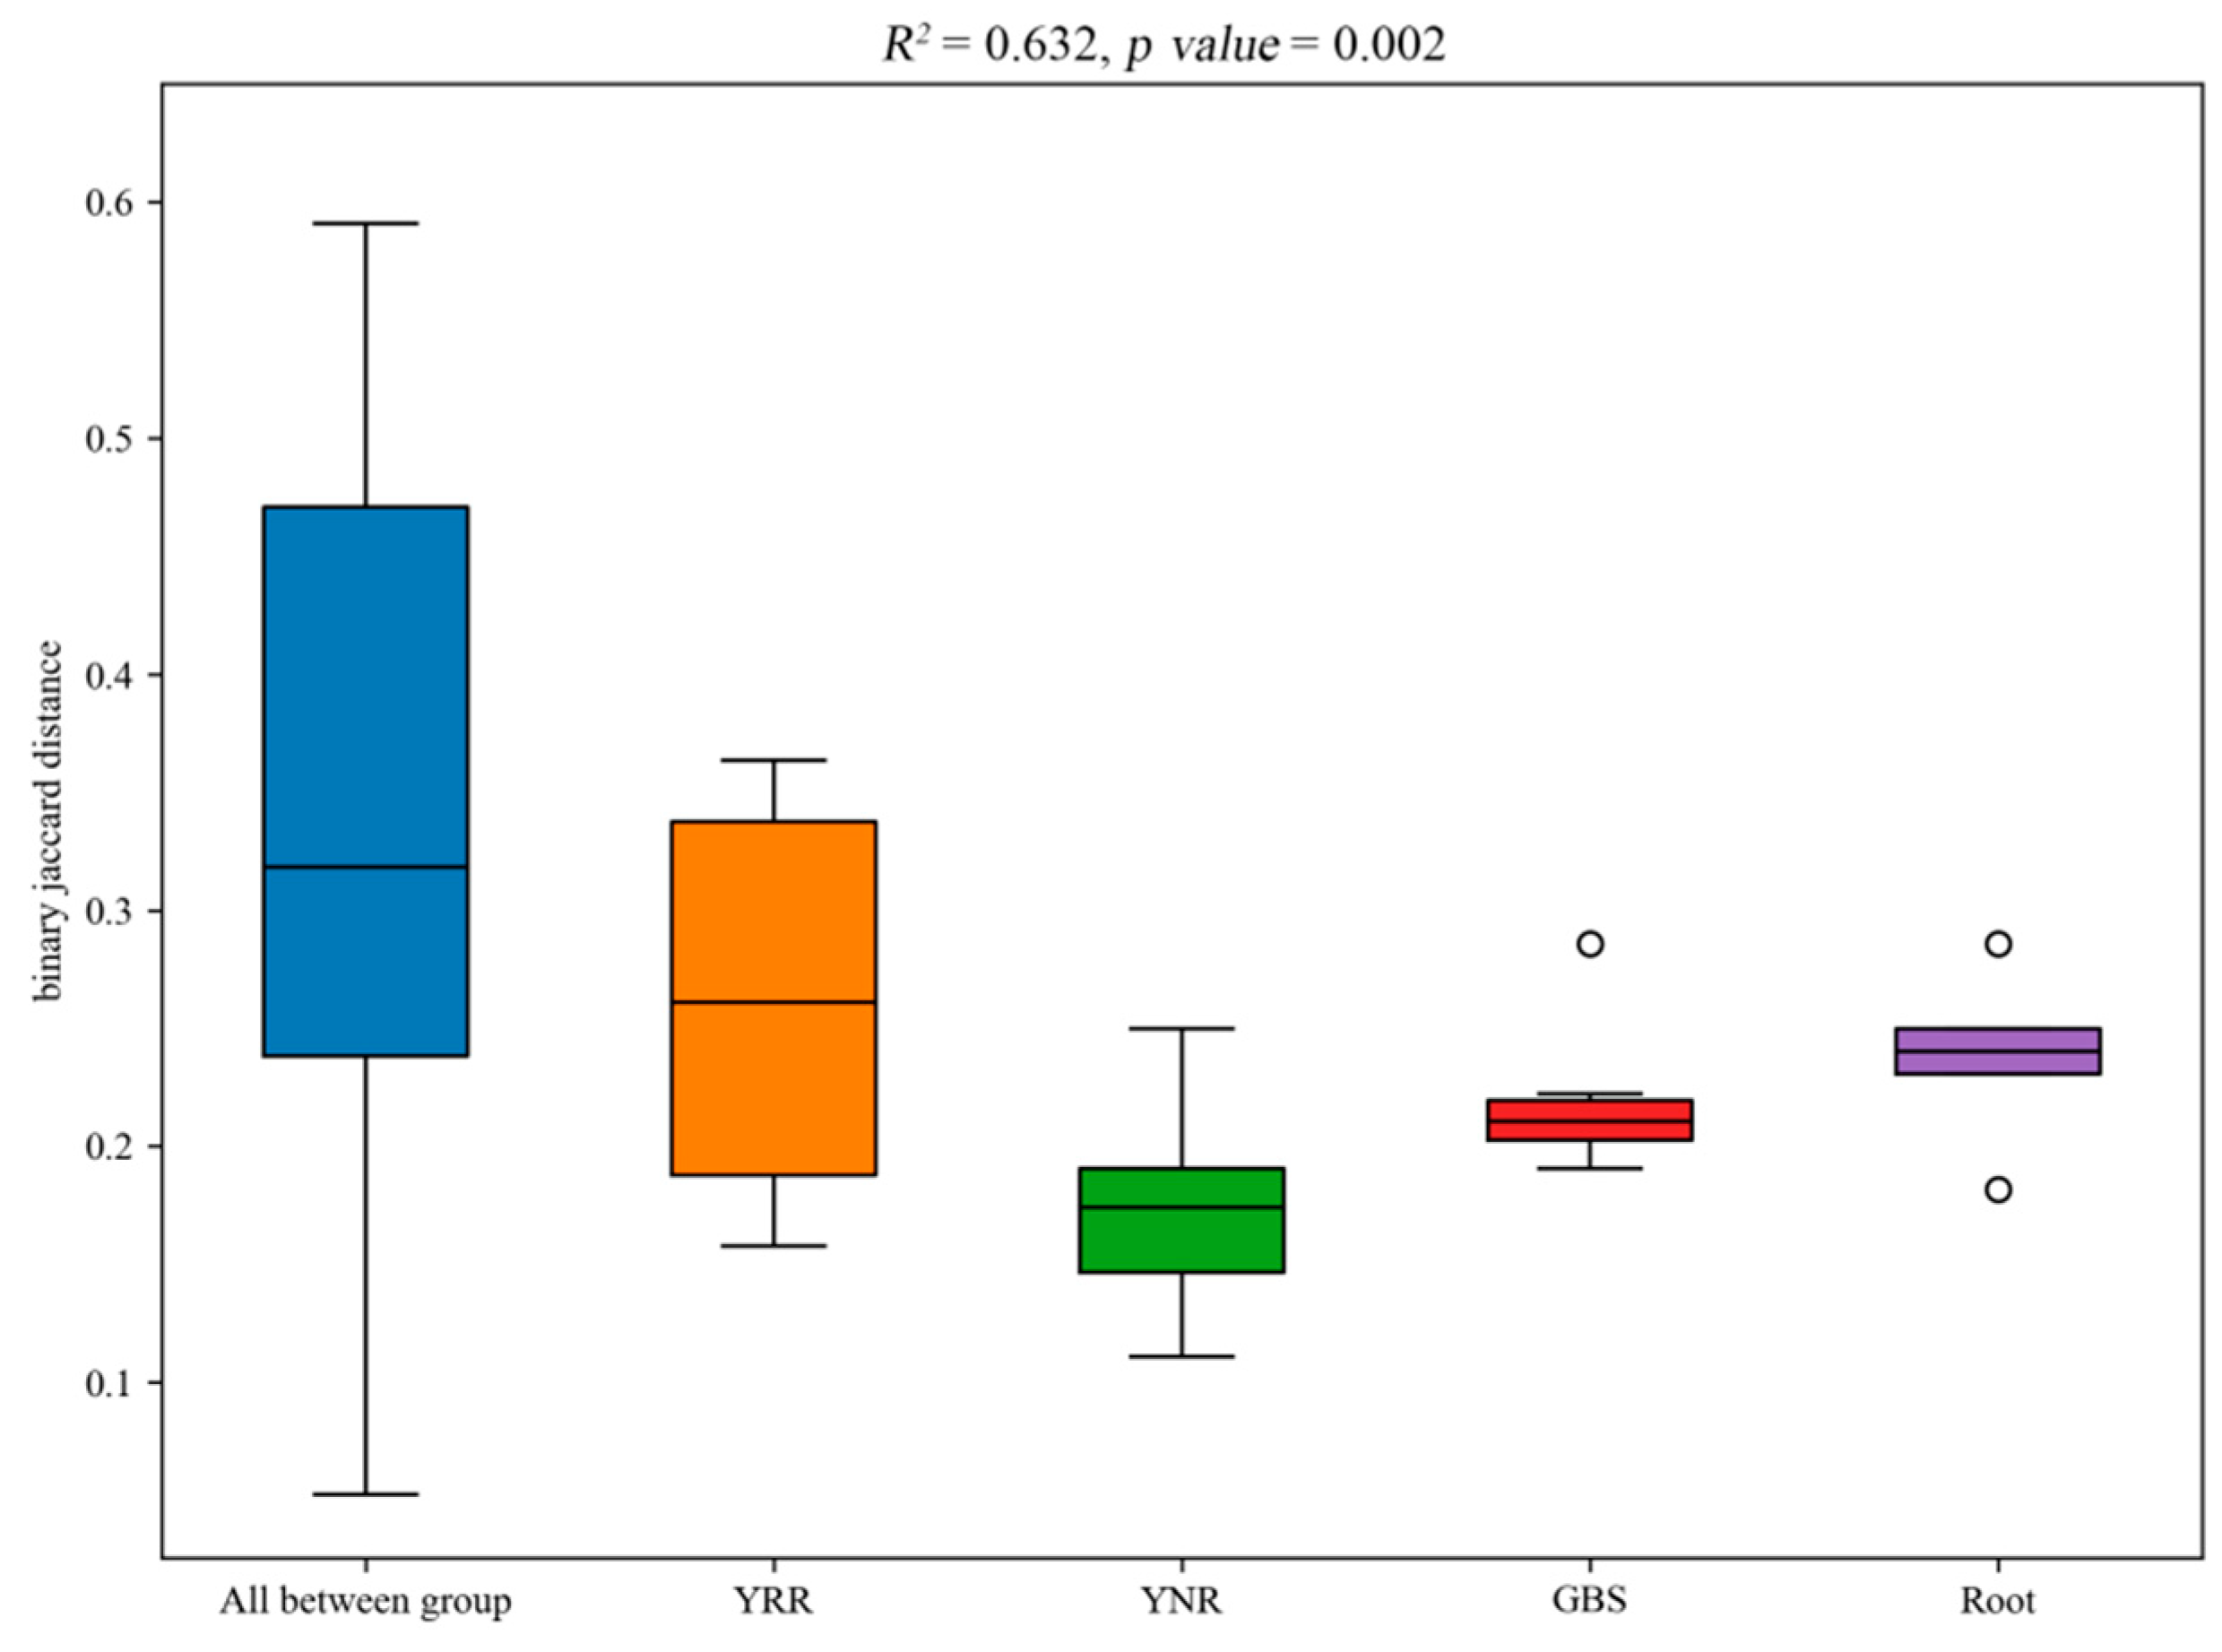
PERMANOVA is also called the multivariate analysis of variance, and it is mainly used in statistical approaches to analyze the similarity between multidimensional data sets. R2 obtained by PERMANOVA analysis represents the degree of explana tion of sample differences between different groups and the ratio of group variance to the total variance. Our results showed that the R2 was 0.632 (p-value = 0.002), indicating a higher degree of explanation of differences between groups and more significant group difference(Figure 6).

3.7. LEfSe Analysis and Random Forest Analyses

The LEfSe can find biomarkers with statistical differences between different groups. Our results showed that the Acidobacteriota and Bacteroidota (at the phylum level) and the Subgroup_10 and Ellin6067 (at the genus level) played essential roles in the YRR group (Figure 7). The Actinobacteriota, Methylomirabilota, Myxococcota and Chloroflexi (at the phylum level), and the MND1 and P3OB_42 (at the genus level) played an essential role in the YNR group. The Proteobacteria and Gemmatimonadota (at the phylum level), and the Sphingomonas (at the genus level) were playing an essential role in GBS groups.
Random forest analyses were conducted to identify the most critical dominant taxa in the rhizosphere (Figure 8). Our results found that the Methylomirabilota and Dadabacteria (at the phylum level), the Sphingomonas and Woeseia (at the genus level) were identified as the main predictors among different groups.

3.8. SourceTracker Analysis

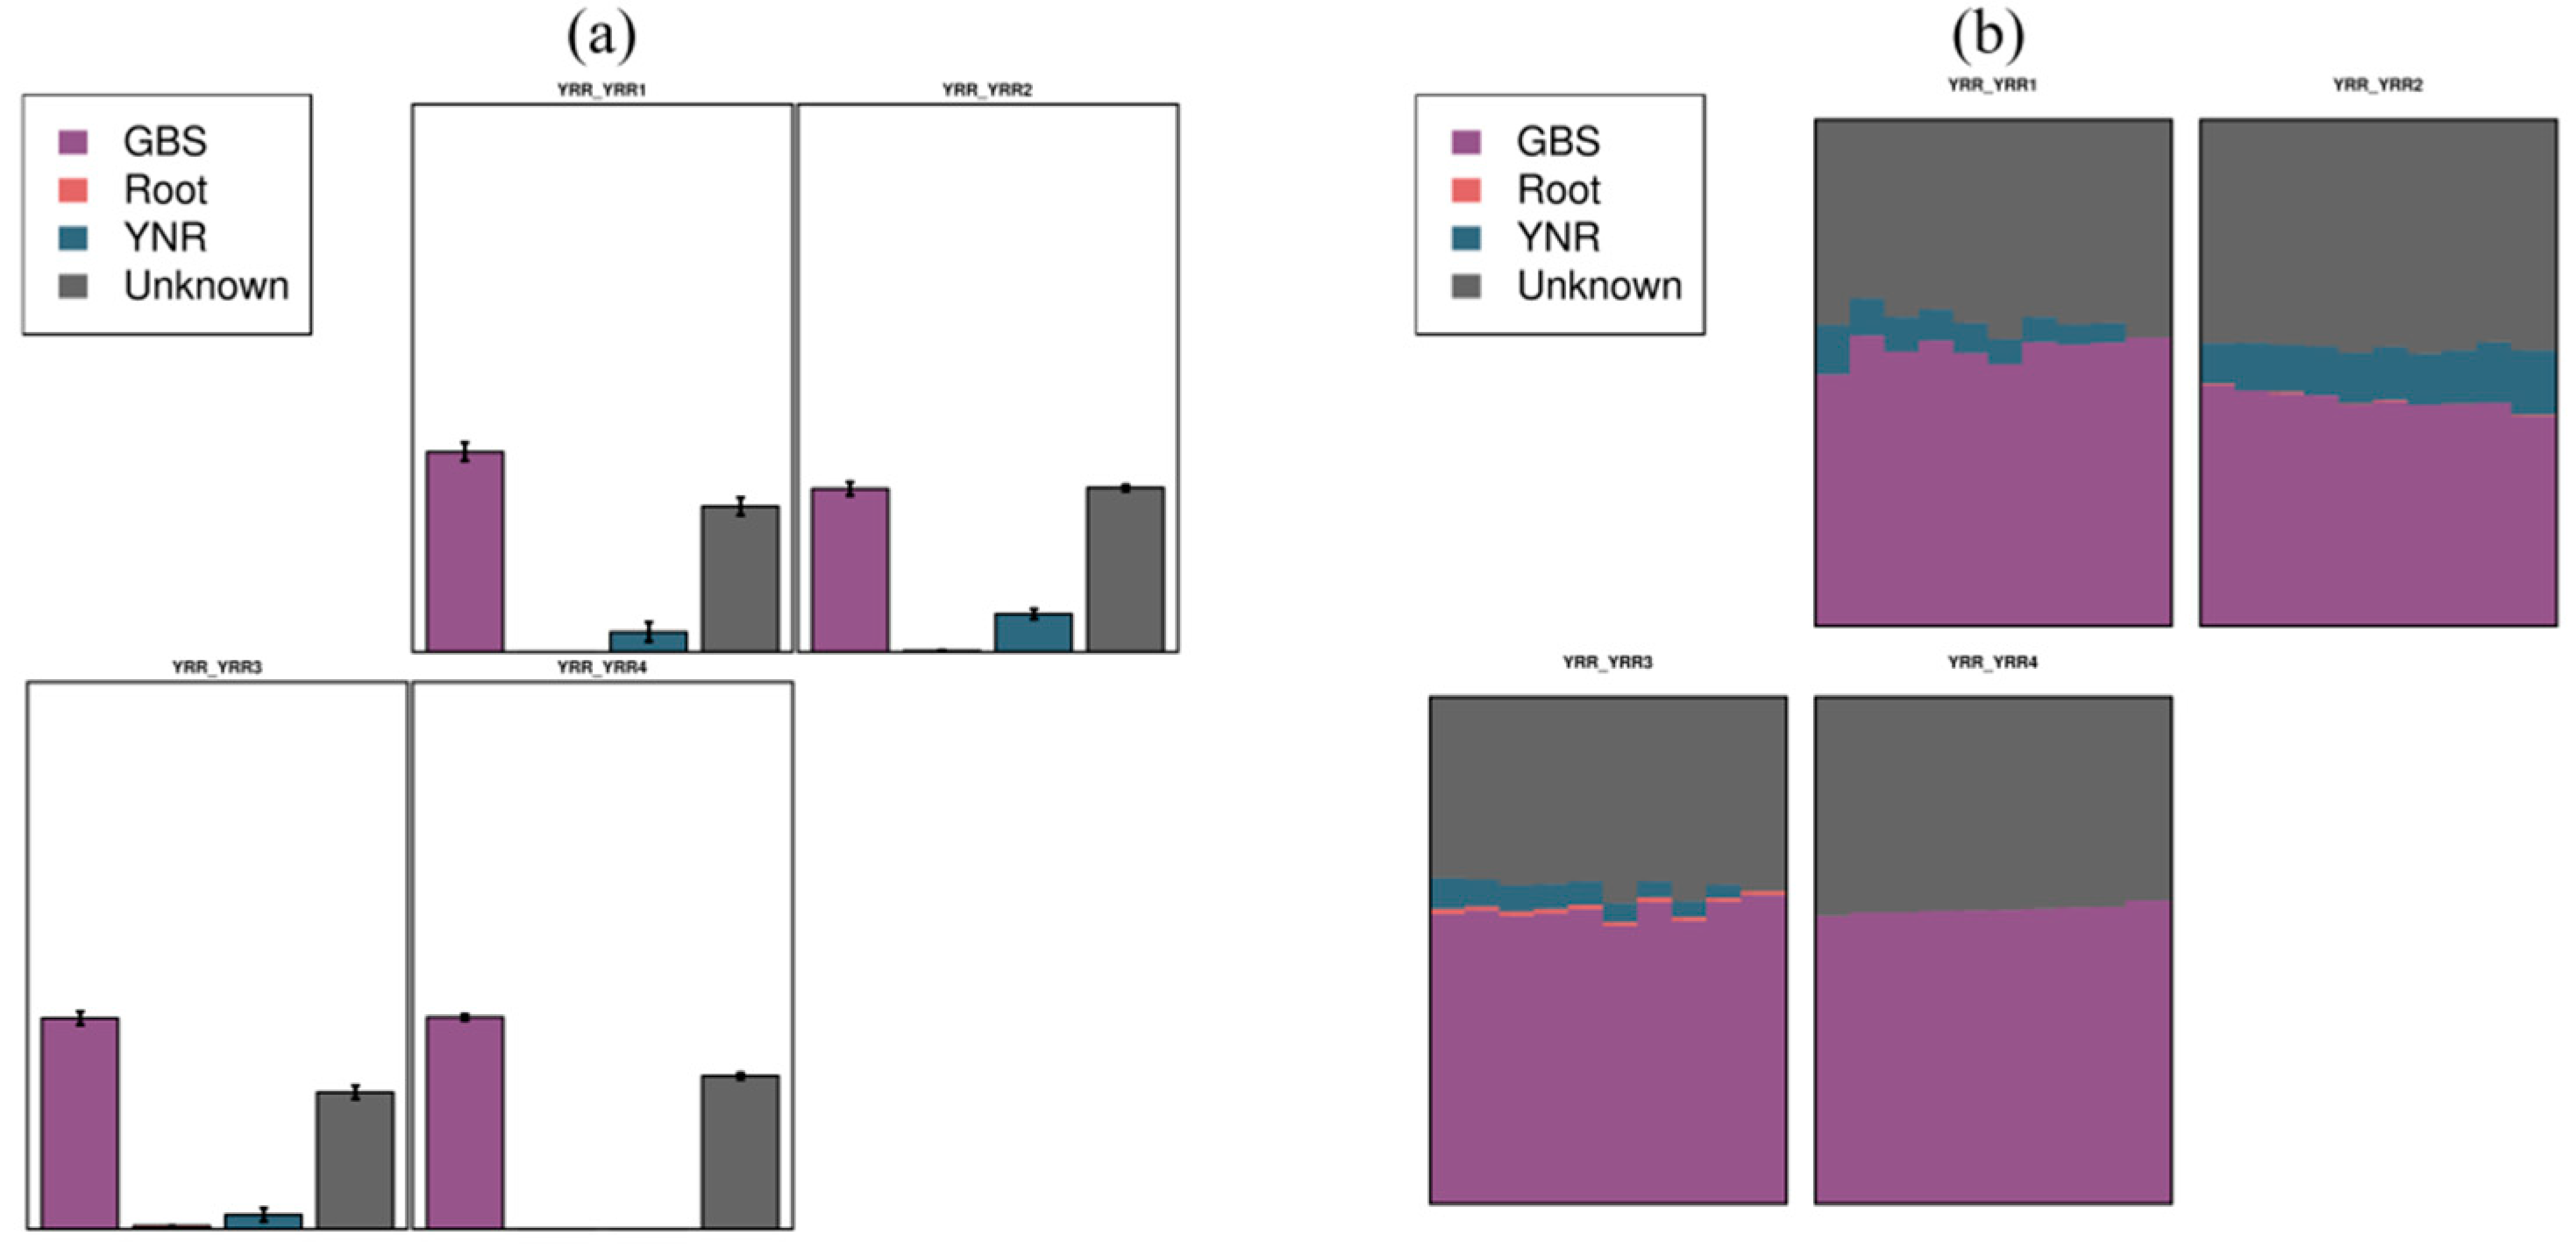
In the present study, the YRR group was identified as sink samples, and the GBS and YNR groups were identified as the source. Based on the Bayesian algorithm, the analysis of sources in the target samples was explored. The composition proportion of sink samples from each source sample was predicted according to the community structure distribution of source samples and sink samples (Figure 9). In the present study, the YRR group was identified as sink samples. Our results showed that the bacterial community of the YRR group was mainly from GBS groups (average 53.14%), a small part from YNR groups (average 6.56%), and the unknown source was an average of 40.3%.

4. Discussion

The soil microbial community composition is closely related to the plant community. Plant invasion often leads to severe changes in plant community composition, resulting in the chemical composition of root secretion and litter change [19]. Eventually, the corresponding succession of soil microbial community structure and the shift in soil microbial community is conducive to the further invasion of invasive plants [20]. The rising trend of plant invasion, the invasion of the ecological environment, social economy, ecological security, and one kind of health had a severe effect; exotic plant invasion has become a problem to be solved [20]. One of the essential effects of plants on the soil environment is to change the characteristics of soil microbial communities. In the invasion process, invasive plants can change the soil microbial diversity and community structure and function of the invaded area, thereby enhancing their adaptability to the environment and benefiting their invasion and growth [21]. The change of soil microorganisms also reacts to the soil environment. By changing the physical and chemical properties and physical properties of the soil, it is more suitable for the colonization and expansion of invasive plants. Previous studies found that the invasion of Solidago canadensis depends largely on beneficial microorganisms in the rhizosphere, which is also closely related to its competitiveness [22].
We analyzed the composition of the P. hysterophorus’s root, rhizosphere, non-rhizosphere, and native plant microorganisms in the present study. The common bacteria were Proteobacteria and Actinobacteriota at the phylum level. Random forest research showed that the microbial composition showed a downward trend from the outside to the inside. We speculated that P. hysterophorus would benefit its microorganisms from the surrounding environment, thereby participating in its metabolic activities and capacity absorption. Previous studies found that the Bacterial endophytes played an essential role in resistance or tolerance to the host plant from biotic and abiotic stresses [23]. Our results showed that only 377 OTUs were identified in the Root group, and the bacterial community of root endophytes was significantly different from other groups. We speculated that the root endophytes of P. hysterophorus have a particular specificity. Previous studies showed that Acidobacteriota was well-adapted to low-nutrient environments [24], representing a highly diverse phylum resident to a wide range of habitats around the globe [25]. In addition, Acidobacteriota was involved in using nitrite as the N source, responding to the soil, expressing multiple active transporters, degrading gellan gum, and producing exopolysaccharides [25]. In our study, the LEfSe results also show an essential role of the Acidobacteriota in the YRR group. Thus, we speculated that the Acidobacteriota was necessary for the P. hysterophorus invasion.
The soil microbial community can form a relatively cooperative and stable ecological relationship with native plants in a specific growth environment. However, the soil microbial community is also volatile and will be affected by invasive plants and plant community diversity changes [26]. There are differences in microbial diversity and richness between P. hysterophorus rhizosphere soil and non-rhizosphere soil. The ACE (823.1), Chao1 (823.19), Simpson (0.9971), and Shannon (9.068) index of the YRR groups are higher than that of the YNR groups, which indicates a higher community diversity and richness in P. hysterophorus rhizosphere. We speculated that invasive plants could change the structure and reduce the diversity of the soil microbial community in the invasion site.
Once there is exotic plant invasion success in the new habitat, under the condition of being suitable, it will spread diffusion, and the soil microbial community changes with the change of the plant communities on the ground [27]. With an in-depth understanding of the underground part of the ecological system, most scholars believe that invasive plants can, directly or indirectly, alter the soil microbial community [28]. The SourceTracker analysis showed that the bacteria of the YRR groups were mainly from the GBS groups, and only a tiny part was from the YNR group. Meanwhile, 1311 OTUs were shared by YRR and GBS groups. The bacteria community of the P. hysterophorus rhizosphere was more similar to the S. viridis rhizosphere than the P. hysterophorus non-rhizosphere. We speculated that P. hysterophorus could significantly affect the bacterial community of the native plant rhizosphere. The impact of invasion on soil bacterial community characteristics shows that changing soil bacterial community may be an essential part of the invasion process of Eurasian japonica. The diversity of bacteria in rhizosphere soil is higher than that in non-rhizosphere soil, and the richness is lower than that in non-rhizosphere soil. Previous studies found that for invasive plants in the process of invasion to land with soil microbial diversity, community structure and functional changes enhance their ability to adapt to the environment, which are conducive to the plants’ invasion and growth [21].

Author Contributions

Conceptualization, S.S. and Z.Z.(Zaiwang Zhang); methodology, L.Z.; software, L.L.; validation, D.S.; formal analysis, H.X.; investigation, H.Z.; data curation, F.Z.; writing—original draft preparation, S.S.; writing—review and editing, J.X., J.W., W.X. and Z.Z (Zhihao Zhou). All authors have read and agreed to the published version of the manuscript.

Funding

This work was supported by the Natural Science Foundation of Shandong Province (ZR2021QD082 and ZR2020MC033) and the Scientific and technological innovation policy guiding project of the Binzhou Agricultural community (2022SHFZ001).

Institutional Review Board Statement

Not applicable.

Informed Consent Statement

Not applicable.

Data Availability Statement

The data that support the findings of this study are available at NCBI (https://www.ncbi.nlm.nih.gov/ (accession number PRJNA897086)) (accessed on 4 November 2022).

Conflicts of Interest

The authors declare no conflict of interest.

References

  1. Rai, P.K. Paradigm of plant invasion: Multifaceted review on sustainable management. Environ. Monit. Assess. 2015, 187, 759. [Google Scholar] [CrossRef] [PubMed]
  2. Zhang, H.; Chen, X.B.; Luo, Y.M. An overview of ecohydrology of the Yellow River delta wetland. Ecohydrol. Hydrobiol. 2016, 16, 39–44. [Google Scholar] [CrossRef]
  3. Shang, S.; Hu, S.X.; Liu, X.X.; Zang, Y.; Chen, J.; Gao, N.; Li, L.Y.; Wang, J.; Liu, L.X.; Xu, J.K.; et al. Effects of Spartina alterniflora invasion on the community structure and diversity of wetland soil bacteria in the Yellow River Delta. Ecol. Evol. 2022, 12, e8905. [Google Scholar] [CrossRef] [PubMed]
  4. Zhang, G.L.; Bai, J.H.; Jia, J.; Wang, W.; Wang, X.; Zhao, Q.Q.; Lu, Q.Q. Shifts of soil microbial community composition along a short-term invasion chronosequence of Spartina alterniflora in a Chinese estuary. Sci. Total Environ. 2019, 657, 222–233. [Google Scholar] [CrossRef] [PubMed]
  5. Khan, N.; Bibi, K.; Ullah, R. Distribution pattern and ecological determinants of an invasive plant Parthenium hysterophorus L., in Malakand division of Pakistan. J. Mt. Sci. 2020, 17, 1670–1683. [Google Scholar] [CrossRef]
  6. Adkins, S.; Shabbir, A. Biology, ecology and management of the invasive parthenium weed (Parthenium hysterophorus L.). Pest Manag. Sci. 2014, 70, 1023–1029. [Google Scholar] [CrossRef]
  7. Gao, X.; Li, M.; Gao, Z.; Zhang, J.; Liu, Y.; Cao, A. Seed germination characteristics and clone reproductive capacity of Parthenium hysterophorus L. Ecol. Environ. Sci. 2013, 22, 100–104. [Google Scholar]
  8. Liu, F.D.; Mo, X.; Kong, W.J.; Song, Y. Soil bacterial diversity, structure, and function of Suaeda salsa in rhizosphere and non-rhizosphere soils in various habitats in the Yellow River Delta, China. Sci. Total Environ. 2020, 740, 140144. [Google Scholar] [CrossRef]
  9. Yang, W.; Yan, Y.E.; Jiang, F.; Leng, X.; Cheng, X.L.; An, S.Q. Response of the soil microbial community composition and biomass to a short-term Spartina alterniflora invasion in a coastal wetland of eastern China. Plant Soil 2016, 408, 443–456. [Google Scholar] [CrossRef]
  10. Jiang, S.; Xing, Y.J.; Liu, G.C.; Hu, C.Y.; Wang, X.C.; Yan, G.Y.; Wang, Q.G. Changes in soil bacterial and fungal community composition and functional groups during the succession of boreal forests. Soil Biol. Biochem. 2021, 161, 108393. [Google Scholar] [CrossRef]
  11. Qu, Z.L.; Liu, B.; Ma, Y.; Xu, J.; Sun, H. The response of the soil bacterial community and function to forest succession caused by forest disease. Funct. Ecol. 2020, 34, 2548–2559. [Google Scholar] [CrossRef]
  12. Zhou, B.H.; Liu, Z.W.; Yang, G.; He, H.; Liu, H.J. Microbial activity and diversity in the rhizosphere soil of the invasive species Zizania latifolia in the wetland of Wuchang Lake, China. Mar. Freshw. Res. 2020, 71, 1702–1713. [Google Scholar] [CrossRef]
  13. Shang, S.; Li, L.Y.; Zhang, Z.W.; Zang, Y.; Chen, J.; Wang, J.; Wu, T.; Xia, J.B.; Tang, X.X. The Effects of Secondary Growth of Spartina alterniflora after Treatment on Sediment Microorganisms in the Yellow River Delta. Microorganisms 2022, 10, 1722. [Google Scholar] [CrossRef] [PubMed]
  14. Bolyen, E. Reproducible, interactive, scalable and extensible microbiome data science using QIIME 2 (vol 37, pg 852, 2019). Nat. Biotechnol. 2019, 37, 1091. [Google Scholar] [CrossRef]
  15. McMurdie, P.J.; Holmes, S. phyloseq: An R Package for Reproducible Interactive Analysis and Graphics of Microbiome Census Data. PLoS ONE 2013, 8, e61217. [Google Scholar] [CrossRef] [Green Version]
  16. IBM Corp. IBM SPSS Statistics for Windows, Version 22.0; IBM Corp: Armonk, NY, USA, 2013.
  17. Liu, Y.; Zhao, H. Variable importance-weighted Random Forests. Quant. Biol. (Beijing China) 2017, 5, 338–351. [Google Scholar] [CrossRef] [Green Version]
  18. Knights, D.; Kuczynski, J.; Charlson, E.S.; Zaneveld, J.; Mozer, M.C.; Collman, R.G.; Bushman, F.D.; Knight, R.; Kelley, S.T. Bayesian community-wide culture-independent microbial source tracking. Nat. Methods 2011, 8, 761–763. [Google Scholar] [CrossRef] [Green Version]
  19. Rai, P.K.; Singh, J.S. Invasive alien plant species: Their impact on environment, ecosystem services and human health. Ecol. Indic. 2020, 111, 106020. [Google Scholar] [CrossRef]
  20. Wagner, V.; Vecera, M.; Jimenez-Alfaro, B.; Pergl, J.; Lenoir, J.; Svenning, J.C.; Pysek, P.; Agrillo, E.; Biurrun, I.; Campos, J.A.; et al. Alien plant invasion hotspots and invasion debt in European woodlands. J. Veg. Sci. 2021, 32, e13014. [Google Scholar] [CrossRef]
  21. te Beest, M.; Stevens, N.; Olff, H.; van der Putten, W.H. Plant-soil feedback induces shifts in biomass allocation in the invasive plant Chromolaena odorata. J. Ecol. 2009, 97, 1281–1290. [Google Scholar] [CrossRef] [Green Version]
  22. de la Pena, E.; Rodriguez-Echeverria, S.; van der Putten, W.H.; Freitas, H.; Moens, M. Mechanism of control of root-feeding nematodes by mycorrhizal fungi in the dune grass Ammophila arenaria. New Phytol. 2006, 169, 829–840. [Google Scholar] [CrossRef] [PubMed]
  23. Kandel, S.L.; Joubert, P.M.; Doty, S.L. Bacterial Endophyte Colonization and Distribution within Plants. Microorganisms 2017, 5, 77. [Google Scholar] [CrossRef] [PubMed] [Green Version]
  24. Chen, C.Y.; Lai, I.L.; Chang, S.C. Changes in Soil Microbial Community and Carbon Flux Regime across a Subtropical Montane Peatland-to-Forest Successional Series in Taiwan. Forests 2022, 13, 958. [Google Scholar] [CrossRef]
  25. Kielak, A.M.; Barreto, C.C.; Kowalchuk, G.A.; van Veen, J.A.; Kuramae, E.E. The Ecology of Acidobacteria: Moving beyond Genes and Genomes. Front. Microbiol. 2016, 7, 744. [Google Scholar] [CrossRef] [PubMed] [Green Version]
  26. Yang, W.; An, S.Q.; Zhao, H.; Xu, L.Q.; Qiao, Y.J.; Cheng, X.L. Impacts of Spartina alterniflora invasion on soil organic carbon and nitrogen pools sizes, stability, and turnover in a coastal salt marsh of eastern China. Ecol. Eng. 2016, 86, 174–182. [Google Scholar] [CrossRef]
  27. Copetta, A.; Lingua, G.; Berta, G. Effects of three AM fungi on growth, distribution of glandular hairs, and essential oil production in Ocimum basilicum L. var. Genovese. Mycorrhiza 2006, 16, 485–494. [Google Scholar] [CrossRef] [PubMed]
  28. Zhang, Z.J.; Liu, Y.J.; Brunel, C.; van Kleunen, M. Soil-microorganism-mediated invasional meltdown in plants. Nat. Ecol. Evol. 2020, 4, 1612–1621. [Google Scholar] [CrossRef]
Figure 1. Alpha diversity indices of bacteria among different species. (a) Chao1; (b) ACE; (c) Shannon; (d) Simpson. Root: root endophytes bacteria samples of P. hysterophorus; YRR: the rhizosphere soil bacteria samples of P. hysterophorus; YNR: the bulk soils bacteria samples of P. hysterophorus; GBS: the soil bacteria samples of native plants were numbered GBS group.
Microorganisms 11 00018 g001
Figure 2. Venn diagram showing the number of shared and unique OTUs among different groups. Each circle represents sampled compartments. Values within intersections represent shared OTUs, and values outside intersections represent unique OTUs. Root: root endophytes bacteria samples of P. hysterophorus; YRR: the rhizosphere soil bacteria samples of P. hysterophorus; YNR: the bulk soils bacteria samples of P. hysterophorus; GBS: the soil bacteria samples of native plants were numbered GBS group.
Microorganisms 11 00018 g002
Figure 3. The relative abundance of the top 10 bacterial communities. (a) at the phylum levels; (b) at the genus levels. Root: root endophytes bacteria samples of P. hysterophorus; YRR: the rhizosphere soil bacteria samples of P. hysterophorus; YNR: the bulk soils bacteria samples of P. hysterophorus; GBS: the soil bacteria samples of native plants were numbered GBS group.
Microorganisms 11 00018 g003
Figure 4. The PCoA based on the Bray–Curtis distance shows the variation in bacterial community structure. Different colors represent the samples from other groups. Root: root endophytes bacteria samples of P. hysterophorus; YRR: the rhizosphere soil bacteria samples of P. hysterophorus; YNR: the bulk soils bacteria samples of P. hysterophorus; GBS: the soil bacteria samples of native plants were numbered GBS group.
Microorganisms 11 00018 g004
Figure 5. The relationship between the soil physicochemical properties and bacterial community. YRR: the rhizosphere soil bacteria samples of P. hysterophorus; YNR: the bulk soil bacteria samples of P. hysterophorus; GBS: the soil bacteria samples of native plants were numbered GBS group. * means significant at 0.05 level.
Microorganisms 11 00018 g005
Figure 6. PERMANOVA analysis among different species. Root: root endophytes bacteria samples of P. hysterophorus; YRR: the rhizosphere soil bacteria samples of P. hysterophorus; YNR: the bulk soils bacteria samples of P. hysterophorus; GBS: the soil bacteria samples of native plants were numbered GBS group.
Microorganisms 11 00018 g006
Figure 7. LEfSe analysis at different bacterial taxonomic levels among different groups. Different colored dots represent the taxa with significant differences among different samples. The inner to outer circles represent taxa from phylum to species. Root: root endophytes bacteria samples of P. hysterophorus; YRR: the rhizosphere soil bacteria samples of P. hysterophorus; YNR: the bulk soils bacteria samples of P. hysterophorus; GBS: the soil bacteria samples of native plants were numbered GBS group.
Microorganisms 11 00018 g007
Figure 8. Random forest analyses among different species. Random forest is a subclass of ensemble learning, which depends on the voting choices of decision trees to determine the final classification results. Different colors mean different bacterial species. (a) at the phylum levels; (b) at the genus levels.
Microorganisms 11 00018 g008
Figure 9. SourceTracker analysis among different species. (a) graph represents a predicted sample, with different colored columns representing the proportions of each source in that sample. Unknow represents the unknown source classification; (b) proportional area map of predicted sample sources. One graph represents a prediction sample; different colors represent the proportion of different sources.
Microorganisms 11 00018 g009
Table 1. Changes of soil physicochemical properties among groups.
GroupsEC (ms/cm)pHTOC (g/kg)
YRR2.16 ± 0.56a7.78 ± 0.07ab18.33 ± 0.90b
YNR2.14 ± 0.19a7.90 ± 0.07a47.08 ± 7.41a
GBS1.87 ± 0.24a7.69 ± 0.02b25.74 ± 7.68ab
TOC means Total Organic Carbon, and EC means electrical conductivity. Values are the means ± standard error (n = 4). Lowercase letters in the same column indicate significant differences between the two groups (p < 0.05). YRR: the rhizosphere soil bacteria samples of P. hysterophorus; YNR: the bulk soil bacteria samples of P. hysterophorus; GBS: the soil bacteria samples of native plants were numbered GBS group.
Disclaimer/Publisher’s Note: The statements, opinions and data contained in all publications are solely those of the individual author(s) and contributor(s) and not of MDPI and/or the editor(s). MDPI and/or the editor(s) disclaim responsibility for any injury to people or property resulting from any ideas, methods, instructions or products referred to in the content.