3.1. Broth Media Comparison and Growth Curves
Cultures of
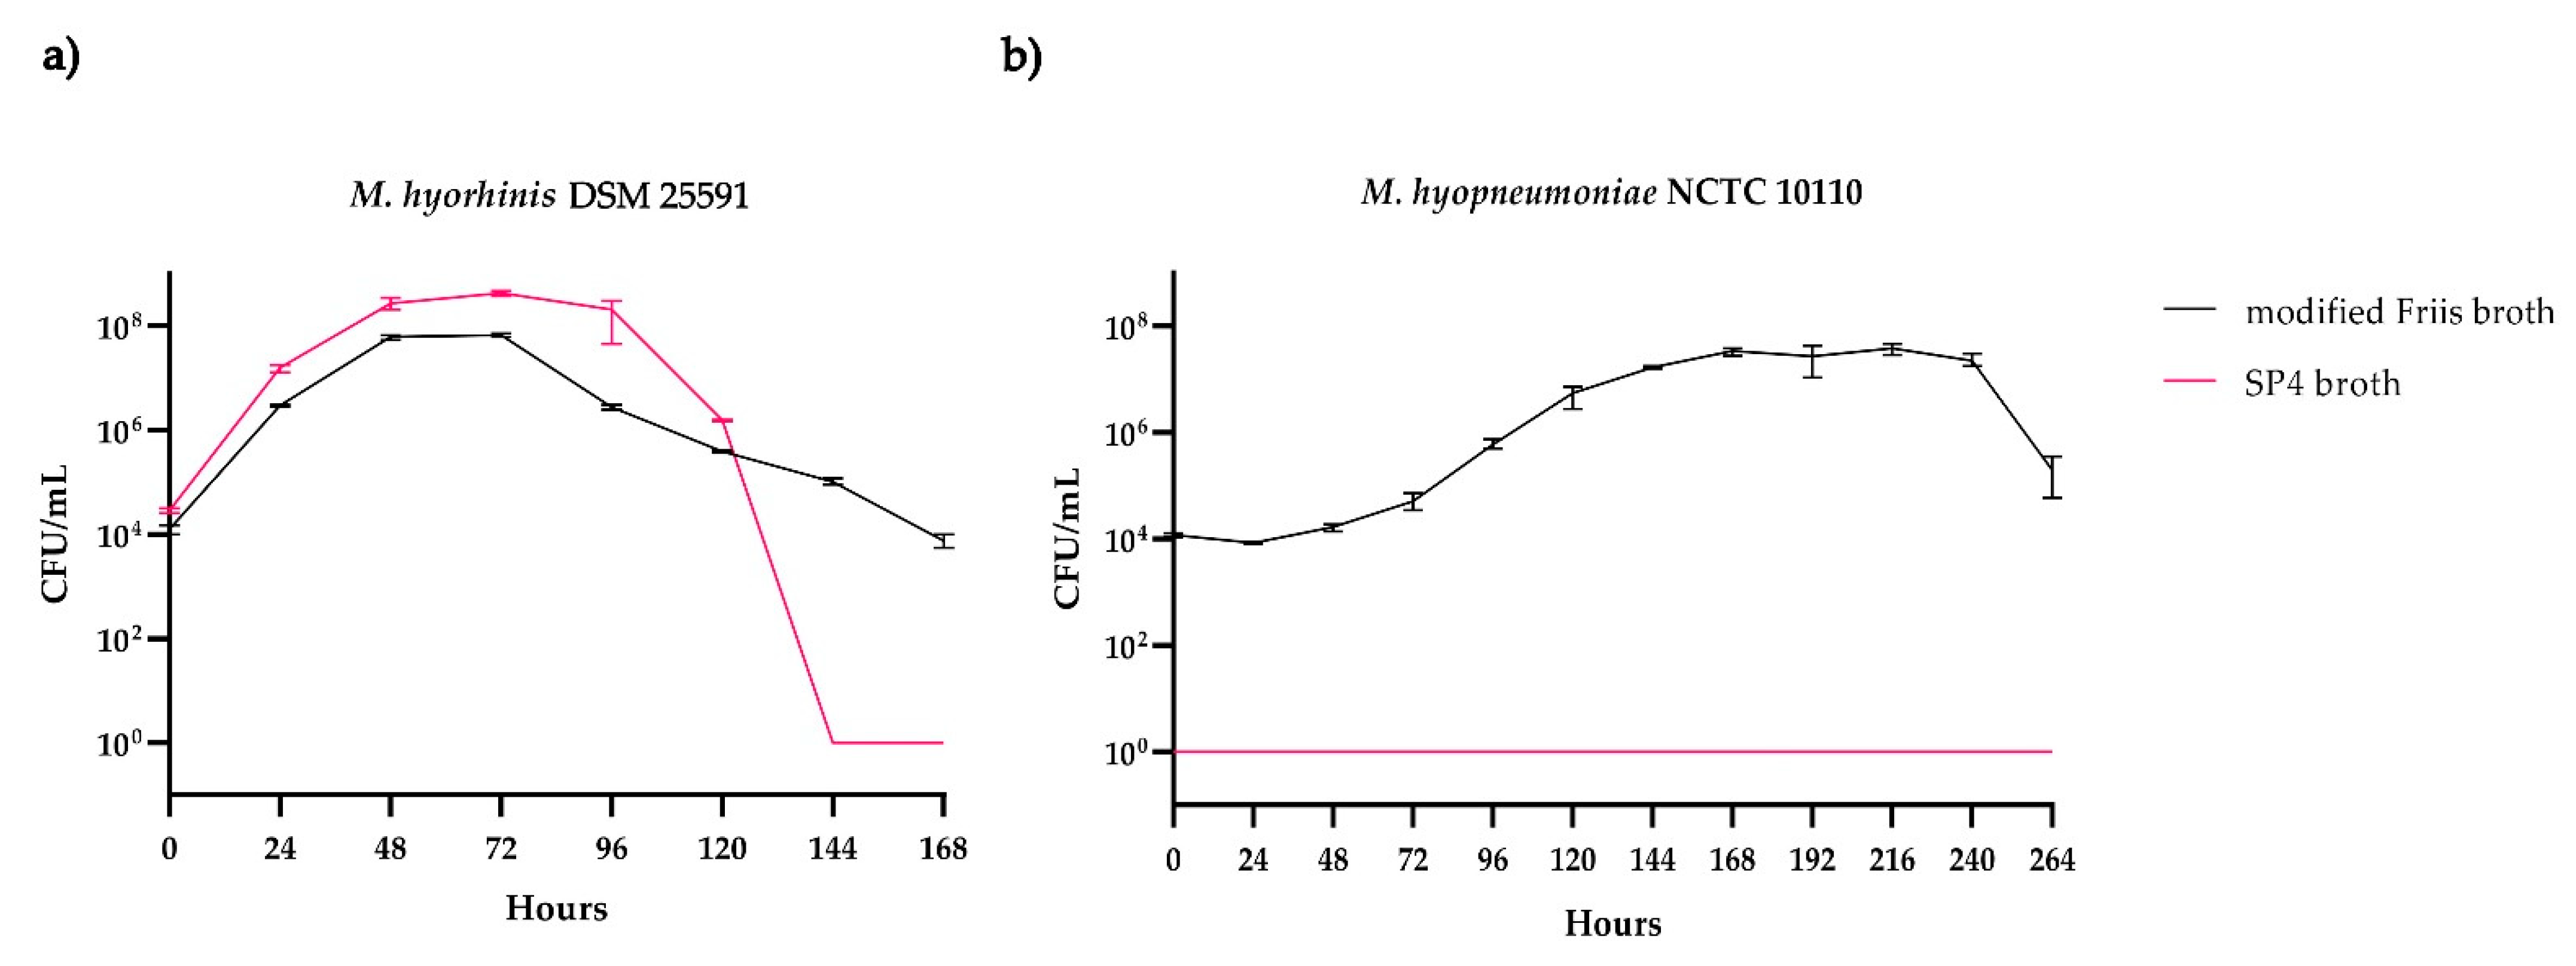
M. hyorhinis DSM 25591 showed similar growth curves for both broth media tested (
Figure 3a). The total numbers of CFU/mL in SP4 broth were higher than those in modified Friis broth. This can be partly explained by a slightly higher starting CFU/mL inoculated into SP4 broth compared to modified Friis broth. On the other hand, the viability of
M. hyorhinis DSM 25591 seemed to be better supported by the modified Friis broth. The onset of the death phase in modified Friis broth was less sudden than in SP4 broth, in which the number of viable cells strongly decreased after four days of incubation. The doubling time of
M. hyorhinis in modified Friis broth was calculated to be 3 h and 54 min. For cultures grown in SP4 broth, the doubling time was calculated to be 3 h and 38 min.
For
M. hyopneumoniae NCTC 10110, growth was only observed in modified Friis broth (
Figure 3b). Though the strain was cultured and sampled for 14 days, colonies on the modified Friis agar plates were only produced in samples taken until the 11th day (264 h) of incubation in modified Friis broth. No growth was observed in SP4 broth or on SP4 agar plates. However, samples taken from an SP4 broth culture (incubated for eight days) and plated onto modified Friis agar plates revealed equal numbers of CFU, indicating that
M. hyopneumoniae remained viable but did not grow in SP4 broth. One reason why
M. hyopneumoniae did not show any growth on the SP4 agar might be the higher percentage of agarose compared to the modified Friis agar plates. It is known that the increase in agarose might decrease the successful growth of
M. hyopneumoniae on solid media [
28]. The doubling time of
M. hyopneumoniae cultured in modified Friis broth was calculated to be 10 h and 44 min.
Based on these results, all further experiments were performed with modified Friis broth only, as it promotes the growth of both porcine Mycoplasma species.
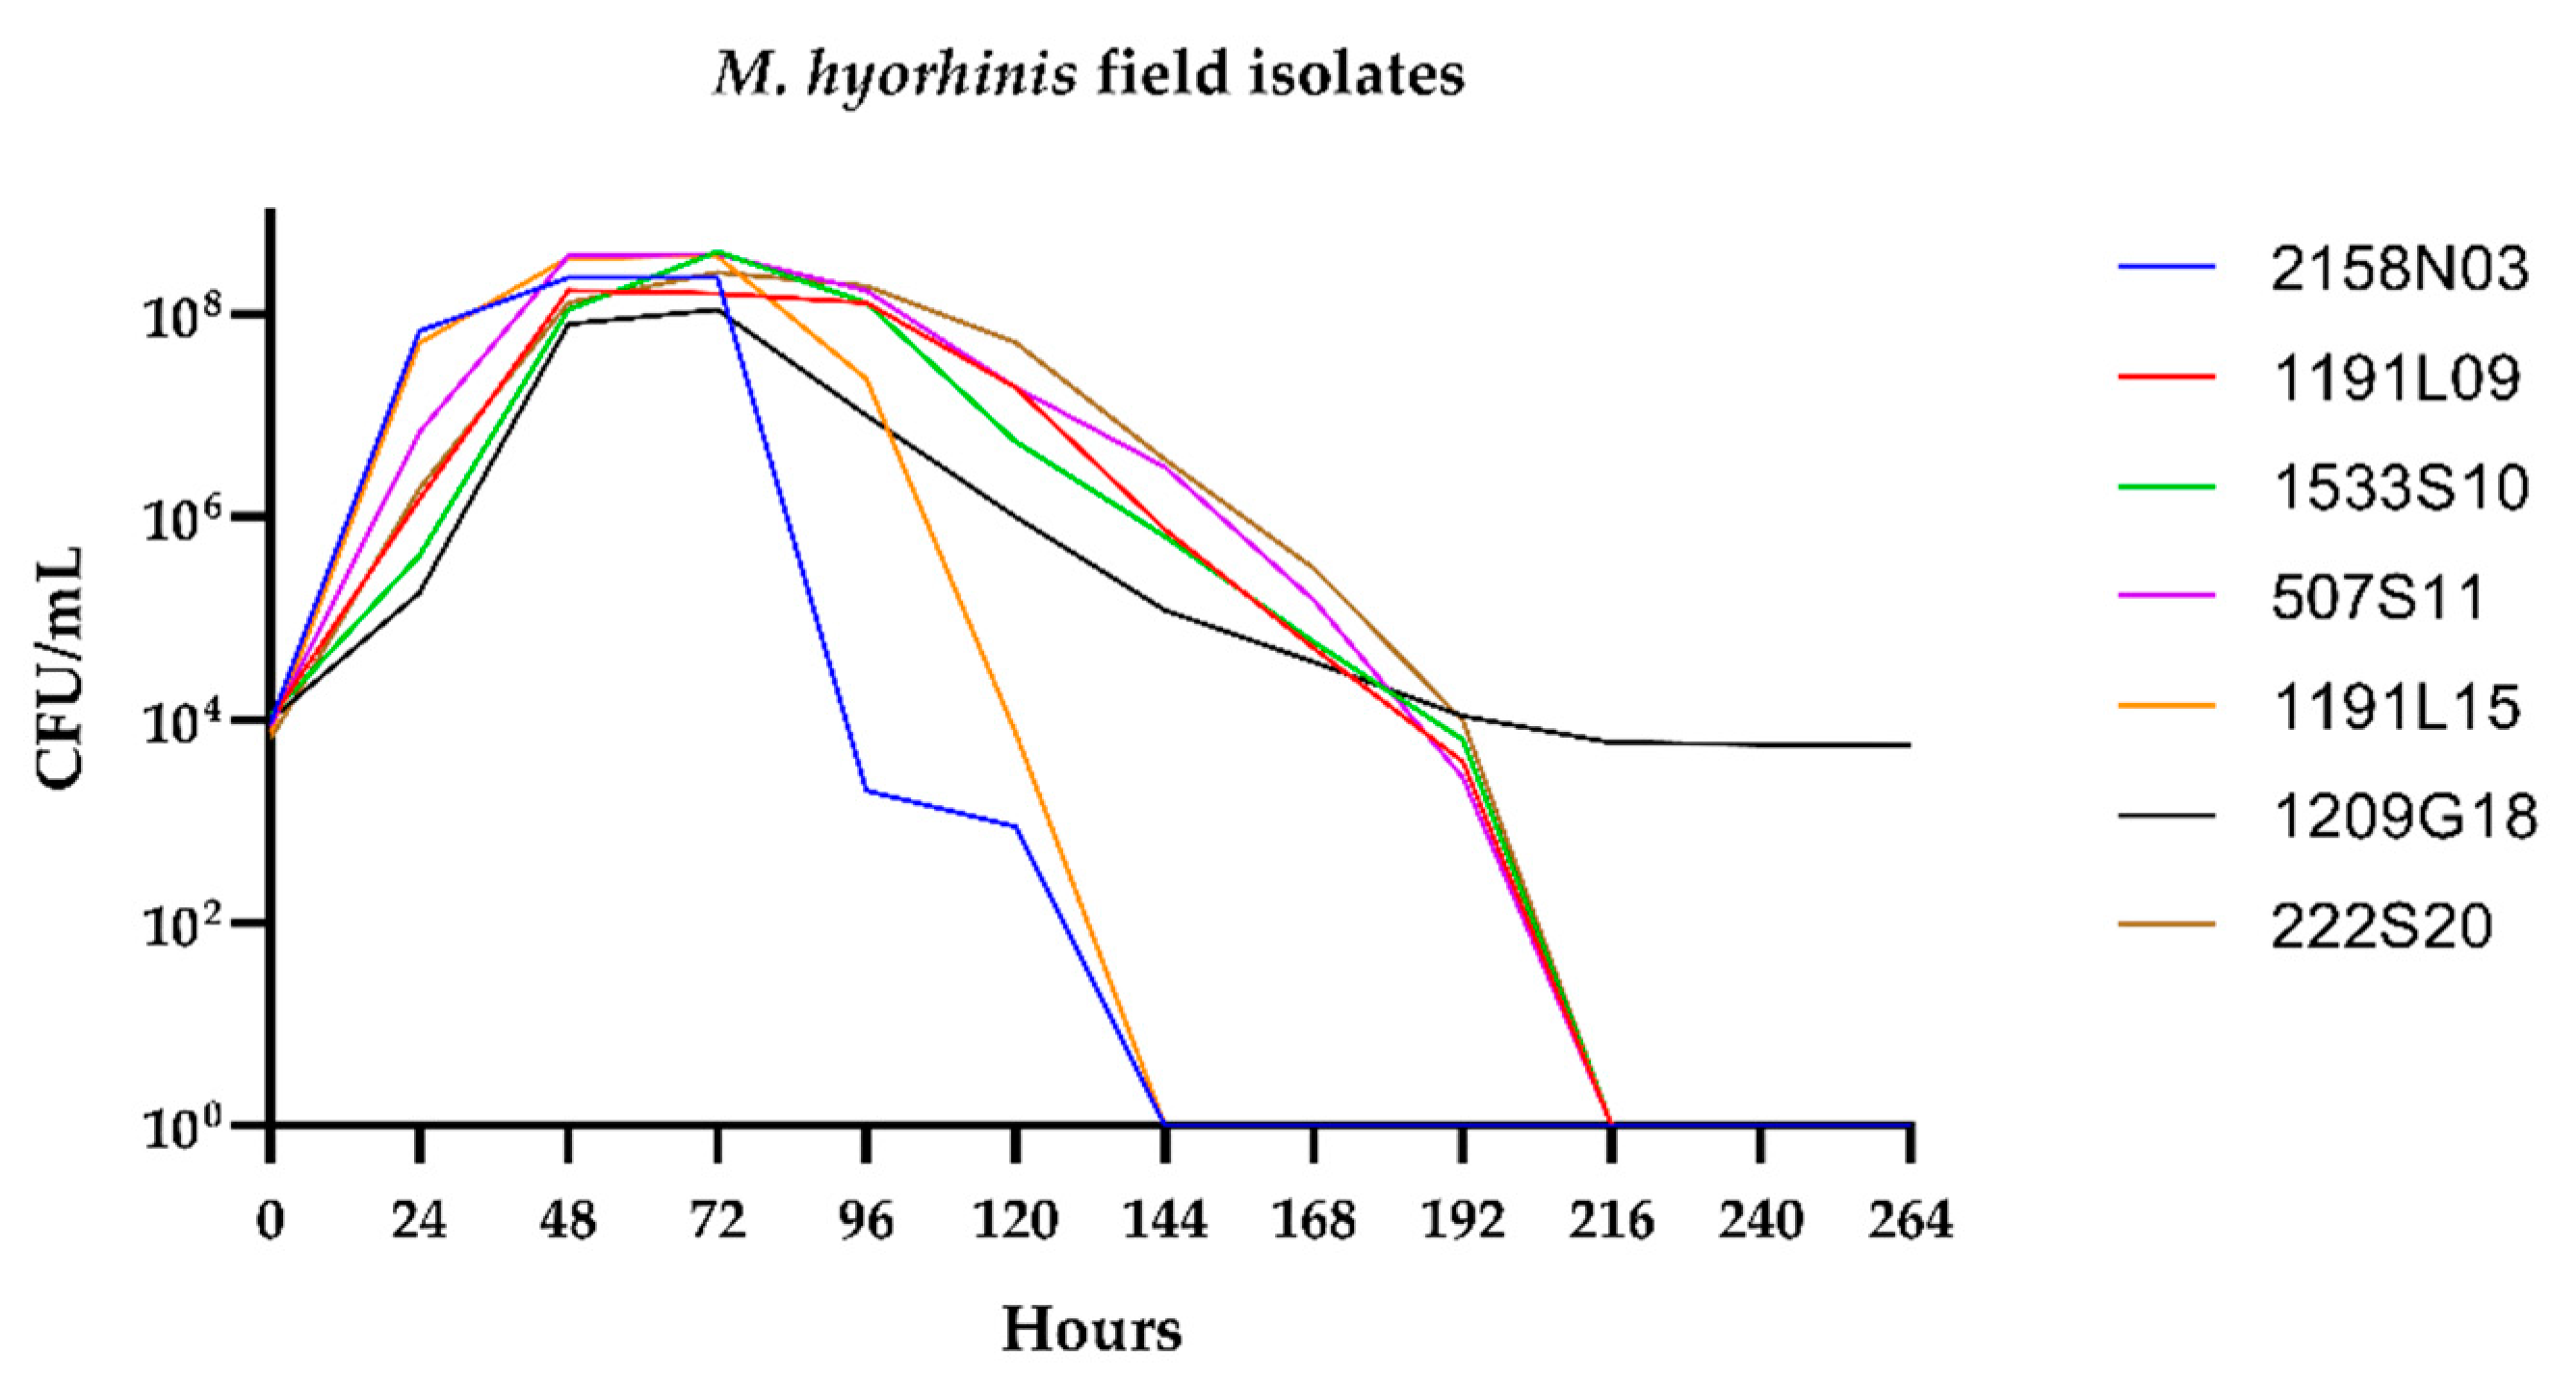
The growth curves of seven different
M. hyorhinis field isolates were determined in modified Friis broth. The isolates showed variable growth rates (
Figure 4), with doubling times ranging from 3 h and 5 min (1191L15) to 3 h and 42 min (1209G18). This was expected, as varying growth rates have been described for different
M. hyorhinis isolates before [
29,
30]. The growth curves of the field isolates indicated that the planned reading times of the AST microtiter plates at fixed time points might not be feasible, and individual evaluation of the color change is needed.
The daily removal of 120 µL for CFU determination had no influence on the final CFU counts.
3.2. Antimicrobial Susceptibility Testing of M. hyorhinis DSM 25591
The twelve antimicrobial substances tested were chosen according to their therapeutic use in the field but also because of possible resistance developments against them [
31]. The porcine mycoplasmas
M. hyorhinis and
M. hyopneumoniae are described to be susceptible to aminoglycosides, fluoroquinolones, phenicols, pleuromutilins, and tetracyclines, whereas the susceptibility to macrolides was shown to be variable [
12]. Intrinsic resistance to beta-lactams as well as sulfonamides and trimethoprim is well known [
10,
32]. As representative of the class of lincosamides, the substance clindamycin was added as well [
33].
Twenty-two susceptibility tests of M. hyorhinis DSM 25591 were conducted on independent occasions using the modified Friis broth as described above. The individual repetitions were performed to establish repeatable MICs of the type strain as a comparison for batch testing. The microtiter plates were evaluated daily. Whenever the growth controls showed a full-color change, the microtiter plates were evaluated. The color change was defined as the change from red (no growth) to yellow (growth). The final evaluation of the microtiter plates was marked by two readings 24 h apart, with no major change in MIC values (endpoint).
This resulted in MIC values mostly spanning two to three dilution steps (
Table 2). In doxycycline (≤0.06 mg/L) and tetracycline (≤0.12 mg/L) containing wells, no growth was detected throughout all 22 tests. The MIC values for gentamicin (1–2 mg/L), enrofloxacin and marbofloxacin (0.5–1 mg/L), clindamycin (0.12–0.25 mg/L), tulathromycin (≤0.06–0.12 mg/L) and tiamulin (≤0.03–0.06 mg/L) clustered around two successive dilution steps. For gentamicin, this resulted in an equal distribution between 1 and 2 mg/L. Regarding enrofloxacin, marbofloxacin, clindamycin, tulathromycin, and tiamulin, the MIC values mostly clustered on one dilution step, with only a minor number of tests resulting in different MICs. MICs ranging over three dilution steps were noticed for the substances florfenicol (0.25–1 mg/L), tylosin (≤0.06–0.25 mg/L), and erythromycin (8–32 mg/L). It is noteworthy that the middle value always peaked, indicating a main MIC value ± one dilution step. Only for tilmicosin, the MICs ranged over four dilution steps (0.5–4 mg/L), although the lowest MIC of 0.5 mg/L was detected only once.
To assess the suitability of the modified Friis broth as test medium, the mode MIC was established based on the MIC values given in
Table 2. The mode MIC describes the homogeneity of repeated AST results. Based on the degree of identity between individual tests, the exact and essential MIC agreement can be calculated. The exact MIC agreement describes the percentage of MIC values, matching exactly the mode MIC. The essential MIC agreement gives the percentage of MIC values matching the mode MIC, including one dilution step below and above (± one dilution step).
An exact MIC agreement was observed for the antimicrobial agents gentamicin, doxycycline, and tetracycline. For the class of tetracyclines, this meant consistently no growth. Gentamicin was equally distributed across two dilution steps, wherefore they were taken together as one mode MIC. The exact MIC agreement of clindamycin was calculated to be 91%, and for marbofloxacin and tiamulin, both 82%. The mode MIC of tulathromycin was exactly repeated in 73% of the tests, that of enrofloxacin in 64%, and that of tylosin in 55%. The lowest exact MIC agreements of 50% were calculated for florfenicol, erythromycin, and tilmicosin.
For all antimicrobial substances, except for tilmicosin, the essential MIC agreement was 100%. One test showed a lower MIC value of tilmicosin (−2 dilution steps from the mode MIC), resulting in an essential MIC agreement of 95%. According to CLSI standards, an essential agreement of ≥95% for a possible control strain is required [
34]. Thus, all tested substances fall within this category (
Table 3, far right column). The mean essential agreement was calculated to be 99.62%.
Since a deviation of one dilution step from the mode MIC is acceptable, the essential MIC agreement is of importance for evaluating a test method. For
M. hyorhinis DSM 25591, together with the modified Friis broth, as applied here, the criterium given by the CLSI documents is fulfilled, as well as ISO Directive 20776-2:2021 [
34,
35]. Therefore, we conclude that the use of the modified Friis broth is an acceptable choice, not only as a culture medium but also as a test medium.
After determining a basic MIC distribution by individual repetitions of the susceptibility tests, the main ingredients of the modified Friis broth were individually exchanged. The six different settings described in the Material and Methods section were repeated three times, and the initial broth served as a control in each repetition (resulting in a total of 21 individual tests). For better comparability, the initial MIC ranges are highlighted in green (
Table 4).
For most antimicrobial agents, the obtained MIC values for
M. hyorhinis DSM 25591 fell within the expected ranges shown in
Table 2. Only for gentamicin and tiamulin the MIC results exceeded one dilution step. For clindamycin, the batch testing resulted in an increase in two dilution steps (
Table 4).
We again evaluated the percentage of deviating MIC values by calculating the MIC agreements (
Table 5). The mode MIC was based on the initial tests of
M. hyorhinis DSM 25591 in modified Friis broth as described above (
Table 3).
The exact MIC agreements showed a greater variance than in the initial tests, ranging from the lowest exact agreement of 38% (tiamulin) to 100% (doxycycline and tetracycline). For most antimicrobial agents, the individual exchange of broth ingredients resulted in an essential MIC agreement of 95–100%. Only for tiamulin, the essential MIC agreement was lower, at 71% (
Table 5).
By comparing the initial mode MICs (
Table 3) with the batch comparison (
Table 4), and the essential MIC agreements, respectively, it can be concluded that for most antimicrobial agents, the modified Friis broth is suitable. According to the CLSI document M23, the required essential MIC agreement of ≥95% for a type strain is met on all accounts except for tiamulin (
Table 5, batch testing) [
34]. The lower agreement for tiamulin could be in part due to the mode MIC, which was at the lowest tiamulin concentration in the microtiter plates. However, when considering the distribution of MIC values for tiamulin, all three MIC values are almost evenly distributed. If only one of the tests resulting in a MIC of ≤0.03 mg/L would have resulted in a one dilution step higher MIC, a mode MIC of 0.06 mg/L ± one dilution step would have been achieved, resulting in an essential agreement of 100% instead of 71%. When calculating the mean essential agreement for both datasets (initial tests: 99.62%; batch tests: 97.22%), it can be concluded that the influence of different medium ingredients within this complex broth medium is only of a minor nature.
3.3. Antimicrobial Susceptibility Testing of M. hyorhinis Field Isolates
Finally, we utilized a selection of six field isolates to validate the standardized method (
Table 6). The field isolates were chosen according to the year of isolation as well as the source of isolation (country, organs). Although erythromycin resistance is fairly common among porcine mycoplasmas, we evaluated the susceptibility of
M. hyorhinis towards erythromycin to monitor the occurrence of elevated MICs in field isolates and not to overlook any possible changes [
12,
13,
14,
36].
For the antimicrobial agents gentamicin, enrofloxacin, marbofloxacin, florfenicol, erythromycin, tiamulin, doxycycline, and tetracycline unimodal distributions of MIC values over two to three dilution steps were observed (
Table 6). For the macrolides tilmicosin, tulathromycin, and tylosin, as well as the lincosamide clindamycin, a bimodal distribution was noted. For substances with bimodal distributions, very high MIC values were occasionally detected. It was also noted that the elevated MIC values corresponded to the same isolates. Further studies are required to investigate whether mutations or acquired macrolide/lincosamide resistance genes account for the high macrolide/lincosamide MICs in these isolates.
The mode MIC was then assessed for each field isolate individually by testing each isolate in triplicate using the initial modified Friis broth composition. The individual MICs obtained from each field isolate during the three tests are presented in
Supplemental Tables S1–S6. Subsequently, all six field isolates were tested using the aforementioned six settings with individually exchanged ingredients (batch testing), which resulted in six values per field isolate (a total of 36 values for all field isolates), and the deviations from the mode MIC were determined. Based on the mode MIC, the exact and essential MIC agreements were calculated. For field isolates, the CLSI document M23 dictates an essential MIC agreement of ≥90% to evaluate whether a broth medium is suitable [
34].
The exact MIC agreement ranged from 42% (gentamicin) to 92% (tilmicosin). The essential MIC agreement, however, ranged from 78% (gentamicin) to 100% (enrofloxacin, marbofloxacin, clindamycin, tiamulin, doxycycline, tetracycline), with a mean essential agreement of 96.3% (
Table 7).
With mean essential agreements of 99.62% (
M. hyorhinis DSM 25591 testing/
Table 3), 97.22% (
M. hyorhinis DSM 25591 batch testing/
Table 5), and 96.3% (field isolates of
M. hyorhinis, batch testing/
Table 7), the modified Friis broth, as presented here, proved to be a suitable culture and test medium.
Since mycoplasmas are generally very demanding concerning their culture conditions, it is necessary to accept certain difficulties, such as expensive or very complex broth media as well as the extended growth periods, also for AST methods. Several very different agar and broth media have been used over time for AST of porcine mycoplasmas: Friis media [
6,
8,
9,
25], modified Friis media [
15,
25,
37], the commercial Liquid Mycoplasma Medium (Mycoplasma Experience Ltd., UK) [
19,
20,
38], variations of YUS and CMRL media [
30], M media [
14,
36,
39] and KM2 media [
40]. According to the published literature, for
M. hyorhinis and
M. hyopneumoniae, the (modified) Friis broth appears to be the most reliable culture medium so far. The CLSI published a guideline for AST of human mycoplasmas and ureaplasmas in 2011 [
18]. Therein, a selection of
Mycoplasma- and
Ureaplasma-propagating broth media used for AST was listed. One of the employed media, the SP4 broth, was also recommended for animal mycoplasmas by Hannan (2000). This was the reason why the SP4 broth was included in our initial tests, to evaluate its suitability for
M. hyorhinis and
M. hyopneumoniae [
25]. Since our aim was to provide a broth medium for both porcine mycoplasmas, the SP4 broth was not considered, as it did not promote the growth of
M. hyopneumoniae NCTC 10110.
Due to the lack of a standardized methodology, the definition of clinical breakpoints and epidemiological cut-off values has not been accomplished for animal mycoplasmas so far. Therefore, it is not possible to classify field isolates as susceptible or resistant based on the generated MIC values. Ter Laak et al. (1991) and Hannan et al. (1997) suggested breakpoints for several
Mycoplasma species, and subsequent studies usually compared the obtained MIC values with the given data in general [
6,
8,
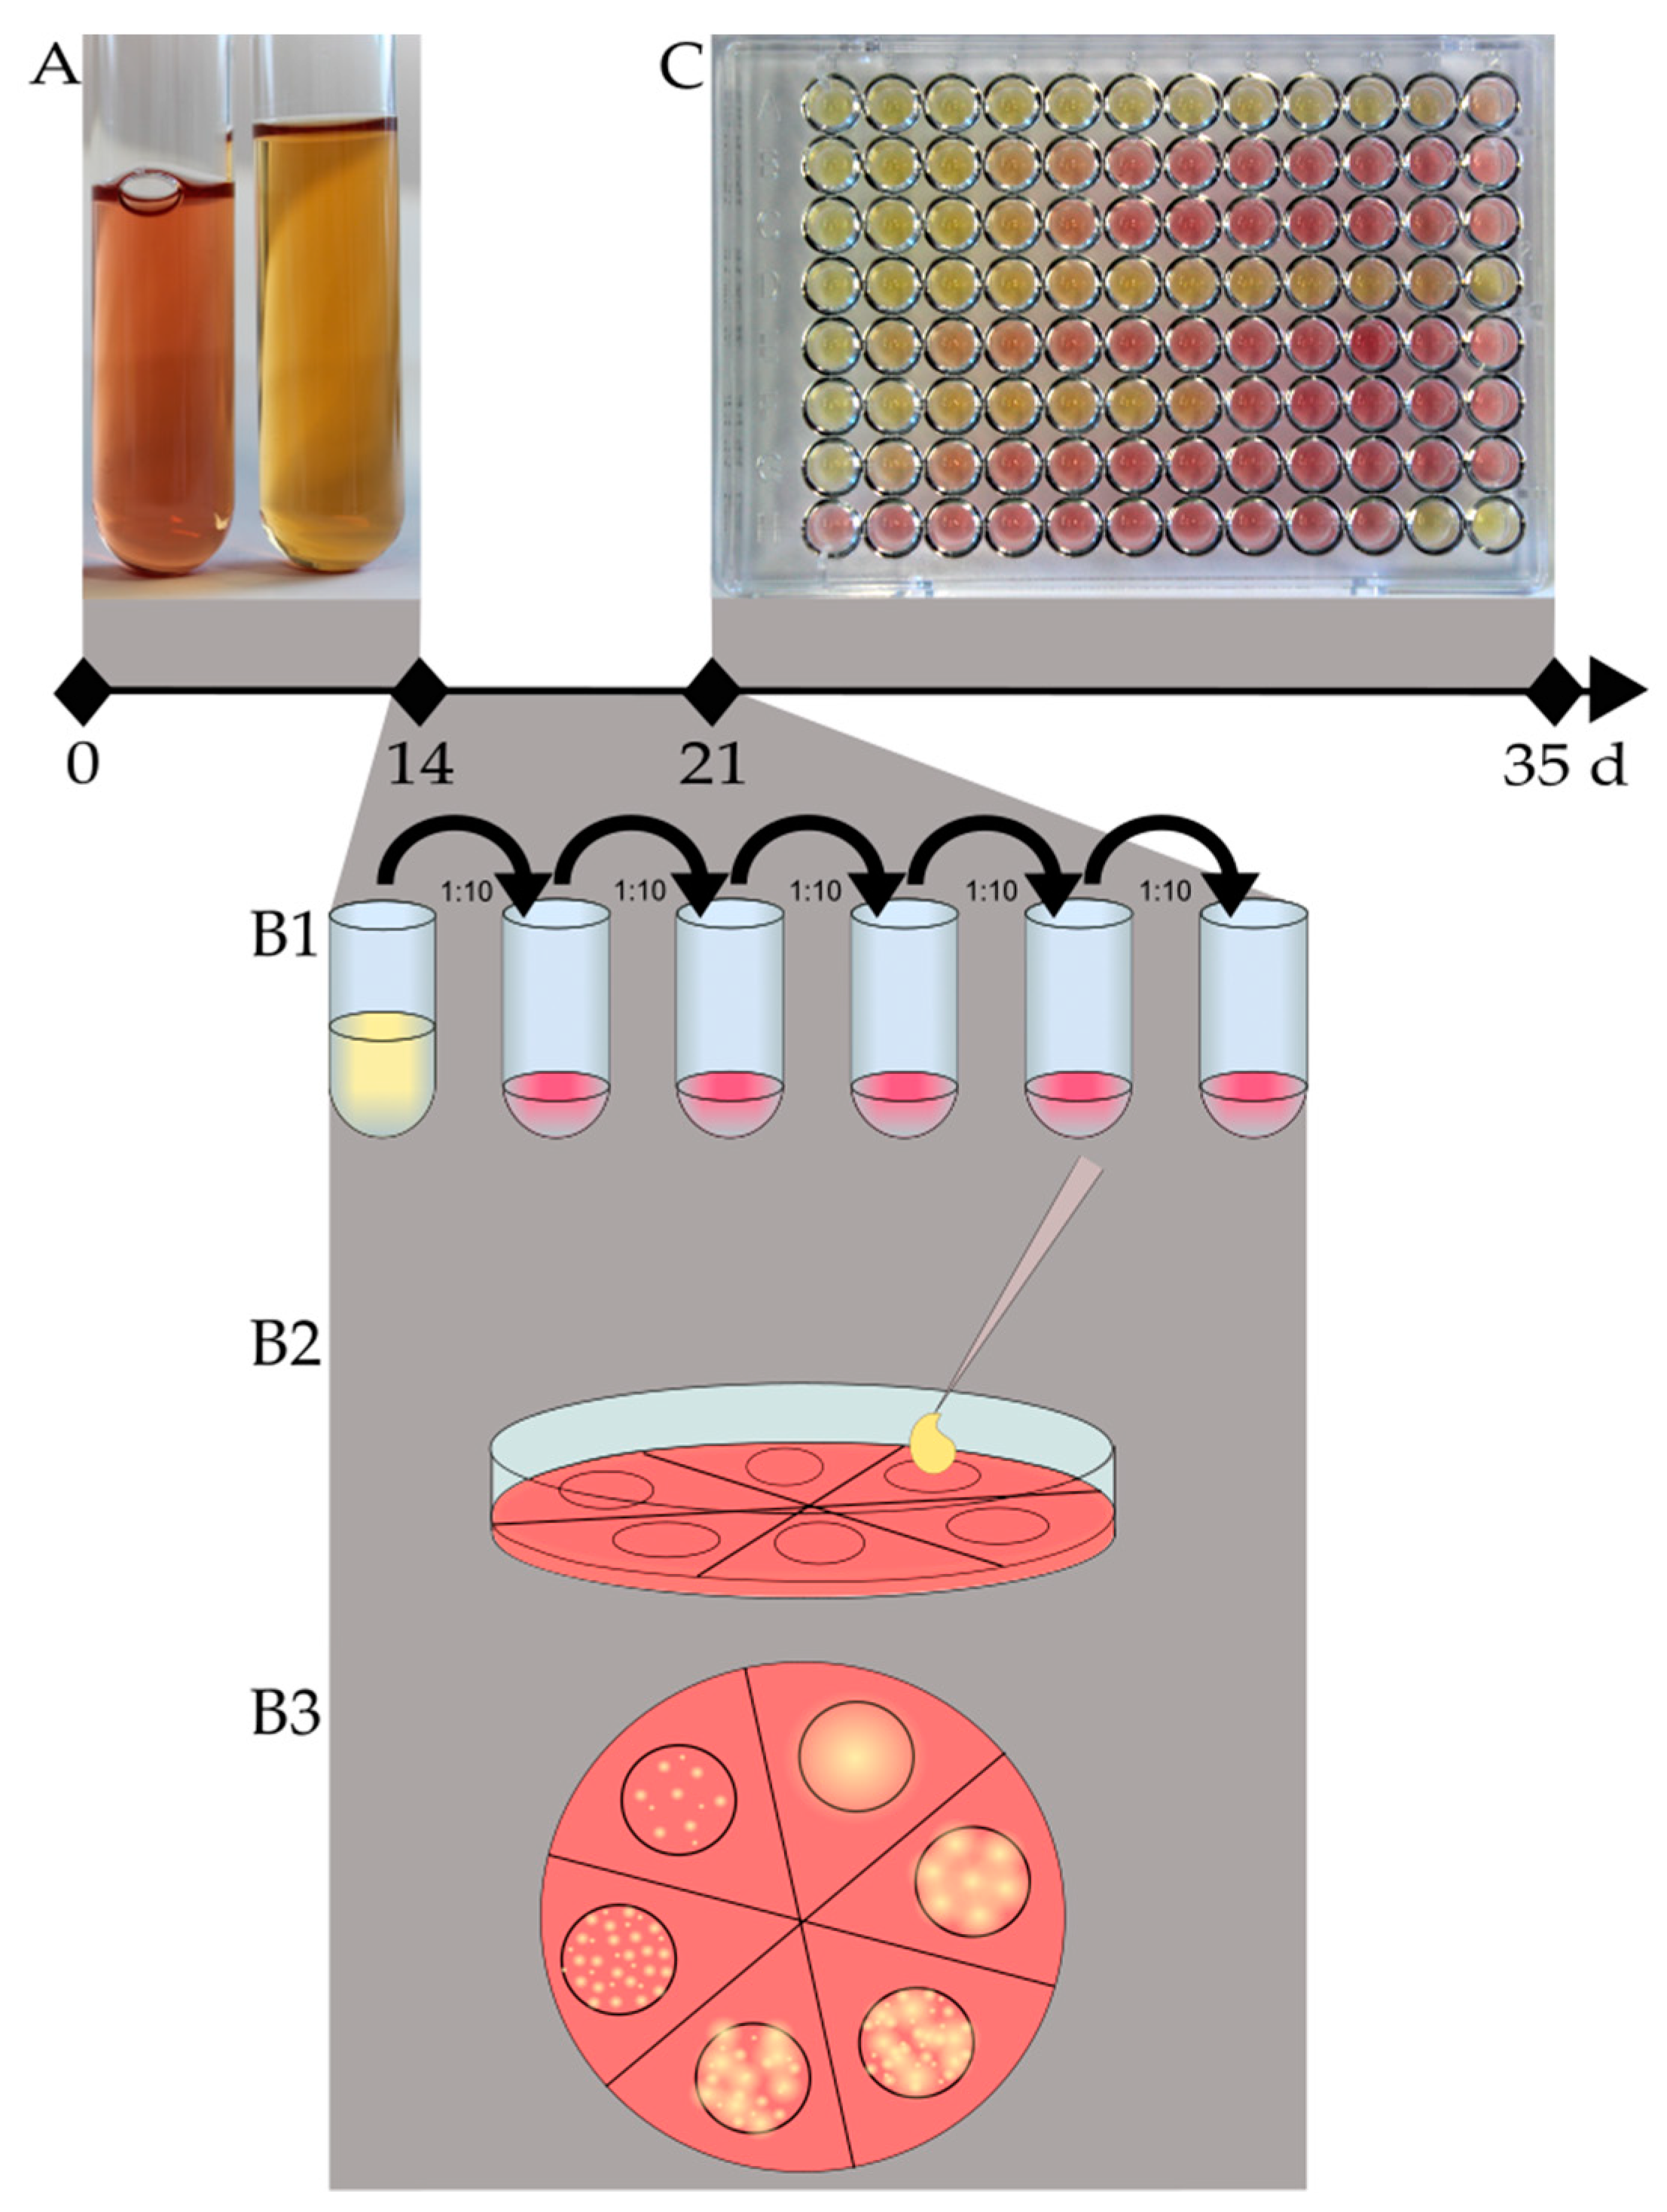
41]. The determination of the actual MIC is difficult, and since almost all mycoplasmas grow without visual turbidity as known from other bacteria, a pH indicator is used. Since
M. hyorhinis and
M. hyopneumoniae are glucose-fermenting mycoplasmas, medium-acidifying metabolites of glycolysis are indicative of growth. Hannan (2000) already stated over 20 years ago that the color change for mycoplasmas with glycolytic activity might be something between orange and yellow [
25]. We further defined the color change as growth (yellow), no growth (red), and trailing (orange), the latter of which was finally categorized as no growth but marked for observational purposes (
Figure 1). The trailing phenomenon is also described, e.g., for enterococci tested with chloramphenicol, erythromycin, or tetracycline in CLSI documents [
42].
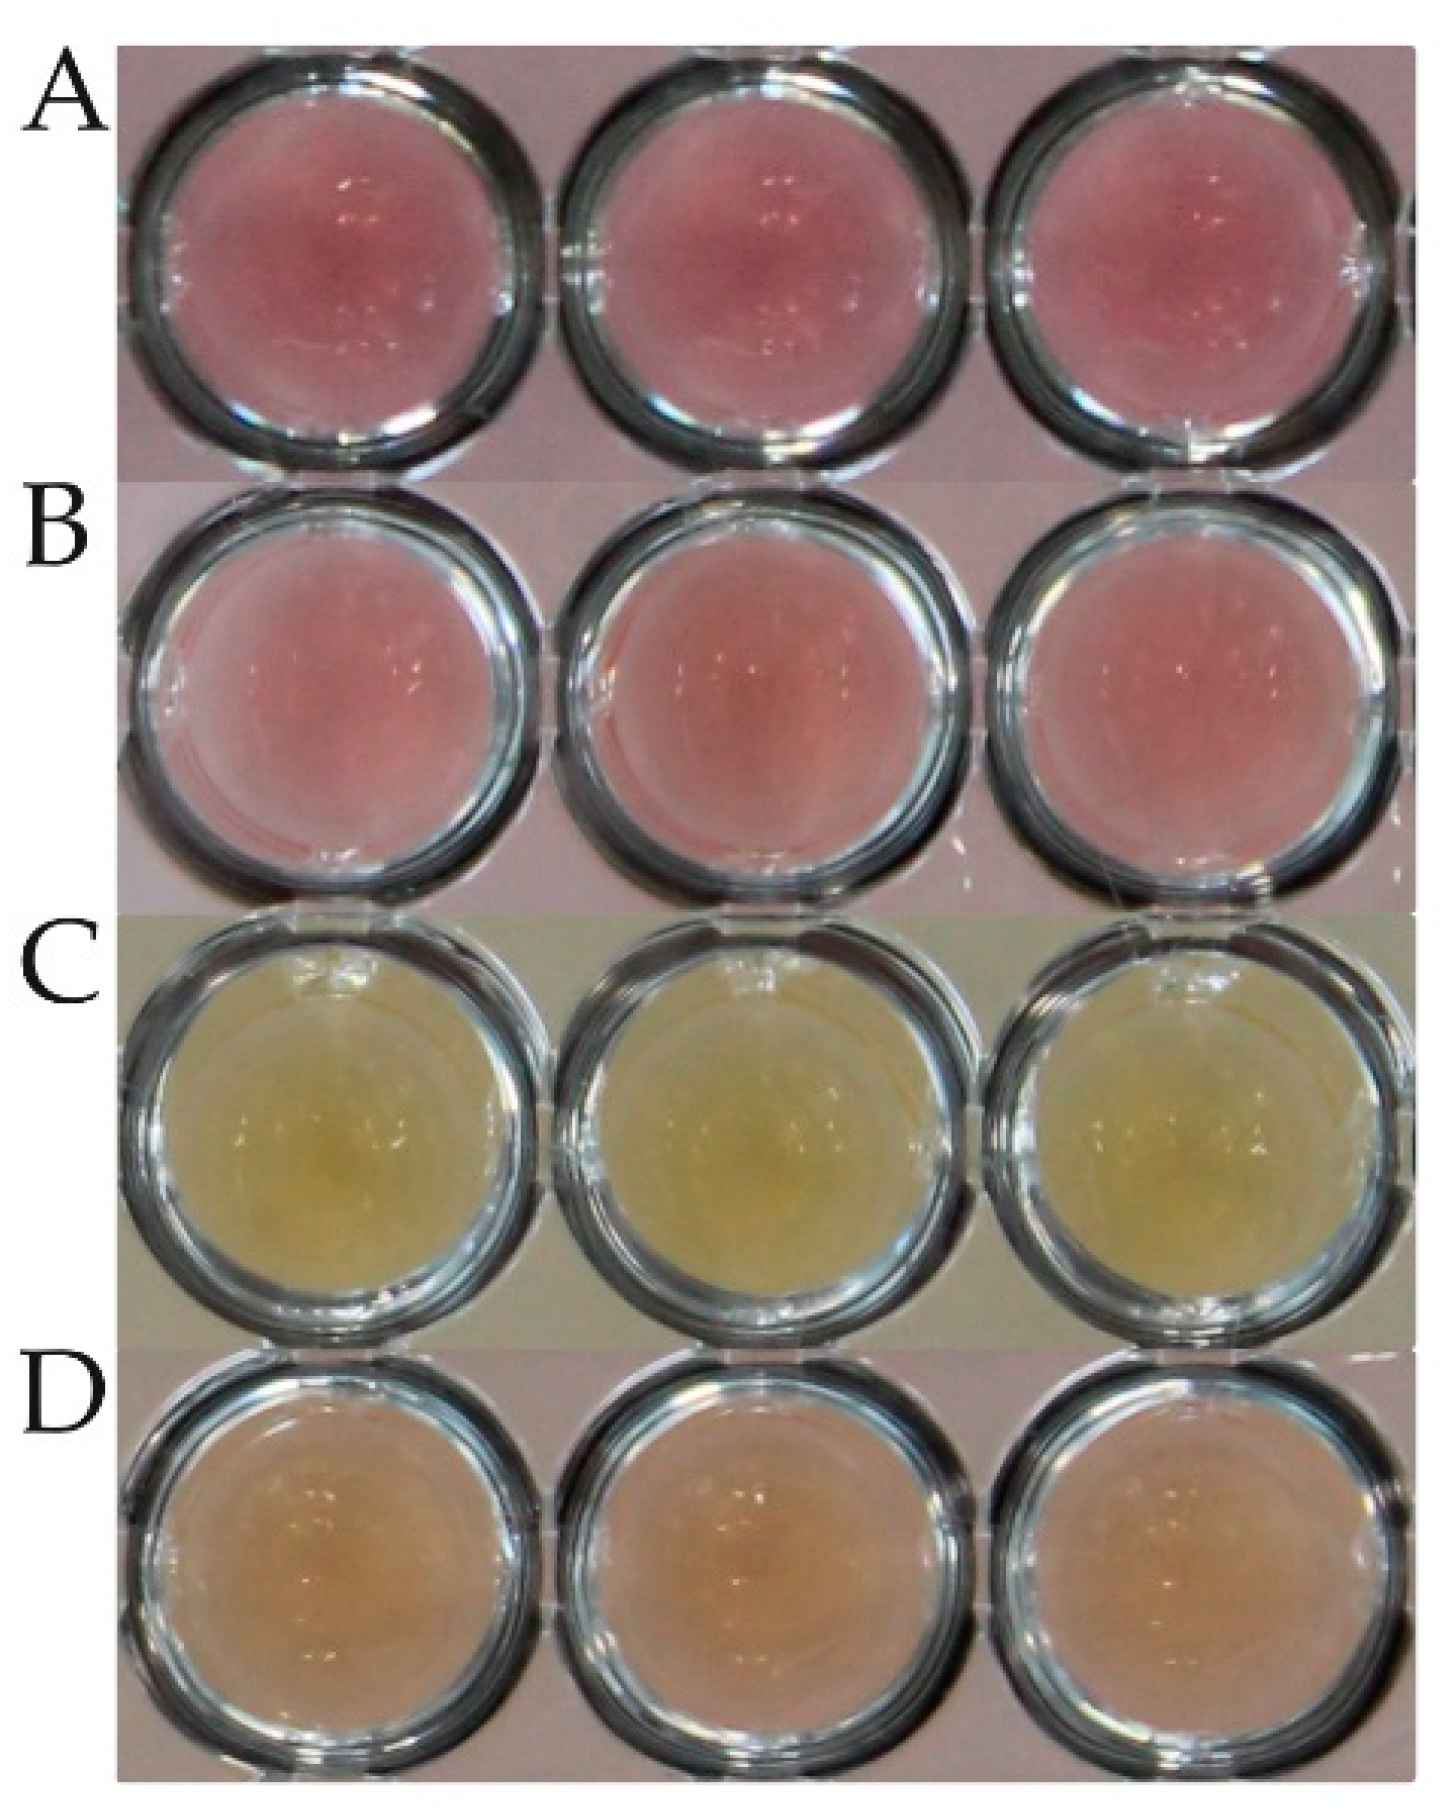
Inter-laboratory comparisons are needed to evaluate potential disagreements between different persons conducting the tests with the same
Mycoplasma isolates. The interpretation of a color change is, next to the age of the substances used in the broth, also dependent on the surrounding light conditions. Admittedly, the evaluation is, in part, a more subjective measurement, especially when evaluating trailing (
Figure 2). A solution to the individual bias in evaluating color changes could be a photometric assay that measures the absorbance at specified wavelengths. The determination of ranges of absorbance that define growth, no growth, and trailing might be a further step in harmonization of this method and making it better reproducible in other laboratories. However, such an approach would be a study on its own in which different wavelengths, different spectrophotometers, and other parameters need to be compared.
The mode MIC deviations of tiamulin in the batch testing data set are mainly due to the fact that the mode MIC falls on the lowest MIC within the observed MICs (
Table 5). This is most unfortunate since, for evaluation purposes, the dilution range should always cover at least one additional dilution step above and below the mode MIC. During the initial tests, this requirement held true. We argue that the MIC agreement for tiamulin within the batch testing is, therefore, slightly skewed, leading to a lower essential agreement percentage, though still falling within the acceptable spanning range of a maximum of three to four dilution steps in total. In general, tiamulin is stable under neutral and acid conditions [
43]. The differing protein and electrolyte content within the different media components, however, might slightly influence the efficacy of tiamulin in our setting, explaining the slight difference in the resulting MIC values.
For the decreased essential MIC agreement of the field isolates testing with gentamicin, we consider the low number of tested isolates as a possible factor. The replicates of the type strain
M. hyorhinis DSM 25591 gave solid results within two to three dilution steps, whereas the MIC values of repeated testing resulted in a 50-50 distribution; only the individual ingredient exchange resulted in the spread over three dilution steps. It is described that aminoglycosides might be affected by the change of e. g., pH or cations in the medium [
44]. The observed deviations were not specific to one of the exchanged ingredients. Each of the six described settings was represented at least once among the deviating results.
Although the AST methodology previously used was different between working groups, most still agree on using the type strain of
M. hyorhinis as a reference and for quality control purposes without generally valid quality control ranges [
8,
9,
14,
15,
16,
19,
25,
36,
37,
40]. Due to the variety of broth media used in broth microdilution methods, the resulting MIC values might differ as well. Furthermore, the incubation times differ between studies. Most agree on evaluating the microtiter plates on a daily basis until a color change occurs, whereas others read the plates at more or less fixed time points from up to two to seven days of incubation [
8,
9,
15,
25,
36,
40].
We noticed that for some of the tested antimicrobial agents, such as tulathromycin, tylosin, tiamulin, doxycycline, and tetracycline, the MICs were at the lower end of the test range. Thus, we suggest that specifically designed microtiter plate layouts should be used in future AST of M. hyorhinis, which contain even lower test concentrations for these antimicrobial agents. Such microtiter plates are currently not commercially available but will enable the determination of the lower endpoints of MICs of the aforementioned five antimicrobial agents.
Finally, enumerating mycoplasmas to properly determine the correct inoculum size requires a special methodology. Since liquid cultures lack turbidity, the usually applied McFarland standard, utilizing optical density, is not applicable for mycoplasmas. For this, the method of determining color-changing units (CCU) was established. This method describes a tenfold dilution titration, where the last dilution step, when a color change can still be seen, accounts for the CCU/mL. According to Hannan (2000), CCU and colony-forming units (CFU) can be used synonymously [
25]. Since
M. hyorhinis grows on Friis agar plates, we decided to prepare the inoculum by enumerating the CFU/mL of a grown culture and adjusting the inoculum to a defined bacterial content. In doing so, the inocula were standardized and reproducible.
Although this list of deviations in the methodologies does not mean to be complete, it represents a variety of methodological aspects, which makes it impossible to compare the so far published data. By presenting a standardized way of determining antimicrobial susceptibility data, we hope to reduce the lack of comparability in the future. In agreement with the published literature, the type strain of M. hyorhinis (e.g., DSM 25591, ATCC 17981, NCTC 10130) provided repeatable results and, thus, might be proposed as a future quality control strain.


 ,
, 


