
Application of QSAR Approach to Assess the Effects of Organic Pollutants on Bacterial Virulence Factors
 , ,
, ,
Abstract
:1. Introduction
2. Materials and Methods
2.1. Model Chemical Compounds
2.2. Microbial Activity Tests
2.2.1. Bacterial Strains and Culture Conditions
2.2.2. Bacteria Growth Test
2.2.3. Swarming Assay
2.2.4. Relative Expression of Virulence Genes
RNA Extraction
Real-Time PCR
Quantitative PCR
2.3. Validation of Exposure Conditions to Organic Pollutants
2.4. Structure–Activity Models
3. Results and Discussion
3.1. Collection of Experimental Data
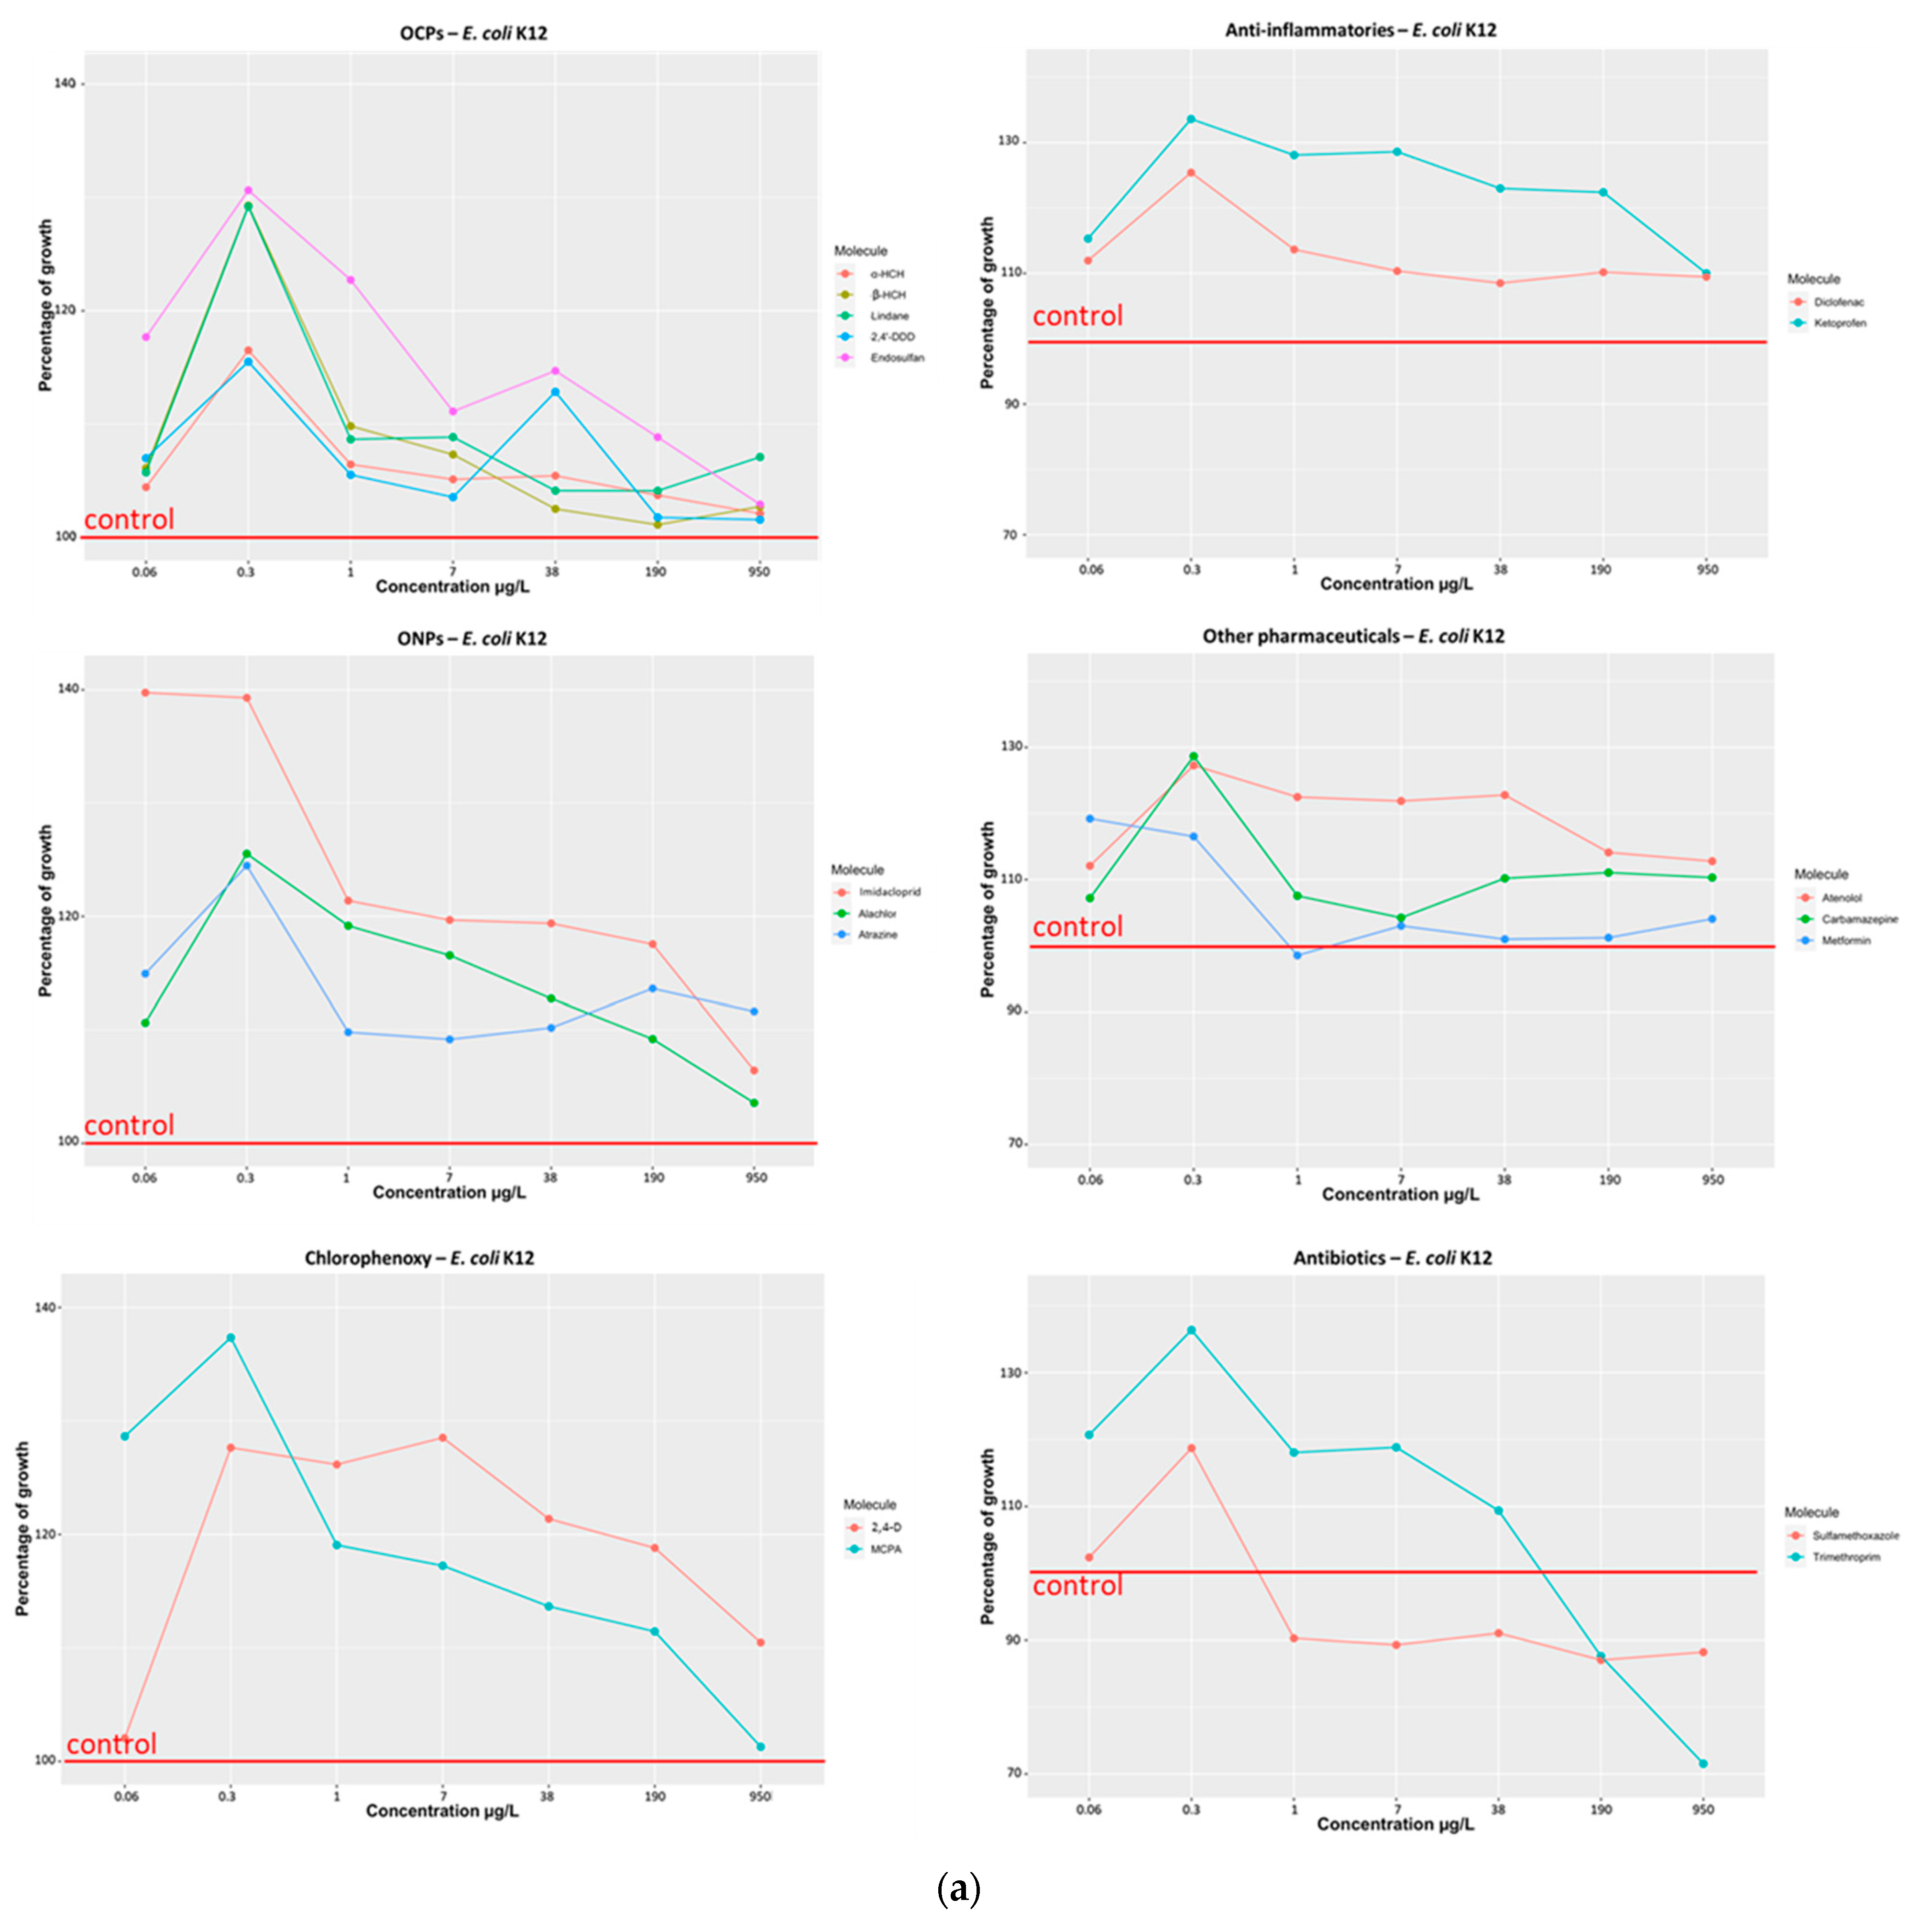
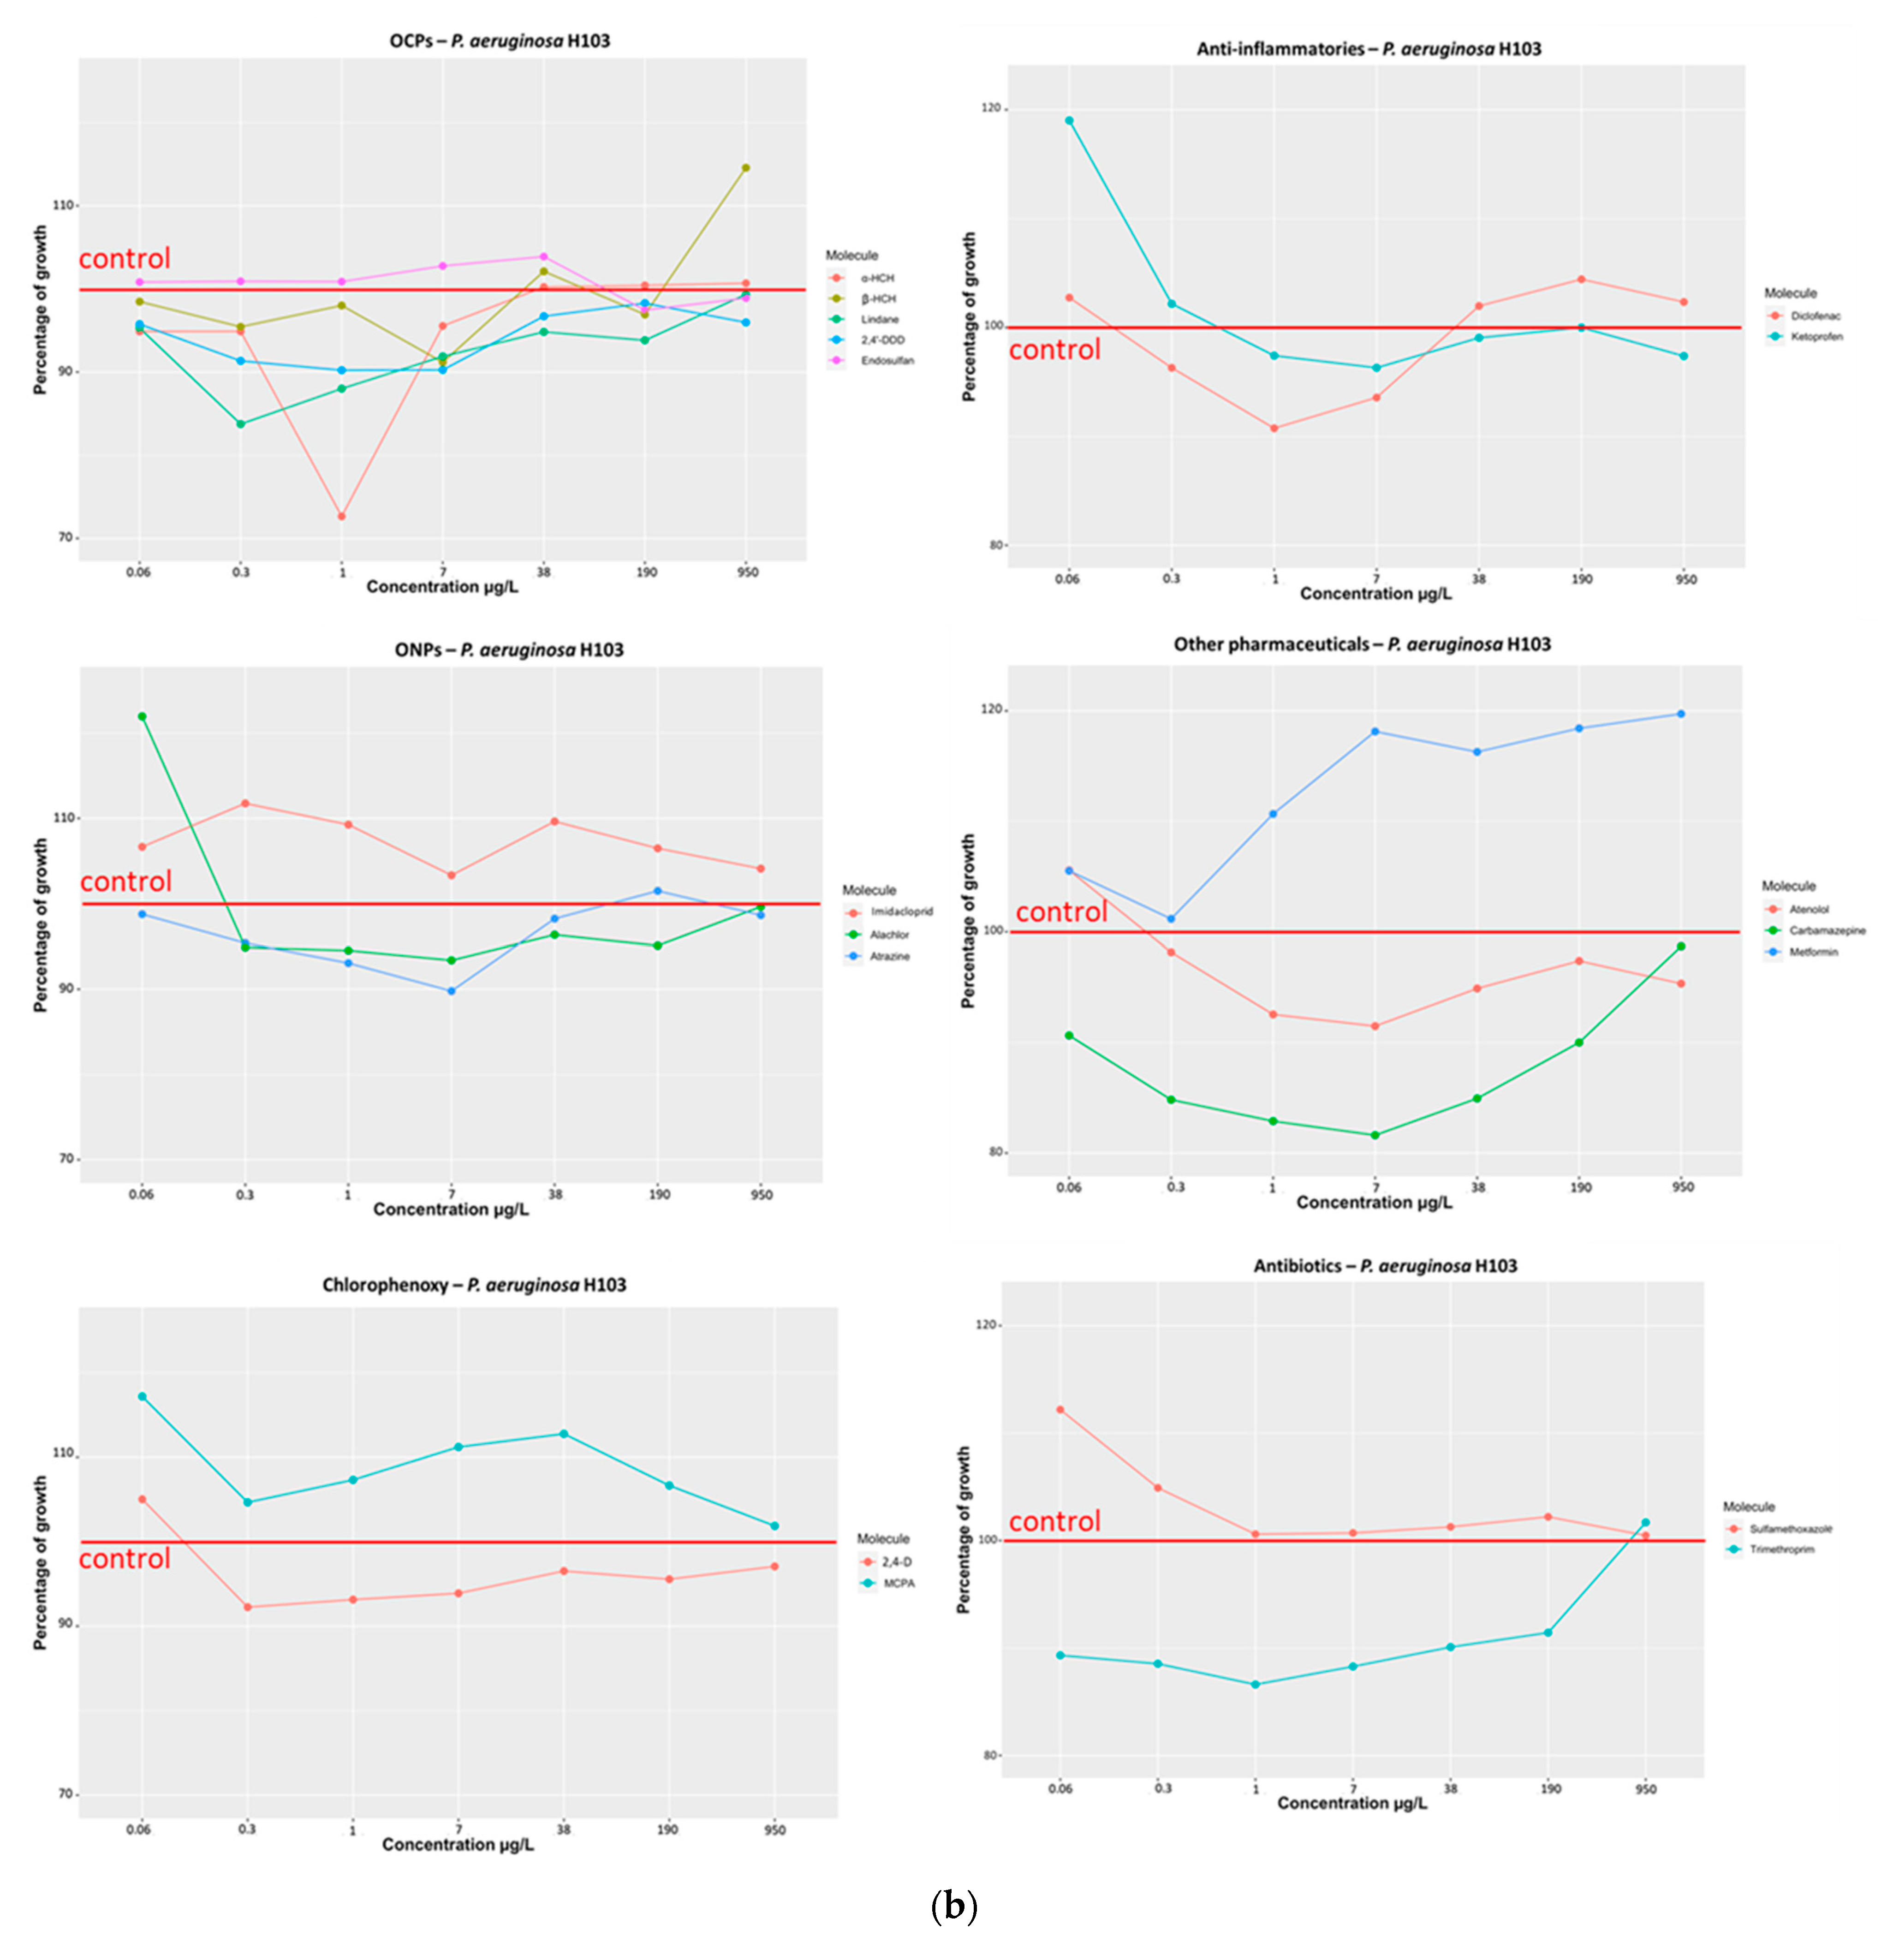
3.1.1. Effect of Selected Organic Pollutants on Bacterial Growth
- (a)
- Organochlorine pesticides (α-HCH, β-HCH, Lindane, 2,4′-DDD, Endosulfan)
- (b)
- Organonitrogen/chlorine compounds (Imidacloprid, Atrazine, Alachlor)
- (c)
- Chlorophenoxy compounds (MCPA and 2,4-D)
- (d)
- Anti-inflammatory compounds (Ketoprofen and Diclofenac)
- (e)
- Other pharmaceuticals (Atenolol, Carbamazepine, Metformin)
- (f)
- Antibiotics (Sulfamethoxazole, Trimethoprim)
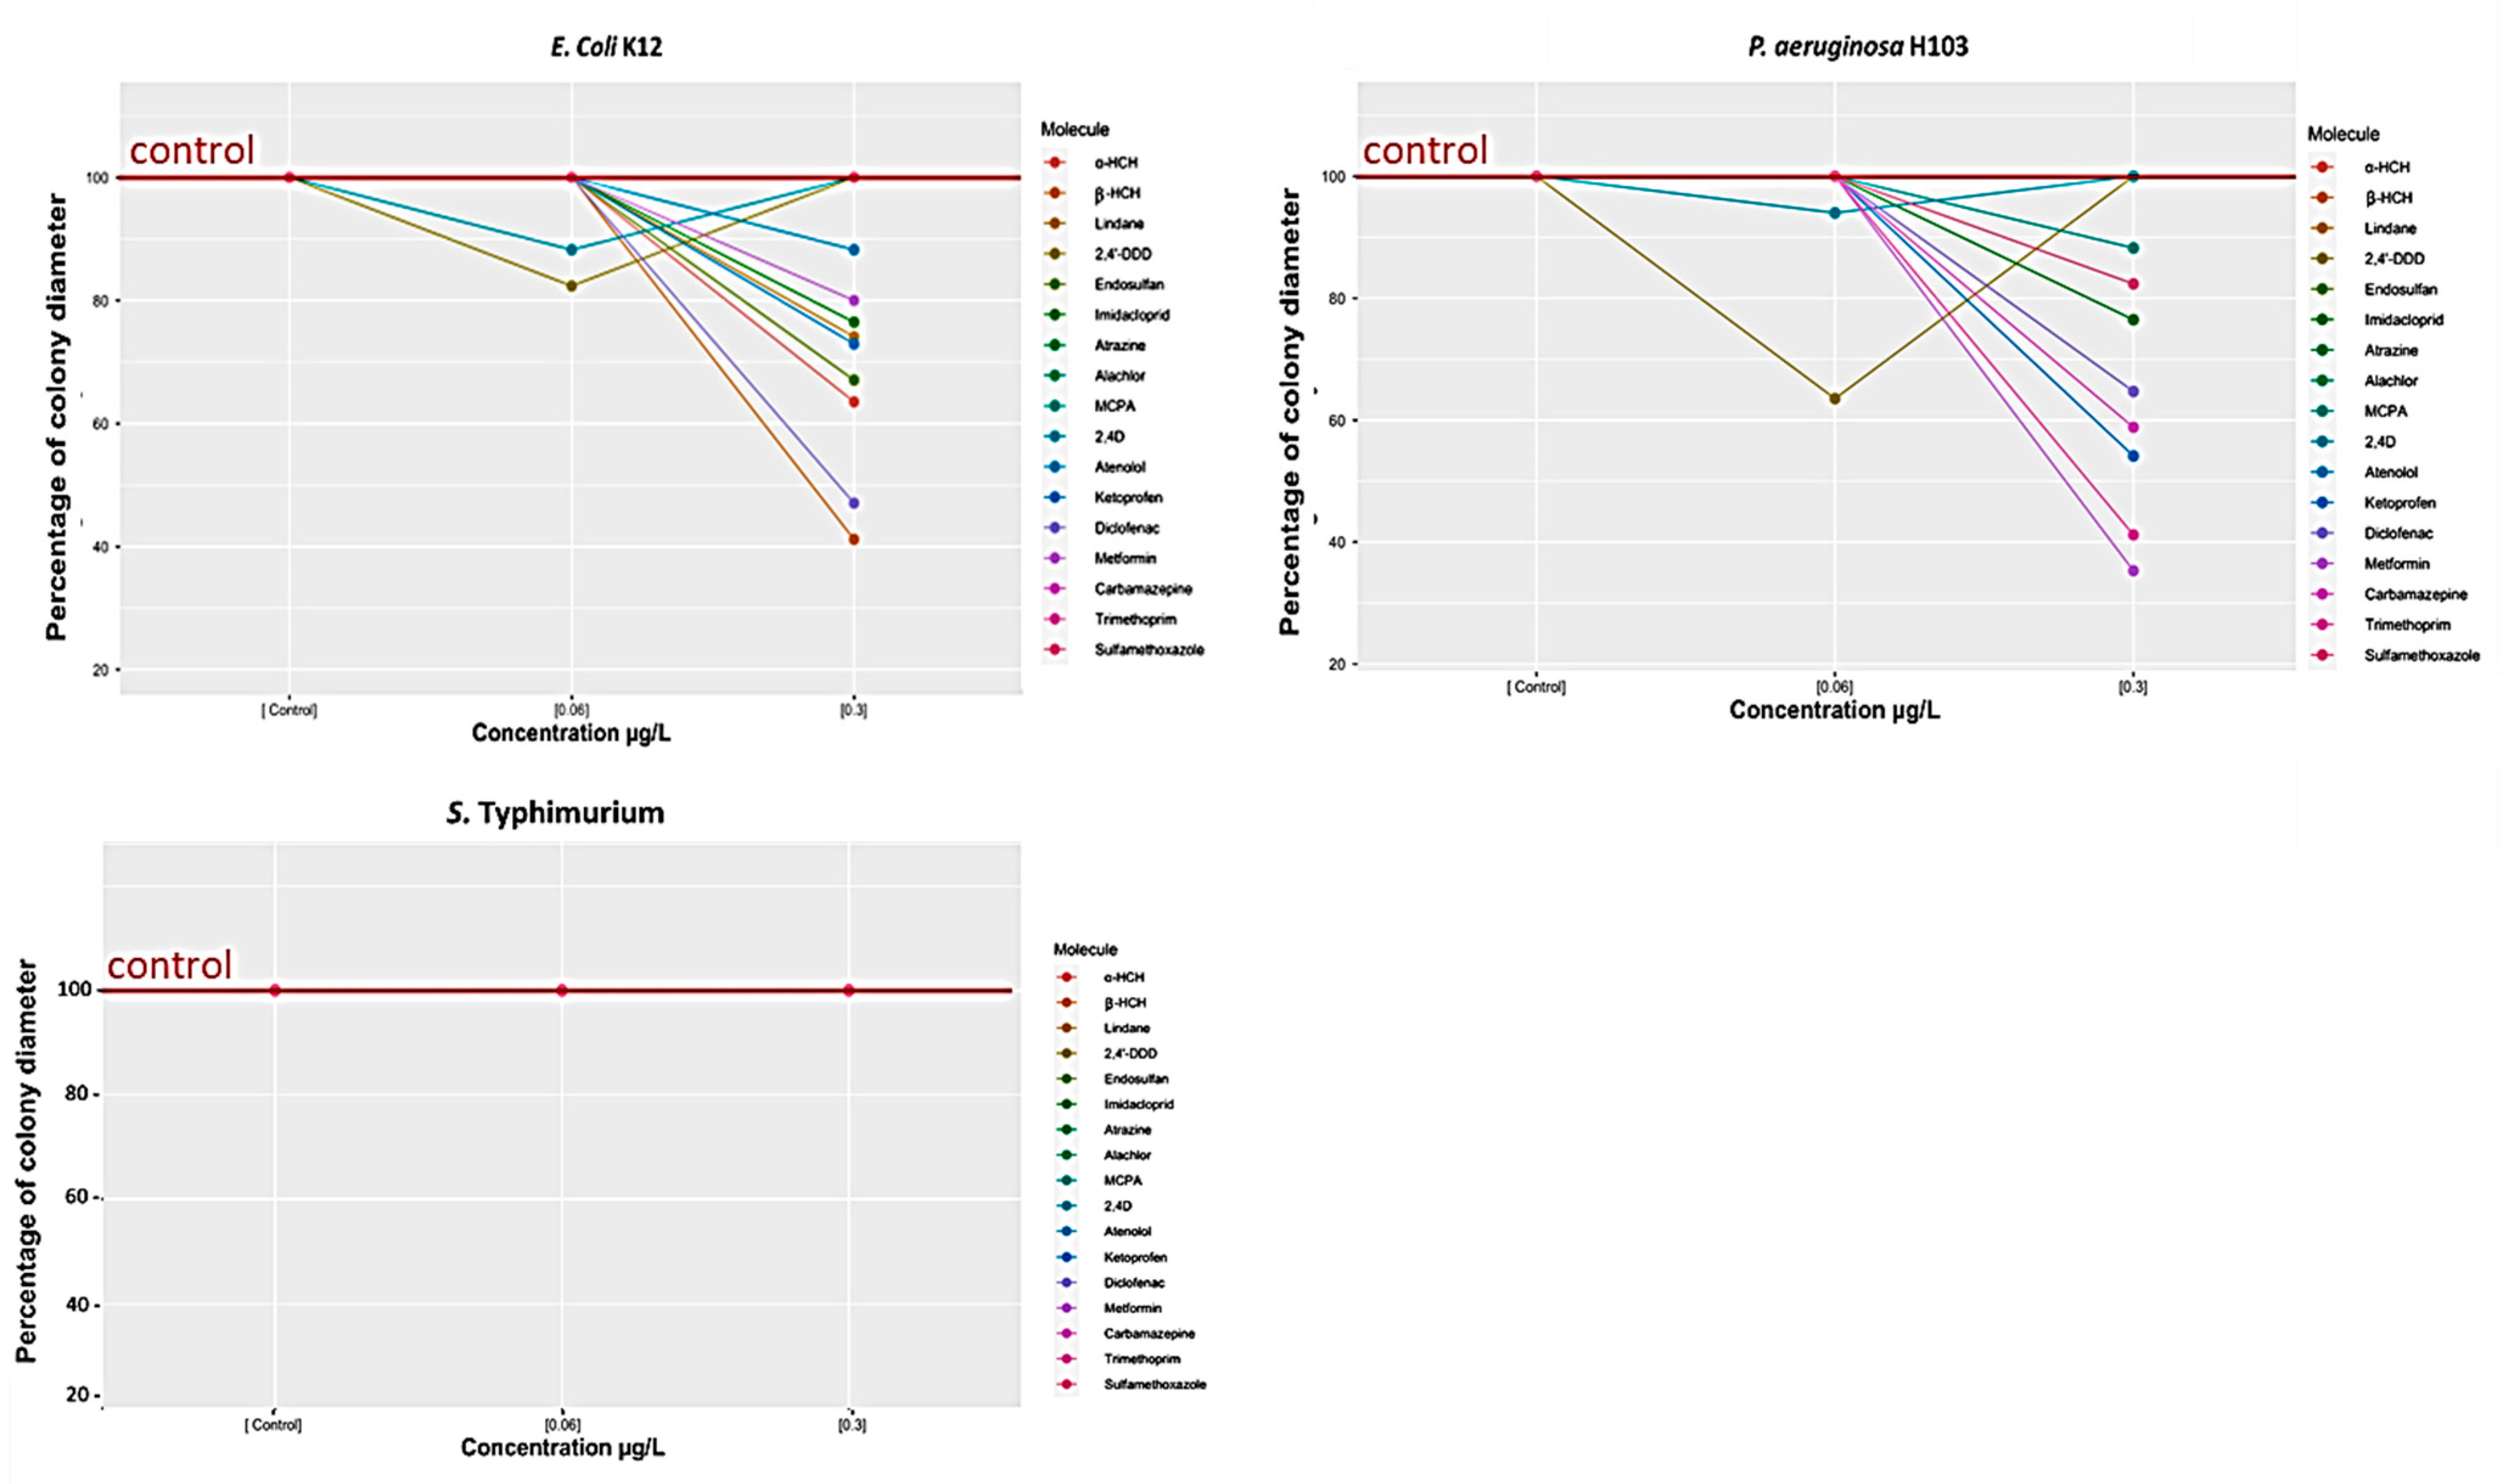
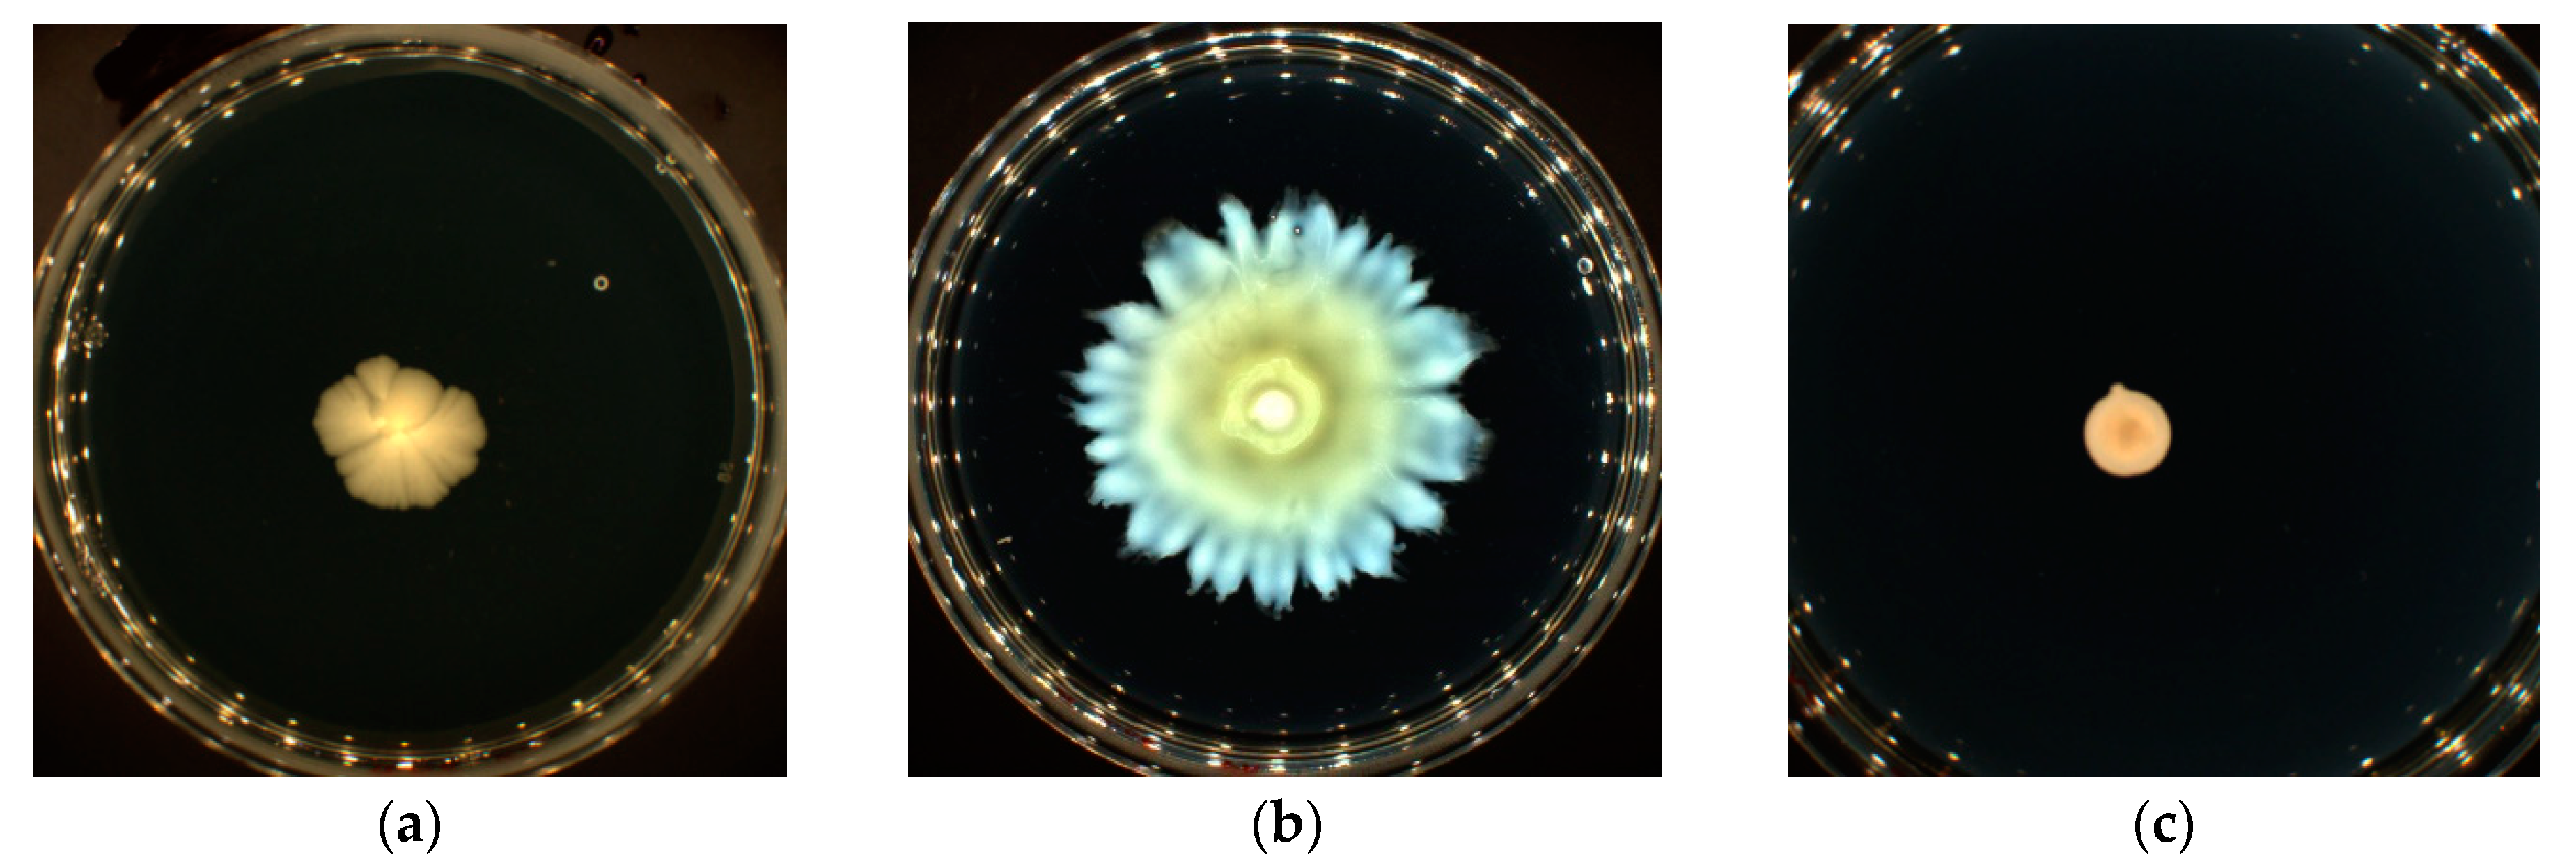
3.1.2. Effect of Selected Organic Pollutants on Bacterial Swarming
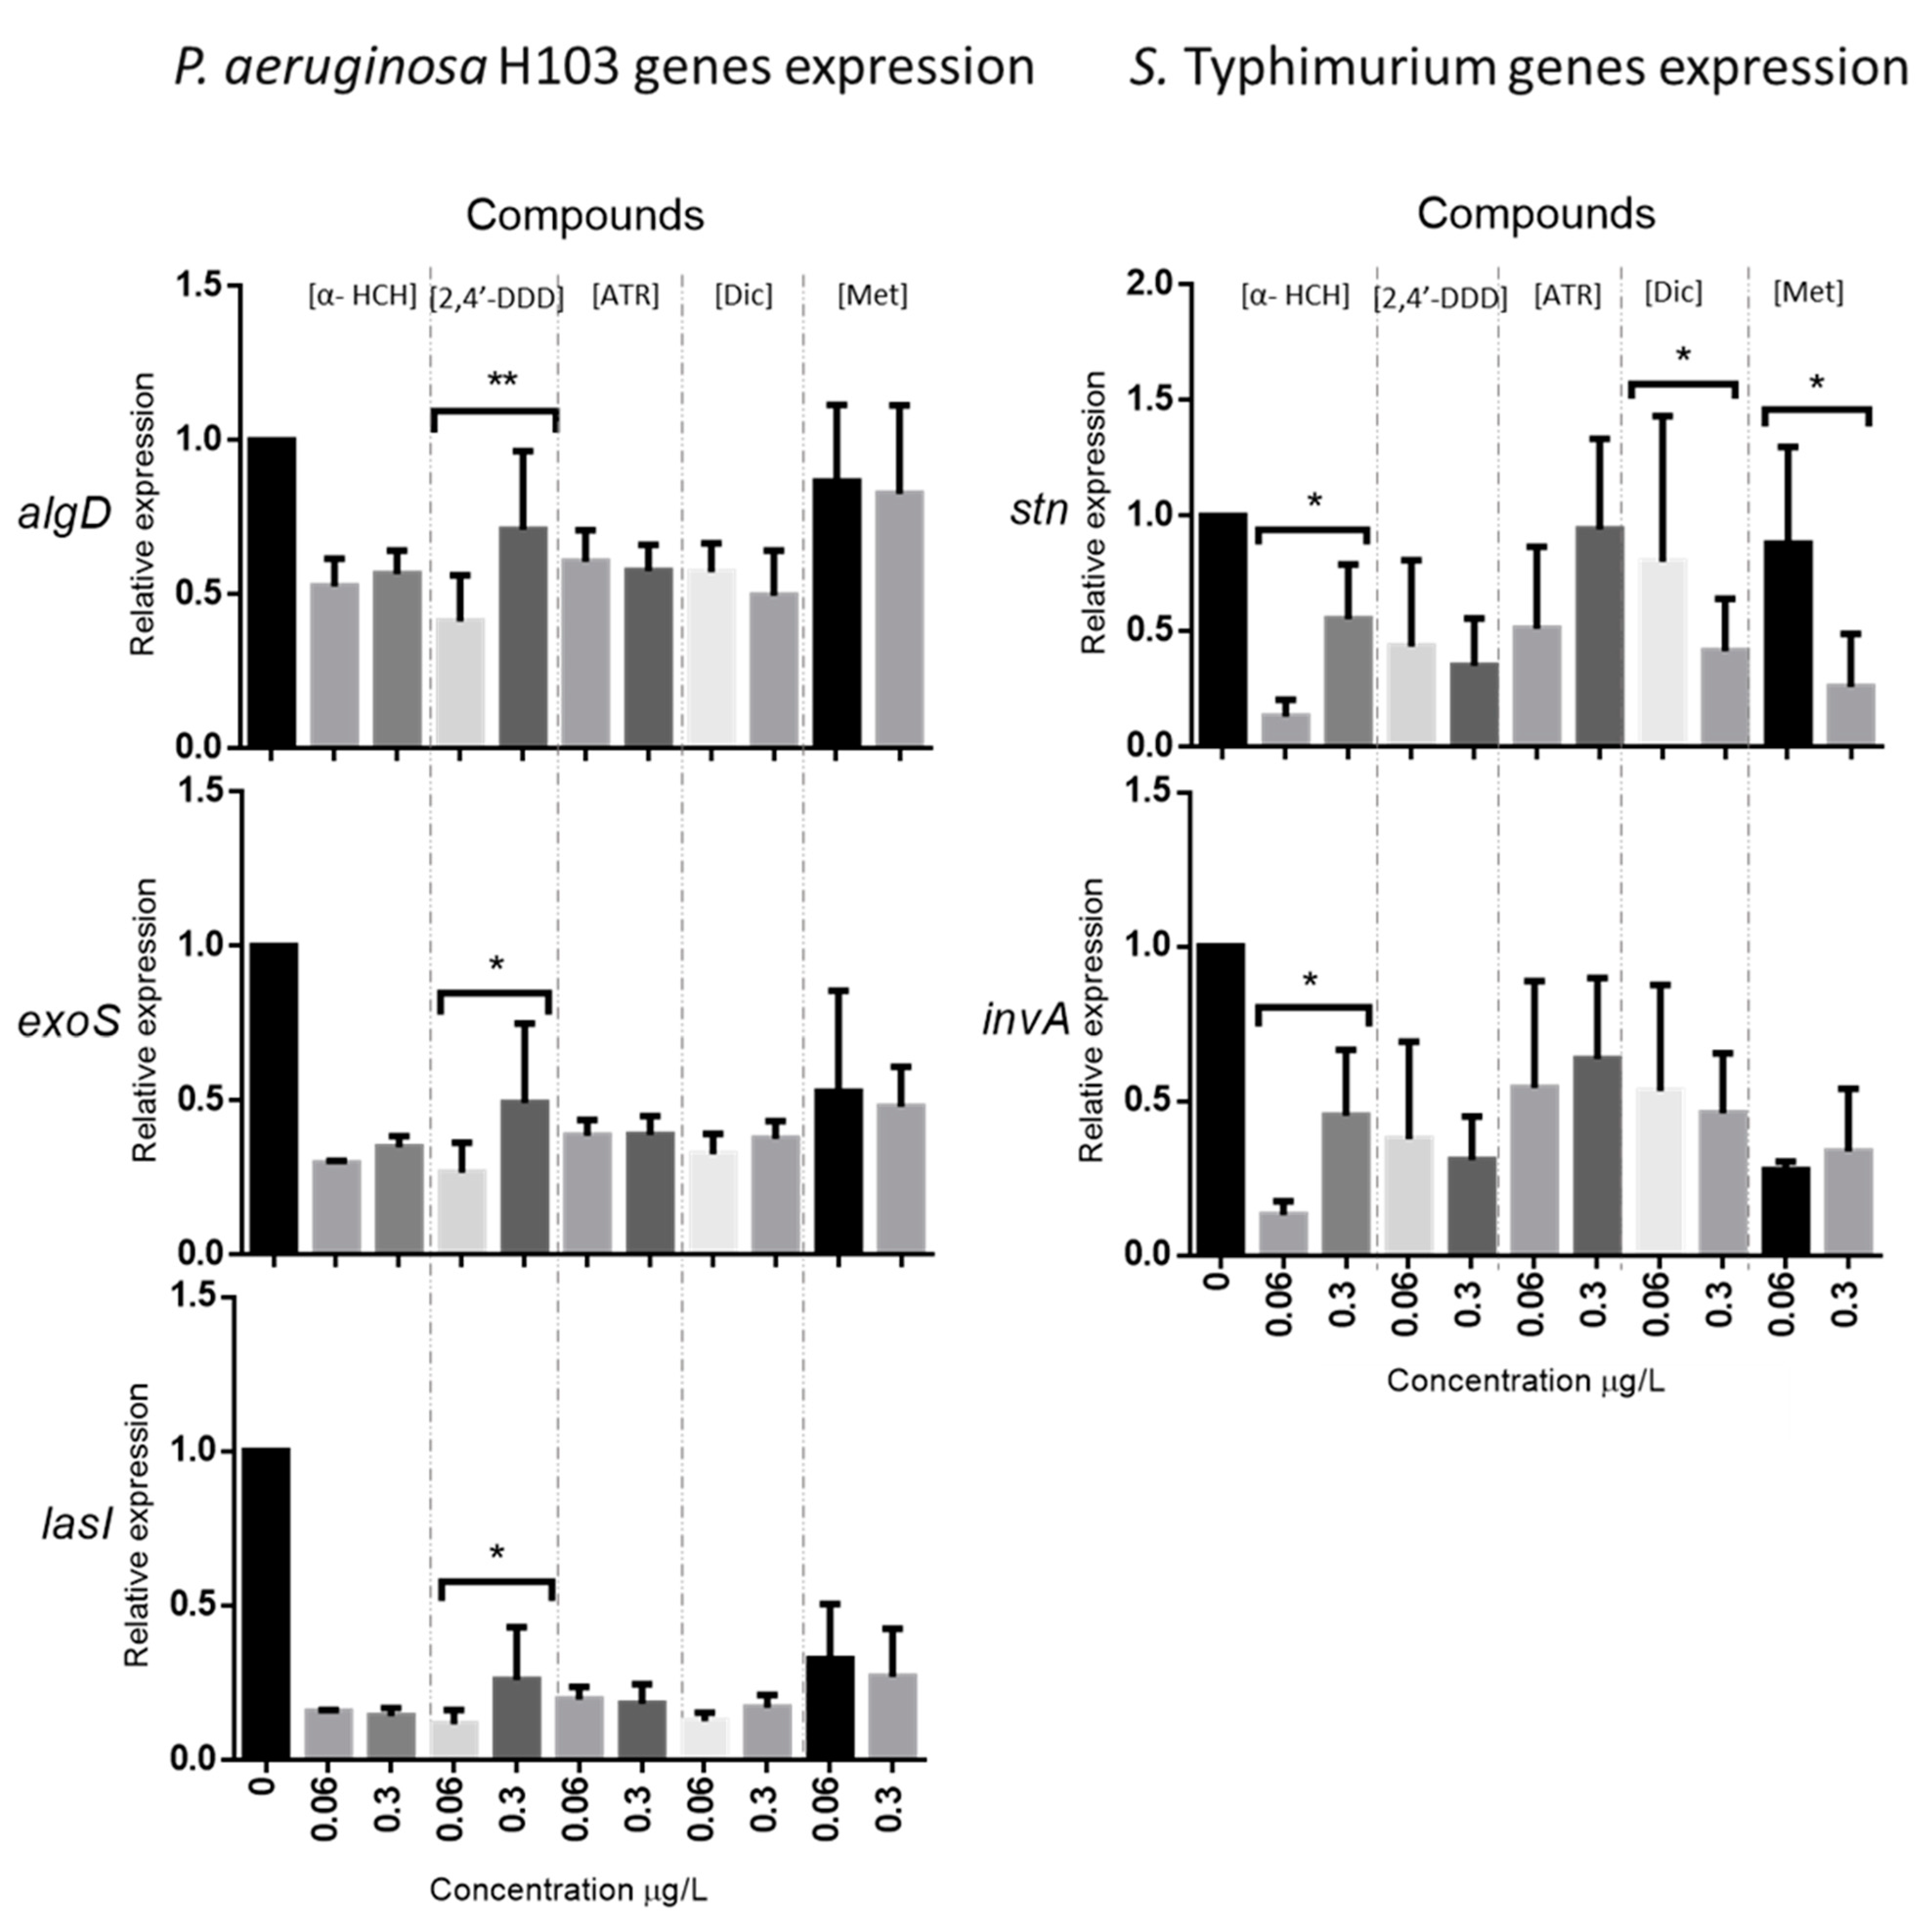
3.1.3. Relative Expression of Virulence Genes after Exposure to Five Selected Organic Pollutants
3.2. Structure–Activity Modelling
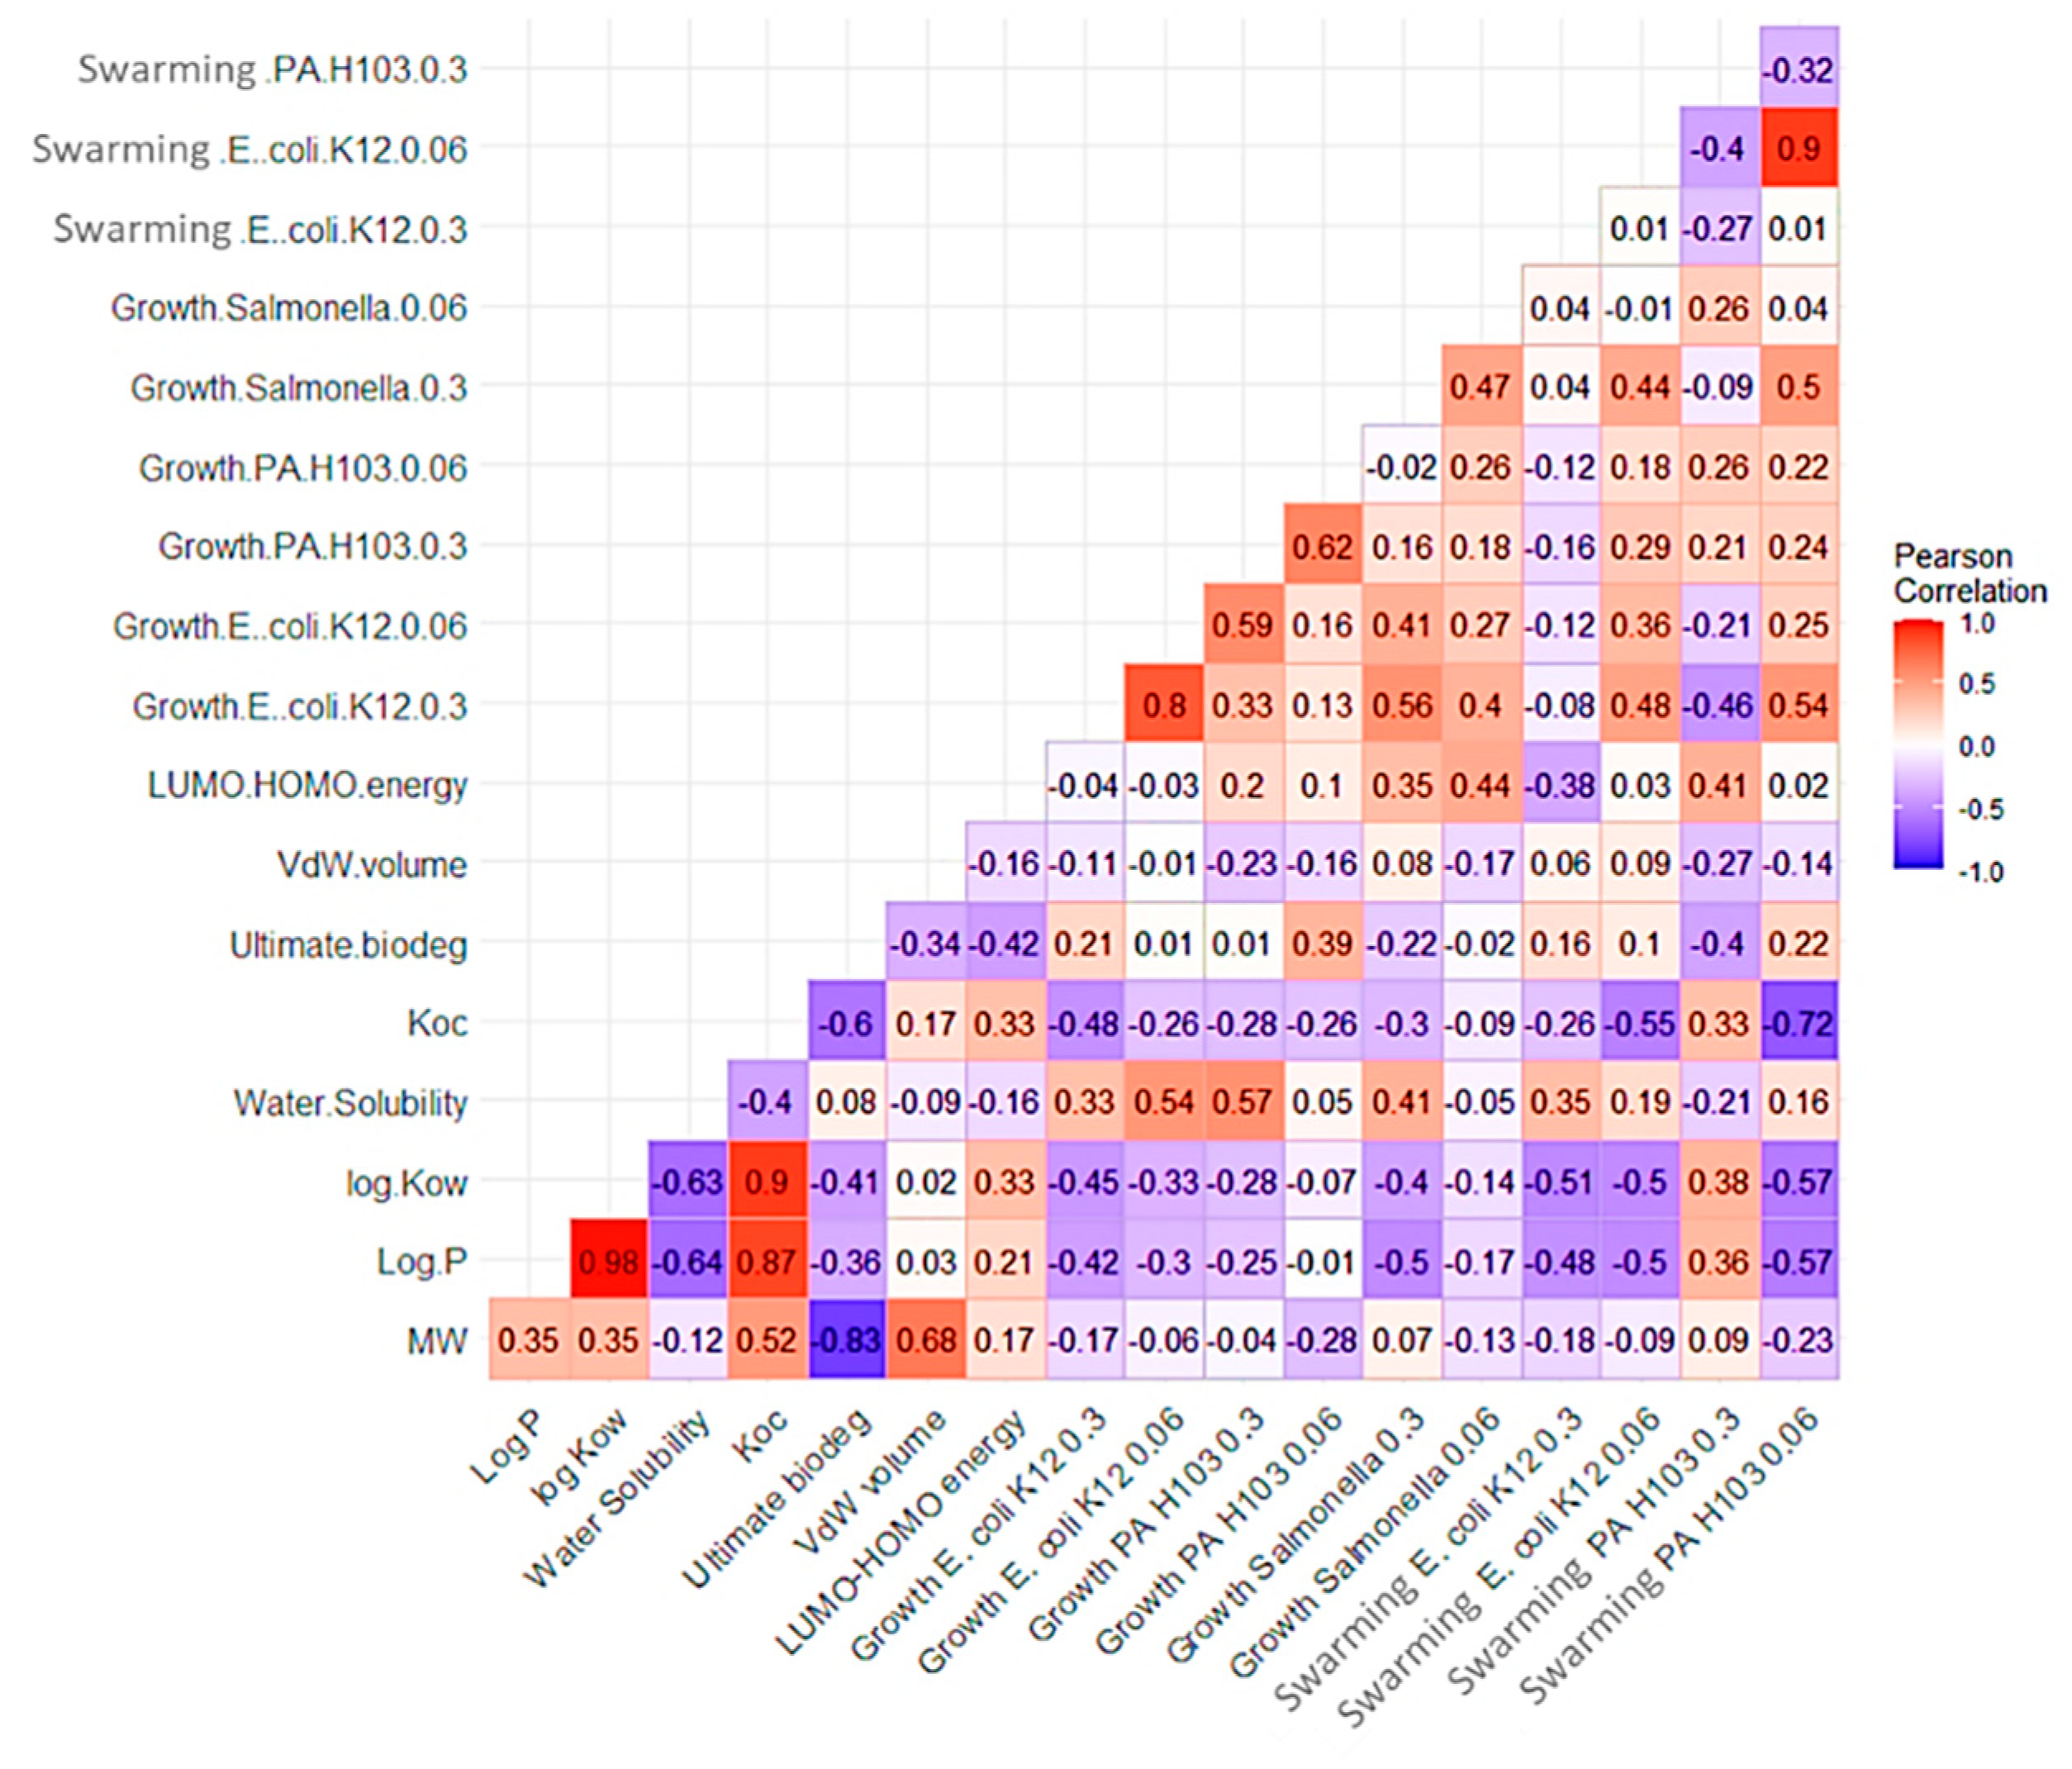
3.2.1. Structure–Properties–Activities Relationship
3.2.2. Structure–Activity Relationship (SAR) Model
- (a)
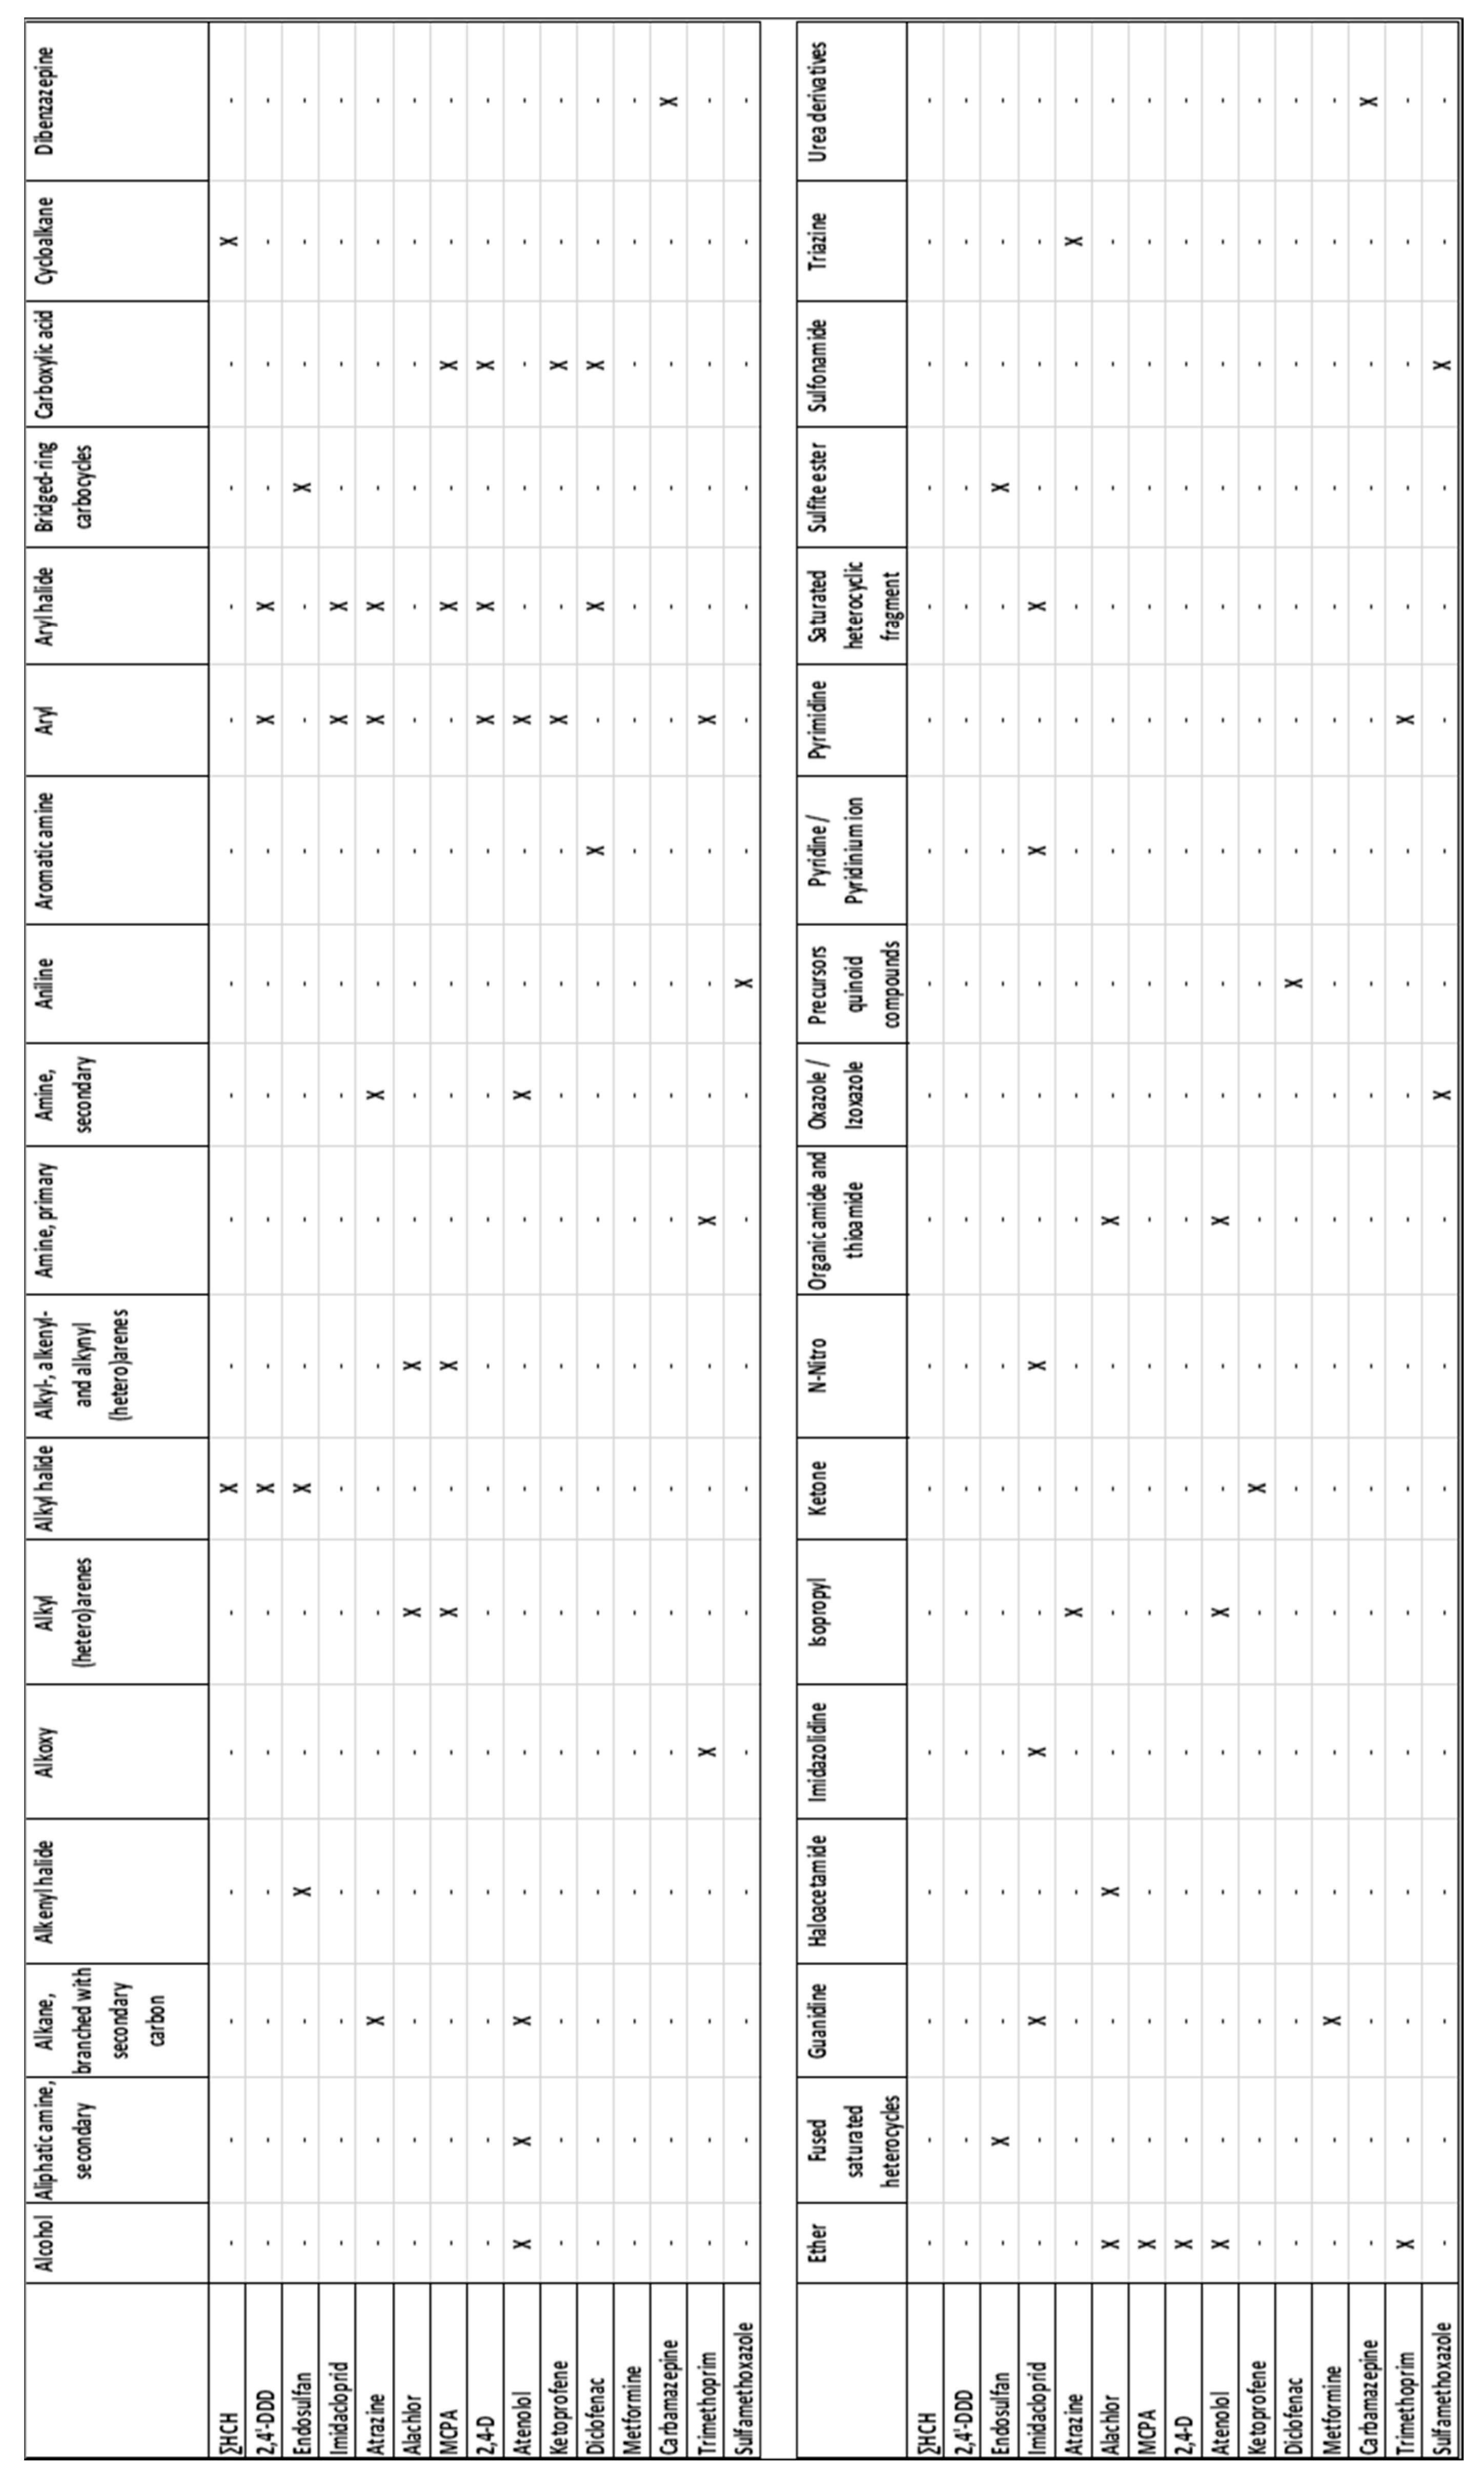
- Determination of chemical structure descriptors
- (b)
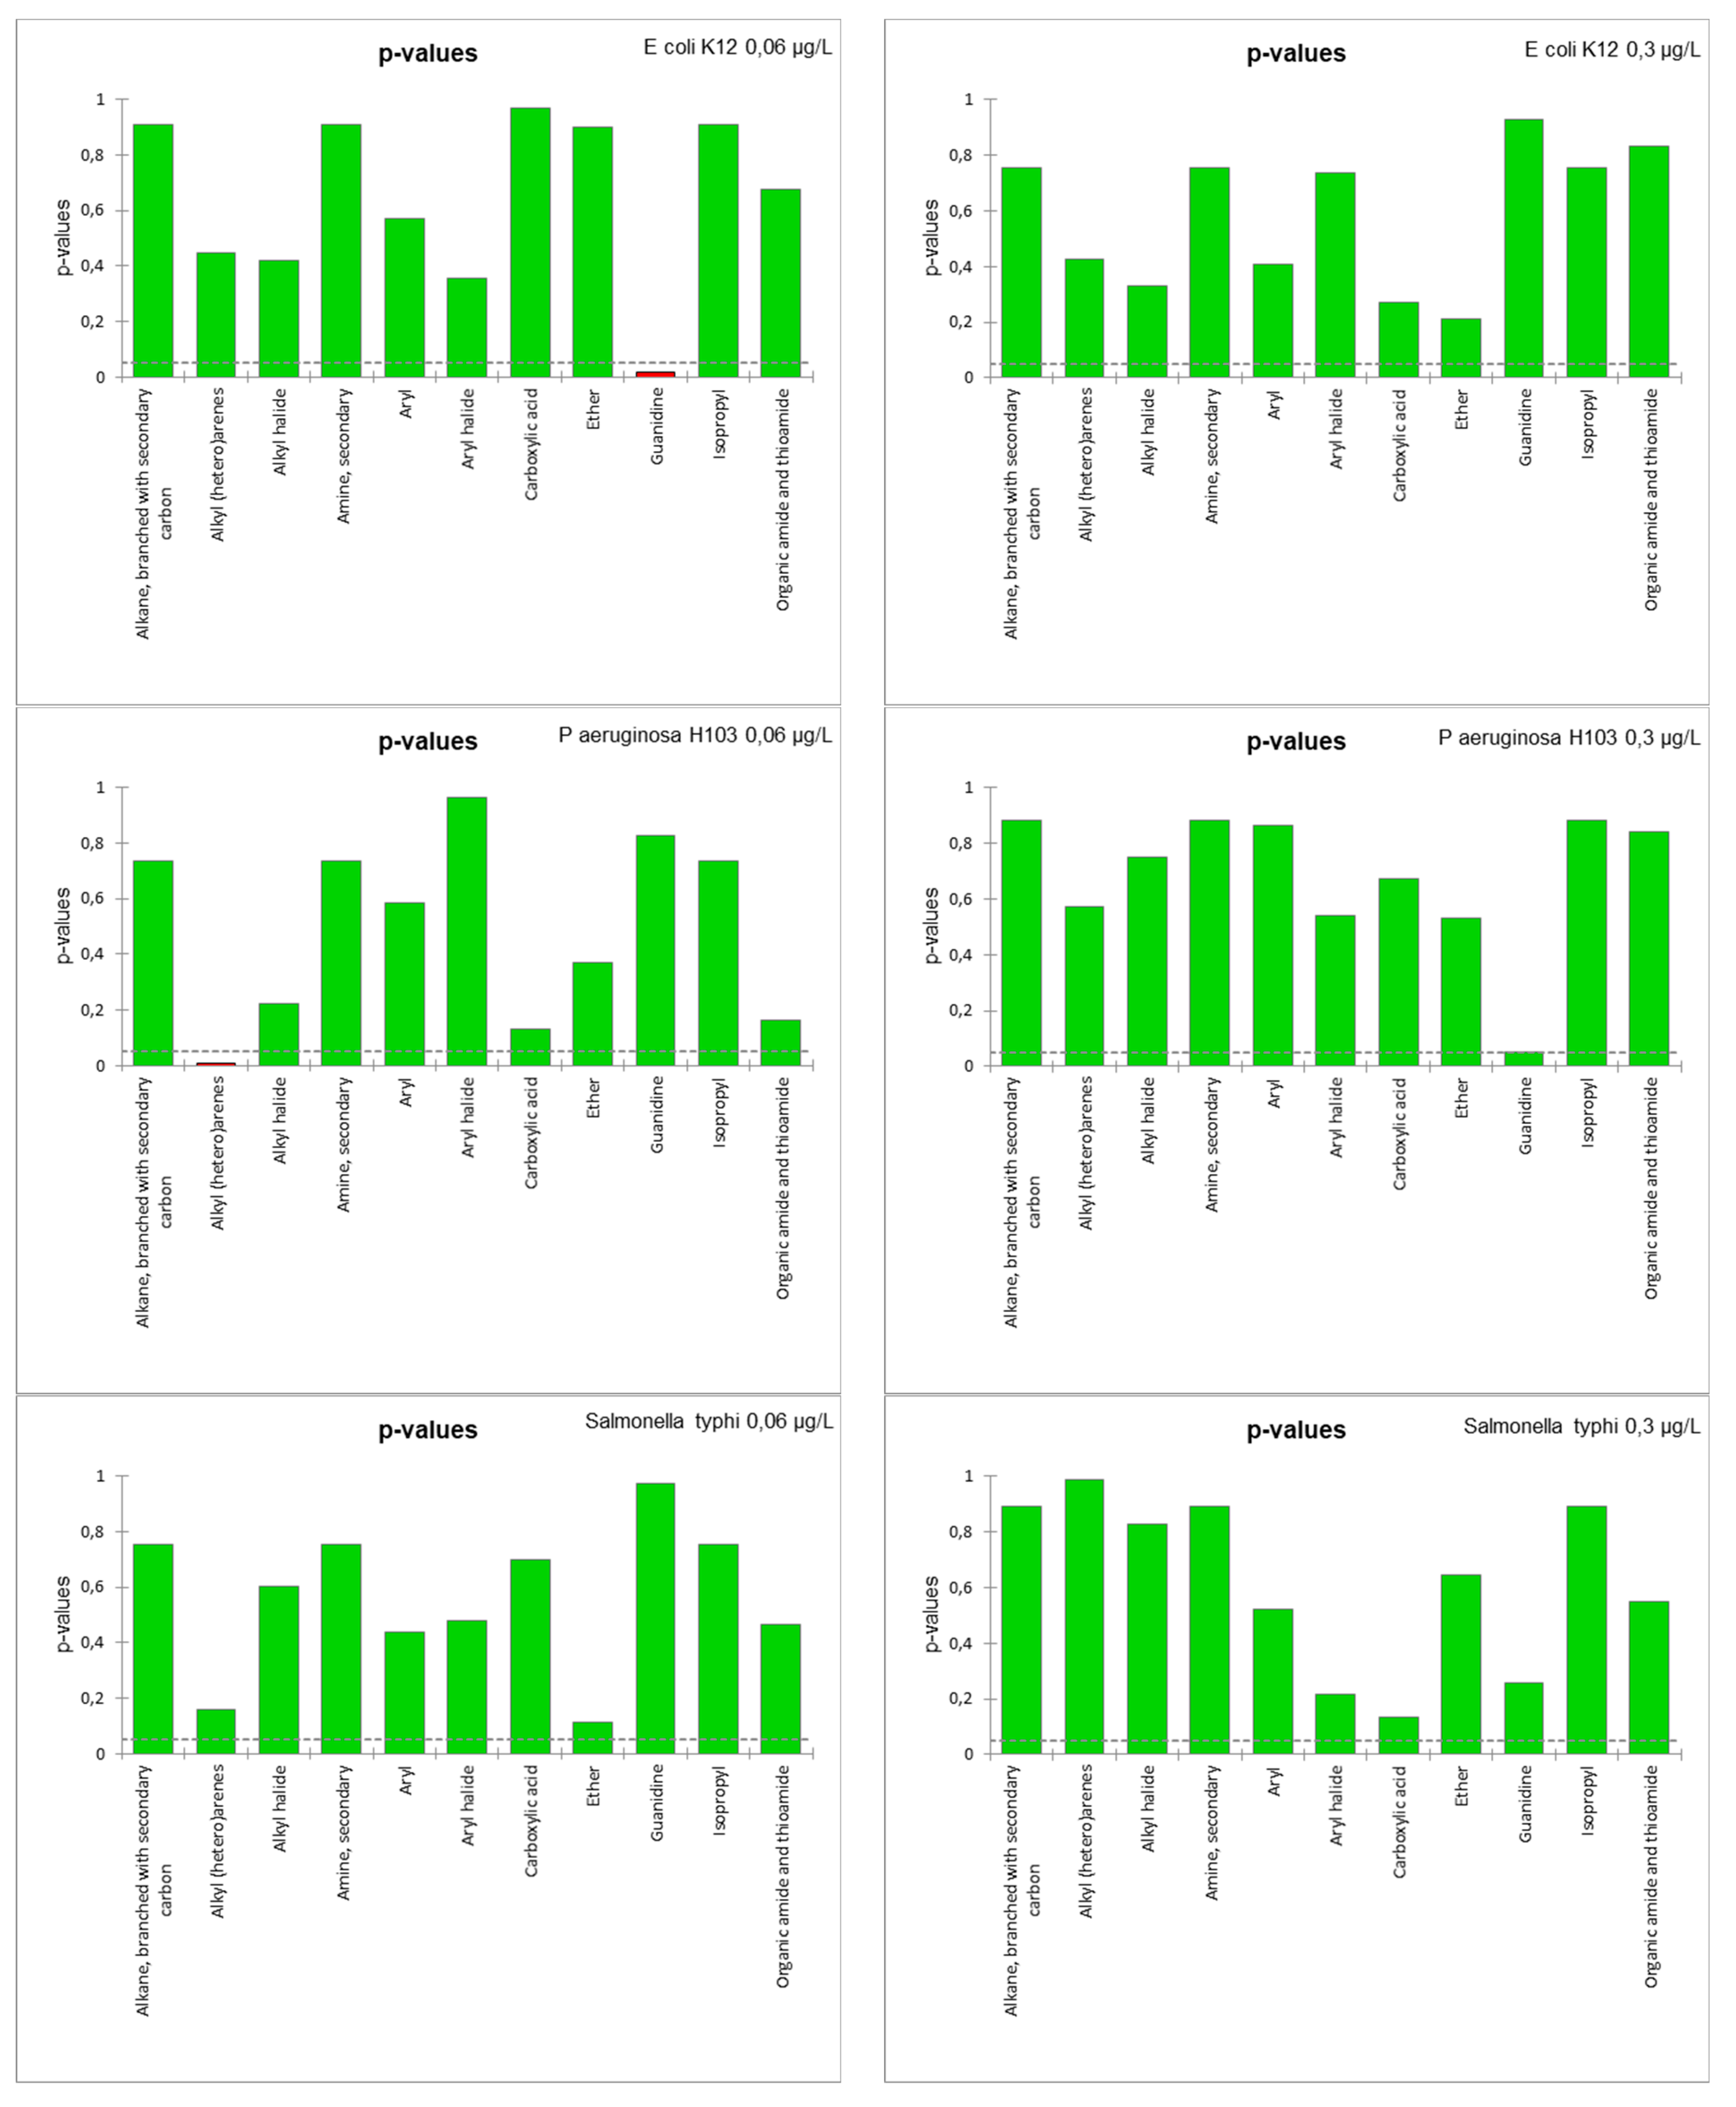
- SAR model for bacteria growth
- (c)
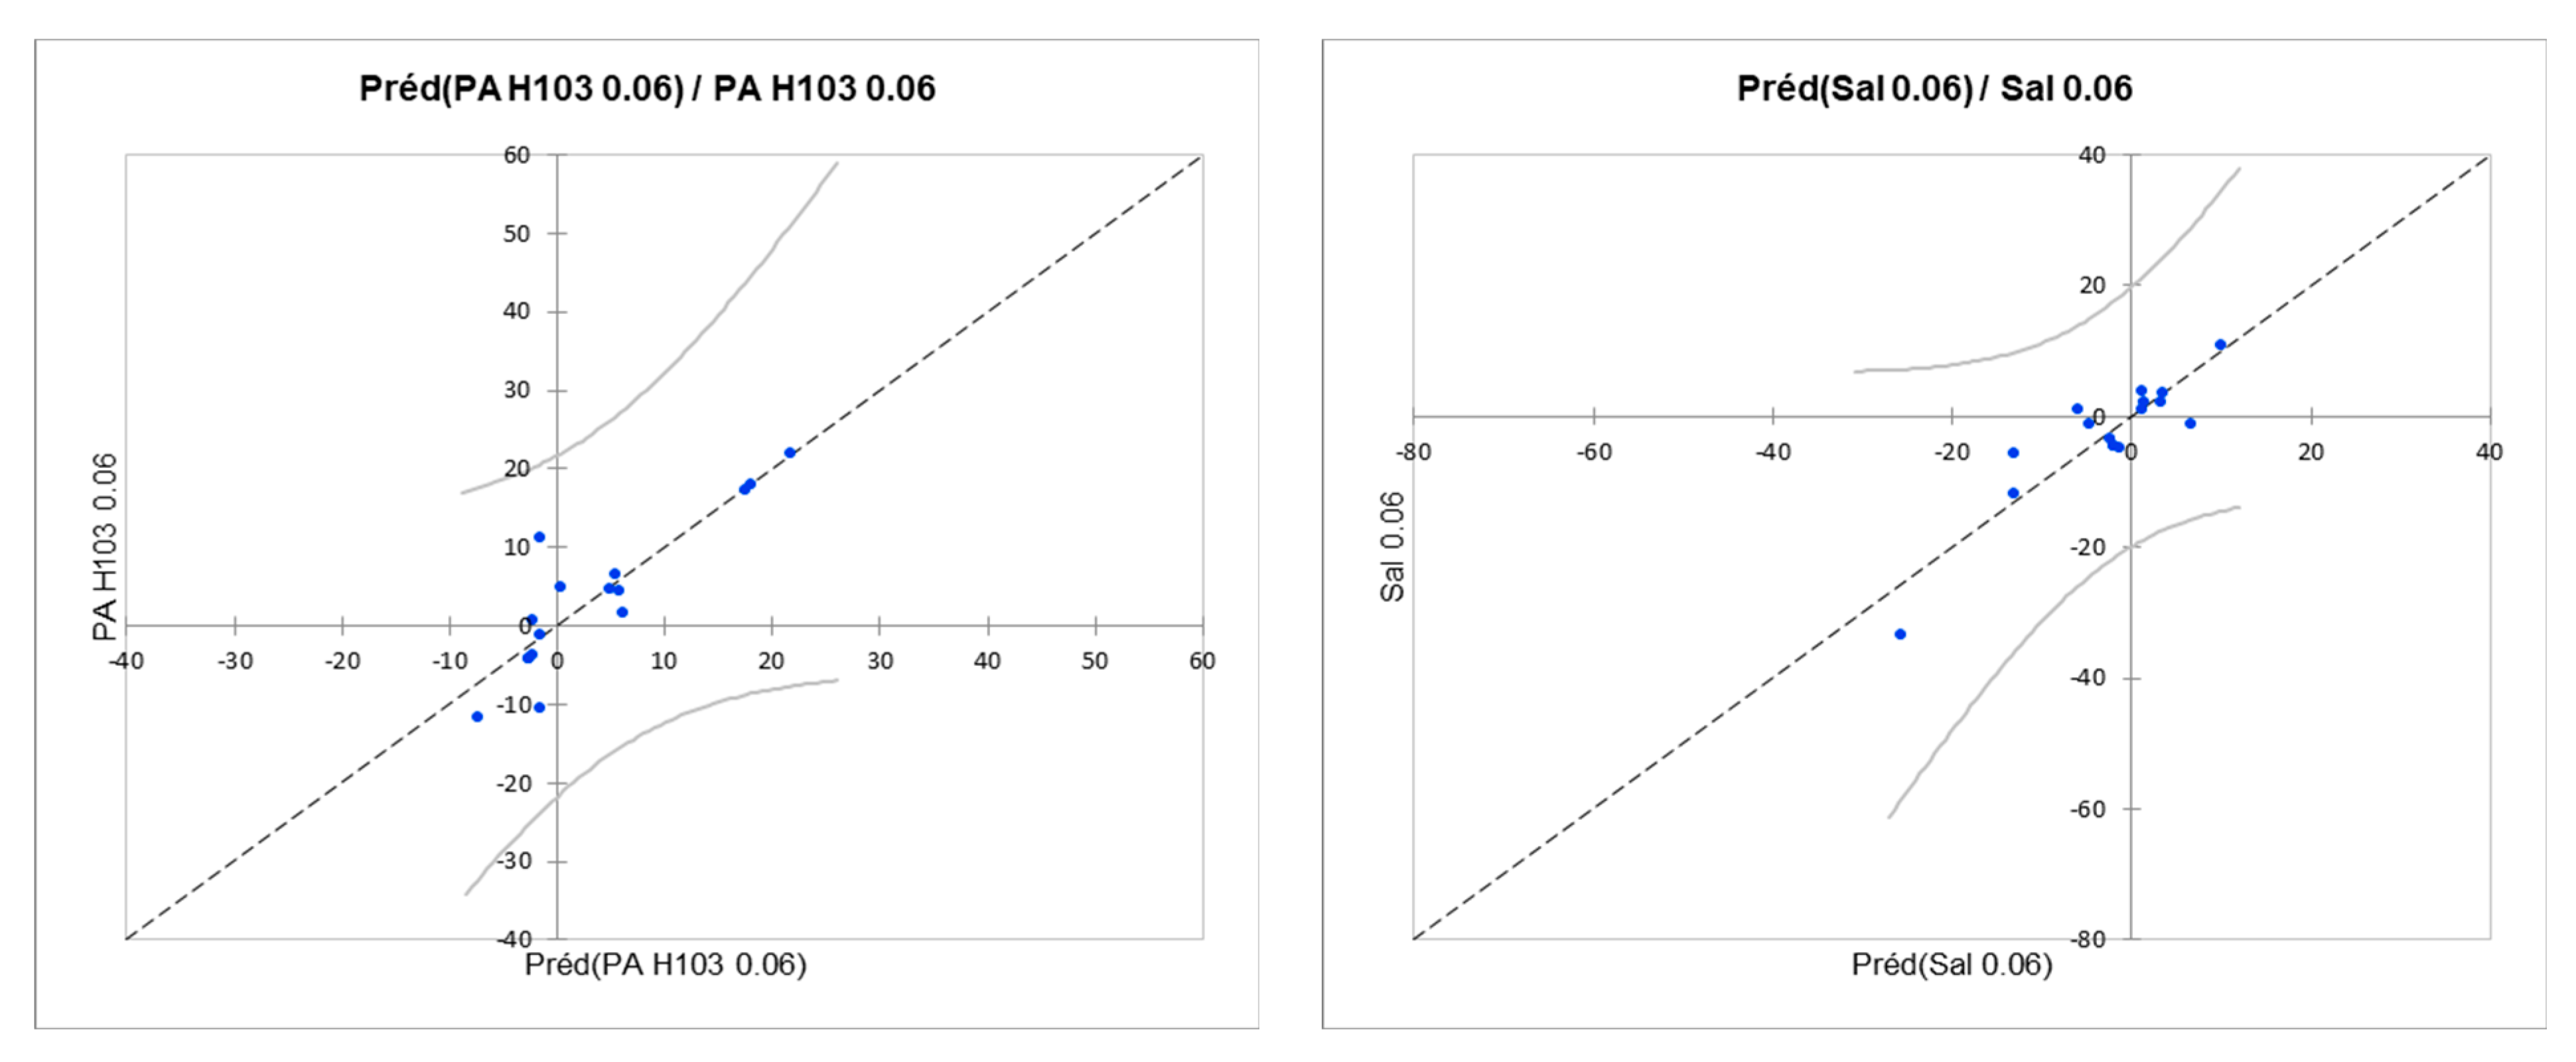
- SAR model for bacteria swarming
- (d)
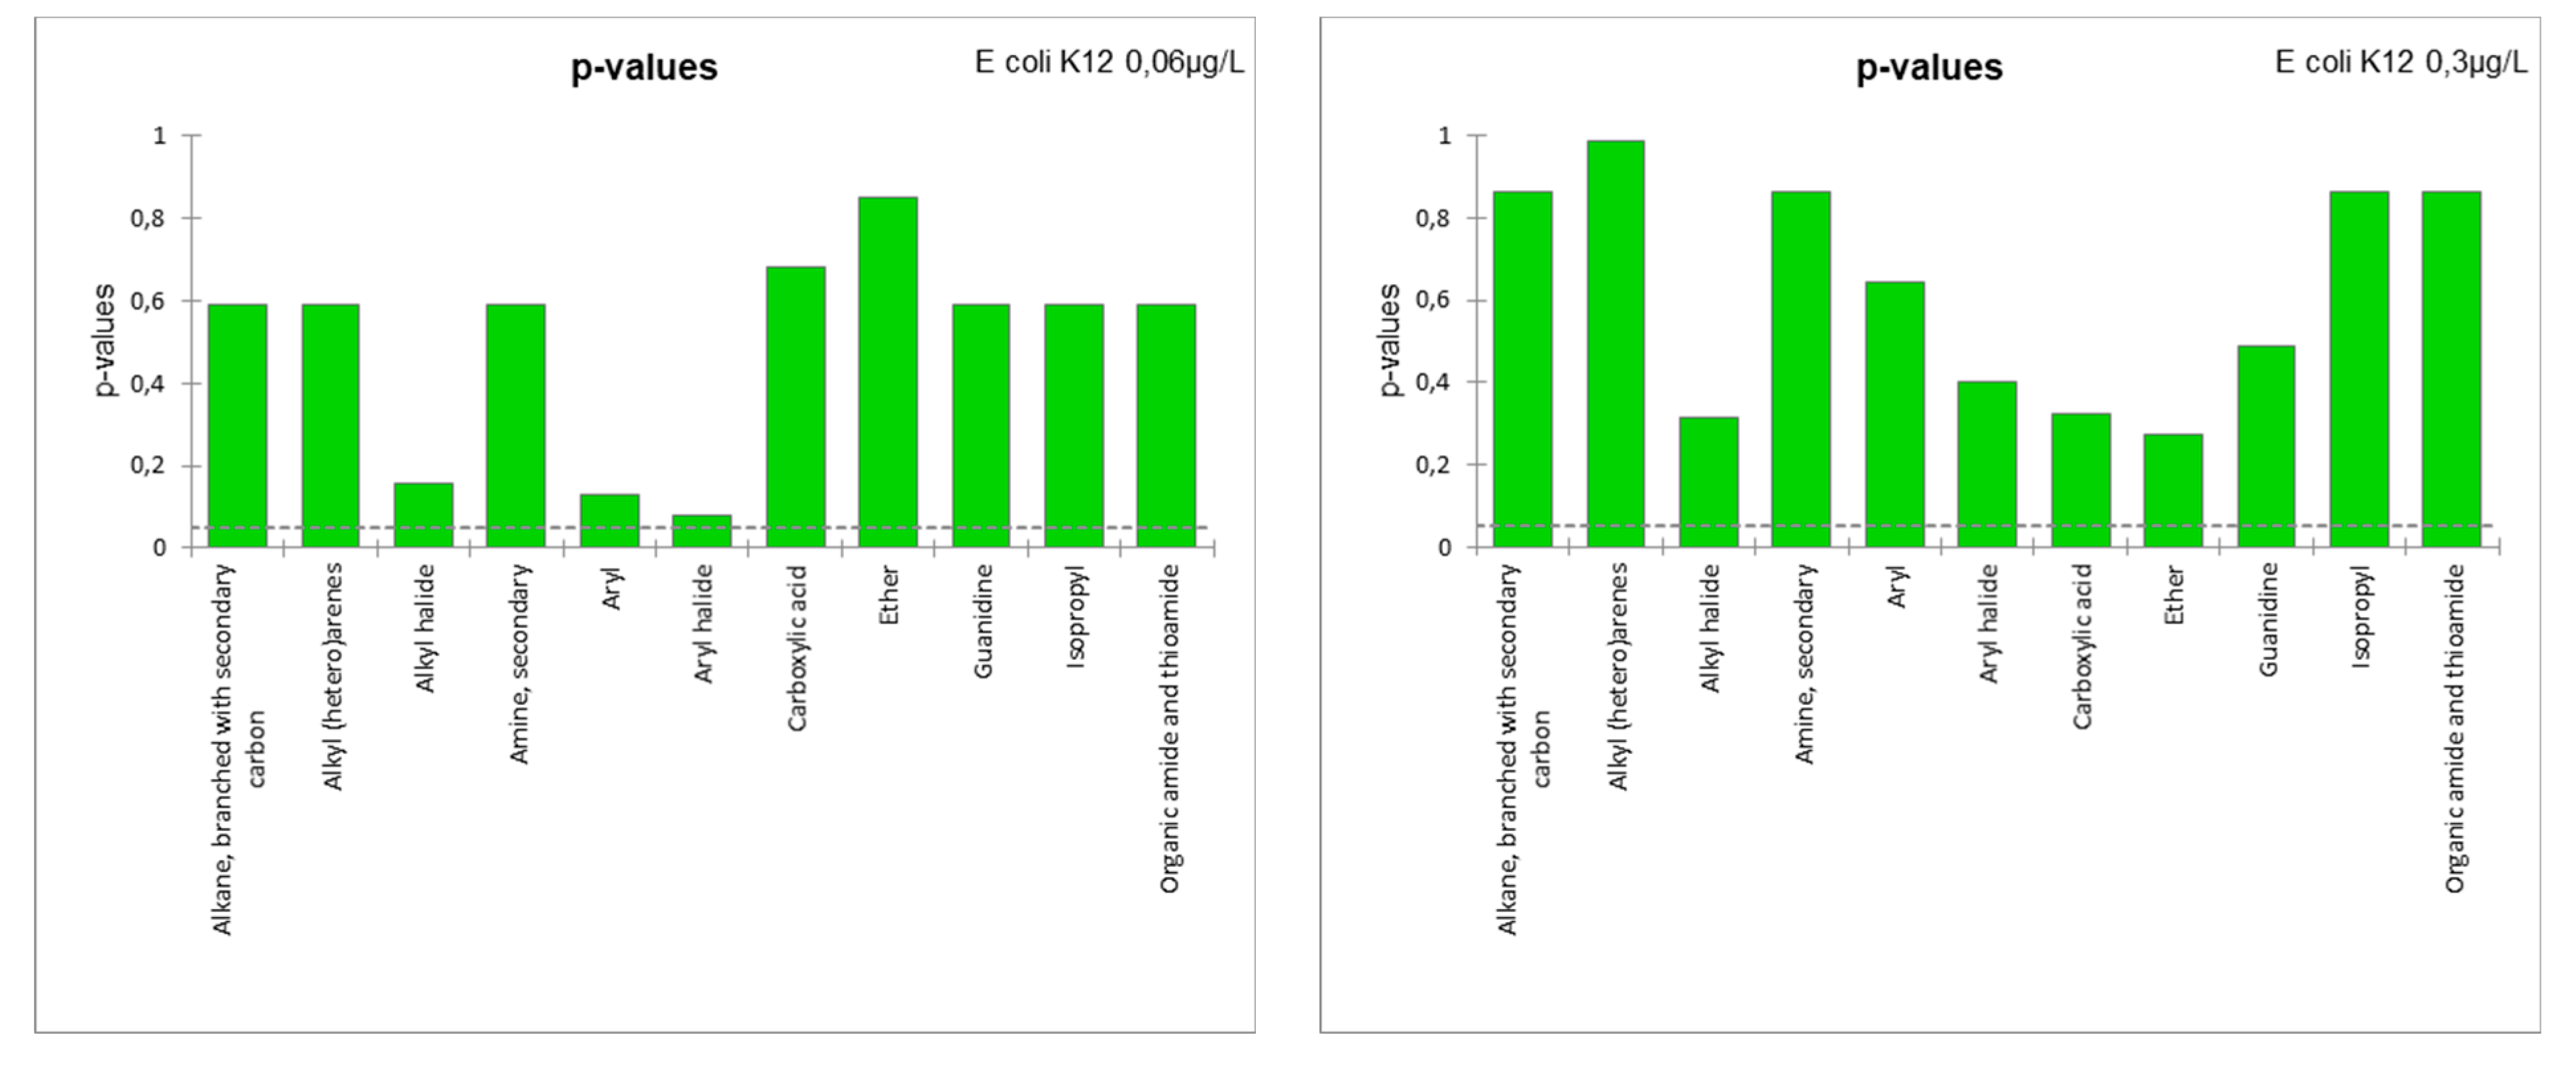
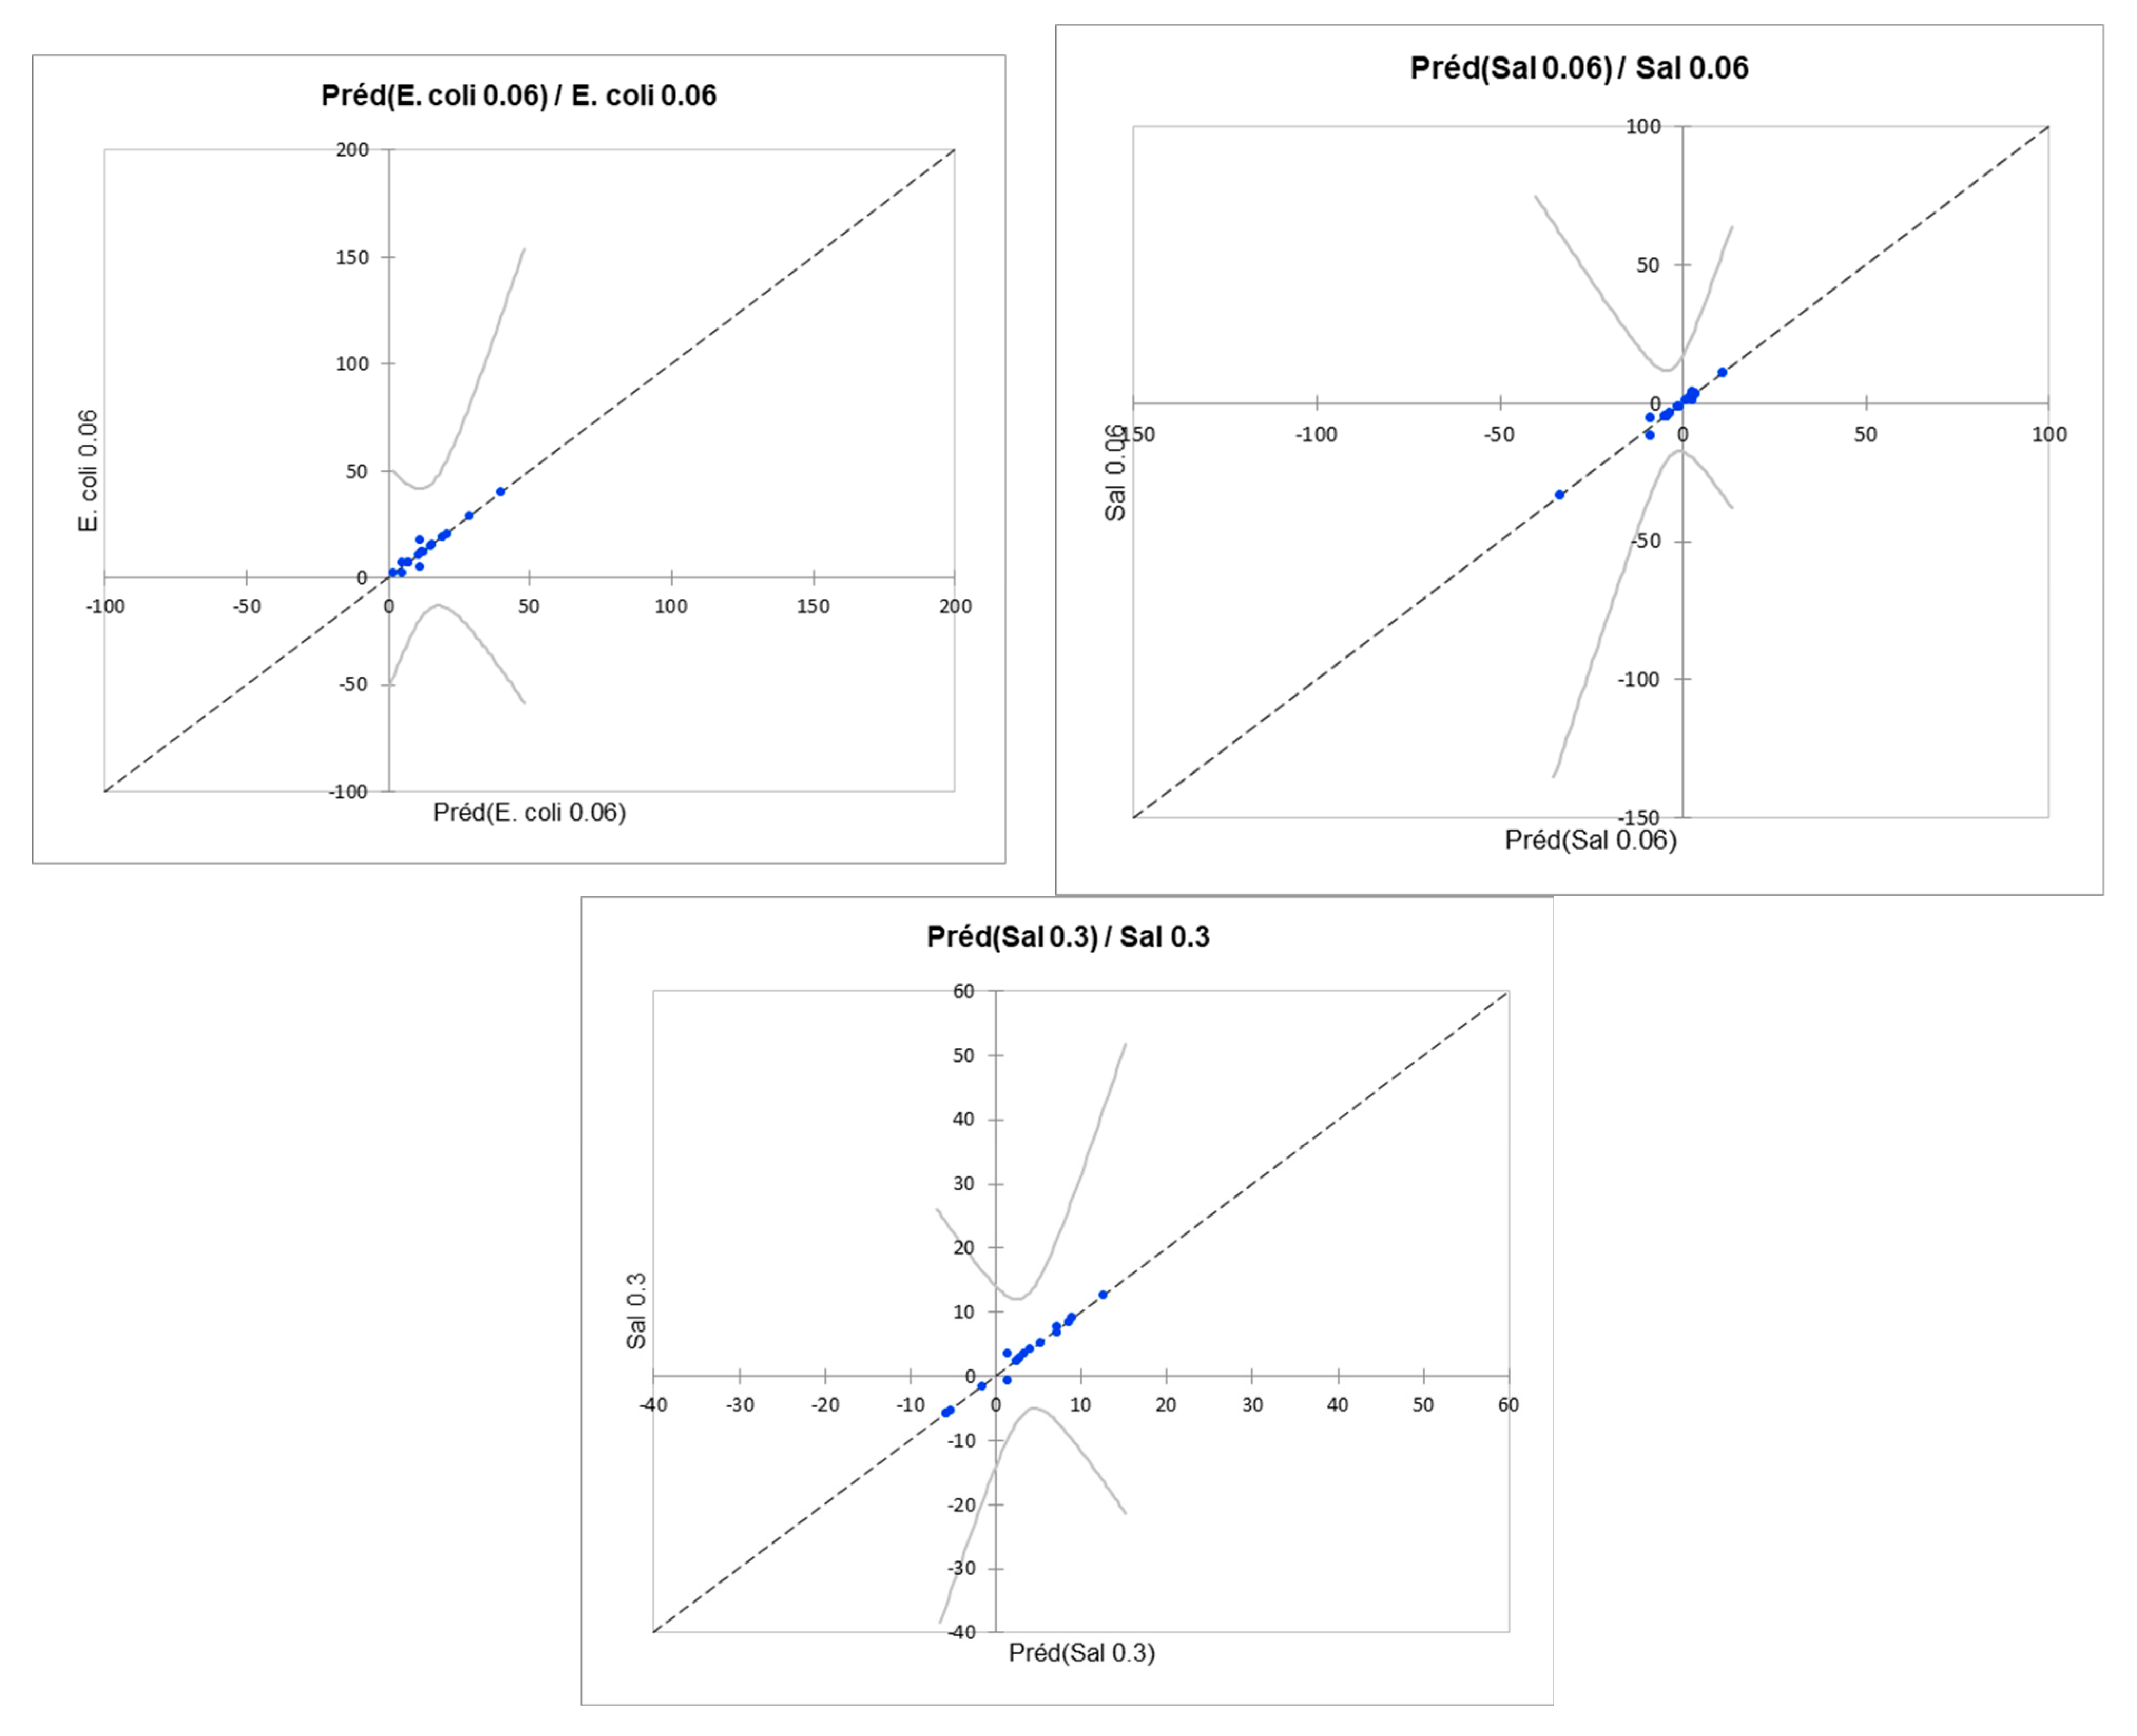
- Interaction between function groups
4. Conclusions
Supplementary Materials
Author Contributions
Funding
Data Availability Statement
Conflicts of Interest
References
- Karalius, V.P.; Harbison, J.E.; Plange-Rhule, J.; Breemen, R.B.V.; Li, G.; Ke, H.; Durazo-Arvizu, R.A.; Mora, N.; Dugas, L.R.; Lane, V.; et al. Bisphenol A (BPA) found in humans and water in three geographic regions with distinctly different levels of economic development. Environ. Health Insights 2014, 8, EHI-S13130. [Google Scholar] [CrossRef] [PubMed]
- Peng, Y.; Fang, W.; Krauss, M.; Brack, W.; Wang, Z.; Li, F.; Zhang, X. Screening hundreds of emerging organic pollutants (EOPs) in surface water from the Yangtze River Delta (YRD): Occurrence, distribution, ecological risk. Environ. Pollut. 2018, 241, 484–493. [Google Scholar] [CrossRef] [PubMed]
- Skrbic, B.D.; Kadokami, K.; Antic, I. On the micro-pollutants presence in surface water system of northern Serbia and environmental and health risk assessment. Environ. Res. 2018, 166, 130–140. [Google Scholar] [CrossRef]
- Götz, C.; Stamm, C.; Fenner, K.; Singer, H.; Scharer, M.; Hollender, J. Targeting aquatic microcontaminants for monitoring: Exposure catergorization and application to Swiss situation. Environ. Sci. Pollut. Res. 2010, 17, 341–354. [Google Scholar] [CrossRef]
- WHO (World Human Organization); FAO (Food Agricultural Organization). International Code of Conduct on the Distribution and Use of Pesticides: Guidelines for Quality Control of Pesticides. World Health Organization. 2011. Available online: https://apps.who.int/iris/handle/10665/70574 (accessed on 24 March 2023).
- Gaspar, F.W.; Castorina, R.; Maddalena, R.L.; Nischioka, M.G.; Mckone, T.E.; Bradman, A. Phtalate exposure and risk assessment in California child care facilities. Environ. Sci. Technol. 2014, 48, 7593–7601. [Google Scholar] [CrossRef]
- Jie, X.; Zheng, F.; Lei, G.; Biao, Z.; Wochenschrift, Y.J. Neurotoxic effects of nonylphenol: A review. Wien. Klin. Wochenschr. Educ. 2013, 125, 61–70. [Google Scholar] [CrossRef] [PubMed]
- Sun, J.; Pan, L.; Zhan, Y.; Lu, H.; Tsang, D.C.; Liu, W.; Wang, X.; Li, X.; Zhu, L. Contamination of phthalate esters, organochlorine pesticides and polybrominated diphenyl ethers in agricultural soils from the Yangtze River Delta of China. Sci. Total Environ. 2016, 544, 670–676. [Google Scholar] [CrossRef]
- Watson, K.; Shaw, G.; Leusch, F.; Knight, N.L. Chlorine disinfection by-products in wastewater effluent: Bioassay-based assessment of toxicological impact. Water Res. 2012, 46, 6069–6083. [Google Scholar] [CrossRef]
- Escher, B.; Leusch, F. Bioanalytical Tools in Water Quality Assessment; IWA Publishing: London, UK, 2012. [Google Scholar]
- Pan, Y.; Zhang, X.; Wagner, E.D.; Osiol, J.; Plewa, M.J. Boiling of simulated tap water: Effect on polar brominated disinfection byproducts, halogen speciation and cytotoxicity. Environ. Sci. Technol. 2014, 48, 149–156. [Google Scholar] [CrossRef]
- Weber, C.I. Methods for Measuring the Acute Toxicity of Effluents and Receiving Waters to Freshwater and Marine Organisms; Environmental Monitoring Systems Laboratory, U.S. Environmental Protection Agency: Cincinnati, OH, USA, 1991. [Google Scholar]
- Širić, I.; Eid, E.M.; Taher, M.A.; El-Morsy, M.H.E.; Osman, H.E.M.; Kumar, P.; Adelodun, B.; Abou Fayssal, S.; Mioč, B.; Andabaka, Ž.; et al. Combined Use of Spent Mushroom Substrate Biochar and PGPR Improves Growth, Yield, and Biochemical Response of Cauliflower (Brassica oleracea var. botrytis): A Preliminary Study on Greenhouse Cultivation. Horticulturae 2022, 8, 830. [Google Scholar] [CrossRef]
- Chaudhary, P.; Xu, M.; Ahamad, L.; Chaudhary, A.; Kumar, G.; Adeleke, B.S.; Verma, K.K.; Hu, D.-M.; Širić, I.; Kumar, P.; et al. Application of Synthetic Consortia for Improvement of Soil Fertility, Pollution Remediation, and Agricultural Productivity: A Review. Agronomy 2023, 13, 643. [Google Scholar] [CrossRef]
- Uruén, C.; Chopo-Escuin, G.; Tommassen, J.; Mainar-Jaime, R.C.; Arenas, J. Biofilms as Promoters of Bacterial Antibiotic Resistance and Tolerance. Antibiotics 2020, 10, 3. [Google Scholar] [CrossRef]
- Jepson, P.D.; Bennett, P.M.; Allchin, C.R.; Law, R.J.; Kuiken, T.; Baker, J.R.; Rogan, E.; Kirkwood, J.K. Investigating potential associations between chronic exposure to polychlorinated biphenyls and infectious disease mortality in harbour porpoises from England and Wales. Sci. Total Environ. 1999, 243, 339–348. [Google Scholar] [CrossRef]
- Lin, C.H.; Wu, C.Y.; Kou, H.S.; Chen, C.Y.; Huang, M.C.; Hu, H.M.; Wu, M.C.; Lu, C.Y.; Wu, D.C.; Wu, M.T.; et al. Effect of Di(2-ethylhexyl) phthalate on Helicobacter Pylori-Induced Apoptosis in AGS Cells. Gastroent. Res. Pract. 2013, 2013, 924769. [Google Scholar] [CrossRef] [PubMed]
- Brinster, S.; Lamberet, G.; Staels, B.; Trieu-Cuot, P.; Gruss, A.; Poyart, C. Brinster et al. reply. Nature 2010, 463, E4. [Google Scholar] [CrossRef]
- Yin, H.; Deng, Y.; Wang, H.; Liu, W.; Huang, X.; Chu, W. Tea polyphenols as an antivirulence compound Disrupt Quorum-Sensing Regulated Pathogenicity of Pseudomonas aeruginosa. Sci. Rep. 2015, 5, 16158. [Google Scholar] [CrossRef]
- National Academies of Sciences, Engineering, and Medicine. Toward Understanding the Interplay of Environmental Stressors, Infectious Diseases, and Human Health: Proceedings of a Workshop—In Brief; The National Academies Press: Washington, DC, USA, 2019. [Google Scholar] [CrossRef]
- ECHA. The Use of Alternatives to Testing on Animals for the REACH Regulation; Fourth Report under Article 117(3) of the REACH Regulation; European Chemicals Agency: Helsinki, Finland, 2020; p. 85. [Google Scholar]
- Madden, J.C.; Enoch, S.J.; Paini, A.; Cronin, M.T.D. A Review of In Silico Tools as Alternatives to Animal Testing: Principles, Resources and Applications. Altern. Lab. Anim. 2020, 48, 146–172. [Google Scholar] [CrossRef]
- Piir, G.; Kahn, I.; García-Sosa, A.T.; Sulev, S.; Priit, A.; Uko, M. Best practices for QSAR model reporting: Physical and chemical properties, ecotoxicity, environmental fate, human health, and toxicokinetics endpoints. Environ. Health Perspect. 2018, 126, 126001. [Google Scholar] [CrossRef] [PubMed]
- Petric, M.; Crisa, L.; Crisa, M.; Micle, A.; Maransecu, B.; Ilia, G. Synthesis and QSRR Study for a Series of Phosphoramidic Acid Derivatives. Heteroat. Chem. 2013, 24, 138–145. [Google Scholar] [CrossRef]
- Kausar, S.; Falco, A.O. An automated framework for QSAR model building. J Cheminform 2018, 10, 1. [Google Scholar] [CrossRef]
- Hancock, R.E.; Mutharia, L.M.; Chan, L.; Darveau, R.P.; Speert, D.P.; Prier, G.B. Pseudomonas aeruginosa isolates from patients with cystic fibrosis: A class of serum-sensitive, non typable strains deficient in lipopolysaccharide O side chains. Infect. Immun. 1983, 24, 170–177. [Google Scholar] [CrossRef] [PubMed]
- Livak, K.J.; Schmittgen, T.D. Analysis of relative gene expression data using real-time quantitative PCR and the 2−ΔΔCT method. Methods 2001, 25, 402–408. [Google Scholar] [CrossRef]
- Araujo, A.S.; Monteiro, R.T.; Abarkeli, R.B. Effect of glyphosate on the microbial activity of two Brazilian soils. Chemosphere 2003, 52, 799–804. [Google Scholar] [CrossRef]
- El Fantruossi, S. Effect of Phenylurea herbicides on soil microbiol communities estimated by analysis of 16S rRNA gene fingerprints and community-level physiological profiles. Appl. Environ. Microbiol. 1999, 65, 982–988. [Google Scholar] [CrossRef]
- Muturi, E.; Benedict, O.O.; Kim, C.H. Effect of leaf type and pesticide on abundance of bacterial taxa in mosquito larval habitats. PLoS ONE 2013, 8, e71812. [Google Scholar] [CrossRef] [PubMed]
- Russell, R.J.; Scott, C.; Jackson, C.J.; Pandey, R.; Pandey, G.; Taylor, M.C.; Coppin, C.W.; Liu, J.W.; Oackeshott, J.G. The evolution of new enzyme function: Lessons from xenobiotic metabolizing bacteria versus insecticide-resistant insects. Evol. Appl. 2011, 4, 225–248. [Google Scholar] [CrossRef]
- Chapelle, F.H.; Bradley, P.M.; Lovley, D.R.; O’Neill, K.; Landmeyer, J.E. Rapid evolution of redox processes in a petroleum hydrocarbon-contaminated aquifer. Ground Water 2002, 40, 353–360. [Google Scholar] [CrossRef] [PubMed]
- Ludvigsen, L.; Albrechtsen, H.J.; Ringelberg, D.B.; Ekelund, F.; Christensen, T.H. Distribution and composition of microbial populations in a landfill leachate contaminated aquifer (Grindsted, Denmark). Microb. Ecol. 1999, 37, 197–207. [Google Scholar] [CrossRef]
- USGS (United States Geological Science). Bacteria and Their Effects on Ground-Water Quality. 2017. Available online: https://mi.water.usgs.gov/h2oqual/GWBactHOWeb.html (accessed on 24 March 2023).
- Müller, A.K.; Rasmussen, L.D.; Sørensen, S.J. Adaptation of the bacterial community to mercury contamination. FEMS Microbiol. Lett 2001, 204, 49–53. [Google Scholar] [CrossRef]
- Rasmussen, L.D.; Sorensen, S.J. Effects of mercury contamination on the culturable heterotrophic, functional and genetic diversity of the bacterial community in soil. FEMS Microbiol. Ecol. 2001, 36, 1–9. [Google Scholar] [CrossRef]
- Widenfalk, A.; Goedkoop, W.; Svensson, J.M. Effects of the pesticides captan, deltamethrin, isoproturon, and pirimicarb on the microbial community of a freshwater sediment. Environ. Toxicol. Chem. 2004, 23, 1920–1927. [Google Scholar] [CrossRef]
- Widenfalk, A.; Bertilsson, S.; Sundh, I.; Goedkoop, W. Effects of pesticides on community composition and activity of sediment microbes--responses at various levels of microbial community organization. Environ. Pollut. 2008, 152, 576–584. [Google Scholar] [CrossRef]
- Gullberg, E.; Cao, S.; Berg, O.G.; Ilbeack, C.; Sandegren, L.; Hughes, D.; Andersson, D.I. Selection of resistant bacteria at very low antibiotic concentrations. PLoS Pathog. 2011, 7, e1002158. [Google Scholar] [CrossRef] [PubMed]
- Guan, T.Y.; Blank, G.; Ismond, A.; Van Acker, R. Fate of foodborne bacterial pathogens in pesticide products. J. Sci. Food Agric. 2001, 81, 503–512. [Google Scholar] [CrossRef]
- Girvan, M.S.; Bullimore, J.; Ball, A.S.; Pretty, J.N.; Osborn, A.M. Responses of active bacterial and fungal communities in soils under winter wheat to different fertilizer and pesticide regimens. Appl. Environ. Microbiol. 2004, 70, 2692–2701. [Google Scholar] [CrossRef] [PubMed]
- Melendez, A.L.; Kepner, R.L.; Balczon, J.M.; Pratt, J.R. Effects of diquat on fresh-water microbial communities. Arch. Environ. Contam. Toxicol. 1993, 25, 95–101. [Google Scholar] [CrossRef]
- Kearns, D.B.; Losick, R. Swarming motility in undomesticated Bacillus subtilis. Mol. Microbiol. 2003, 49, 581–590. [Google Scholar] [CrossRef]
- Caiazza, N.C.; Shanks, R.M.; 'Toole, G.A. Rhamnolipids modulate swarming motility patterns of Pseudomonas aeruginosa. J. Bacteriol. 2005, 187, 7351–7361. [Google Scholar] [CrossRef]
- Xavier, J.B.; Kim, W.; Foster, K.R. A molecular mechanism that stabilizes cooperative secretions in Pseudomonas aeruginosa. Mol. Microbiol. 2011, 79, 166–179. [Google Scholar] [CrossRef]
- Qiu, J.; Feng, H.; Lu, J.; Xiang, H.; Wang, D.; Dong, J.; Wang, J.; Wang, X.; Liu, J.; Deng, X. Eugenol reduces the expression of virulence-related exoproteins in Staphylococcus aureus. Appl. Environ. Microbiol. 2010, 76, 5846–5851. [Google Scholar] [CrossRef]
- Xu, X.; Zhou, X.D.; Wu, C.D. The tea catechin epigallocatechin gallate suppresses cariogenic virulence factors of Streptococcus mutans. Antimicrob Agents Chemother 2011, 55, 1229–1236. [Google Scholar] [CrossRef] [PubMed]
- Jia, P.; Xue, Y.J.; Duan, X.J.; Shao, S.H. Effect of cinnamaldehyde on biofilm formation and sarA expression by methicillin-resistant Staphylococcus aureus. Lett. Appl. Microbiol. 2011, 53, 409–416. [Google Scholar] [CrossRef]
- Fan, S.; Tian, F.; Li, J.; Hutchins, W.; Chen, H.; Yang, F.; Yuan, X.; Cui, Z.; Yang, C.H.; He, H. Identification of phenolic compounds that suppress the virulence of Xanthomonas oryzae on rice via the type III secretion system. Mol. Plant Pathol. 2016, 18, 555–568. [Google Scholar] [CrossRef] [PubMed]
- Kekeç, Ö.; Gökalsın, B.; Karaltı, İ.; Kayhan, F.E.; Sesal, N.C. Effects of Chlorine Stress on Pseudomonas aeruginosa Biofilm and Analysis of Related Gene Expressions. Curr. Microbiol. 2016, 73, 228–235. [Google Scholar] [CrossRef]
- Li, Y.; Zheng, B.; Li, Y.; Zhu, S.; Xue, F.; Liu, J. Antimicrobial Susceptibility and Molecular Mechanisms of Fosfomycin Resistance in Clinical Escherichia coli Isolates in Mainland China. PLoS ONE 2015, 10, e0135269. [Google Scholar] [CrossRef] [PubMed]
- Damron, F.H.; Oglesby-Sherrouse, A.G.; Wilks, A.; Barbier, M. Dual-seq transcriptomics reveals the battle for iron during Pseudomonas aeruginosa acute murine pneumonia. Sci. Rep. 2006, 6, 39172. [Google Scholar] [CrossRef]
- Müller, M.; Nendza, M. Literature Study: Effects of Molecular Size and Lipid Solubility on Bioaccumulation Potential; Report Number: Final Report 360 01 043; Federal Environment Agency: Dessau-Roßlau, Germany, 2007. [Google Scholar] [CrossRef]


| Variable | Presence | Count |
|---|---|---|
| Alkane, branched with secondary carbon | no | 13 |
| yes | 2 | |
| Alkyl (hetero)arenes | no | 13 |
| yes | 2 | |
| Alkyl halide | no | 12 |
| yes | 3 | |
| Amine, secondary | no | 13 |
| yes | 2 | |
| Aryl | no | 8 |
| yes | 7 | |
| Aryl halide | no | 9 |
| yes | 6 | |
| Carboxylic acid | no | 11 |
| yes | 4 | |
| Ether | no | 10 |
| yes | 5 | |
| Guanidine | no | 13 |
| yes | 2 | |
| Isopropyl | no | 13 |
| yes | 2 | |
| Organic amide and thioamide | no | 13 |
| yes | 2 |
| Bacteria (Concentration) | R² | R² Adjusted | RMSE | Model |
|---|---|---|---|---|
| E. coli K12 (0.06 µg/L) | 0.635 | -0.021 | 10.218 | E. coli 0.06 = 50.45–8.03*Alkane, branched with secondary carbon-non-19.8*Alkyl (hetero)arenes-non-2.10*Alkyl halide-non-6.87*Aryl-non+3.35*Aryl halide-non-1.79*Carboxylic acid-non-0.26*Ether-non-21.11*Guanidine-non+12.98*Organic amide and thioamide-non |
| E. coli K12 (0.3 µg/L) | 0.353 | -0.813 | 9.715 | E. coli 0.3 = 35.59–1.17*Alkane, branched with secondary carbon-non-9.19*Alkyl (hetero)arenes-non+0.78*Alkyl halide-non-6.02*Aryl-non+4.90*Aryl halide-non-3.46*Carboxylic acid-non-3.53*Ether-non-3.22*Guanidine-non+9.44*Organic amide and thioamide-non |
| P. aeruginosa H103 (0.06 µg/L) | 0.769 | 0.352 | 7.985 | PA H103 0.06 = 42.28–0.45*Alkane, branched with secondary carbon-non-22.99*Alkyl (hetero)arenes-non+0.65*Alkyl halide-non-5.78*Aryl-non+6.15*Aryl halide-non-13.82*Carboxylic acid-non+11.52*Ether-non-7.34*Guanidine-non-11.81*Organic amide and thioamide-non |
| P. aeruginosa H103 (0.3 µg/L) | 0.497 | -0.409 | 8.433 | PA H103 0.3 = 28.98–6.65*Alkane, branched with secondary carbon-non-10.88*Alkyl (hetero)arenes-non-4.13*Alkyl halide-non-1.87*Aryl-non+2.75*Aryl halide-non-7.36*Carboxylic acid-non+5.07*Ether-non-14.48*Guanidine-non+0.54*Organic amide and thioamide-non |
| S. Typhimurium (0.06 µg/L) | 0.806 | 0.456 | 7.377 | Sal 0.06 = 43.85–13.97*Alkane, branched with secondary carbon-non-28.87*Alkyl (hetero)arenes-non-14.33*Alkyl halide-non-12.95*Aryl-non+16.17*Aryl halide-non-3.71*Carboxylic acid-non-6.78*Ether-non-11.78*Guanidine-non+19.21*Organic amide and thioamide-non |
| S. Typhimurium (0.3 µg/L) | 0.441 | -0.564 | 6.498 | Sal 0.3 = 7.53–0.30*Alkane, branched with secondary carbon-non-4.85*Alkyl (hetero)arenes-non-0.29*Alkyl halide-non-4.39*Aryl-non+5.09*Aryl halide-non+3.11*Carboxylic acid-non-1.70*Ether-non-5.02*Guanidine-non+3.65*Organic amide and thioamide-non |
| Bacteria (Concentration) | R² | R² Adjusted | RMSE | Model |
|---|---|---|---|---|
| E. coli K12 (0.06 µg/L) | 0.672 | 0.082 | 5.052 | E. coli 0.06 = −0.3–8.37*Alkane, branched with secondary carbon-non-5.01*Alkyl (hetero)arenes-non+4.18*Alkyl halide-non+3.35*Aryl-non+6.69*Aryl halide-non-1.68*Carboxylic acid-non+1.66*Ether-non-3.35*Guanidine-non+5.02*Organic amide and thioamide-non |
| E. coli K12 (0.3 µg/L) | 0.779 | 0.382 | 34.721 | E. coli 0.3 = −259.09 + 46.54*Alkane, branched with secondary carbon-non-1.24*Alkyl (hetero)arenes-non+72.54*Alkyl halide-non-17.59*Aryl-non+6.10*Aryl halide-non+88.94*Carboxylic acid-non-40.25*Ether-non+71.79*Guanidine-non+76.55*Organic amide and thioamide-non |
| P. aeruginosa H103 (0.06 µg/L) | 0.655 | 0.035 | 8.971 | PA 0.06 = −2.31–13.47*Alkane, branched with secondary carbon-non-0.58*Alkyl (hetero)arenes-non+7.94*Alkyl halide-non+8.04*Aryl-non+10.05*Aryl halide-non-5.83*Carboxylic acid-non-3.83*Ether-non-6.83*Guanidine-non+9.04*Organic amide and thioamide-non |
| P. aeruginosa H103 (0.3 µg/L) | 0.709 | 0.185 | 20.124 | PA 0.3 = 22.28–6.61*Alkane, branched with secondary carbon-non-13.40*Alkyl (hetero)arenes-non-23.82*Alkyl halide-non+1.76*Aryl-non-26.65*Aryl halide-non+8.00*Carboxylic acid-non+3.19*Ether-non+20.51*Guanidine-non-21.29*Organic amide and thioamide-non |
| Bacteria (Concentration) | R² | R² Adjusted | RMSE | Model with Interactions |
|---|---|---|---|---|
| E. coli K12 (0.06 µg/L) | 0.941 | 0.586 | 6.509 | E. coli 0.06 = 2.30+10.49*Alkane, branched with secondary carbon-non-25.59*Alkyl (hetero)arenes-non+18.39*Alkyl halide-non+25.94*Aryl-non+16.99*Aryl halide-non+14.39*Carboxylic acid-non+8.99*Ether-non-14.40*Guanidine-non+10.79*Organic amide and thioamide-non-12.69*Alkane, branched with secondary carbon-non*Aryl halide-non-24.94*Alkyl halide-non*Aryl-non-25.90*Aryl-non*Aryl halide-non |
| E. coli K12 (0.3 µg/L) | 0.910 | 0.369 | 5.731 | E.coli 0.3 = −22.74+21.99*Alkane, branched with secondary carbon-non-19.94*Alkyl (hetero)arenes-non+30.99*Alkyl halide-non+24.84*Aryl-non+20.94*Aryl halide-non+10.84*Carboxylic acid-non+8.04*Ether-non+7.19*Guanidine-non+10.09*Organic amide and thioamide-non-22.99*Alkane, branched with secondary carbon-non*Aryl halide-non-35.09*Alkyl halide-non*Aryl-non-10.5*Aryl-non*Aryl halide-non |
| P. aeruginosa H103 (0.06 µg/L) | 0.823 | -0.238 | 11.039 | PA H103 0.06 = 33.90+3.69*Alkane, branched with secondary carbon-non-29.09*Alkyl (hetero)arenes-non+6.69*Alkyl halide-non-12.08*Aryl-non+13.29*Aryl halide-non-16.1*Carboxylic acid-non+13.59*Ether-non-4.10*Guanidine-non-6.10*Organic amide and thioamide-non-13.89*Alkane, branched with secondary carbon-non*Aryl halide-non-4.81*Alkyl halide-non*Aryl-non+15.39*Aryl-non*Aryl halide-non |
| P. aeruginosa H103 (0.3 µg/L) | 0.685 | -1.202 | 10.543 | PA H103 0.3 = −10.72+9.94*Alkane, branched with secondary carbon-non-22.77*Alkyl (hetero)arenes-non+14.04*Alkyl halide-non+7.97*Aryl-non+23.42*Aryl halide-non-0.32*Carboxylic acid-non+13.37*Ether-non-6.45*Guanidine-non+8.24*Organic amide and thioamide-non-27.89*Alkane, branched with secondary carbon-non*Aryl halide-non-18.34*Alkyl halide-non*Aryl-non+3.24*Aryl-non*Aryl halide-non |
| S. Typhimurium (0.06 µg/L) | 0.983 | 0.882 | 3.434 | Sal 0.06 = 17.22–1.55*Alkane, branched with secondary carbon-non-43.92*Alkyl (hetero)arenes-non-0.35*Alkyl halide-non-23.09*Aryl-non+38.57*Aryl halide-non-5.37*Carboxylic acid-non-0.57*Ether-non-3.85*Guanidine-non+33.44*Organic amide and thioamide-non-35.49*Alkane, branched with secondary carbon-non*Aryl halide-non-10.83*Alkyl halide-non*Aryl-non+27.04*Aryl-non*Aryl halide-non |
| S. Typhimurium (0.3 µg/L) | 0.978 | 0.847 | 2.033 | Sal 0.3 = −10.65+6.39*Alkane, branched with secondary carbon-non-5.35*Alkyl (hetero)arenes-non+17.39*Alkyl halide-non+12.88*Aryl-non-4.14*Aryl halide-non+6.54*Carboxylic acid-non+1.65*Ether-non-1.00*Guanidine-non-3.39*Organic amide and thioamide-non+3.19*Alkane, branched with secondary carbon-non*Aryl halide-non-23.23*Alkyl halide-non*Aryl-non+1.10*Aryl-non*Aryl halide-non |
| Bacteria (Concentration) | R² | R² Adjusted | RMSE | Model with Interactions |
|---|---|---|---|---|
| E. coli K12 (0.06 µg/L) | The variance between the data is not significant enough | |||
| E. coli K12 (0.3 µg/L) | 0.816 | -0.288 | 50.138 | E.coli 0.3 = −253.27+46.49*Alkane, branched with secondary carbon-non-12.62*Alkyl (hetero)arenes-non+46.5*Alkyl halide-non-52.74*Aryl-non+50.92*Aryl halide-non+86.77*Carboxylic acid-non-40.27*Ether-non+69.99*Guanidine-non+102.9*Organic amide and thioamide-non-37.69*Alkane, branched with secondary carbon-non*Aryl halide-non+40.11*Alkyl halide-non*Aryl-non+2.90*Aryl-non*Aryl halide-non |
| P. aeruginosa H103 (0.06 µg/L) | The variance between the data is not significant enough | |||
| P. aeruginosa H103 (0.3 µg/L) | 0.950 | 0.651 | 13.164 | PA 0.3 = −17.15+11.81*Alkane, branched with secondary carbon-non-35.90*Alkyl (hetero)arenes-non+11.81*Alkyl halide-non-12.27*Aryl-non-11.07*Aryl halide-non-0.59*Carboxylic acid-non+12.40*Ether-non+35.31*Guanidine-non-5.88*Organic amide and thioamide-non-47.13*Alkane, branched with secondary carbon-non*Aryl halide-non-35.33*Alkyl halide-non*Aryl-non+64.61*Aryl-non*Aryl halide-non |
Disclaimer/Publisher’s Note: The statements, opinions and data contained in all publications are solely those of the individual author(s) and contributor(s) and not of MDPI and/or the editor(s). MDPI and/or the editor(s) disclaim responsibility for any injury to people or property resulting from any ideas, methods, instructions or products referred to in the content. |
© 2023 by the authors. Licensee MDPI, Basel, Switzerland. This article is an open access article distributed under the terms and conditions of the Creative Commons Attribution (CC BY) license (https://creativecommons.org/licenses/by/4.0/).
Share and Cite
Al Haj Ishak Al Ali, R.; Mondamert, L.; Berjeaud, J.-M.; Jandry, J.; Crépin, A.; Labanowski, J. Application of QSAR Approach to Assess the Effects of Organic Pollutants on Bacterial Virulence Factors. Microorganisms 2023, 11, 1375. https://doi.org/10.3390/microorganisms11061375
Al Haj Ishak Al Ali R, Mondamert L, Berjeaud J-M, Jandry J, Crépin A, Labanowski J. Application of QSAR Approach to Assess the Effects of Organic Pollutants on Bacterial Virulence Factors. Microorganisms. 2023; 11(6):1375. https://doi.org/10.3390/microorganisms11061375
Chicago/Turabian StyleAl Haj Ishak Al Ali, Roukaya, Leslie Mondamert, Jean-Marc Berjeaud, Joelle Jandry, Alexandre Crépin, and Jérôme Labanowski. 2023. "Application of QSAR Approach to Assess the Effects of Organic Pollutants on Bacterial Virulence Factors" Microorganisms 11, no. 6: 1375. https://doi.org/10.3390/microorganisms11061375