Abstract
There is increasing evidence that the diet and nutritional status of women during pregnancy and lactation can modulate the microbiota of their milk and, therefore, the microbiota of the infant. An observational, descriptive, and cross-sectional study was carried out in a group of lactating women. Dietary intake during gestation and the first trimester of lactation was evaluated, and the microbiota was analyzed by 16S ribosomal RNA (rRNA) sequencing using the Illumina platform. Globally, Streptococcus spp. (32%), Staphylococcus spp. (17.3%), Corynebacterium spp. (5.1%) and Veillonella spp. (3.1%) were the predominant bacterial genera. The consumption of simple carbohydrates in gestation (rho = 0.55, p ≤ 0.01) and lactation (rho = 0.50, p ≤ 0.01) were positively correlated with Enterobacter spp. In lactation, a negative correlation was observed between the intake of simple carbohydrates and the genus Bifidobacterium spp. (rho = −0.51 p ≤ 0.01); furthermore, a positive correlation was identified between the intake of folic acid and Akkermansia spp. (rho = 0.47, p ≤ 0.01). Amplicon sequence variants (ASVs) associated with the delivery mode, employment relationship, the baby’s gender, birth weight, the Body Mass Index (BMI) of the breastfeeding woman, and gestational weight gain were recovered as covariates in a linear mixed model. The results of this research showed that the maternal nutritional status and diet of women during gestation and lactation could modulate the microbiota of breast milk.
1. Introduction
The role of the human microbiota in healthy growth and development during the first years of life has been related to its beneficial metabolic and structural functions, the regulation of immunity and systemic inflammation, as well as its influence on the somatotrophic axis, which has regulated the production of growth factors such as the insulin-like growth factor 1 (IGF1) and growth hormone, as well as energy and nutritional metabolism [1,2]. Moreover, the first interaction of microorganisms with humans is fundamental for immunological, metabolic, and systemic adaptation; the first 1000 days of life are considered a decisive immunological window for health in the later stages of life [3].
Due to its enormous metabolic capacity, the microbiota is considered essential for life, with great influence on health and disease. The population composition of the microbiota is particular and exhibits its own characteristics in each individual; therefore, it varies according to genetics, the mode of birth, the type of feeding in the early years, habitual diet, the use of probiotics, exposure to antibiotics, interactions with the environment, among other factors [4]. It is estimated that about 25–30% of the infant microbiota has its origin in breast milk [2], in which a central bacteriome composed of nine genera, Staphylococcus spp., Streptococcus spp., Serratia spp., Pseudomonas spp., Corynebacterium spp., Ralstonia spp., Propionibacterium spp., Sphingomonas spp., and Bradyrhizobium spp. has been identified [5]. A recent study conducted in Colombia on breast milk samples from women donors identified that the milk microbiota contained commensal microorganisms, including, among them, lactic acid bacteria with probiotic potential using culture methods [6]; however, no studies have been developed in a national context to identify how a woman’s diet modulates the microbiota of her milk.
It has been documented that breast milk microbiota is modulated by several factors such as diet and weight [5]. Regarding maternal feeding, the consumption of carbohydrates, fiber and vegetable proteins could influence the abundance of Staphylococcus spp., Bifidobacterium spp., and Lactobacillus spp. [7], and associations have also been found between the intake of polyunsaturated fatty acids and the genus Bifidobacterium spp. [8]. Micronutrients such as calcium and vitamin B2 have been positively associated with Veillonella spp. abundance [9] and vitamin C intake with a higher abundance of Staphylococcus spp. [8].
In relation to the Body Mass Index (BMI) and gestational weight gain, changes in breast milk microbiota have also been identified. The BMI of lactating women has been negatively related to the genus Bacteroides spp. [9] and gestational weight gain has shown a positive relationship with alpha diversity in breast milk microbiota [10]. It has been described that excess maternal weight could generate changes in the milk’s metabolome and in the microbiota: mechanisms that could be involved in the risk of infant obesity [11,12,13].
The connection between nutritional status, a woman’s diet during gestation and lactation, and the microbiota of breast milk highlights the need to go deeper into this subject in order to identify aspects that, from a dietary and nutritional point of view, could be modified in favor of the microbiota, which can contribute to favoring the health of the mother-child binomial in the short, medium and long term. The complexity of breast milk and the factors that contribute to its composition are essential aspects that must be taken into account in order to expand our knowledge and design strategies targeting breast milk microbiota to influence maternal and infant health. The objective of this study was to analyze the effects of food and nutritional status during gestation and the first trimester of lactation on the microbiota of breast milk in a group of healthy lactating women in Colombia.
2. Materials and Methods
An observational, descriptive, and cross-sectional study was carried out on a group of breastfeeding women who had prenatal care in two health institutions in eastern Antioquia, Colombia.
2.1. Subjects
The sample consisted of 30 women in their first trimester of lactation who were selected at convenience and who had a prenatal medical history in the referenced institutions (Figure 1).
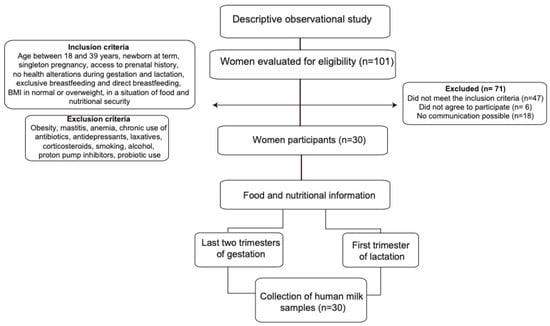
Figure 1.
Flow diagram summarizing the identification and selection of participants and the methodology process.
The criteria for the selection of mothers were the following: breastfeeding women between 18 and 39 years of age who had a singleton pregnancy, without diseases or complications during gestation and postpartum (anemia, diabetes, hypertensive disorders, among others), with adequate BMI or overweight, at least three prenatal controls, with food security at home according to the Latin American and Caribbean Food Security Scale (ELCSA) [14], who had a full-term newborn, and who exclusively breastfed their child. Women with obesity (BMI > 30 kg/m2) or thinness (<18.5 kg/m2) and women who, during gestation, lactation, and up to 30 days prior to data collection, chronically consumed medications or other substances such as antibiotics, antidepressants, laxatives, corticosteroids, cigarettes, alcohol, proton pump inhibitors, and probiotics were excluded.
The participants were identified at the health institution; then, their medical history was reviewed, and if they met the inclusion criteria, they were contacted to sign the informed consent form and to schedule two visits for data collection.
2.1.1. Collection of Anthropometric Data
The women’s weight and height were measured using digital scales and a portable measuring rod, and with these data the BMI (BMI = kg/m2) was calculated, which according to the World Health Organization (WHO), was classified as adequate (≥18.5 to <25 kg/m2) or overweight (≥25 kg/m2 to <30 kg/m2). To collect anthropometric information in the gestational stage, the participants’ clinical history was asked for in terms of their pregestational maternal weight and the weight reported in the prenatal controls. Total weight gain during gestation was determined by the difference between the pregestational weight and the last weight reported in their clinical history. Adequate gestational weight gain was considered based on the adjusted allowed ranges for the Pregestational Body Mass Index (PBMI) according to the references of the Institute of Medicine of the United States (IOM): underweight 12.5 and 18 kg; normal weight 11.5–16 kg; overweight 7 and 11.5 kg [15]; weight gain was classified as excessive when it exceeded these ranges and insufficient when it did not reach the minimum expected. Newborn weight and length data were taken; birth weight was classified as insufficient at 2500–2999 g and adequate between 3000 and 3999 g [16].
2.1.2. Evaluation of Food Consumption
Two 24 h recalls (R24h) were applied to each participant, using the adjusted multi-step technique on non-consecutive days, and were distributed during the week: a procedure necessary to adjust for intra- and inter-individual variability [17]. To determine the amount of food intake, a set of models, geometric figures, and an album of photographs with life-size utensils were used, which are validated for Colombia [18].
To identify the aspects relating to nutrition during pregnancy, a quantitative frequency of consumption was applied, which was composed of 81 foods selected from the consumption reported in pregnant women in the Food and Nutrition Profile of the Department of Antioquia 2019 [19]. This included foods such as legumes, fruits, and vegetables for their contribution of soluble and insoluble fiber [20]; sources of saturated, unsaturated, and polyunsaturated fatty acids [21] such as lard, vegetable margarine, butter, industrialized sauces, vegetable oil, olive, canola, nuts, and seeds; fermented foods such as yogurt [22]; animal proteins such as beef, pork, chicken, fish, and eggs; industrialized meats; and foods high in simple and ultra-processed carbohydrates [23].
To test the estimation of nutrients from the quantitative frequency of foods, a concordance test was performed between the designed frequency and the R24h in a group of seven pregnant women belonging to the prenatal control program of one of the reference institutions to whom both instruments were applied for subsequent analysis. To estimate these differences, the Wilcoxon signed-rank test, the Hodges-Lehmann test and 95% confidence intervals (95% CI) were applied; to evaluate this correlation, the Biserial Rank Correlation Coefficient (95% CI) was applied and to evaluate the concordance, the Concordance Correlation Coefficient was also used (95% CI) (Table S1). The data collected for this test were not included in the study.
2.1.3. Food Consumption Analysis
For nutrient analysis, the R24h was processed in the Dietary Intake Evaluation software (EVINDI v5) of the School of Nutrition and Dietetics of the University of Antioquia [24], and the database obtained was migrated into the Personal Computer Software for Intake Distribution Estimation (PC-SIDE v1.0) [25], which is available at the Department of Statistics at Iowa State University, Ames IA (United States). For each nutrient, the Estimated Average Requirement (EAR) established in the Recommendations for Energy and Nutrient Intake for the Colombian population was used as a cut-off point. For macronutrients, the Acceptable Macronutrient Distribution Range (%AMDR) was recommended in the national guidelines [26].
The prevalence of the risk of deficiency was accompanied by summary measures such as the minimum, maximum, percentiles, mean, and standard deviation, which were adjusted in PC-SIDE v1.0 [25]. The contribution of nutrients of interest was obtained: calories, proteins, total fat, saturated, monounsaturated, polyunsaturated, cholesterol, total and simple carbohydrates, dietary fiber, zinc, calcium, iron, magnesium, vitamins: B1, B2, B3, B5, B6, B9, B12, A, and C. Data processing and analysis were performed in SPSS v25, EVINDI v5.0 and PC-SIDE v1.0 software.
2.2. Collection of Breast Milk Samples
The samples were collected between 8 and 10 a.m., manually, and from the breast opposite to the last suckling of the newborn or from the breast opposite to the one from which the baby was suckling. The nipple and the surrounding area were cleaned with sterile gauze and 0.5% chlorhexidine. Between 15 and 20 mL of milk were collected, discarding the first drops, and the milk was deposited in sterile tubes free of RNAses and DNAses (Corning Incorporated, Corning, NY, USA). After the collection process, the milk samples were transported in a cooler with dry ice to the Food and Human Nutrition Research Laboratory, University of Antioquia, Colombia (transport time less than 1 h), where they were stored at −80 °C for subsequent DNA extraction.
2.3. Extraction, Quantification and Sequencing of Barcoded Amplicons on the Illumina MiSeq Platform
The total genomic DNA extraction was performed from 6 to 10 mL of breast milk using the GeneJET Genomic DNA Purification kit (Thermo Scientific) at the molecular biology laboratory of the Faculty of Agricultural Sciences, University of Antioquia, Colombia. The extracted DNA was quantified using the 260/280 optical density ratio by UV absorbance methods (NanoDrop, Thermo Scientific, Wilmington, NC, USA). Hypervariable regions V3-V4 of the 16S ribosomal ribonucleic acid (rRNA) gene were amplified using 1 μL of DNA (25 ng on average). A Polymerase Chain Reaction (PCR)was performed in 27 cycles within the following reaction conditions: 95 °C for 20 s, 55 °C for 20 s, and 72 °C for 20 s. The primers used were Bakt_341F: CCTACGGGGGNGGCWGCAG and Bakt_805R: GACTACHVGGGGGTATCTAATCC, and each sample was assigned a unique 6-base pair (bp) barcode. Barcoded PCR products were purified from triplicate reactions with an agarose gel band purification kit (Illustra GFX PCR dna and gel Band Purification Kit, GE Healthcare, UK). Equimolar concentrations of PCR amplicons were quantified by fluorometric methods (Qubit 3.0—Thermo Fisher Scientific, Waltham, MA, USA). Purified amplicons were pooled in equimolar amounts (~50 ng per sample) for library preparation. Sequencing was performed using the Illumina MiSeq paired-end platform (2 × 300 base pairs) with 100,000 reads for each library (Macrogen, Korea).
2.4. Analysis of Microbiota Data
These sequences were demultiplexed, thus removing the primer sequences and associated barcodes. The bioinformatics analysis of sequences was performed in QIIME2 (Quantitative Insights into Microbial Ecology) v2019.7 software [27]. The DADA2 method [28] was used to detect and correct sequencing noise, remove chimeric sequences, and cluster sequences into amplicon sequencing variants (ASVs). To classify these sequences according to their taxonomic information, the qiime feature-classifier plugin was employed using the Vsearch alignment method [29] with the SILVA v138 database [30] at a 99% sequence identity. Subsequently, the BIOM (Biological Observation Matrix Data) table (frequency table of each ASV with its taxonomic assignment), the phylogenetic tree, and the metadata of samples with the information of variables under study were imported for analysis in the RStudio v1.1.453 software [31].
2.5. Statistical Analysis
For the descriptive analysis of sociodemographic, gestational, anthropometric, and food consumption characteristics, absolute and relative distributions and summary indicators such as the arithmetic mean and standard deviation were used. To compare the diversity and richness of the bacterial community, alpha diversity was analyzed using four indices: the Chao1 index, which estimates the richness of taxa in a community [32], the Shannon index, which allows an evaluation of the heterogeneity of a community based on the number of species present and their relative abundance [33]; Simpson’s inverse index, also known as the dominance index, which allows measurements of the richness of organisms [34] and the PD index, which describes diversity based on phylogenetic distances [35]. Comparisons between these groups were performed using non-parametric tests: the Wilcoxon rank test or Kruskal–Wallis. For beta diversity, principal coordinate analysis (PCoA) was performed to identify a clustering pattern of microbial compositions as a function of the variables of interest using permutation-based methods (PERMANOVA, permuted multivariate analysis of variance, using the Adonis2 library) for weighted and unweighted UniFrac distances [36]. Diversity analyses were performed using the Phyloseq [37] and Microbiome [38] packages of the Rstudio v4.1.2 software [31].
Correlations between the most abundant and literature-reported bacterial genera and nutrient intake values were explored using Spearman’s correlation coefficient, which was visualized by a heatmap in the RStudio program using the Corrplot package [39]. Through a mixed linear model (LMM), the association of the most abundant ASVs transformed logarithmically with the individual variables registered in the metadata and were evaluated using the RStudio’s lme4 and nlme packages [40,41]. Later, with the ASVs that showed a significant association (p < 0.05), the model was adjusted to control the effects of other variables so that the resulting variation explained was independent of other variables and not subject to confusion by the correlated variables; each variable was the fixed factor and the others entered as covariates.
The study followed the ethical considerations established in the Declaration of Helsinki and was validated by the Bioethics Committee of the Faculty of Dentistry of the University of Antioquia: concept No. 66-2020, Act No. 10 of 2020. Informed consent was obtained from all participants.
2.6. Data Availability Statement
Sequence reads were deposited in the European Nucleotide Archive (ENA) via the project number PRJEB59523.
3. Results
3.1. Sociodemographic, Gestational and Anthropometric Characteristics
The average age of the lactating women was 25 ± 6 years; 73% had the presence of a partner, 37% had finished higher education, 57% lived in a rural area, and 53% belonged to the subsidized health regime. Of the total number of participating women, 60% did not plan their pregnancy, 53% had between 1 and 2 children, 80% attended more than six prenatal check-ups, and 43% were first-time mothers.
In relation to the anthropometric characteristics, the average weight of the lactating women was 60.8 ± 7.9 kg, 60% presented a normal BMI %, and the majority presented a height ≥ 1.55 m (63%). In relation to gestation, most of the women started with a BMI in adequacy (70%), and at the end, the average weight gained was 12.2 ± 3.6 kg; 43% presented inadequate weight gain due to deficiencies, and 13% presented with an inadequate gain due to excess. More than half of them had a vaginal delivery (77%); the newborns presented an average of 3299 ± 275 g and 49.8 ± 1.7 cm at birth, were breastfed in the first hour of life 87%, and were male 63% (Table 1).

Table 1.
Sociodemographic, gestational, and anthropometric characteristics of the breastfeeding women.
3.2. Nutrient Intake
The mean adjusted energy intake was 2185 calories (Standard Deviation (SD) = 399), the prevalence of risk of deficiency in usual energy intake was 43% (SD = 0.11), and the risk of excess was 16% (SD = 0.12). Regarding the consumption of macronutrients, the prevalence of the risk of deficiency in the usual intake of proteins was 99% (SD = 0.03), the consumption above the reference value of total fat (>35% AMDR) was 3% (SD = 0.12) and of total carbohydrates (>65% AMDR) was 1% (SD = 0.06). Regarding the consumption of nutrients of interest, the mean adjusted intake of cholesterol was 493 mg (SD = 145), the consumption above the reference value (>10% ADMR) of saturated fat was 86% (SD = 0.18), and for simple carbohydrates was 72% (SD = 0.10); 97% of the women did not reach the recommended fiber intake (Table 2).
Table 2.
Distribution and adequacy of energy intake, the percentage of individuals with intakes above and below the Acceptable Macronutrient Distribution Range (% AMDR) and prevalence of risk of deficiency for the usual intake of protein, vitamins and minerals.
In relation to micronutrient intake, the highest prevalence in the risk of deficiency of usual intake was presented for folic acid at 87% (SD = 0.10), vitamin C at 65% (SD = 0.10), vitamin B6 at 60% (SD = 0.11), thiamine at 57% (SD = 0.17), magnesium at 53% (SD = 0.10), zinc at 52% (SD = 0.09), niacin at 52% (SD = 0.10) and vitamin A at 50% (SD = 0.12). By contrast, the lowest prevalence in the risk of deficiency of usual intake was presented in iron intake 9.1% (SD = 0.10), vitamin B12 7.3% (SD = 0.10), riboflavin 0.6% (SD = 0.04) and the prevalence of a low risk of deficiency in pantothenic acid intake was 18.8% (SD = 0.10) as presented in Table 2. Regarding the consumption of supplements during gestation, all participants consumed iron and folic acid supplements 97%, which was not the case with calcium supplementation, where only 37% reported daily consumption; however, it should be noted that due to the consumption of dairy products, the risk of calcium deficiency was low.
In the survey of the mother’s food intake during gestation, it was found that the median energy intake was 2.553 calories (median absolute deviation, MAD = 597.5), protein 94 g (MAD = 24.5), total fat 71 g (MAD = 17.1), carbohydrates 379 g (MAD = 97), simple carbohydrates 76 g (MAD = 36.1) and dietary fiber 24 g (MAD = 8.1). Regarding the intake of nutrients of interest, the median intake of saturated fat was 28 g (MAD = 6.95), and simple carbohydrates was 76 g (MAD = 36.1); for micronutrient intake, the highest median intakes during gestation were for vitamin A intake 1394.5 ER (MAD = 443.5) and folic acid 1461.5 mg (MAD = 257) Table 3.
Table 3.
Distribution of energy and nutrient intake during pregnancy.
3.3. Bioinformatic Analysis of the Milk Microbiota
After filtering, merging, and checking for chimera sequences of the 16S RNA gene, in the V3-V4 region, from the 30 samples collected, a total of 2,940,975 sequences were obtained. The sequencing depth of the data processed by the DADA2 method [28] ranged from 56,744 to 126,815 sequences per sample (Table S2). Rarefaction curves showed the number of taxa (richness or alpha diversity) as a function of the sample size or the number of reads. Most samples reached the plateau effect, indicating that the diversity of all sequences obtained was sampled (Figure S2).
3.4. Characterization of the Milk Microbiota
In the characterization of the microbiota of breast milk samples from lactating women in Colombia, 25 bacterial phyla were found, the most abundant being: Firmicutes (69.5%), Actinobacteria (10%), Proteobacteria (9.6%), and Bacteroidetes (7.6%). The bacterial phyla identified are listed in Figure S1.
Regarding the bacterial genera, 644 were detected, with the most abundant being Streptococcus spp. (32%), Staphylococcus spp. (17.3%), Corynebacterium spp. (5.1%) and Veillonella spp. (3.1%). Ten genera were identified with a relative abundance between 1.2% and 2.6%, Bacteroides spp. (2.6%), Lactobacillus spp. (2.4%), Bacillus spp. (1.9%), Rothia spp. (1.8%), Methylobacterium spp. (1.6%), Clostridum sensu stricto 1 spp. (1.5%), Pseudomonas spp. (1.4%), Fusobacterium spp. (1.4%), Gemella spp. (1.3%) and Prevotella spp. (1.3%) (Figure 2).
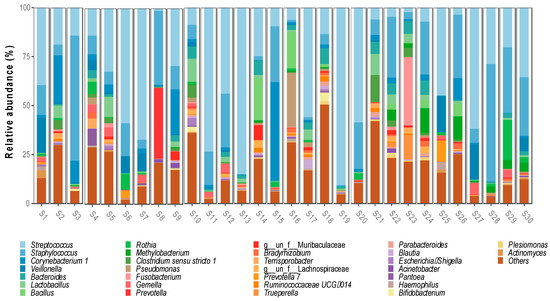
Figure 2.
Bacterial genera identified in breast milk microbiota.
Differences in Alpha and Beta Diversity in Relation to the Variables under Study
A trend toward higher bacterial richness and diversity was observed in the milk samples from women with a C-section delivery (Chao 1 p = 0.022; PD p = 0.03) (Figure 3A) and those who had a direct employment relationship or through a family member (Chao1 p = 0.029; PD p ≤ 0.01) (Figure 3B). No differences were found according to the area of residence, maternal age, level of schooling, the number of previous pregnancies, or the sex of the infant; however, it was identified that breast milk microbiota from women with male infants showed a tendency to have a greater richness and diversity (Chao1 p = 0.74; PD p = 0.06) (Figure 3C). In newborns with insufficient birth weight, there was also a tendency for a lower richness and diversity in the microbiota compared to those with an adequate birth weight (Chao1 p = 0.99; PD p = 0.84) (Figure 3D).
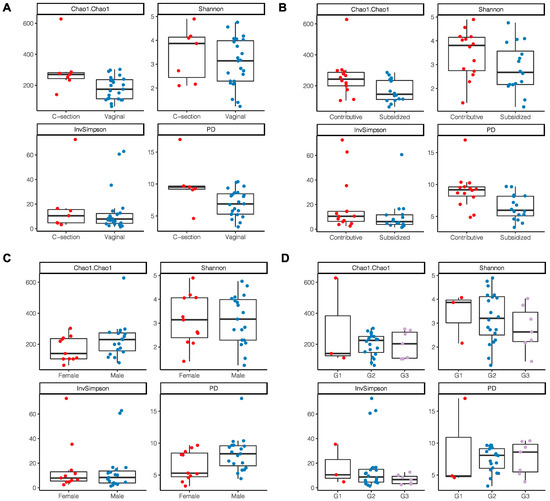
Figure 3.
Alpha diversity indices of breast milk microbiota. (A) Type of delivery; (B) Employment relationship; (C) Baby’s gender; (D) Birth weight where G1: birth weight of 2700 g and <3000 g; G2: 3000 g and 3500 g; G3: >3500 g.
According to the nutritional status by anthropometric indicators, a tendency to have a higher alpha diversity through the Shannon index and InvSimpson index was observed in women with an adequate BMI without statistical differences (Shannon p = 0.22; InvSimpson p = 0.18) (Figure 4A); a lower richness and diversity was also observed in those women who had excessive gestational weight gain (Chao1 p = 0.51; PD p = 0.96) (Figure 4B).
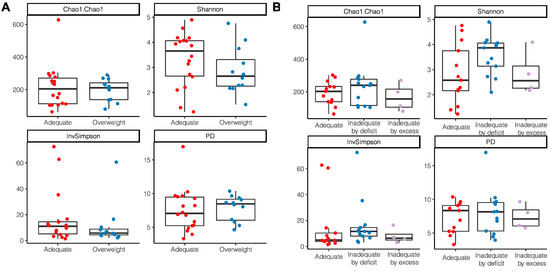
Figure 4.
Alpha diversity indices of breast milk microbiota in relation to anthropometric indicators of nutritional status. (A) BMI of breastfeeding woman; (B) Gestational weight gain.
The principal coordinate analysis (PCoA) was performed to identify a clustering pattern of microbial composition based on the weighted UniFrac distances, where the distance represented the difference between microbial communities, taking into account phylogenetic distances and unweighted UniFrac where they are not taken into account. Based on the weighted UniFrac distances, the beta diversity of breast milk microbiota presented differences according to gestational weight gain (PERMANOVA p = 0.033). The pairwise beta-diversity comparisons between groups showed significant overall differences across the groups, with higher distance dissimilarities among groups belonging to inadequacies by deficiencies and excess, which was observed when compared to the reference adequate. The variables under analysis explained the variability of the microbiota in 63.5% for the weighted UniFrac distances and 11.8% for the unweighted UniFrac distances (Figure 5).
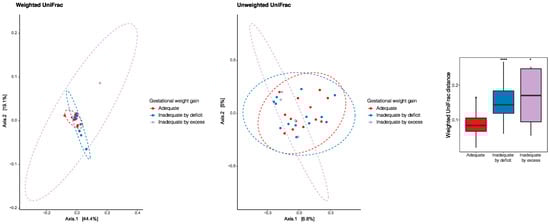
Figure 5.
Principal coordinate analysis (PCoA) to identify a clustering pattern of microbial composition based on weighted and unweighted UniFrac distances and according to gestational weight gain. Pairwise beta diversity dissimilarities assessed by Unifrac distances and represented by a boxplot (* p < 0.05, **** p < 0.0001, Reference group = Adequate).
3.5. Relationship of Nutrient Intake during Lactation with the Microbiota of Breast Milk
The intake of macro and micronutrients during lactation showed positive correlations with the microbiota, which meant that the higher the intake of a nutrient, the higher the abundance of a bacterial genus. In relation to macronutrient intake, a positive correlation was identified between the consumption of simple carbohydrates and Enterobacter spp. (rho = 0.50, p ≤ 0.01); on the other hand, the intake of total fat (rho = 0.39, p = 0.03), saturated fat (rho = 0.38, p = 0.03), and monounsaturated fat (rho = 0.42, p = 0.02) showed a positive correlation with the genus Eubacterium spp. (Figure 6).
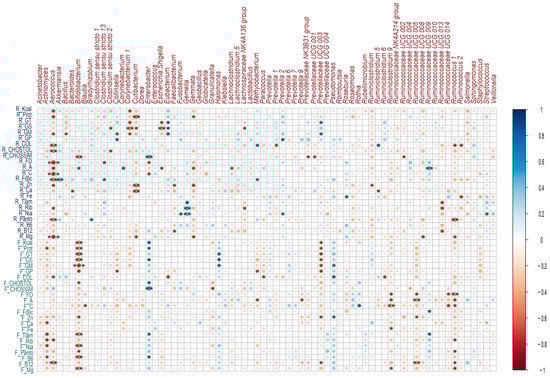
Figure 6.
Correlations between breast milk microbial genera and nutrient intake during lactation and gestation. Heatmaps of Spearman rank correlations. Significant correlations (* p < 0.05, ** p ≤ 0.01, *** p ≤ 0.001). Blue circles represent positive correlations, whereas red circles show negative correlations. Note: the letter F and R on the left side of the heat map refers to Food Consumption Frequency and 24 h recall, respectively.
Regarding micronutrient intake, a positive correlation was identified between folic acid intake and Akkermansia spp. (rho = 0.47, p ≤ 0.01); between B complex vitamins such as B1 (rho = 0.45, p = 0.01), B2 (rho = 0.51, p ≤ 0.01), B3 (rho = 0.46, p ≤ 0.01) and the genus Gemella spp.; as well as vitamin A intake and the genera Bifidobacterium spp. (rho = 0.36, p = 0.047), Corynebacterium spp. (rho = 0.43, p = 0.01) and Ruminococcus UCG.009 spp. (rho = 0.49, p ≤ 0.01) (Figure 6).
There were negative or inverse correlations where the higher the consumption of a nutrient, the lower the abundance of a bacterial genus or in the opposite direction. Among these, several macro and micronutrients presented negative correlations with the genus Aerococcus spp.; among this was the consumption of the total protein (rho = −0.45, p = 0.01), total carbohydrates (rho = −0.47, p ≤ 0.01), cholesterol (rho = −0.49, p ≤ 0.01), dietary fiber (rho = −0.61, p ≤ 0. 01), vitamin A (rho = −0.46, p = 0.01), vitamin C (rho = −0.58, p ≤ 0.01), folic acid (rho = −0.51, p ≤ 0.01), pantothenic acid (rho = −0.49, p ≤ 0.01), magnesium (rho = −0.58, p ≤ 0.01) (Figure 6).
Saturated fat intake showed a negative correlation with several bacterial genera: Corynebacterium 1 spp. (rho = −0.49, p ≤ 0.01), Cutibacterium spp. (rho = −0.36, p = 0.047),
Escherichia-Shigella spp. (rho = −0.51, p ≤ 0.01) and Lachnospiraceae NK4A136 (rho = −0.36, p = 0.049); a negative correlation was also observed between the intake of simple carbohydrates and the genus Bifidobacterium spp. (rho = −0.51 p ≤ 0.01), as well as dietary fiber and Enterobacter spp. (rho = −0.36, p = 0.047) (Figure 6).
3.6. Relationship of Nutrient Intake during Gestation with Breast Milk Microbiota
Positive correlations were identified between the intake of macronutrients such as simple carbohydrates (rho = 0.55, p ≤ 0.01), total carbohydrates (rho = 0.39, p = 0.02), saturated fat (rho = 0.39, p = 0.03) and the total protein (rho = 0.3, p = 0.04) with the genus Enterobacter spp. Saturated fat intake was also positively correlated with the genus Halomonas spp. (rho = 0.41, p = 0.02). Regarding micronutrient intake, positive correlations were observed between zinc intake and Pseudomonas spp. (rho = 0.38, p = 0.03), vitamin C and Rothia spp. (rho = 0.44, p = 0.01) (Figure 6).
Protein intake (rho = −0.46, p = 0.01) and saturated fat (rho = −0.52, p ≤ 0.01) were negatively correlated with Bifidobacterium spp.; on the other hand, dietary fiber intake was negatively correlated with Ruminiclostridium 9 spp. (rho = −0.40, p = 0.02), Ruminococcaceae UCG.005 (rho = −0.39, p = 0.03), Ruminococcaceae UCG.014 (rho = −0.39, p = 0.02) and Ruminococcus 1 spp. (rho = −0.47, p ≤ 0.01). Other correlations were identified and are shown in Figure 6.
3.7. Association of Breast Milk Microbiota with Variables
Through the mixed linear model, the demographic, biochemical, and clinical variables of the study were integrated with the most abundant ASVs. High specificity was identified, indicating that ASVs could be strictly associated with each variable. The employment relationship, birth weight, and gestational weight gain showed the highest number of associated ASVs. After adjusting the model (with the ASVs that showed a significant association (p < 0.05), the model was fitted to control the effects of other variables), a significant decrease in the Peptococcus spp. was found in vaginal delivery compared to C-section delivery; a significant increase in Eubacterium spp. was found in the overweight category during lactation compared to adequate BMI; Aquabacterium spp., Acinetobacter, Lawsonella spp., and Chryseobacterium spp. were found to be in a higher proportion in samples from women with inadequate gestational weight by deficiencies compared to adequacies (Table 4).
Table 4.
Interaction between the most frequent ASVs (p < 0.05) and analyzed variables.
4. Discussion
The results of this research show that maternal nutritional status and the diet of women during gestation and lactation could modulate the microbiota of breast milk. Excessive gestational weight gain, low micronutrient intake, and a high intake of simple sugars and saturated fat could impact the content of bacterial genera that is of interest for infant health, while the consumption of micronutrients of interest, such as folates, could contribute to the presence of bacteria with probiotic potential.
Four dominant phyla were found in this sample in the order: Firmicutes, Actinobacteria, Proteobacteria, and Bacteroidetes. Investigations such as that of Urbaniak et al. [42] in breast milk from 39 Canadian Caucasian women and Togo et al. [43], in a systematic review, included a total of 15,849 samples from 38 countries and reported Proteobacteria and Firmicutes as dominant phyla in breast milk, while Actinobacteria and Bacteroidetes occurred in lower relative abundances.
A total of 644 bacterial genera were identified, which is higher than the genera reported by Zimmermann et al. [44] in a systematic review that included 44 studies and 2655 women from 20 countries, in which 590 genera were identified. The results at the genus level were consistent with those found by Padilhaet al. [8] in the milk samples from Brazilian women, who reported Streptococcus, Staphylococcus, and Corynebacterium as dominant genera. This was also reported by Kim SY et al. [45] in Korean women; specifically, Staphylococcus spp. and Streptoccocus spp. were reported as the dominant genera [46], which could suggest that regardless of the geographical location of the lactating woman, both genera are represented in this fluid and their colonization could be linked to the retrograde flow from the oral cavity of the infant [47]. Some Streptococcus spp. and Staphylococcus spp. species have been associated with infant health by preventing the colonization of pathogens such as Staphylococcus aureus, a risk factor for sepsis in newborns, through mechanisms including the release of peptides with antimicrobial properties and hydrogen peroxide production [48,49], which is of interest to the promotion of breastfeeding in all areas, including the clinical setting.
The genera Lactobacillus spp. and Bifidobacterium spp. are important for infant health. In this study, Lactobacillus spp. presented a relative abundance of 2.4%, which is higher than that reported in breast milk samples from Brazilian women (0.06%) [8] and lower than that reported in European (3.2%) [7] and Canadian women (3%) [42]. The presence of Lactobacillus spp. in breast milk is important for its probiotic potential in relation to health from the first years of life [50]. Breastfed infants, unlike those who receive infant milk formula, present a microbiota richer in Lactobacillus spp. and bifidobacterial; however, in this study, the abundance of bifidobacteria was low in agreement with that documented in other works (1.4%) [7].
Several factors are involved in the modulation of the breast milk microbiota. The relationship between microbiota and type of delivery is controversial since some studies have not reported significant differences [10,42,51] while other reports have; one example is Khodayar et al. [52], who identified higher abundances of total bacteria in the colostrum and transitional milk of women who had a cesarean delivery, and Cortés et al. [7] who determined a higher microbial richness in the milk of women who had undergone a cesarean delivery, producing results consistent with those found in the present study.
Some hypotheses about the origin of the microbiota of breast milk have been documented: the retrograde translocation of bacteria from the oral cavity of the infant, the mother’s skin, the use of breast pumps, the oro-mammary route, and the entero-mammary route, the latter explaining how some bacteria present in the maternal gut and how their metabolites could reach the mammary gland during late pregnancy and lactation through a process mediated by immune cells [47,53], thus shaping the breast milk microbiome. This provides a transient microbiota in the infant with great influence on the maturation of the immune system in extrauterine life [3]. Therefore, the intestinal microbiome of women during pregnancy and lactation could modulate the microbiota of human milk, suggesting the importance of an adequate diet and nutritional status of the mother to achieve a healthy microbiota that can subsequently colonize the breast milk that the infant receives.
In relation to maternal nutritional status, weight gain during gestation is important to ensure fetal growth and development. Weight gains that exceed or fall below the established recommendations have been associated with perinatal complications. In this study, it was observed that breast milk samples from women with gestational weight gain above the IOM recommendations [15] showed a tendency to lower alpha diversity: a finding that coincided with that reported by Cabrera et al. [54], who identified that women with an obese BMI during lactation and excessive weight gain during gestation tended to have a less diverse bacterial community in their milk, with a higher relative abundance of Staphylococcus spp., and lower relative abundance of Bifidobacterium spp. Contrary to what was reported by Lundgren et al. [10], when analyzing 155 breast milk samples, they observed greater alpha diversity in the milk microbiota of women with higher gestational weight gain. Other investigations have reported no differences in relation to maternal weight [55]. Our findings highlight the importance of nutritional surveillance for the control of gestational weight gain during pregnancy, not only because of its multiple implications for the health of the mother-child binomial [56] but also because of the impact it could have on the microbiota and early colonization of the infant.
According to the results obtained from our study, it was found that the consumption of simple carbohydrates during gestation and lactation was positively correlated with Enterobacter spp., while the intake of dietary fiber during the first trimester of lactation presented a negative correlation, which is important since this bacterial genus is characterized by opportunistic pathogenic species, which are associated with nosocomial diseases and hospital infections [57]. On the other hand, the intake of simple carbohydrates during lactation was negatively correlated with Bifidobacterium spp., an important bacterial genus for infant health, which is considered a primary colonizer of the gastrointestinal tract of the infant due to its ability to take advantage of the oligosaccharides in breast milk; its reduction has been associated with the development of metabolic diseases [58].
The above is relevant, finding that 72% of lactating women participating in this study exceeded the %AMDR [26] established in this country for simple carbohydrates, which was represented mainly by the intake of “panela”(raw sugar cane cubes, which is a typical product of some Colombian regions), sugar and sugary drinks. On the contrary, it is noteworthy that the intake of fiber was very low, and 97% of women did not achieve the recommendations.
Other relationships of interest have identified the consumption of folic acid during lactation was positively correlated with Akkermansia spp.: a genus that is considered a potential new generation probiotic with biotherapeutic actions for health in different metabolic disorders and other health alterations associated with intestinal dysbiosis [59]. In this study, it was identified that the main food sources of folate consumed by lactating women were cereals and fortified flours. In addition, some women reported continuing the consumption of their folic acid supplementation; however, 87% presented a risk of deficiency in the usual intake of this nutrient. Therefore, the consumption of food sources of this micronutrient, including legumes and green leafy vegetables, as well as folic acid supplementation in women at risk of deficiency, could be a dietary intervention strategy that favors the presence of probiotic bacteria such as Akkermansia spp. in breast milk.
In this group of lactating women, a high prevalence in risk of deficiency in the usual intake of micronutrients such as vitamin A, C, B6, B1, B3, zinc, and magnesium were identified, and it was also found that the consumption of foods belonging to fats, fruits and vegetables, meats, eggs, legumes, nuts, and seeds did not reach the recommendation proposed in the Dietary Guidelines for lactating women in Colombia [60]. This could negatively impact the microbial configuration of the mother and, therefore, that of the newborn. In Colombia, health programs have focused on nutrition during pregnancy, but the nutrition of lactating women has not been attended to, which has serious repercussions on the characteristics of human milk, its richness, and bacterial diversity, which is essential for the newborn.
Although this group of women enjoyed food and nutrition security at home, they presented an inadequate intake of macro and micronutrients, which may be conditioned by food choices that do not contribute to a diverse, healthy diet and favor the consumption of risk nutrients such as simple carbohydrates. The results of this and other research make it relevant to focus on lactating women because of the implications that their nutrition has on the milk microbiota and maturation of the immune system in the first years of life.
5. Limitations of the Study
During gestation, the use of the frequency of food consumption generated an overestimation of calcium intake. This is the first observational study conducted in this country, and future trials and intervention studies are needed to validate our findings.
6. Conclusions
This study is the first in Colombia to explore the relationship between nutritional status and feeding during gestation and lactation with the composition of breast milk microbiota. In this group, we observed that the diet of women could be related to genera of interest for maternal and child health; we observed a negative correlation between the lactation intake of simple carbohydrates and pregnancy intake with saturated fat and the genus Bifidobacterium spp.; furthermore, a positive correlation was identified between the lactation intake of folic acid and Akkermansia spp. These results contribute to new knowledge in maternal and infant nutrition and favor the bacterial ecosystem through interventions that contribute to healthy food choices and the feeding patterns of women during the reproductive cycle.
Supplementary Materials
The following supporting information can be downloaded at: https://www.mdpi.com/article/10.3390/microorganisms11071812/s1. Table S1: concordance test to assess reproducibility between 24 h recall and Food Consumption Frequency; Table S2: initial and post-filter sequencing readings for each sample. Table obtained from QIIME2 software v2019.7; Figure S2: Rarefaction curves. The horizontal axis represents the number of sequencing reads sampled and the vertical axis the number of taxa reached to detect for each sample; Figure S1: Bacterial phyla identified in breast milk microbiota.
Author Contributions
Conceptualization, D.C.L.-S.; Data curation, D.C.L.-S. and V.M.; Formal analysis, D.C.L.-S. and V.M.; Funding acquisition, S.L.R.-M.; Investigation, D.C.L.-S. and L.B.P.; Methodology, D.C.L.-S., V.M., N.C.G., L.B.P., O.I.M.-C. and S.L.R.-M.; Project administration, D.C.L.-S. and S.L.R.-M.; Resources, S.L.R.-M.; Software, D.C.L.-S., V.M. and N.C.G.; Supervision, S.L.R.-M.; Validation, D.C.L.-S. and N.C.G.; Visualization, D.C.L.-S. and V.M.; Writing—original draft, D.C.L.-S. and L.B.P.; Writing—review and editing, D.C.L.-S., V.M., O.I.M.-C., L.B.P. and S.L.R.-M. All authors have read and agreed to the published version of the manuscript.
Funding
This research was funded by the University of Antioquia through resources from the Committee for the Development of Research -CODI- Call for Research Projects Regionalization 2021-Project 2021-42724 and the EXITO Colombia Foundation: Project 2021-42724.
Data Availability Statement
Not applicable.
Acknowledgments
To the participating health institutions: Hospital San Juan de Dios de Rionegro and ESE Nuestra Señora de la Candelaria of the municipality of Guarne Antioquia, Colombia.
Conflicts of Interest
The authors declare no conflict of interest. The funders had no role in the design of the study; in the collection, analysis, or interpretation of data; in the writing of the manuscript; or in the decision to publish the results.
References
- Bäckhed, F.; Roswall, J.; Peng, Y.; Feng, Q.; Jia, H.; Kovatcheva-Datchary, P.; Li, Y.; Xia, Y.; Xie, H.; Zhong, H.; et al. Dynamics and Stabilization of the Human Gut Microbiome during the First Year of Life. Cell Host Microbe 2015, 17, 690–703. [Google Scholar] [CrossRef]
- Robertson, R.C.; Manges, A.R.; Finlay, B.B.; Prendergast, A.J. The Human Microbiome and Child Growth—First 1000 Days and Beyond. Trends Microbiol. 2019, 27, 131–147. [Google Scholar] [CrossRef]
- Toscano, M.; De Grandi, R.; Grossi, E.; Drago, L. Role of the Human Breast Milk-Associated Microbiota on the Newborns’ Immune System: A Mini Review. Front. Microbiol. 2017, 8, 2100. [Google Scholar] [CrossRef]
- Hou, K.; Wu, Z.-X.; Chen, X.-Y.; Wang, J.-Q.; Zhang, D.; Xiao, C.; Zhu, D.; Koya, J.B.; Wei, L.; Li, J.; et al. Microbiota in Health and Diseases. Signal Transduct. Target Ther. 2022, 7, 135. [Google Scholar] [CrossRef]
- Notarbartolo, V.; Giuffrè, M.; Montante, C.; Corsello, G.; Carta, M. Composition of Human Breast Milk Microbiota and Its Role in Children’s Health. Pediatr. Gastroenterol. Hepatol. Nutr. 2022, 25, 194. [Google Scholar] [CrossRef]
- Correa, Y.N.; Roldán-Pérez, S.; Montoya, O.I.; Moreno, P.A.; Castillejo, N.P.; Velásquez-Restrepo, A.; Vargas-Buitrago, A. Characterization of the Microbiota of Donor Breast Milk and the Feces of Their Infants Residing in Antioquia, Colombia. Rev. Fac. Cienc. 2023, 12, 6–23. [Google Scholar] [CrossRef]
- Cortes-Macías, E.; Selma-Royo, M.; García-Mantrana, I.; Calatayud, M.; González, S.; Martínez-Costa, C.; Collado, M.C. Maternal Diet Shapes the Breast Milk Microbiota Composition and Diversity: Impact of Mode of Delivery and Antibiotic Exposure. J. Nutr. 2021, 151, 330–340. [Google Scholar] [CrossRef]
- Padilha, M.; Danneskiold-Samsøe, N.B.; Brejnrod, A.; Hoffmann, C.; Cabral, V.P.; Iaucci, J.D.M.; Sales, C.H.; Fisberg, R.M.; Cortez, R.V.; Brix, S.; et al. The Human Milk Microbiota Is Modulated by Maternal Diet. Microorganisms 2019, 7, 502. [Google Scholar] [CrossRef]
- Williams, J.E.; Carrothers, J.M.; Lackey, K.A.; Beatty, N.F.; York, M.A.; Brooker, S.L.; Shafii, B.; Price, W.J.; Settles, M.L.; McGuire, M.A.; et al. Human Milk Microbial Community Structure Is Relatively Stable and Related to Variations in Macronutrient and Micronutrient Intakes in Healthy Lactating Women. J. Nutr. 2017, 147, 1739–1748. [Google Scholar] [CrossRef]
- Lundgren, S.N.; Madan, J.C.; Karagas, M.R.; Morrison, H.G.; Hoen, A.G.; Christensen, B.C. Microbial Communities in Human Milk Relate to Measures of Maternal Weight. Front. Microbiol. 2019, 10, 2886. [Google Scholar] [CrossRef]
- Fields, D.A.; Demerath, E.W. Relationship of Insulin, Glucose, Leptin, IL-6 and TNF-α in Human Breast Milk with Infant Growth and Body Composition. Pediatr. Obes. 2012, 7, 304–312. [Google Scholar] [CrossRef]
- Isganaitis, E.; Venditti, S.; Matthews, T.J.; Lerin, C.; Demerath, E.W.; Fields, D.A. Maternal Obesity and the Human Milk Metabolome: Associations with Infant Body Composition and Postnatal Weight Gain. Am. J. Clin. Nutr. 2019, 110, 111–120. [Google Scholar] [CrossRef]
- Garcia-Mantrana, I.; Collado, M.C. Obesity and Overweight: Impact on Maternal and Milk Microbiome and Their Role for Infant Health and Nutrition. Mol. Nutr. Food Res. 2016, 60, 1865–1875. [Google Scholar] [CrossRef]
- Food and Agriculture Organization of the United Nations. Escala Lationamericana y Caribeña de Seguridad Alimentaria (ELCSA): Manual de Uso y Aplicaciones; FAO: Rome, Italy, 2012. [Google Scholar]
- Institute of Medicine (US) and National Research Council (US) Committee to Reexamine IOM Pregnancy Weight Guidelines. Weight Gain During Pregnancy; Rasmussen, K.M., Yaktine, A.L., Eds.; National Academies Press: Washington, DC, USA, 2009; ISBN 978-0-309-13113-1. [Google Scholar]
- WHO Expert Committee. Physical Status: The Use of and Interpretation of Anthropometry Report of a WHO Expert Committee Utilisation et Interprétation de l’ Anthropométrie: Rapport d’ Un Comité OMS d’ Experts; World Health Organization: Geneva, Switzerland, 1995. [Google Scholar]
- Ferrari, M. Intake Estimation by Means of a 24-Hour Reminder. Diaeta 2013, 31, 20–25. [Google Scholar]
- Manjarrés Correa, L.M.; Hernandez, J.; Cardenas, D. Métodos Para Precisar La Recolección de La Ingesta Dietética En Estudios Poblacionales. Perspect. Nutr. Hum. 2007, 9, 155–163. [Google Scholar]
- Gerencia de la Seguridad Alimentaria y Nutricional de Antioquia, Escuela de Nutrición y Dietética. Perfil Alimentario y Nutricional de Antioquia; Gobernación de Antioquia, Gerencia de Seguridad Alimentaria y Nutricional-MANÁ: Antioquia, Colombia, 2019.
- Asnicar, F.; Berry, S.E.; Valdes, A.M.; Nguyen, L.H.; Piccinno, G.; Drew, D.A.; Leeming, E.; Gibson, R.; le Roy, C.; Khatib, H.A.; et al. Microbiome Connections with Host Metabolism and Habitual Diet from 1098 Deeply Phenotyped Individuals. Nat. Med. 2021, 27, 321–332. [Google Scholar] [CrossRef]
- Basak, S.; Banerjee, A.; Pathak, S.; Duttaroy, A.K. Dietary Fats and the Gut Microbiota: Their Impacts on Lipid-Induced Metabolic Syndrome. J. Funct. Foods 2022, 91, 105026. [Google Scholar] [CrossRef]
- Lisko, D.; Johnston, G.; Johnston, C. Effects of Dietary Yogurt on the Healthy Human Gastrointestinal (GI) Microbiome. Microorganisms 2017, 5, 6. [Google Scholar] [CrossRef]
- Zinöcker, M.; Lindseth, I. The Western Diet–Microbiome-Host Interaction and Its Role in Metabolic Disease. Nutrients 2018, 10, 365. [Google Scholar] [CrossRef]
- Manjarres, L.M.; Hernandez, J.P.; Cárdenas, D.L. Programa de Evaluación de Ingesta Dietética (EVINDI) v.5; Universidad de Antioquia: Medellín, Colombia, 2015. [Google Scholar]
- Carriquiry, A. PC-SIDE. Available online: https://www.side.stat.iastate.edu/pc-side.php (accessed on 16 June 2022).
- Ministerio de Salud y Protección Social Resolución Número 3803 de 2016. Por La Cual Se Establecen Las Recomendaciones de Ingesta de Energía y Nutrientes RIEN Para La Población Colombiana y Se Dictan Otras Disposiciones; In Resolución; 2016. Available online: https://www.minsalud.gov.co/Normatividad_Nuevo/Resoluci%C3%B3n%203803%20de%202016.pdf (accessed on 15 June 2022).
- Bolyen, E.; Rideout, J.R.; Dillon, M.R.; Bokulich, N.A.; Abnet, C.C.; Al-Ghalith, G.A.; Alexander, H.; Alm, E.J.; Arumugam, M.; Asnicar, F.; et al. Reproducible, Interactive, Scalable and Extensible Microbiome Data Science Using QIIME 2. Nat. Biotechnol. 2019, 37, 852–857. [Google Scholar] [CrossRef]
- Callahan, B.J.; McMurdie, P.J.; Rosen, M.J.; Han, A.W.; Johnson, A.J.A.; Holmes, S.P. DADA2: High-Resolution Sample Inference from Illumina Amplicon Data. Nat. Methods 2016, 13, 581–583. [Google Scholar] [CrossRef]
- Rognes, T.; Flouri, T.; Nichols, B.; Quince, C.; Mahé, F. VSEARCH: A Versatile Open Source Tool for Metagenomics. PeerJ 2016, 4, e2584. [Google Scholar] [CrossRef]
- Glöckner, F.O.; Yilmaz, P.; Quast, C.; Gerken, J.; Beccati, A.; Ciuprina, A.; Bruns, G.; Yarza, P.; Peplies, J.; Westram, R.; et al. 25 Years of Serving the Community with Ribosomal RNA Gene Reference Databases and Tools. J. Biotechnol. 2017, 261, 169–176. [Google Scholar] [CrossRef]
- RStudio Team RStudio: Integrated Development for R. RStudio. Available online: http://www.rstudio.com/ (accessed on 16 June 2022).
- Kim, B.-R.; Shin, J.; Guevarra, R.B.; Lee, J.H.; Kim, D.W.; Seol, K.-H.; Lee, J.-H.; Kim, H.B.; Isaacson, R.E. Deciphering Diversity Indices for a Better Understanding of Microbial Communities. J. Microbiol. Biotechnol. 2017, 27, 2089–2093. [Google Scholar] [CrossRef]
- Fedor, P.J.; Spellerberg, I.F. Shannon–Wiener Index. In Reference Module in Earth Systems and Environmental Sciences; Elsevier: Amsterdam, The Netherlands, 2013. [Google Scholar]
- Grabchak, M.; Marcon, E.; Lang, G.; Zhang, Z. The Generalized Simpson’s Entropy Is a Measure of Biodiversity. PLoS ONE 2017, 12, e0173305. [Google Scholar] [CrossRef]
- Faith, D.P. Quantifying Biodiversity: A Phylogenetic Perspective. Conserv. Biol. 2002, 16, 248–252. [Google Scholar] [CrossRef]
- Lozupone, C.A.; Hamady, M.; Kelley, S.T.; Knight, R. Quantitative and Qualitative β Diversity Measures Lead to Different Insights into Factors That Structure Microbial Communities. Appl. Environ. Microbiol. 2007, 73, 1576–1585. [Google Scholar] [CrossRef]
- McMurdie, P.J.; Holmes, S. Phyloseq: An R Package for Reproducible Interactive Analysis and Graphics of Microbiome Census Data. PLoS ONE 2013, 8, e61217. [Google Scholar] [CrossRef]
- Lahti, L.; Shetty, S. Bioconductor. Available online: https://www.bioconductor.org/packages/release/bioc/html/microbiome.html (accessed on 16 June 2022).
- Wei, T.; Simko, V. R Package “Corrplot”: Visualization of a Correlation Matrix (Version 0.84). Available online: https://github.com/taiyun/corrplot (accessed on 15 June 2022).
- Pinheiro, J.; Bates, D.; DebRoy, S.; Sarkar, D.; EISPACK; Heisterkamp, S.; van Willigen, B.; Ranke, J. R Core Team Linear and Nonlinear Mixed Effects Models. 2022. Available online: https://cran.r-project.org/package=nlme (accessed on 15 June 2022).
- Bates, D.; Mächler, M.; Bolker, B.; Walker, S. Fitting Linear Mixed-Effects Models Using Lme4. arXiv 2014, arXiv:1406.5823. [Google Scholar]
- Urbaniak, C.; Angelini, M.; Gloor, G.B.; Reid, G. Human Milk Microbiota Profiles in Relation to Birthing Method, Gestation and Infant Gender. Microbiome 2016, 4, 1. [Google Scholar] [CrossRef]
- Togo, A.; Dufour, J.-C.; Lagier, J.-C.; Dubourg, G.; Raoult, D.; Million, M. Repertoire of Human Breast and Milk Microbiota: A Systematic Review. Future Microbiol. 2019, 14, 623–641. [Google Scholar] [CrossRef] [PubMed]
- Zimmermann, P.; Curtis, N. Breast Milk Microbiota: A Review of the Factors That Influence Composition. J. Infect. 2020, 81, 17–47. [Google Scholar] [CrossRef] [PubMed]
- Kim, S.Y.; Yi, D.Y. Analysis of the Human Breast Milk Microbiome and Bacterial Extracellular Vesicles in Healthy Mothers. Exp. Mol. Med. 2020, 52, 1288–1297. [Google Scholar] [CrossRef] [PubMed]
- Ma, J.; Palmer, D.J.; Geddes, D.; Lai, C.T.; Stinson, L. Human Milk Microbiome and Microbiome-Related Products: Potential Modulators of Infant Growth. Nutrients 2022, 14, 5148. [Google Scholar] [CrossRef]
- Moossavi, S.; Azad, M.B. Origins of Human Milk Microbiota: New Evidence and Arising Questions. Gut Microbes 2020, 12, 1667722. [Google Scholar] [CrossRef]
- Uehara, Y.; Kikuchi, K.; Nakamura, T.; Nakama, H.; Agematsu, K.; Kawakami, Y.; Maruchi, N.; Totsuka, K. H2O2 Produced by Viridans Group Streptococci May Contribute to Inhibition of Methicillin-Resistant Staphylococcus Aureus Colonization of Oral Cavities in Newborns. Clin. Infect. Dis. 2001, 32, 1408–1413. [Google Scholar] [CrossRef]
- Hardy, B.L.; Bansal, G.; Hewlett, K.H.; Arora, A.; Schaffer, S.D.; Kamau, E.; Bennett, J.W.; Merrell, D.S. Antimicrobial Activity of Clinically Isolated Bacterial Species Against Staphylococcus Aureus. Front. Microbiol. 2020, 10, 2977. [Google Scholar] [CrossRef]
- Łubiech, K.; Twarużek, M. Lactobacillus Bacteria in Breast Milk. Nutrients 2020, 12, 3783. [Google Scholar] [CrossRef]
- Sakwinska, O.; Moine, D.; Delley, M.; Combremont, S.; Rezzonico, E.; Descombes, P.; Vinyes-Pares, G.; Zhang, Y.; Wang, P.; Thakkar, S.K. Microbiota in Breast Milk of Chinese Lactating Mothers. PLoS ONE 2016, 11, e0160856. [Google Scholar] [CrossRef]
- Khodayar-Pardo, P.; Mira-Pascual, L.; Collado, M.C.; Martínez-Costa, C. Impact of Lactation Stage, Gestational Age and Mode of Delivery on Breast Milk Microbiota. J. Perinatol. 2014, 34, 599–605. [Google Scholar] [CrossRef]
- Osorio, L.M.; Umbarila, A.S. Microbiota de La Glándula Mamaria. Pediatria 2015, 48, 1–8. [Google Scholar] [CrossRef]
- Cabrera-Rubio, R.; Collado, M.C.; Laitinen, K.; Salminen, S.; Isolauri, E.; Mira, A. The Human Milk Microbiome Changes over Lactation and Is Shaped by Maternal Weight and Mode of Delivery. Am. J. Clin. Nutr. 2012, 96, 544–551. [Google Scholar] [CrossRef] [PubMed]
- Li, S.-W.; Watanabe, K.; Hsu, C.-C.; Chao, S.-H.; Yang, Z.-H.; Lin, Y.-J.; Chen, C.-C.; Cao, Y.-M.; Huang, H.-C.; Chang, C.-H.; et al. Bacterial Composition and Diversity in Breast Milk Samples from Mothers Living in Taiwan and Mainland China. Front. Microbiol. 2017, 8, 965. [Google Scholar] [CrossRef]
- Catalano, P.M.; Shankar, K. Obesity and Pregnancy: Mechanisms of Short Term and Long Term Adverse Consequences for Mother and Child. BMJ 2017, 356, j1. [Google Scholar] [CrossRef] [PubMed]
- Boucher, H.W.; Talbot, G.H.; Bradley, J.S.; Edwards, J.E.; Gilbert, D.; Rice, L.B.; Scheld, M.; Spellberg, B.; Bartlett, J. Bad Bugs, No Drugs: No ESKAPE! An Update from the Infectious Diseases Society of America. Clin. Infect. Dis. 2009, 48, 1–12. [Google Scholar] [CrossRef]
- Stuivenberg, G.A.; Burton, J.P.; Bron, P.A.; Reid, G. Why Are Bifidobacteria Important for Infants? Microorganisms 2022, 10, 278. [Google Scholar] [CrossRef] [PubMed]
- Kalia, V.C.; Gong, C.; Shanmugam, R.; Lin, H.; Zhang, L.; Lee, J.-K. The Emerging Biotherapeutic Agent: Akkermansia. Indian J. Microbiol. 2022, 62, 1–10. [Google Scholar] [CrossRef]
- Instituto Colombiano del Bienestar Familiar ICBF; Organización de las Naciones Unidas para la Alimentación y la Agricultura FAO. Guías Alimentarias Basadas En Alimentos Para Mujeres Gestantes, Madres En Período de Lactancia, Niños y Niñas Menores de 2 Años Para Colombia; ICBF: Bogotá, Colombia, 2018. [Google Scholar]


Disclaimer/Publisher’s Note: The statements, opinions and data contained in all publications are solely those of the individual author(s) and contributor(s) and not of MDPI and/or the editor(s). MDPI and/or the editor(s) disclaim responsibility for any injury to people or property resulting from any ideas, methods, instructions or products referred to in the content. |
© 2023 by the authors. Licensee MDPI, Basel, Switzerland. This article is an open access article distributed under the terms and conditions of the Creative Commons Attribution (CC BY) license (https://creativecommons.org/licenses/by/4.0/).