Article

One-Step Soft Agar Enrichment and Isolation of Human Lung Bacteria Inhibiting the Germination of Aspergillus fumigatus Conidia

by
Fabio Palmieri
1,*,
Jérémy Diserens
1,
Manon Gresse
1,
Margo Magnin
1,
Julina Helle
1,
Benoît Salamin
1,
Lorenzo Bisanti
1,
Eric Bernasconi
2,
Julie Pernot
2,
Apiha Shanmuganathan
2,
Aurélien Trompette
2,
Christophe von Garnier
2,
Thomas Junier
3,
Samuel Neuenschwander
3,
Saskia Bindschedler
1,
Marco Pagni
3,
Angela Koutsokera
2,
Niki Ubags
2,* and
Pilar Junier
1,*
1
Laboratory of Microbiology, Institute of Biology, Faculty of Science, University of Neuchâtel, 2000 Neuchâtel, Switzerland
2
Division of Pulmonary Medicine, Department of Medicine, Lausanne University Hospital (CHUV), University of Lausanne (UNIL), 1066 Epalinges, Switzerland
3
Vital-IT, Swiss Institute of Bioinformatic (SIB), 1015 Lausanne, Switzerland
*
Authors to whom correspondence should be addressed.
Microorganisms 2024, 12(10), 2025; https://doi.org/10.3390/microorganisms12102025
Submission received: 17 August 2024 / Revised: 24 September 2024 / Accepted: 25 September 2024 / Published: 7 October 2024
(This article belongs to the Section Medical Microbiology)

Abstract

:
Fungi of the genus Aspergillus are widespread in the environment, where they produce large quantities of airborne conidia. Inhalation of Aspergillus spp. conidia in immunocompromised individuals can cause a wide spectrum of diseases, ranging from hypersensitivity responses to lethal invasive infections. Upon deposition in the lung epithelial surface, conidia encounter and interact with complex microbial communities that constitute the lung microbiota. The lung microbiota has been suggested to influence the establishment and growth of Aspergillus spp. in the human airways. However, the mechanisms underlying this interaction have not yet been sufficiently investigated. In this study, we aimed to enrich and isolate bacterial strains capable of inhibiting the germination and growth of A. fumigatus conidia from bronchoalveolar lavage fluid (BALF) samples of lung transplant recipients using a novel enrichment method. This method is based on a soft agar overlay plate assay in which bacteria are directly in contact with conidia, allowing inhibition to be readily observed during enrichment. We isolated a total of five clonal bacterial strains with identical genotypic fingerprints, as shown by random amplified polymorphic DNA PCR (RAPD–PCR). All strains were identified as Pseudomonas aeruginosa (strains b1–b5). The strains were able to inhibit the germination and growth of Aspergillus fumigatus in a soft agar confrontation assay, as well as in a germination multiplate assay. Moreover, when compared with ten P. aeruginosa strains isolated from expectoration through standard methods, no significant differences in inhibitory potential were observed. Additionally, we showed inhibition of A. fumigatus growth on Calu-3 cell culture monolayers. However, the isolated P. aeruginosa strains were shown to cause significant damage to the cell monolayers. Overall, although P. aeruginosa is a known opportunistic lung pathogen and antagonist of A. fumigatus, we validated this novel one-step enrichment approach for the isolation of bacterial strains antagonistic to A. fumigatus from BALF samples as a proof-of-concept. This opens up a new venue for the targeted enrichment of antagonistic bacterial strains against specific fungal pathogens.

1. Introduction

According to the most recent estimates, 3.8 million people die from fungal infections every year worldwide [1]. This is notably the case for fungi belonging to the genus Aspergillus, which are ubiquitous in the environment [2], and whose conidia can reach a density of up to 108 per m3 of air [3]. Aspergillus spp. are opportunistic pathogens affecting 14 million people worldwide [4] and are associated with a wide spectrum of diseases, called aspergillosis. The most common causative agent of aspergillosis, A. fumigatus, has been recently classified as one of the four fungal pathogens of critical importance in the first fungal priority pathogens list published by the WHO to guide research and public actions [5]. The clinical manifestations of aspergillosis range from hypersensitive reactions to lethal invasive infections, depending on the immune status of the host [6,7]. While conidia are cleared either via mucociliary movement or phagocytosis by alveolar macrophages in an immunocompetent setting, this is not the case in an immunocompromised host, where conidia are not adequately cleared, thus leading to the outgrowth of Aspergillus in the lungs [6,7]. Once inside the lung, conidia are confronted with microenvironmental conditions, such as altered pH and iron bioavailability, or hypoxia, which can impact their germination and growth [8,9,10,11,12,13,14].
While aspergillosis development has been widely shown to be influenced by host and microenvironmental conditions, the specific contribution of the lung microbiota as a major factor influencing colonization and growth of Aspergillus spp. has not been sufficiently addressed. Hérivaux and colleagues [15] showed that a lung microbiota community structure characterized by an increased abundance of the bacterial genera Staphylococcus, Escherichia, Paraclostridium, and Finegoldia can be associated with the development of invasive pulmonary aspergillosis (IPA) in a cohort of 104 critically ill immunocompromised subjects. Recently, another study, led by Ao et al. [16], revealed that the lung microbiota, particularly Streptococcus salivarius, Prevotella timonensis, and Human betaherpesvirus 5, is strongly associated with laboratory biomarkers linked to inflammation and the immune response (i.e., total lymphocytes counts, serum albumin, or serum lactate dehydrogenase), and clinical outcomes in community-acquired pneumonia patients with IPA. However, the underlying mechanisms explaining the association between the lung microbiota and disease outcome in patients suffering from invasive aspergillosis still needs further investigation. The interaction with bacteria inhabiting the lungs might also act as a factor affecting conidia germination and subsequent fungal growth [7,17].
The airway microbiome is a highly complex ecosystem composed of diverse microorganisms, including bacteria, fungi, viruses, and archaea [18]. These microorganisms interact with each other and the host, influencing various physiological and pathological processes [19,20]. The composition and dynamics of the airway microbiota are shaped by numerous factors, including the host’s immune status, environmental exposures, as well as antimicrobial treatments [21]. These interactions can significantly impact the colonization and growth of pathogens such as Aspergillus spp. The interkingdom interactions between bacteria and fungi in the airway are particularly noteworthy, as they can modulate the pathogenicity of fungal species [22]. For instance, bacterial metabolites and biofilm formation can influence fungal growth and virulence, while fungal presence can alter bacterial community structure and function [22,23].
The inherent complexity of the airway microbiota poses significant challenges for the investigation of the interaction between A. fumigatus and antagonistic bacteria, and ultimately the isolation of such bacterial strains. Indeed, traditional isolation methods that involve culturing bacteria in isolation before testing them against fungal pathogens may fail to capture the intricate interactions occurring within the lung microbiome. These interactions often involve multiple species and can be influenced by physical and chemical factors of the airway environment [22,23]. Consequently, a more integrative approach that considers the bacterial–fungal interaction context is essential for the enrichment and isolation of bacterial strains with fungal inhibiting properties.
The aim of this study was to enrich and isolate bacterial strains capable of inhibiting the germination and growth of A. fumigatus conidia from bronchoalveolar lavage fluid (BALF) samples of subjects who had undergone lung transplantation. We utilized a novel enrichment method based on a soft agar overlay plate assay, in which bacteria from BALF samples were put directly in contact with Aspergillus conidia. This approach allowed us to enrich and isolate five antagonistic bacterial strains that inhibited the germination of A. fumigatus conidia. All isolated strains were identified as Pseudomonas aeruginosa, with their inhibitory effect observed during the enrichment by the presence of an inhibition halo. Additionally, we compared the genotypic diversity of the five isolated strains, with ten P. aeruginosa strains isolated from expectoration through standard methods and their inhibitory effect using a high-throughput germination screening assay. Finally, two of the five isolated P. aeruginosa strains were selected for subsequent co-culture confrontation assays on Calu-3 cell culture monolayers.

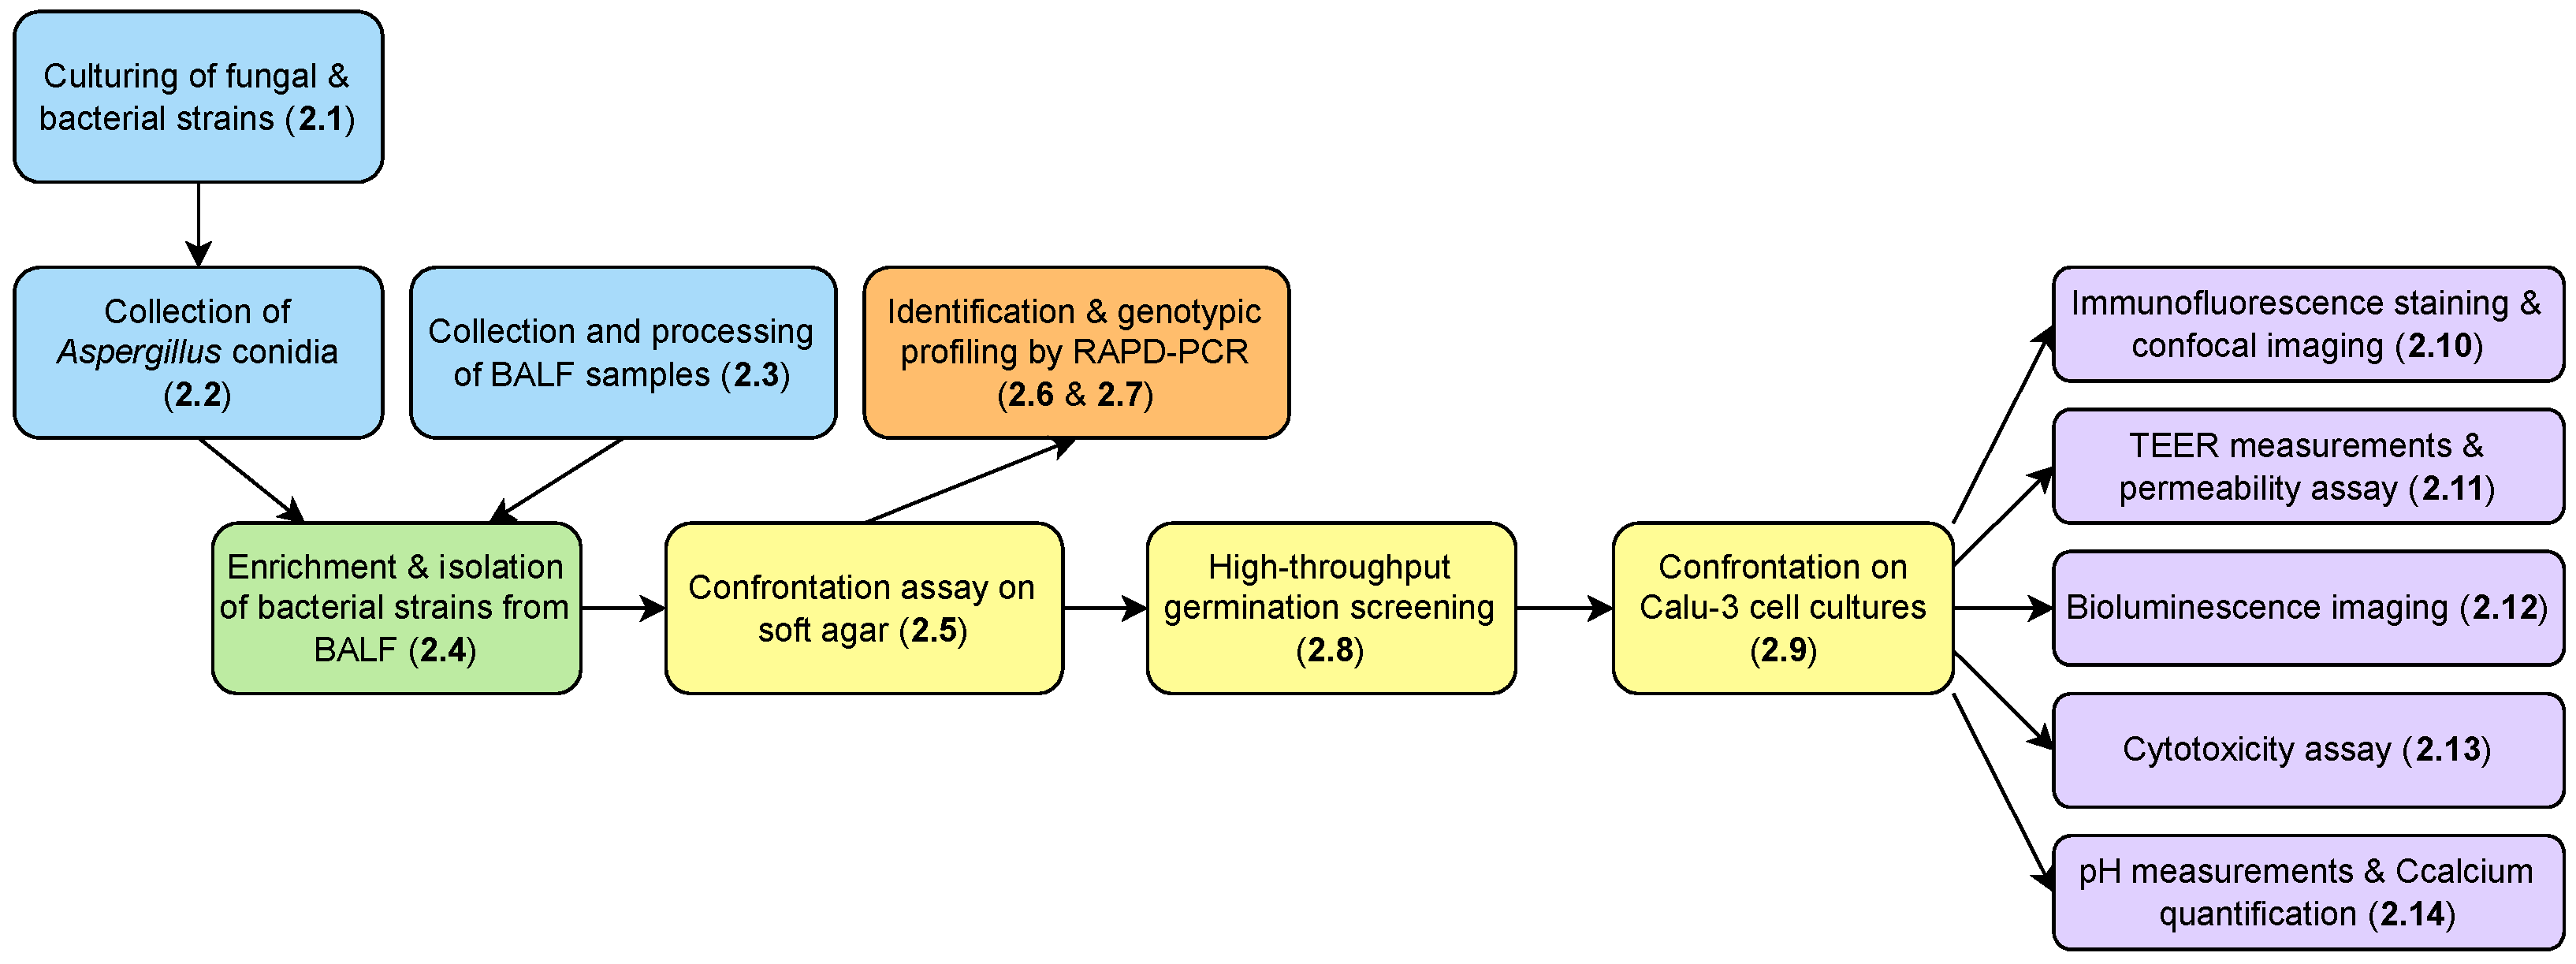
2. Materials and Methods

All methodological steps outlined below (Section 2.1, Section 2.2, Section 2.3, Section 2.4, Section 2.5, Section 2.6, Section 2.7, Section 2.8, Section 2.9, Section 2.10, Section 2.11, Section 2.12, Section 2.13 and Section 2.14) are illustrated in the flow chart diagram depicted in Figure 1.

2.1. Culturing of Fungal and Bacterial Strains

The A. fumigatus strains used in this study are summarized in Table 1. The strains were routinely cultured on malt extract agar (MEA) plates composed of 30 g/L malt extract (Sios Homebrewing GmbH, Wald, Switzerland), 5 g/L casein peptone (LLG Lab Logistics Group GmbH, Meckenheim, Germany), and 15 g/L technical agar (Biolife Italiana, Milano, Italy). Plates were incubated at room temperature for 10 days. The wild-type (WT) isolate was obtained from the Westerdijk Fungal Biodiversity Institute—KNAW (CBS 144.89). This strain is an isolate with a clinical origin and is used extensively due to its higher pathogenicity in murine models [24]. The red-shifted bioluminescent strain, derived from the WT CEA10 strain, was kindly provided by Matthias Brock of the University of Nottingham, UK.
The ten additional P. aeruginosa strains used in this study are presented in Table 2. The strains were routinely cultured on brain–heart infusion agar (BHIA) plates composed of 37 g/L brain–heart infusion broth (BHI, Carl Roth, Karlsruhe, Germany), and 15 g/L technical agar (Biolife Italiana, Milano, Italy). Plates were incubated at 37 °C overnight in a humidified incubator with 5% CO2.

2.2. Collection of Aspergillus spp. Conidia

Conidia were collected from two 10-day-old MEA plates. Briefly, 5 mL of filter-sterilized Dulbecco’s phosphate-buffered saline (DPBS, PAN-Biotech GmbH, Aidenbach, Germany), supplemented with 0.16% v/v Tween® 80 (Sigma-Aldrich/Merck, Darmstadt, Germany) were added to each plate. The mycelial surface was rubbed using a delta cell spreader to dislodge and suspend conidia. The buffer containing conidia was collected in a 50 mL Falcon tube, and the entire procedure was repeated once more. Conidia suspensions were then filtered through a 40 µm cell strainer into a new 50 mL Falcon tube, and centrifugated at 2000× g for 10 min. Supernatant was removed and pellet was rinsed three times by resuspending it in 5 mL DPBS. Conidia were then counted with an improved Neubauer counting chamber and stored at 4 °C until use, for a maximum of 4 weeks. This method allows for the recovery of 300,000 to 800,000 conidia per microliter depending on the sporulation of the fungus in the culture plates used. Colony-forming unit (CFU) counting was also performed in order to correct for viable conidia.

2.3. Collection and Processing of Bronchoalveolar Lavage Fluid (BALF) Samples

The BALF samples used in this study were provided by the Lausanne University Hospital (CHUV) Division of Pulmonology and originated from a large longitudinal study in lung transplant recipients, which aimed to characterize the composition of the lung microbiota through metagenomic sequencing [27]. Subjects underwent transoral bronchoscopy as described in Das, Bernasconi [27]. Briefly, Bronchoalveolar lavage fluid (BALF) was collected via the following procedure: the bronchoscope was wedged either in the middle lobe or lingula of the allograft and 100–150 mL of normal saline was instilled in 50 mL aliquots that were pooled. BALF recovery was measured, and a fraction of 3 mL was stored at 4 °C and centrifuged within 3 h at 14,000× g for 10 min. The pellet was snap frozen and stored at −80 °C until further processing. A negative control obtained upon washing a ready-to-use endoscope with sterile saline was prepared following the same procedure. Glycerol samples of BALF were obtained for this study and were stored at −80 °C until use.

2.4. Enrichment and Isolation of Antagonistic Bacterial Strains from BALF Samples

Antagonistic bacterial strains inhibiting the germination and growth of A. fumigatus were enriched and isolated from BALF samples using a soft agar overlay plate assay with RPMI 1640 medium. RPMI medium was chosen because of the similarity in composition with the fluid lining the lung epithelium surface [27]. Briefly, 500 mL of filtered and sterilized, 2X RPMI 1640 liquid medium (10.4 g in 500 mL, Capricorn Scientific GmbH, Ebsdorfergrund, Germany, Cat. N° RPMI-A-P10) was mixed with 500 mL of 3% technical agar solution to make 1X RPMI 1640 1.5% agar medium which was then poured in 6 cm Petri plates. A second soft-agar (0.6%) layer of 2 mL of the same medium, in which 10 µL of A. fumigatus CEA10 (112,500 conidia/µL) were added, was poured on top of the 1.5% agar layer. While waiting for the soft agar layer to harden, 5 BALF samples (Table 3) were first thawed and pooled in a 15 mL Flacon tube and centrifuged at 3000× g for 10 min to concentrate bacterial biomass. Supernatant was removed until approx. 1 mL was left. Then, 250 µL of this BALF concentrate were spread onto the soft agar layer before the plates were incubated for 24 h in a humidified CO2 incubator. After incubation, individual strains were obtained through serial colony purification steps.

2.5. Confrontation Assay on a Soft Agar Overlay Assay Plate

To qualitatively assess the inhibitory potential of each individual strain obtained, a similar bi-layered soft agar assay was used. A first layer of 1.5% agar RPMI medium was poured into 9 cm Petri dishes. Then, a second layer of 0.6% soft agar, containing 2 × 10⁶ A. fumigatus CEA10 conidia per 5 mL of medium, was poured on top of the first layer. Bacterial liquid cultures in BHI were set to an OD = 0.8, and five µL drops of these cultures were then spotted on top of the soft agar layer. Four different bacterial strains were spotted in a cross pattern on a single plate to maximize distance between each strain. Plates were incubated at 37 °C for 24 h.

2.6. Identification of the Bacterial Isolates

DNA samples were obtained by thermolysis. Briefly, bacterial biomass was sampled using a wooden toothpick and resuspended in 20 µL in PCR-grade water in a PCR tube. Then, PCR tubes were placed in a thermocycler for 10 min at 98 °C. The 16S rRNA gene was amplified using the ALLin™ HS Red Taq Mastermix, 2X kit (highQu, Kraichtal, Germany) with the GM3f (5′-AGAGTTTGATCMTGGC-3′)-GM4r (5′-TACCTTGTTACGACTT-3′) primer pair [28]. PCR reactions were performed in a final volume of 25 µL containing the following: 12.5 µL ALLin™ HS Red Taq Mastermix, 2X, 0.5 µL of each primer, and 1 µL of DNA sample. PCR reactions were run on an Arktik Thermo Cycler (Thermo Fisher Scientific, Waltham, MA, USA) with the following program: initial denaturation step at 95 °C for 1 min; followed by 40 cycles composed of a denaturation at 95 °C for 15 sec, annealing at 56 °C for 15 sec, and elongation at 72 °C for 30 s; and a final elongation step at 72 °C for 2 min. PCR products were verified by agarose gel electrophoresis and purified using a MultiScreen® plate (Millipore Corporation, Burlington, MA, USA). DNA was quantified with a BR Qubit assay (Thermo Fisher Scientific, USA). Purified PCR amplicons were then sent to Fasteris, Life Science Genesupport SA (Plan-les-Ouates, Geneva, Switzerland) for Sanger sequencing. Nucleotide sequences were analyzed using NCBI nucleotide BLAST [29].

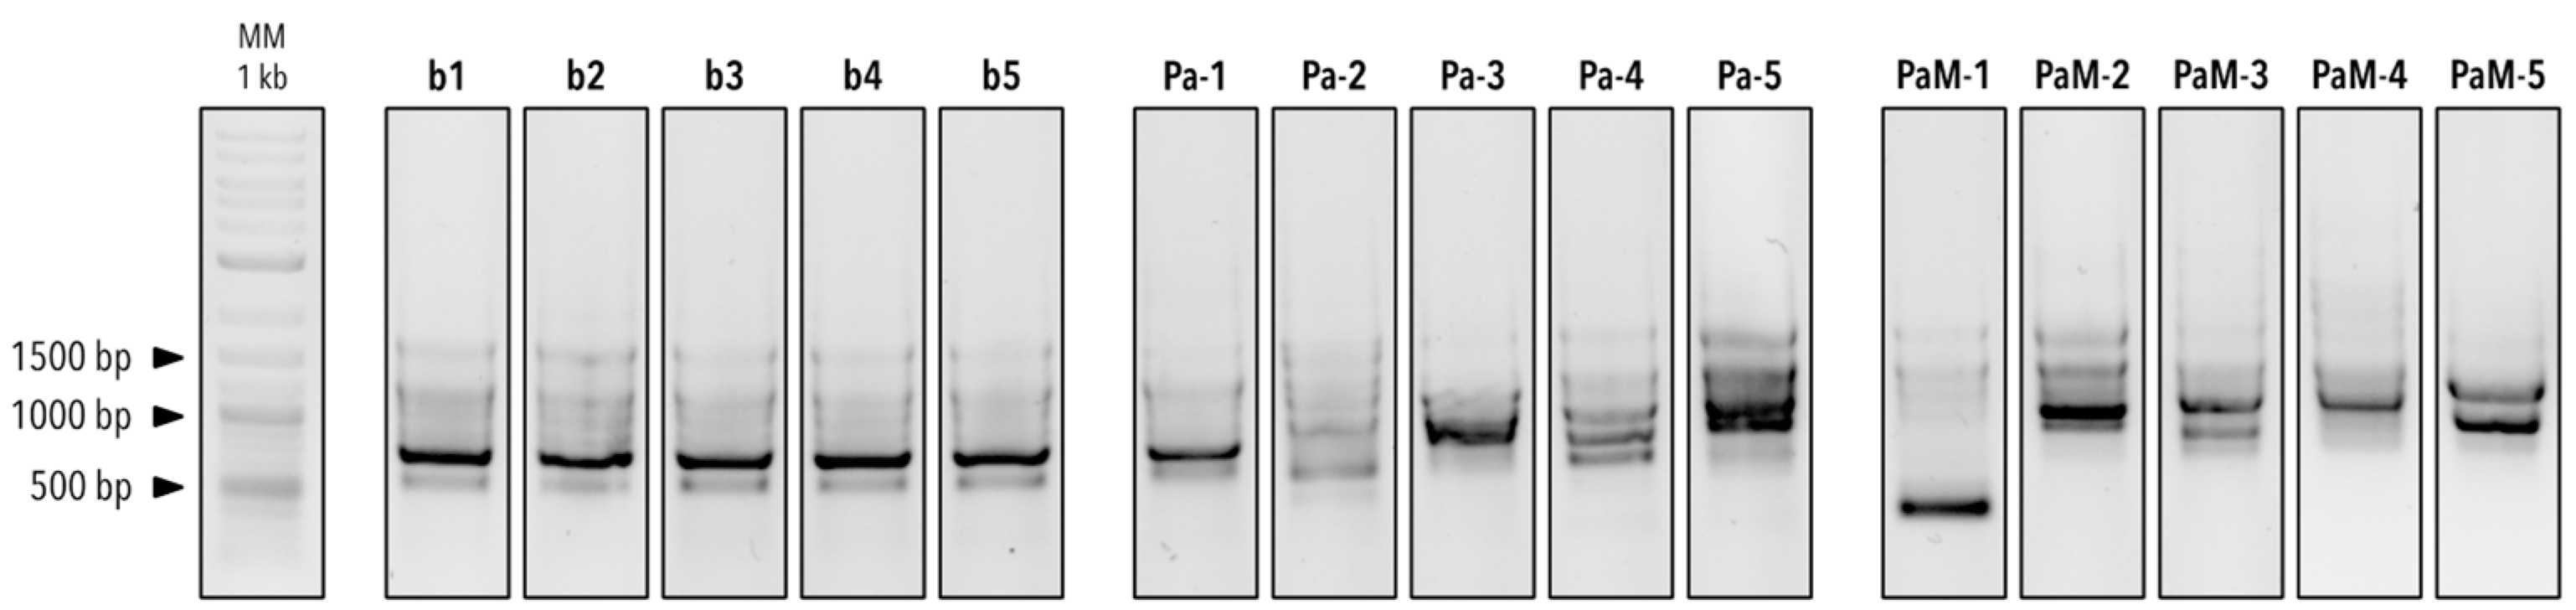
2.7. Genotypic Profiling of the Isolated P. aeruginosa Strains by Random Amplified Polymorphic DNA PCR (RAPD–PCR)

DNA samples were obtained by thermolysis as explained in Section 2.7. RAPD–PCR was performed to do a genotypic profiling of the five isolated strains of P. aeruginosa using primer 272 (5′-AGCGGGCCAA-3′). This primer was used due to its higher discriminatory potential for closely related genotypes compared with other primers used for P. aeruginosa genotyping [30,31]. RAPD–PCR reactions were performed in a final volume of 25 µL containing the following: 12.5 µL ALLin™ HS Red Taq Mastermix 2X (highQu, Germany), 4 µL of primer 272, and 1 µL of DNA sample. Reactions were run on an Arktik Thermo Cycler (Thermo Fisher Scientific, USA) with the following program: initial denaturation step at 95 °C for 2 min; followed by 35 cycles composed of a denaturation at 95 °C for 30 s, annealing at 35 °C for 30 s, and elongation at 72 °C for 2 min; and a final elongation step at 72 °C for 10 min. RAPD–PCR products were run on a 0.7% agarose gel at 70 V for 1 h.

2.8. High-Throughput Germination Screening Assay

A high-throughput (HTP) germination screening assay was developed to rapidly test bacterial isolates for their ability to inhibit the germination of conidia and the growth of A. fumigatus. To do so, the bioluminescent A. fumigatus strain CEA10b was incubated alone or in the presence of the five antagonistic bacterial isolates in a white-walled 96-well plate (Costar® Corning, Corning, NY, USA, Ref. 3610). Each well contained a final volume of 200 µL of RPMI. For the co-culture, 80,000 A. fumigatus CEA10b conidia and 10 µL of bacterial liquid culture in RPMI (OD = 0.8) were added per well. The controls contained the same concentration of conidia or bacteria alone. An amount of 10 µL of 20 mM D-Luciferin solution (1 mM final concentration) was added in the well inoculated with conidia [32]. As positive control of germination inhibition, 2 µL of 50 mg/mL cycloheximide solution (in EtOH 99%) or 12.5 µg/mL voriconazole solution (in sterile MilliQ® water, Merck KGaA, Darmstadt, Germany) were used. Optical density (at 600 nm) and bioluminescence (exposure time of 10 s) were measured every 30 min for 48 h following the incubation of the plates at 37 °C. Measurements were recorded using a Biotek Cytation 5 Cell Imaging Multimode microplate reader (Agilent, Santa Clara, CA, USA). All experiments were run in four independent replicates.

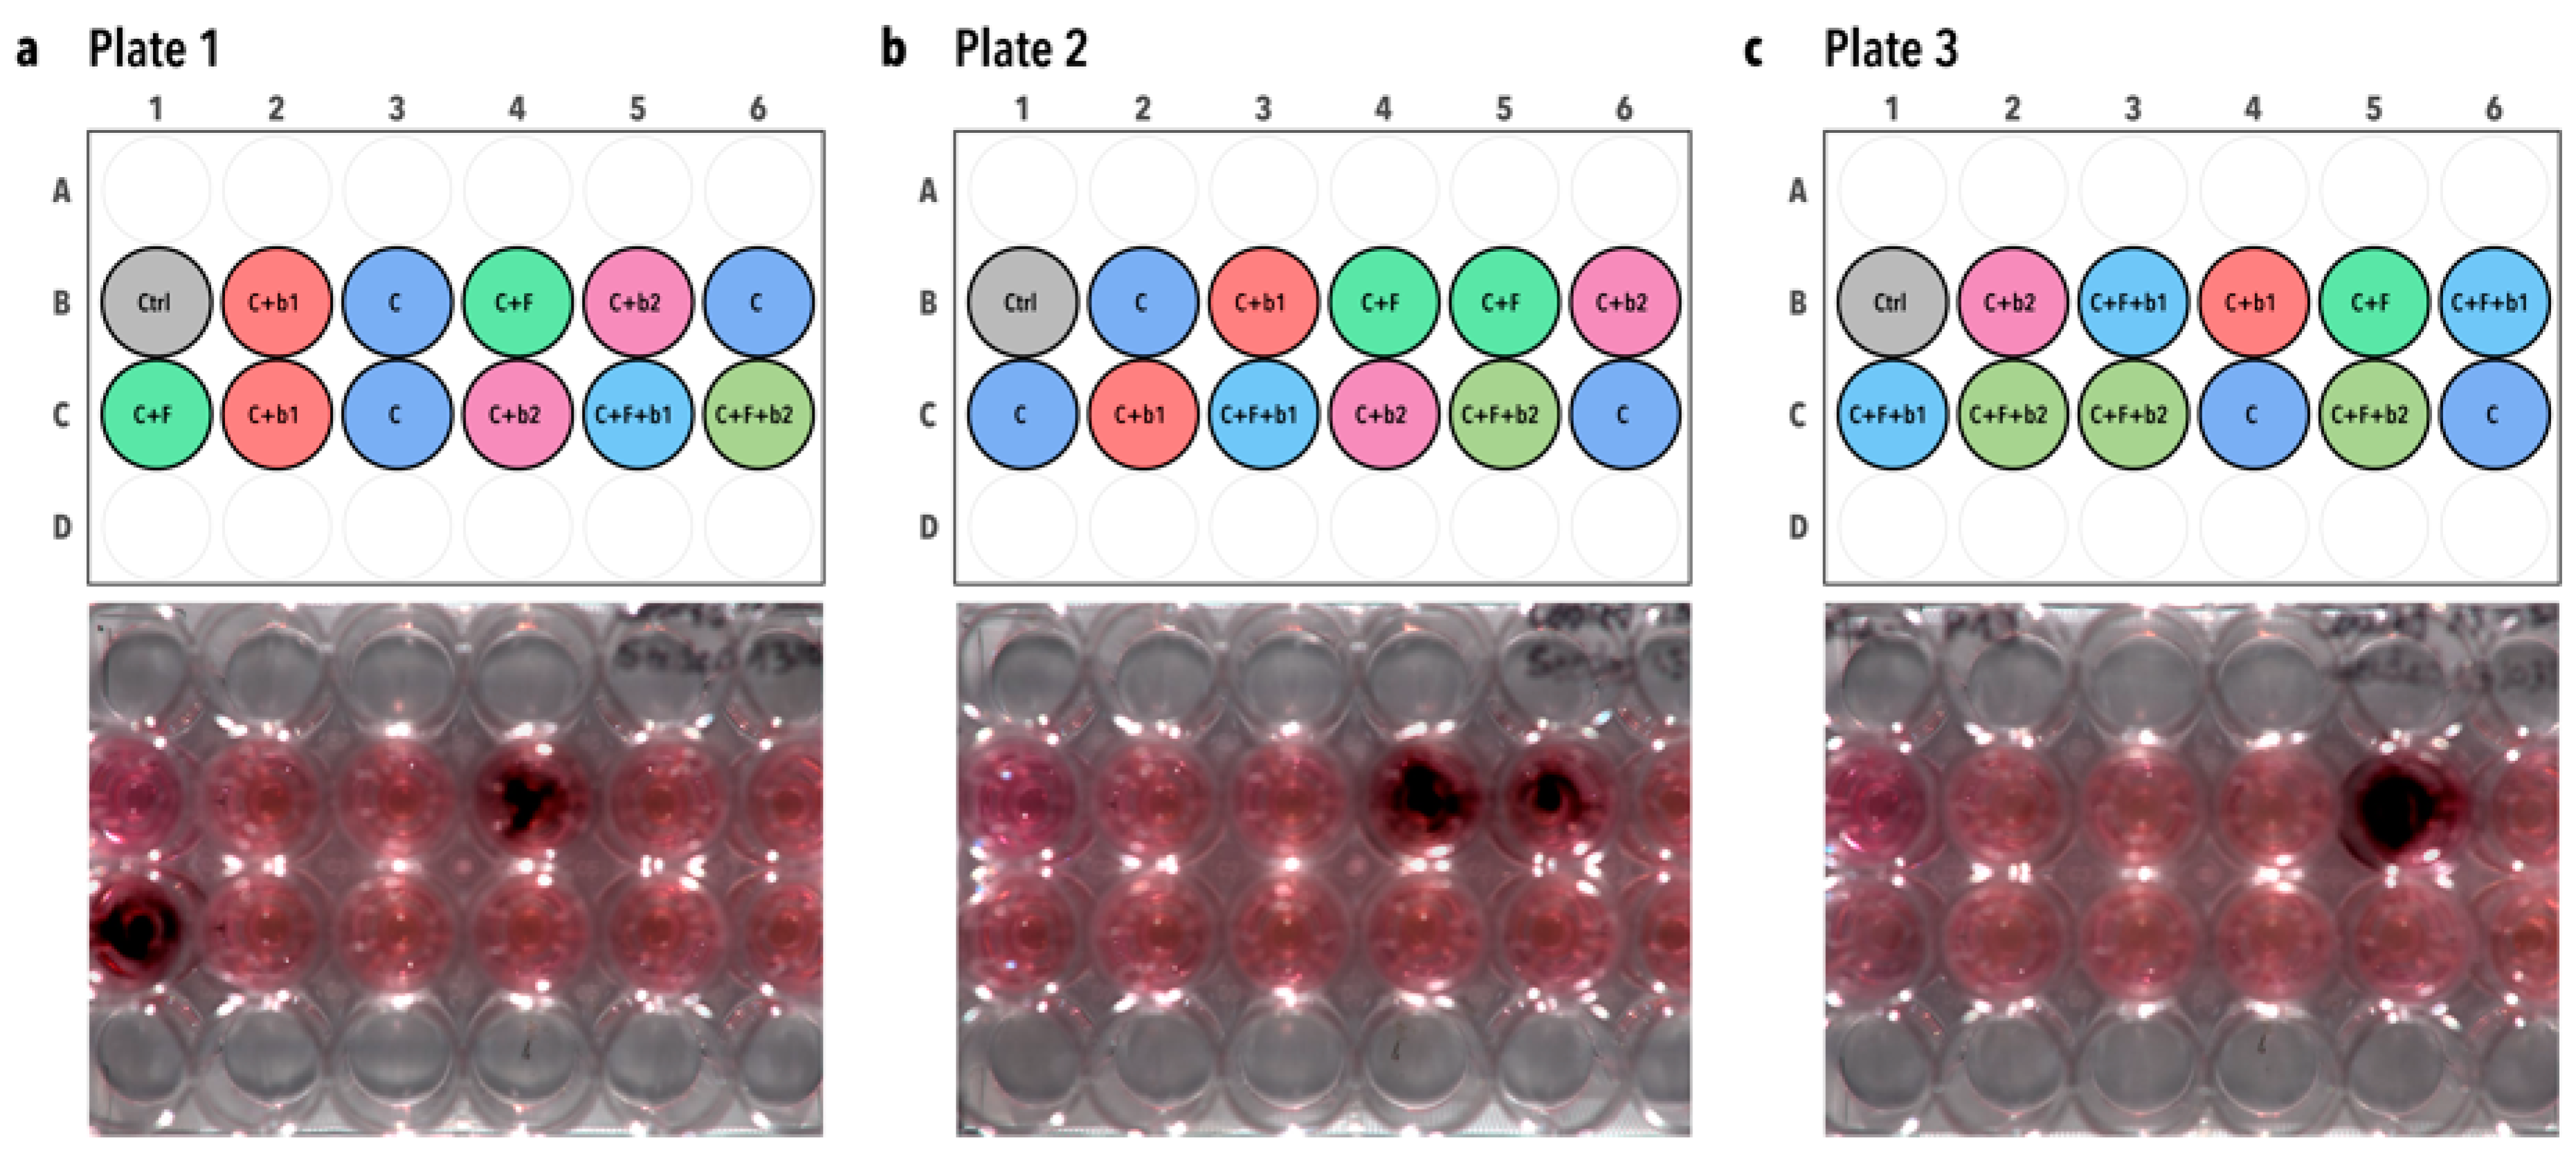
2.9. Confrontation on Calu-3 Cell Cultures on Permeable Transwell® Inserts

Calu-3 cells were obtained from the American Type Culture Collection (Catalog No. ATCC HTB-55, Lot No. 70037771) and used from passages 17 to 21. Calu-3 cells were expanded in T-75 cell culture flasks with vent cap in MEM Eagle (PAN-Biotech GmbH, Aidenbach, Germany, Cat. No. P04-08056) supplemented with 10% of Panexin basic (PAN-Biotech GmbH, Aidenbach, Germany, Cat. No. P04-96950, Lot No. 3430322) and 1% of 100× Penicillin–Streptomycin (PAN-Biotech GmbH, Aidenbach, Germany, Cat. No. P06-07050). The cell cultures were maintained at 37 °C in a humidified incubator with 5% CO2. The culture medium was changed every other day. Cells were passaged when they reached 70–80% confluency by trypsinization with 0.05% Trypsin/0.02% EDTA (Lifeline Cell Technology, Frederick, MD, USA), and collected after centrifugation at 125× g for 5 min. Viable cells were counted with a hemocytometer using Trypan Blue PromoKine (PromoCell GmbH, Heidelberg, Germany, Cat. No. PK-CA902-1209).
Cells were seeded onto porous membranes with a density of 108,000 cells/well in 200 μL of culture medium in the apical side of Transwell® inserts in 24-well plates (Corning, USA, Cat. No 3470). Transwell® inserts were first coated with a solution of collagen type I (Ibidi, Gräfelfing, Germany, Cat. No. 50203) at a final concentration of 30 μg/mL prior to the seeding of the cells in order to allow proper cell attachment onto the porous membrane, as described in [33]. Afterwards, 600 μL of culture medium was added to the basolateral side of Transwell® inserts in the 24-well plates. Transwell® inserts (Art. N° 3470, Corning Incorporated, Corning, NY, USA) were placed in a humidified incubator at 37 °C with 5% CO2 for 15 days until confluence and formation of a monolayer. Medium was changed every other day as described previously. The cultures were observed daily using an EVOS™ XL Core bright field inverted microscope (Thermo Fisher Scientific, USA).
After 15 days of incubation, Transwell® inserts were infected with either 100 conidia and/or bacterial cells per inserts. Prior to infection with the fungus, the apical medium was changed and 5 μL of IVISbrite D-Luciferin RediJect (30 mg/mL D-Luciferin, PerkinElmer, Shelton, CT, USA, Cat. No. 770504) was added per insert for bioluminescence imaging. Fungus- and bacteria-alone controls were included. Each condition was investigated in quintuplicate for the single and for the co-infections, and in octuplicate for the cell-only controls, in two independent experiments. All Transwell® inserts were incubated in a humidified incubator at 37 °C with 5% CO2 for 19 h.

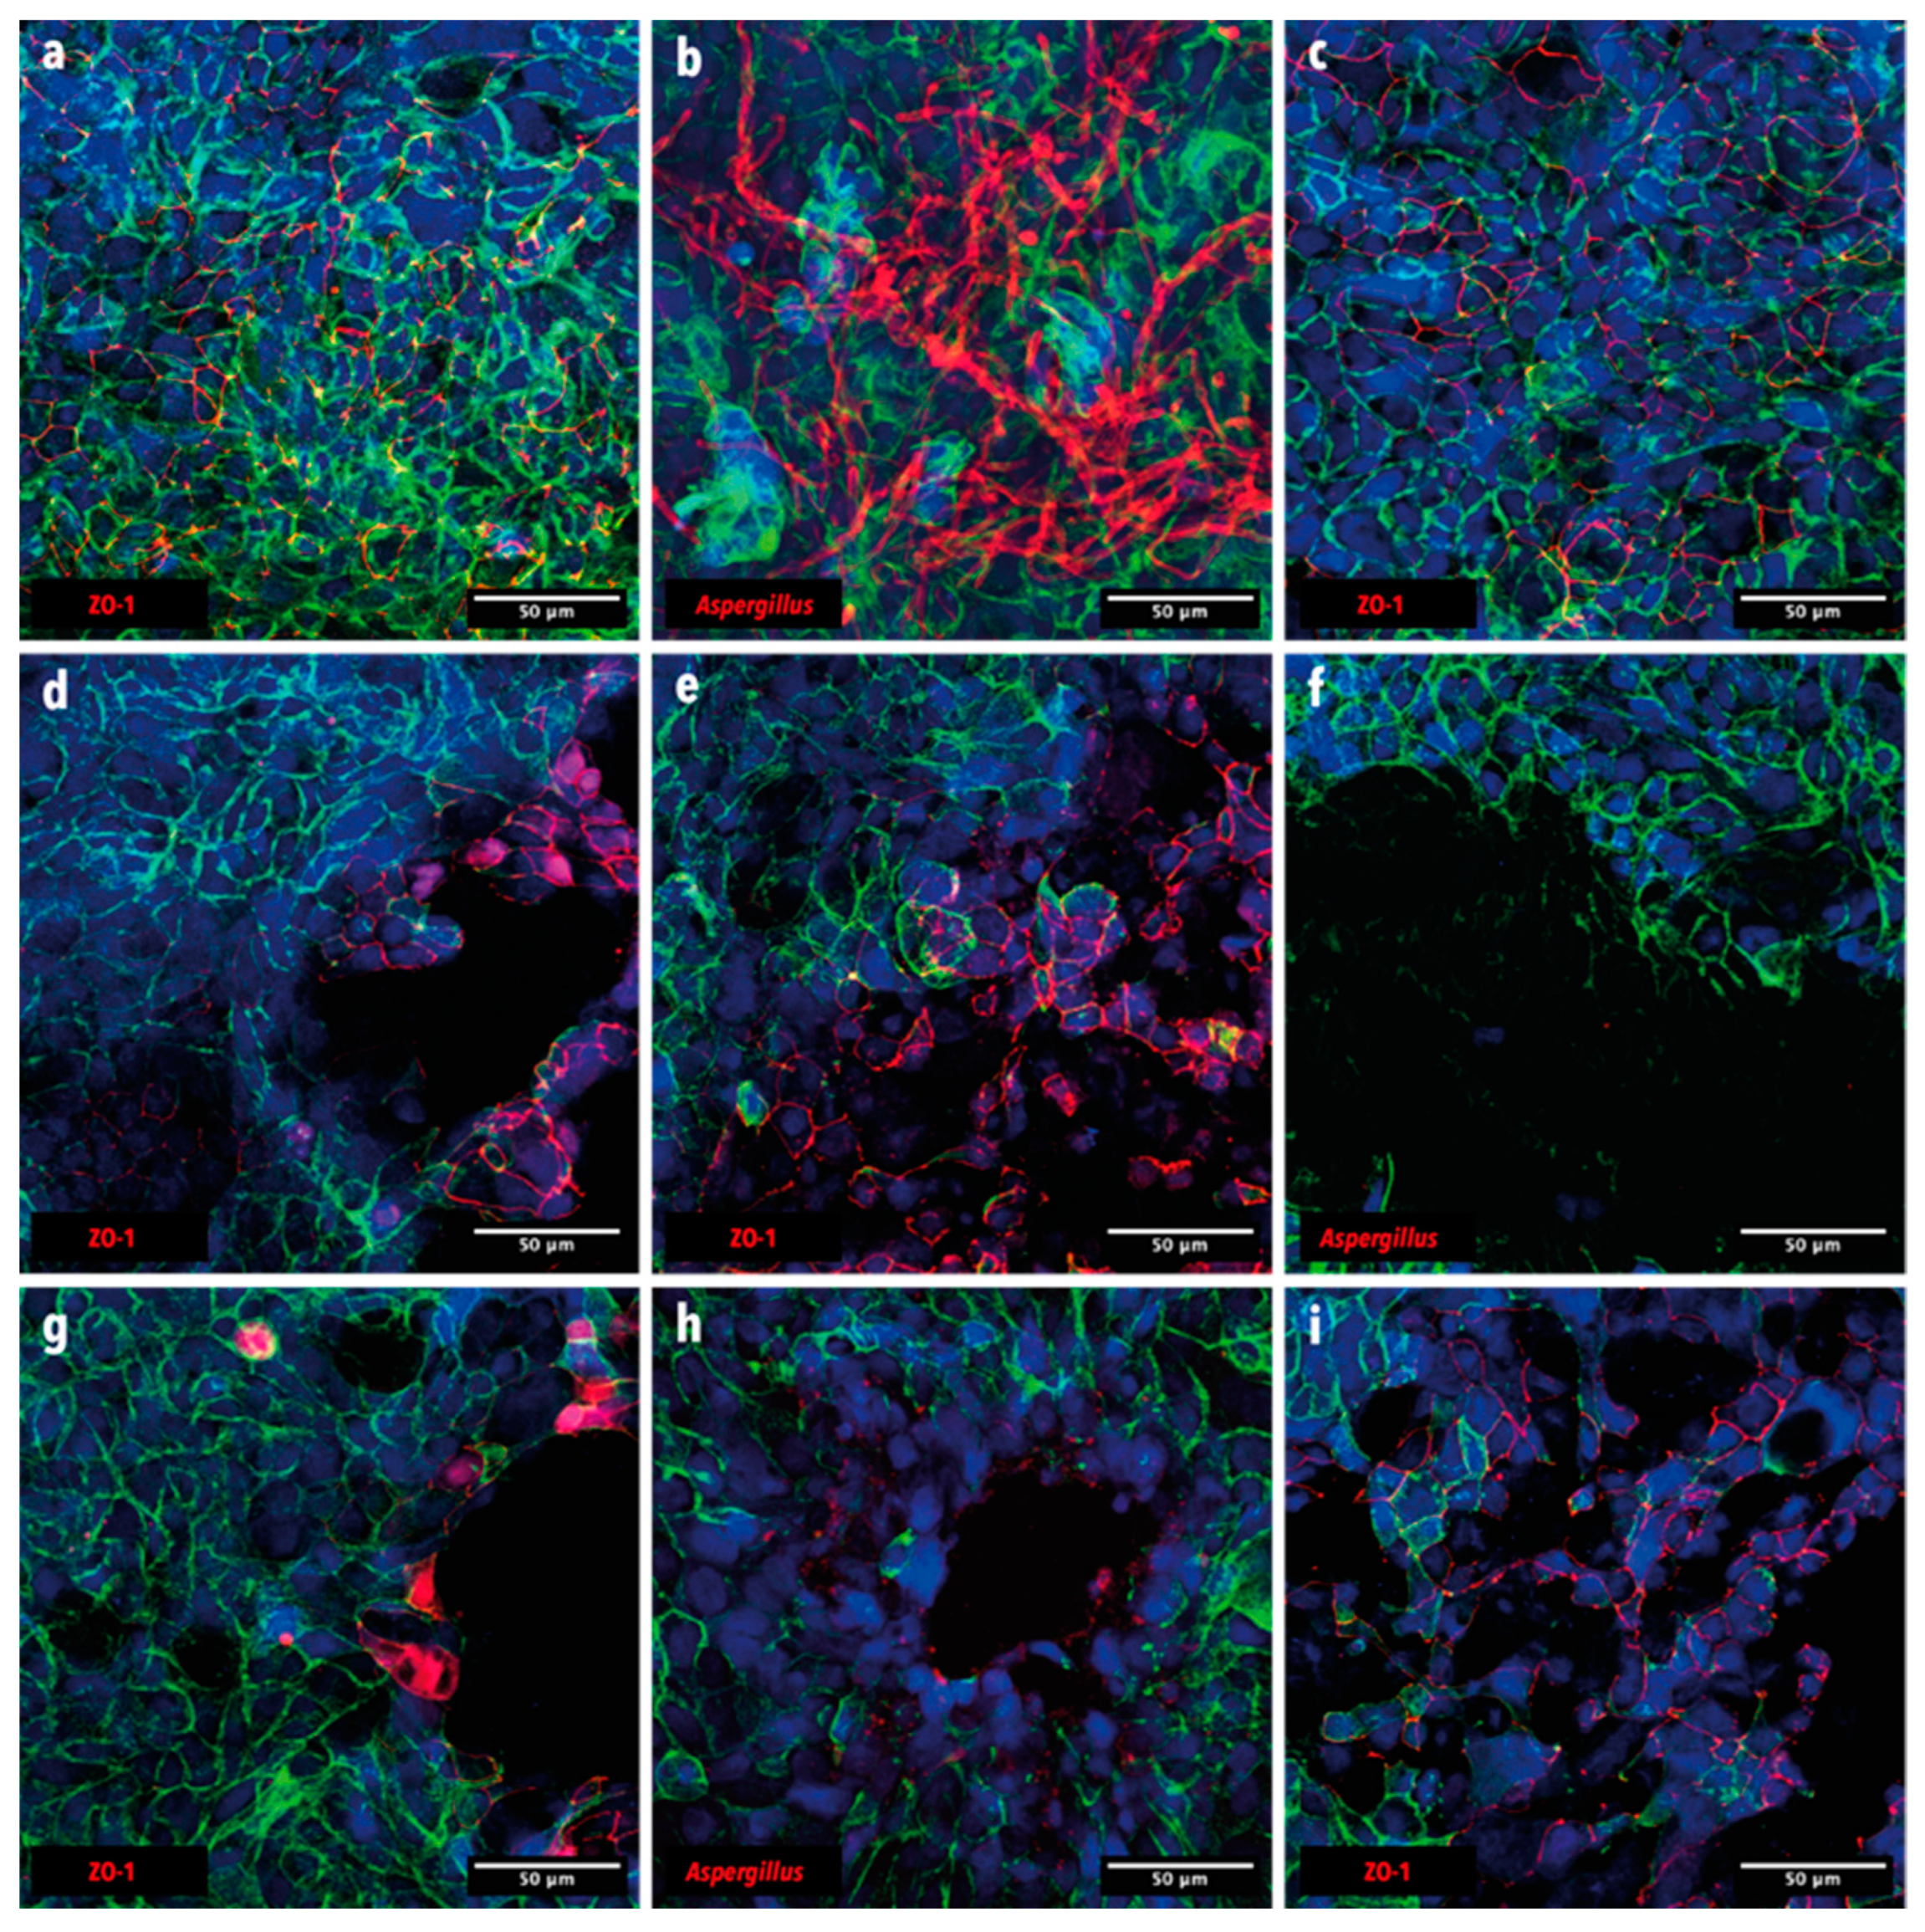
2.10. Immunofluorescence Staining and Confocal Imaging

Calu-3 cell cultures were fixed with 100 μL 4% paraformaldehyde in DPBS for 15 min at RT. Cells were then rinsed 3 times with 200 μL Tris Buffer Solution 1× pH 7.5 (TBS), with 5–7 min waiting time between each rinse. Cells were permeabilized with 100 μL 0.2% Triton X-100 in TBS for 15 min at RT and rinsed 3 times with 200 μL TBS, with 5–7 min waiting time between each rinse. After that, cells were blocked with 100 μL blocking solution (0.1% NaN3, 3% goat serum, 0.5% casein, 0.025% Tween 20 in TBS 1× pH 7.5, kindly provided by the Live Cell Imaging Core Facility, Department of Biomedical Research, University of Bern) for 30 min at RT. ZO-1 mouse anti-human conjugated with Alexa Fluor 594 (Thermo Fisher Scientific, USA, Cat. No. 339194) was prepared in the blocking solution (1/100). The actin stain (ActinGreen™ 488 ReadyProbes™ Reagent, Invitrogen, Carlsbad, CA, USA) and the nuclei counterstain (NucBlue™ Live ReadyProbes™ Reagent, Invitrogen, Carlsbad, CA, USA) were added to the same solution (2 drops/mL and 1 drop/mL, respectively). Anti-Aspergillus rabbit polyclonal primary antibody (Abcam, Cambridge, UK, Cat. No. ab20419) was also added (1/200) in the same solution for the conditions in which A. fumigatus conidia were inoculated. Fixed cells were incubated with the 100 μL solution containing the stains and antibodies overnight at 4 °C. The next day, fixed cells were washed 3 times with TBS supplemented with 0.025% Tween 20, with 5–7 min waiting time between each rinse. Goat anti-rabbit IgG secondary antibody (1/500) conjugated with Alexa Fluor 594 (Thermo Fisher Scientific, USA, Cat. No. A-11012) directed against Anti-Aspergillus antibody were prepared in TBS + 0.025% Tween 20. Fixed cells were incubated with 100 μL buffer containing the secondary antibodies for 3 h at RT in the dark. Cells were then washed 3 times with TBS + 0.025% Tween 20 for 7 min. Membranes from the inserts were then carefully cut out with a sharp knife, and mounted on a glass slide using the EMS shield mount mounting medium (Electron Microscopy Sciences, Hatfield, PA, USA) and imaged with a ZEISS Axio Observer Z1 LSM 980 with Airyscan 2 confocal microscope (Carl Zeiss AG, Oberkochen, Germany), using the C-Apochromat 40×/1.20 W Korr objective and Alexa Fluor 594 (red, λex: 590 nm, λem: 610 nm), Alexa Fluor 488 (green, λex: 493 nm, λem: 517 nm), and Alexa Fluor 405 (blue, λex: 401 nm, λem: 422 nm) channels.

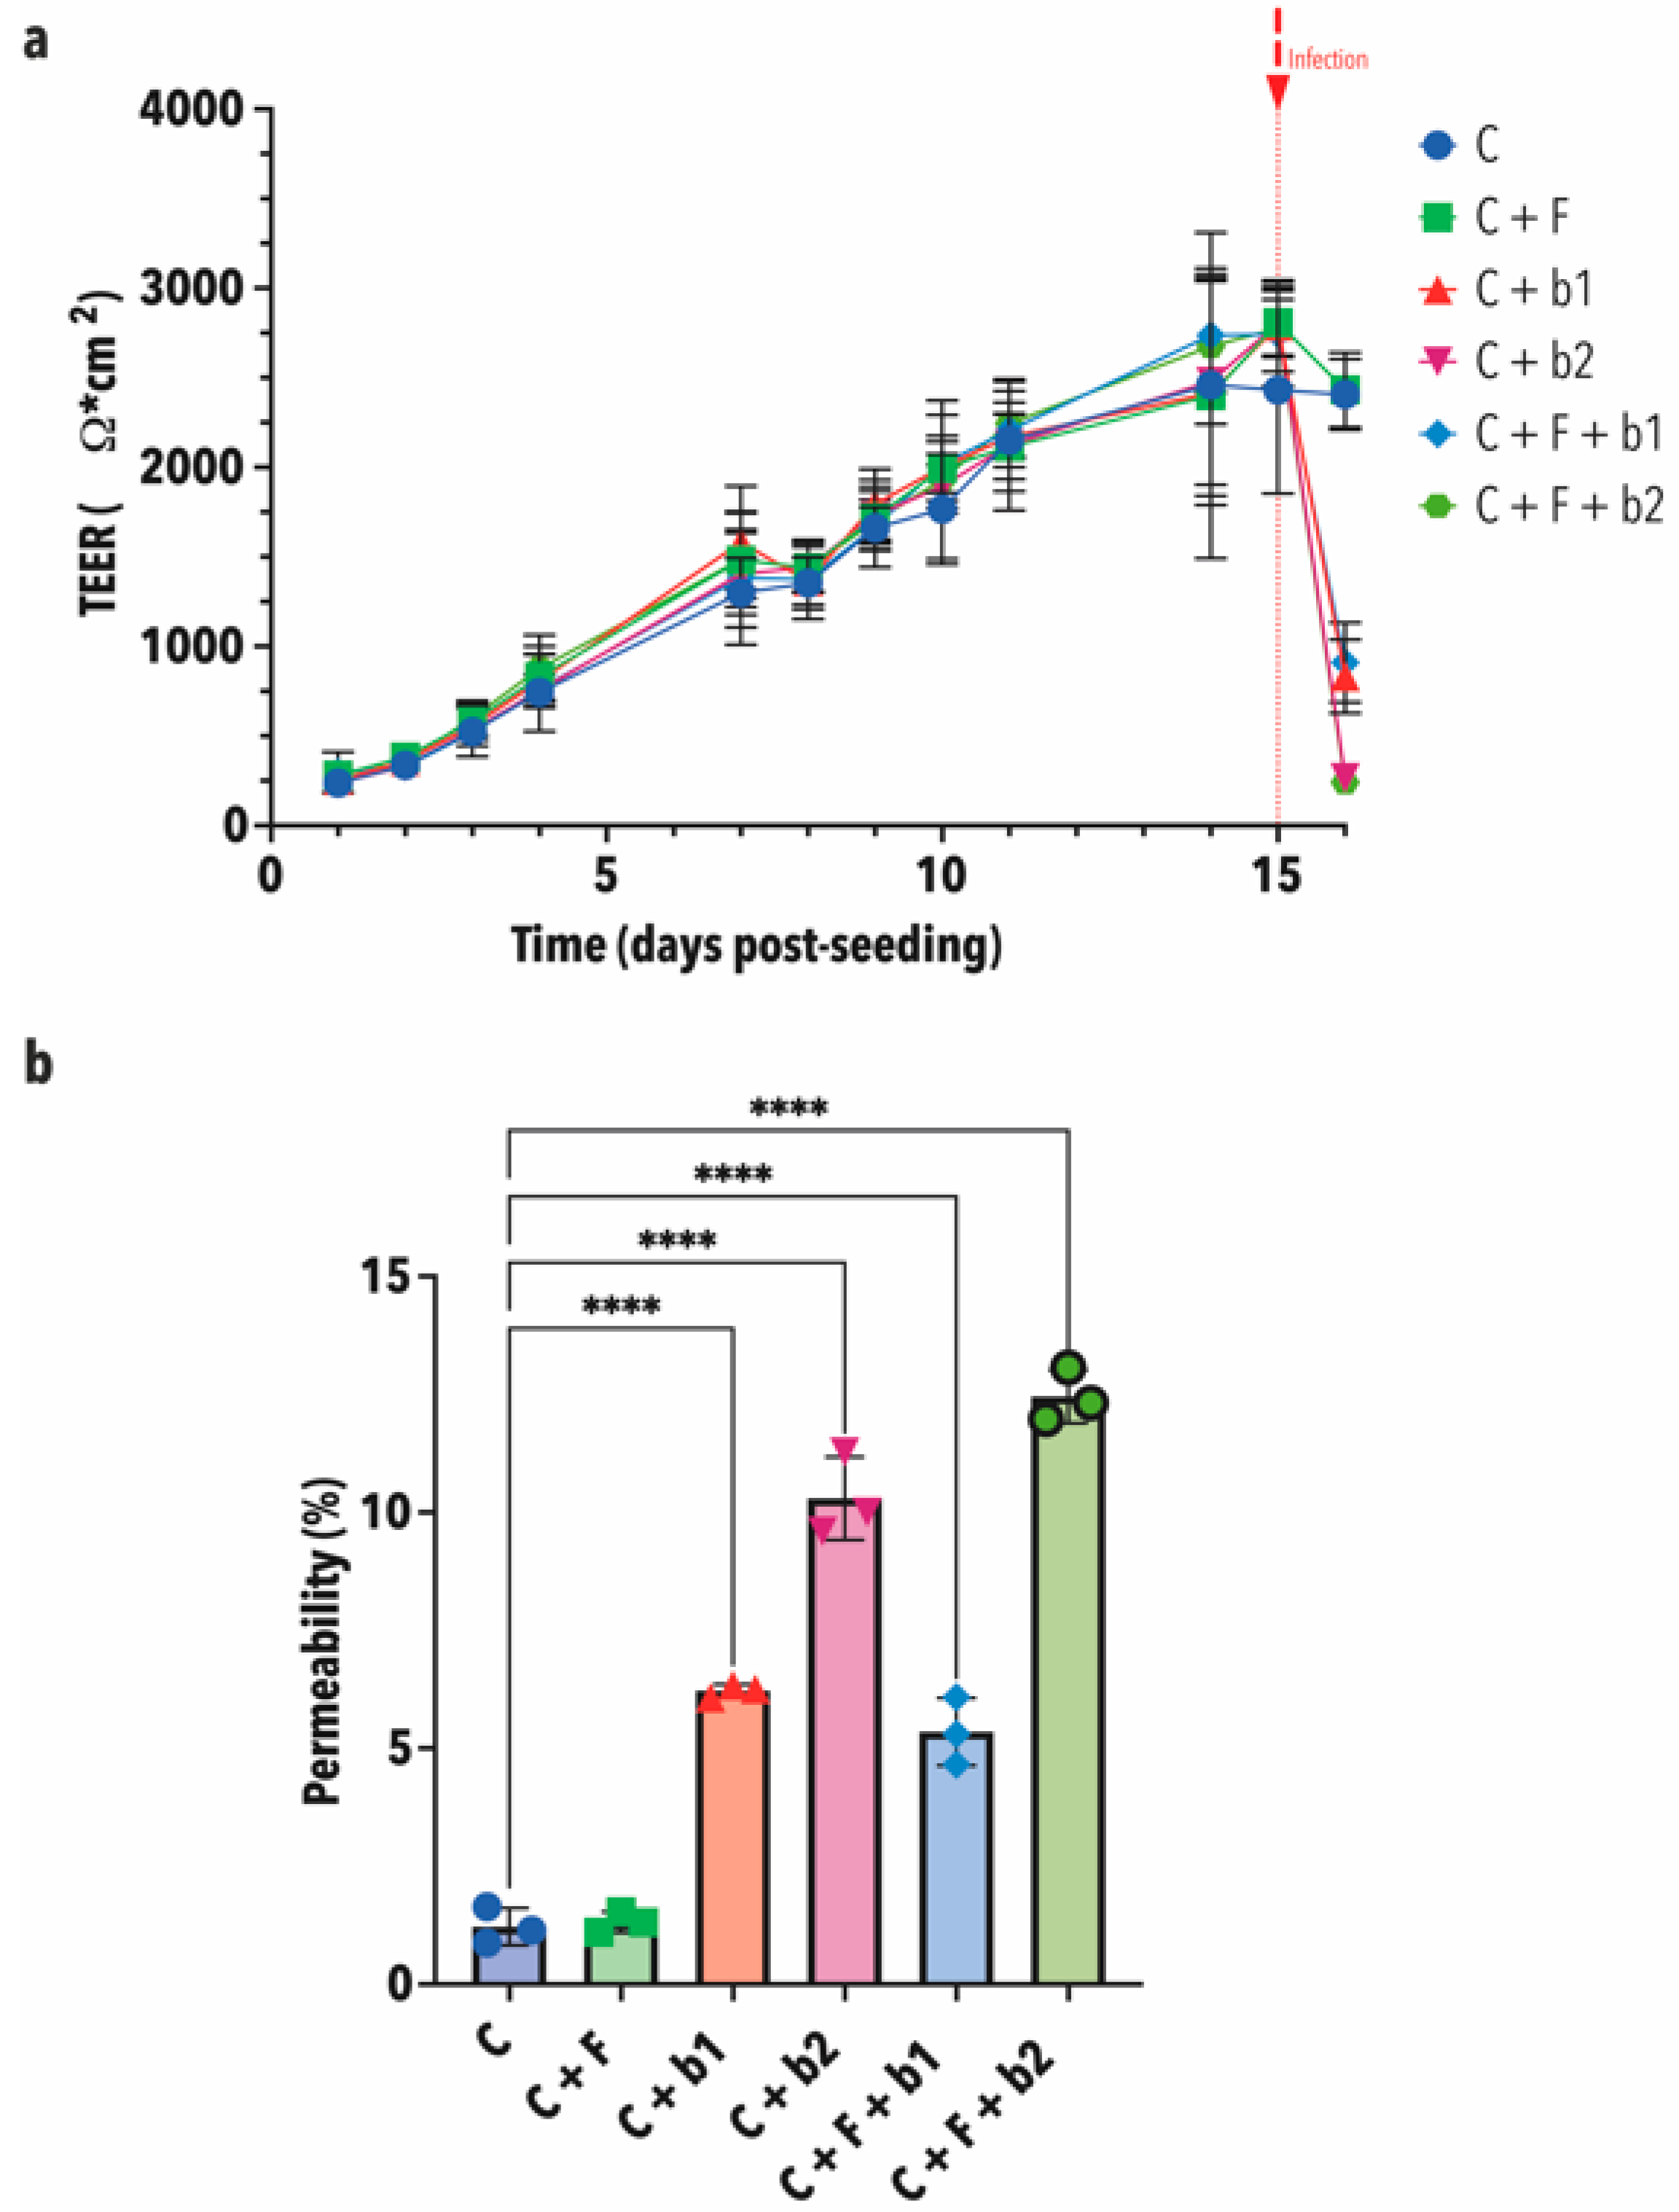
2.11. Assessment of Epithelial Barrier Function: TEER Measurements and Lucifer Yellow Permeability Assay

Trans-epithelial electrical resistance (TEER) was measured before media change using an EVOM3 Epithelial Volt/Ohm Meter with STX4 “chopsticks” electrodes daily for 15 days, starting from day 2 post-seeding. Two measurements were taken per inserts. TEER values were expressed in Ohms (Ω) per insert surface area (0.33 cm2).
Permeability of the Calu-3 monolayer was assessed using the paracellular marker Lucifer Yellow (LY, Lucifer Yellow CH Lithium salt, Biotium, Fremont, CA, USA, Cat. No. 80015). A 100 μg/mL LY solution was prepared in Hanks’ Balanced Salt Solution (HBSS, PAN-Biotech GmbH, Aidenbach, Germany, Catalog No. P04-32505) and 200 μL of this LY solution was added to the apical compartment, whilst 600 μL of HBSS was added to the basal compartment. Plates were incubated for 2 h 30 m in a humidified incubator at 37 °C with 5% CO2, and 100 μL of the basal solution were added to a black flat-bottom 96-well microplate. LY fluorescence intensity was measured with λexc = 485 nm and λem = 535 using a Biotek Cytation 5 Cell Imaging Multimode microplate reader (Agilent, USA).

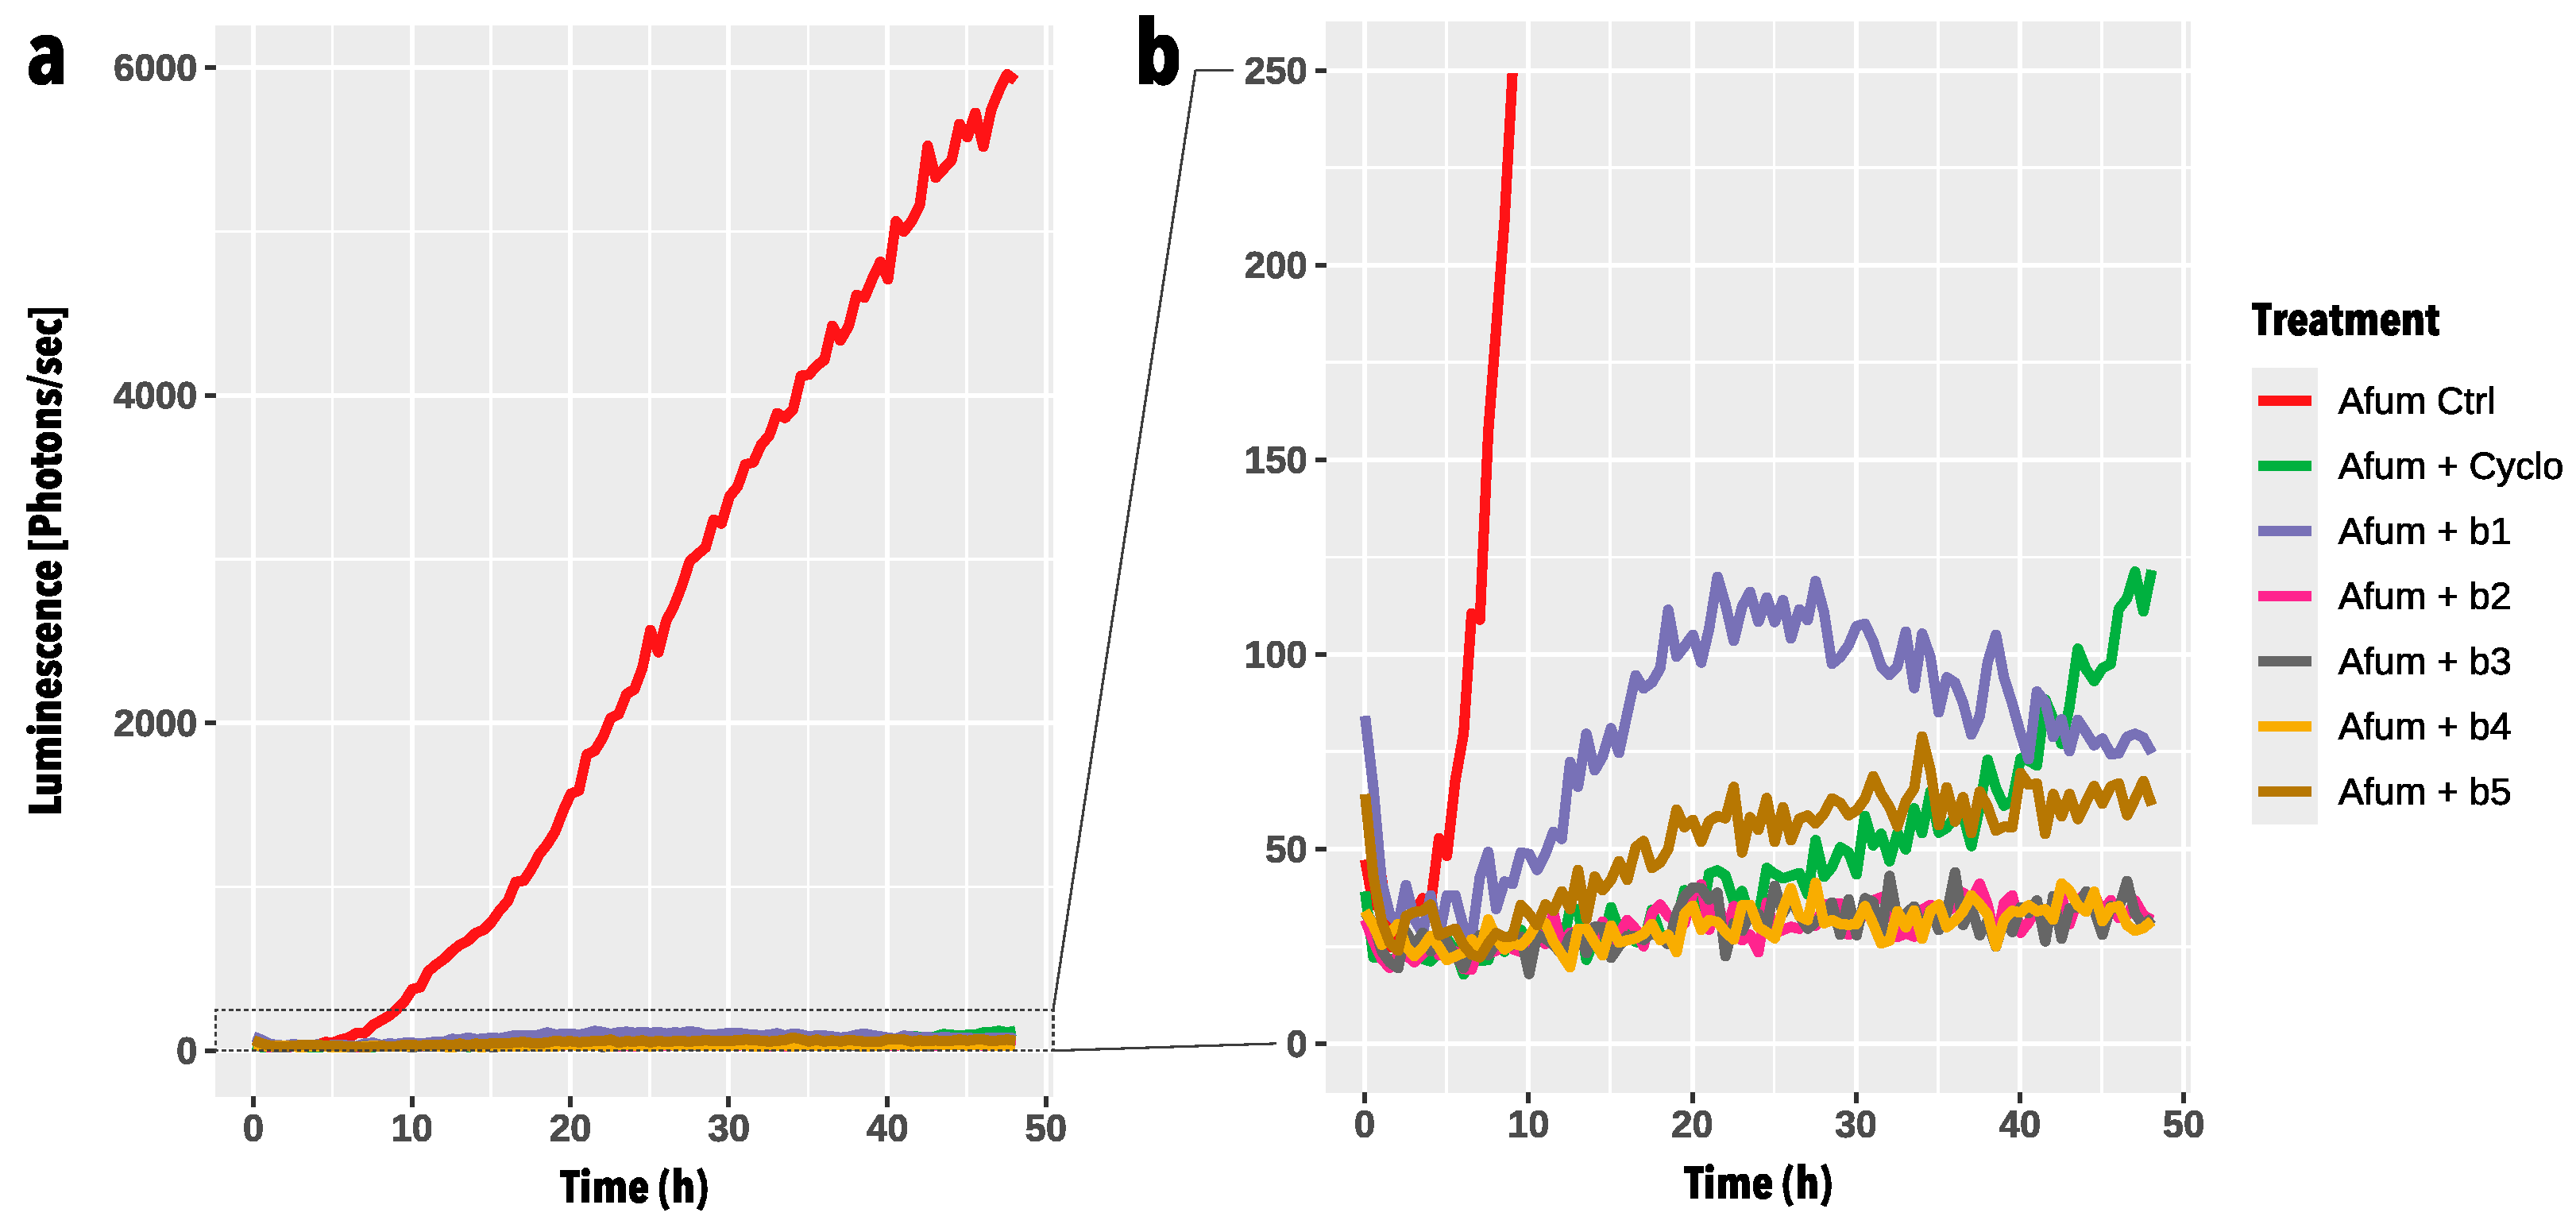
2.12. Bioluminescence Imaging

To assess the growth of A. fumigatus CEA10b on the Calu-3 monolayers when inoculated alone, or co-inoculated with the P. aeruginosa strains, bioluminescence imaging was performed using the Amersham Imager 680 (GE Healthcare, Chicago, IL, USA) in the chemiluminescence mode, with an exposure time of 5 min and binning of 32×.

2.13. Cytotoxicity Assay

Cytotoxicity was assessed through the quantification of dead cell-associated proteases using the fluorescent kit CytoTox-Fluor™ Cytotoxicity Assay (Promega, Madison, WI, USA, Cat. No. G9260) per the manufacturer’s instructions.

2.14. pH Measurements and Quantification of Calcium

pH and calcium concentration were quantified in the culture medium with the iSTAT 1 Blood Analyzer (Abbott, Abbott Park, IL, USA) using the CG8 + cartridges (Abbott, USA, Cat. No. 10002376).

2.15. Statistical Analyses

All graphical representations and statistical analyses were performed with RStudio (Version 2022.12.0 + 353) and GraphPad Prism 9 (Version 9.5.1).

3. Results

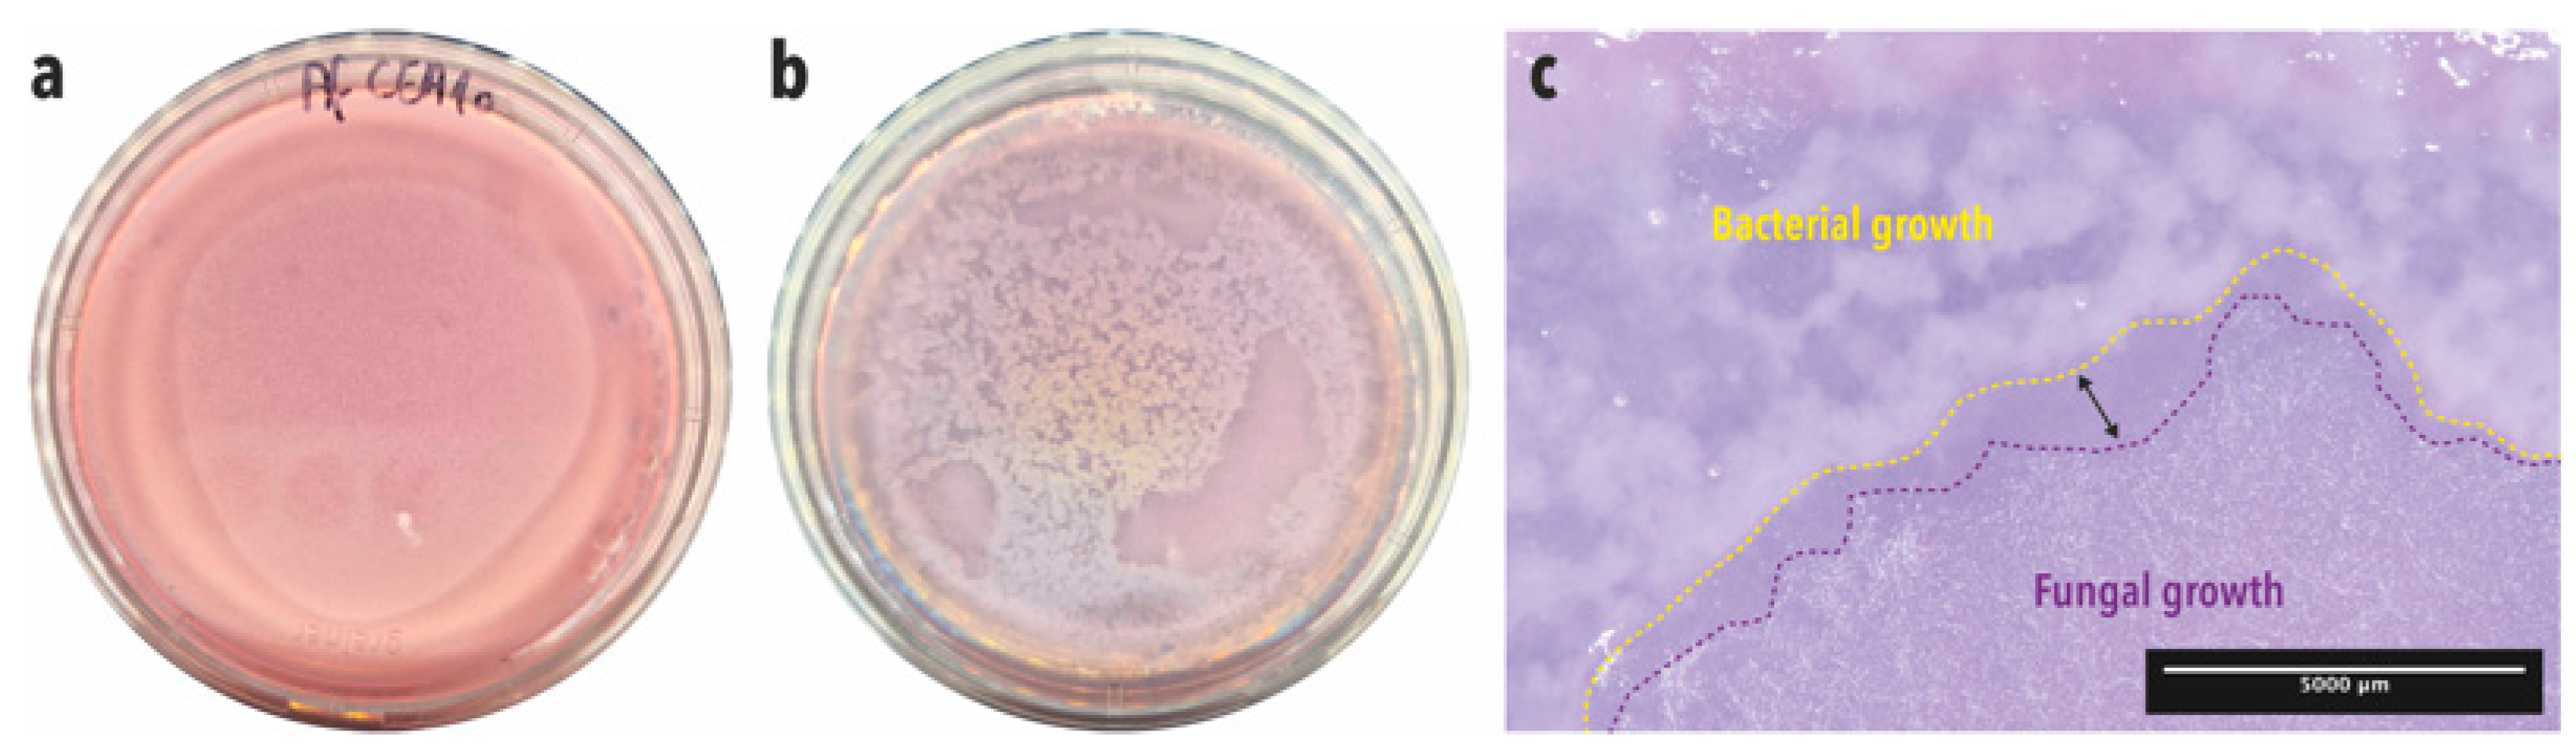
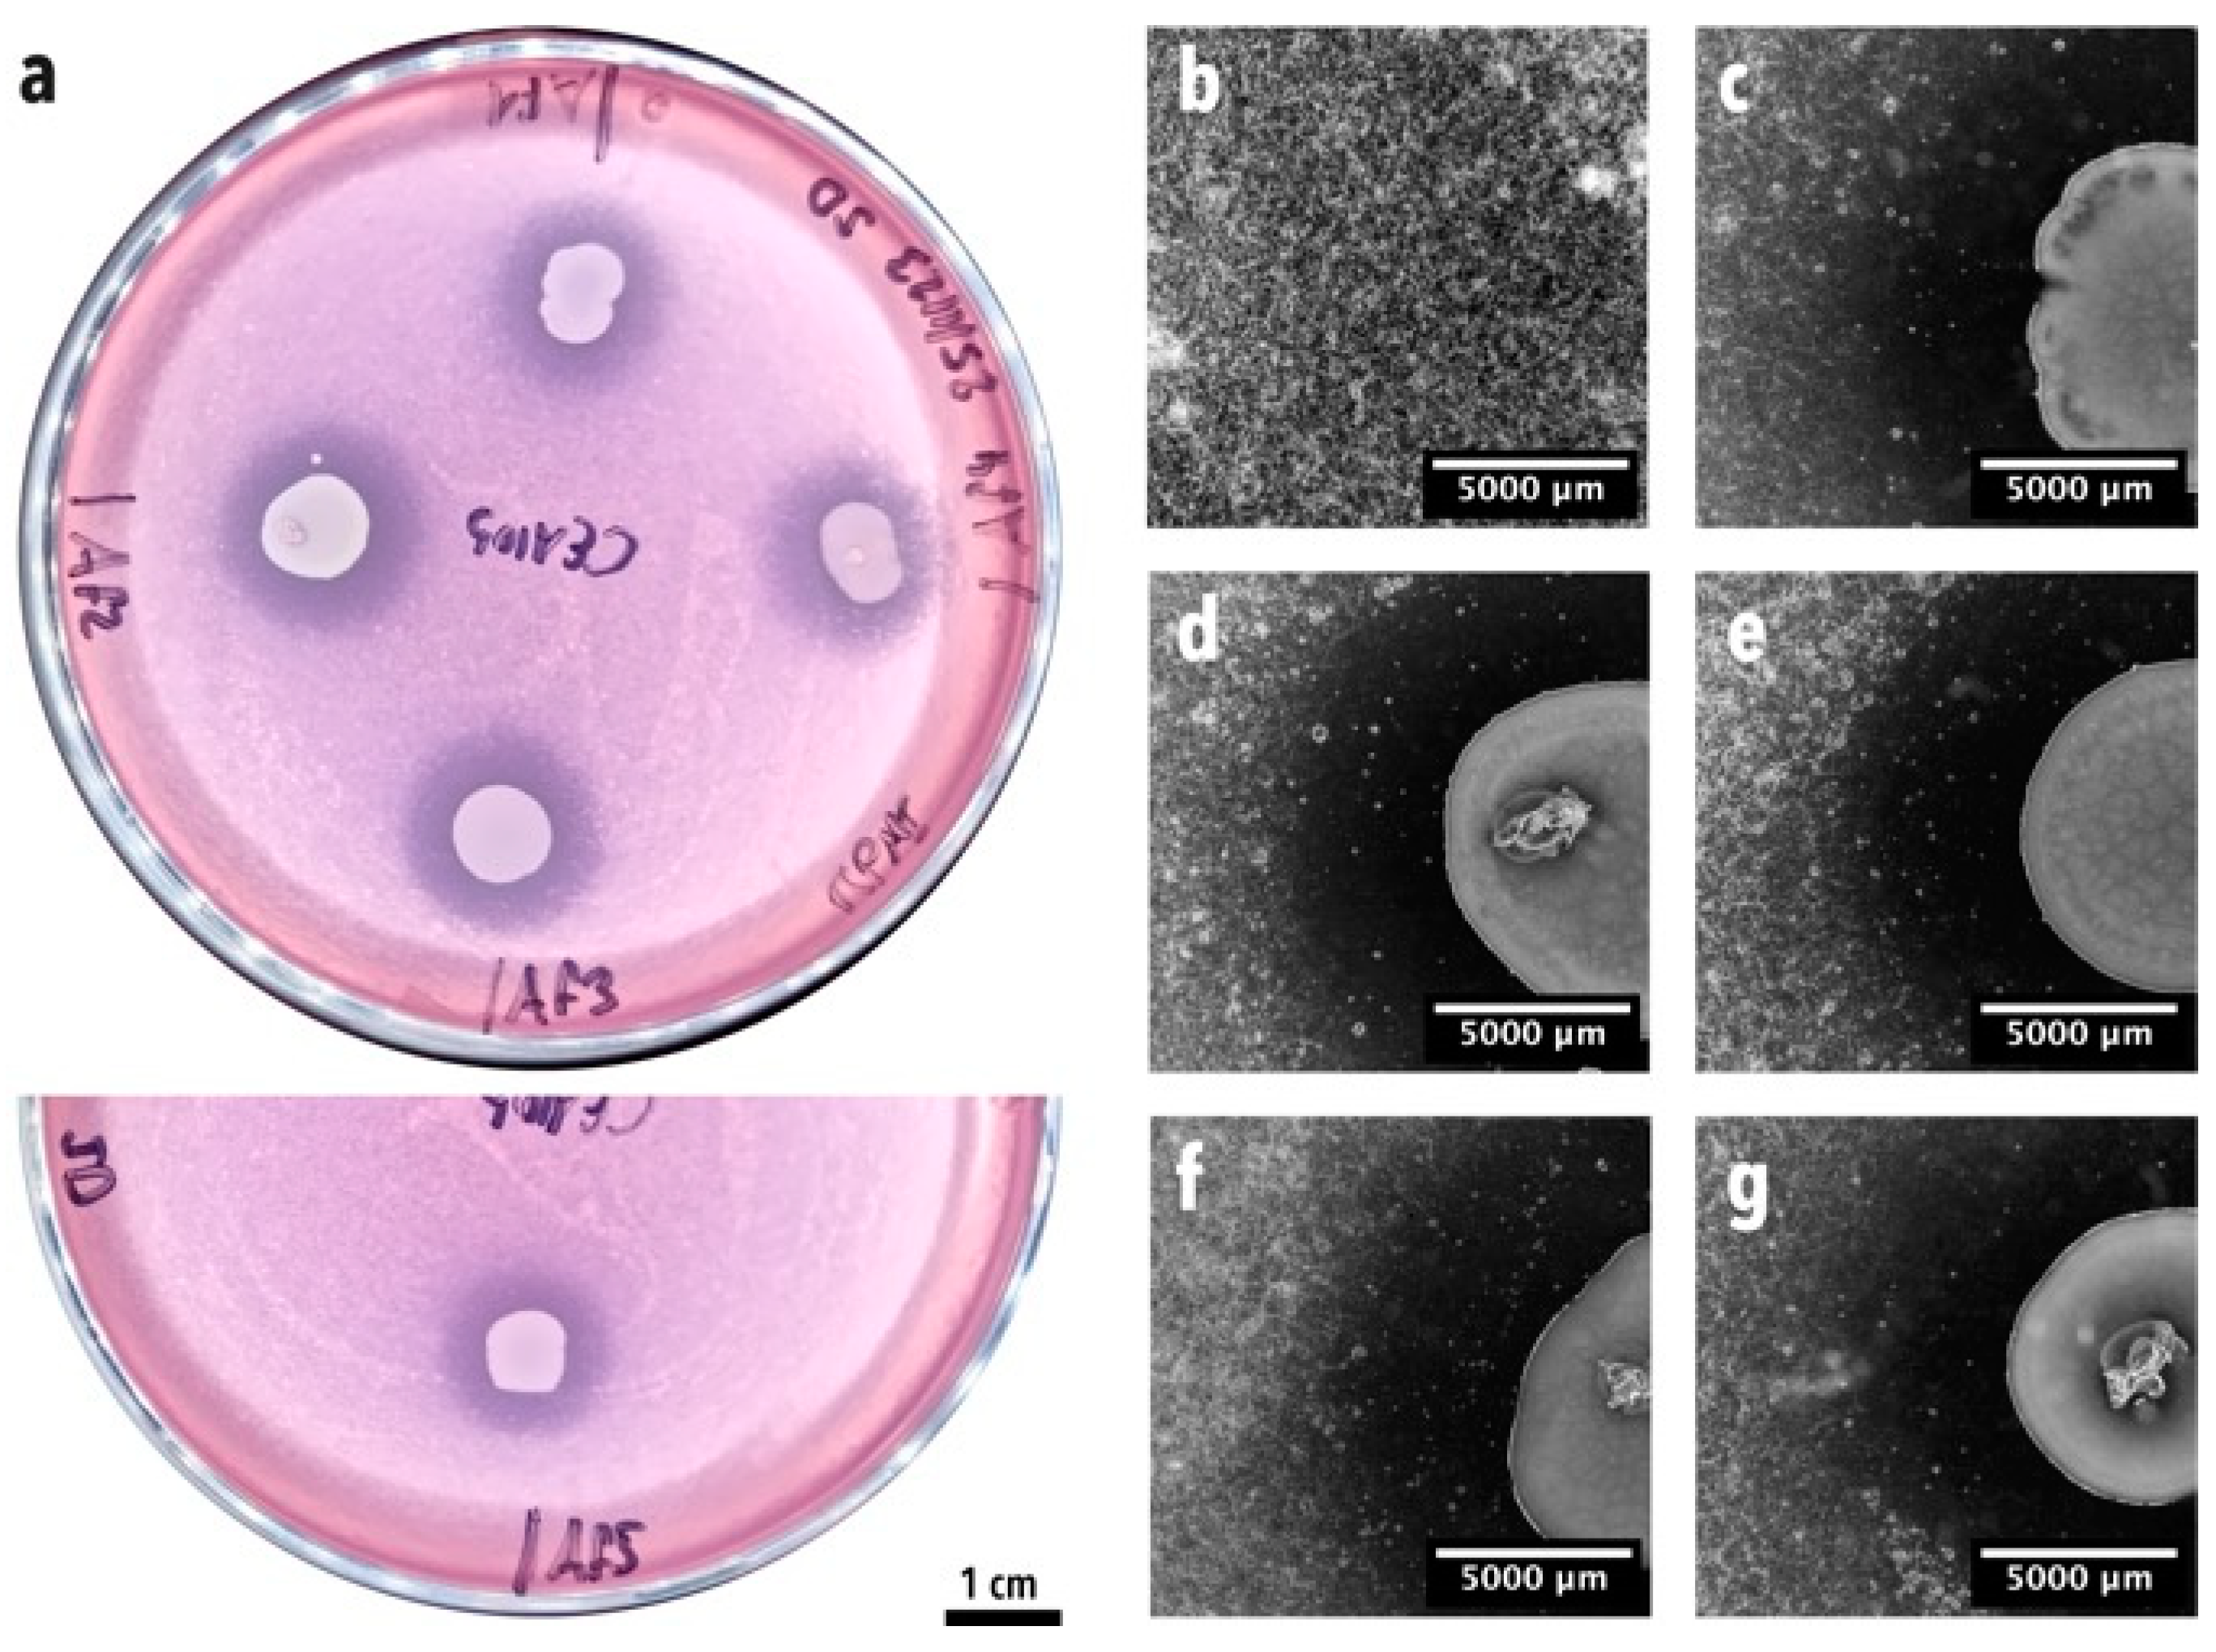
3.1. Enrichment and Isolation of Lung Bacteria Inhibiting A. fumigatus Conidia Germination and Growth in One-Step Soft agar Plate Assay

A one-step soft agar plate assay was used to directly enrich and isolate bacterial strains able to inhibit the germination and growth of A. fumigatus CEA10 conidia from BALF samples. After 24 h of incubation, germination and growth of A. fumigatus conidia was visible in the fungus-alone control plate (Figure 2a). When the concentrated BALF was added onto the soft agar layer containing fungal spores, fungal growth was inhibited, and the fungus grew only in the area where bacteria were not present (Figure 2b). Moreover, an inhibition zone was visible in the interaction zone between bacteria and the fungus (double-headed arrow, Figure 2c).
Five macroscopically different bacterial isolates were obtained after the isolation step. The inhibitory action of the five isolates was confirmed by placing them in confrontation with A. fumigatus using the soft agar assay in RPMI medium. All five bacterial strains showed a clear and strong inhibitory effect on A. fumigatus conidia germination and growth, which was made visible by the inhibition halos around the bacterial colonies (Figure 3a). Moreover, close-up images of the interaction zones between the bacteria and the fungus showed an inhibition zone where no fungal growth was observed (Figure 3c–g), compared with the zones in which fungal growth was visible (Figure 3b).
The five BALF isolates were identified as Pseudomonas aeruginosa after Sanger sequencing of the 16S rRNA gene (Table 4).

3.2. Genotyping of the Five BALF P. aeruginosa Isolates

The genotypic diversity of the five BALF P. aeruginosa isolates was then compared using a quick genotypic fingerprinting by RAPD–PCR to check if the isolated strains were clonal or not, given that the BAL samples were pooled to concentrate bacterial biomass. The RAPD–PCR of the five P. aeruginosa strains isolated in this study revealed highly similar banding patterns on an agarose gel (Figure 4). This suggests that the isolates were clonal or highly similar genetically. This became evident when the isolates were compared with ten additional P. aeruginosa strains, which exhibited clearly different genotypes, except for isolate Pa-1. Indeed, isolate Pa-1 showed a similar banding pattern to isolates b1 to b5, suggesting this expectoration strain is genetically similar to the BALF isolates.

3.3. High-Throughput Germination Screening Assay

A high-throughput germination screening assay was developed to rapidly assess the inhibition potential of BALF bacterial isolates against A. fumigatus and select the best candidates for subsequent testing on Calu-3 cell monolayers. Using bioluminescence as a redout, conidia germination and hyphal growth can be monitored through light emission measurements thanks to the constitutive expression of the red-shifted firefly luciferase, which is under the glyceraldehyde-3-phosphate dehydrogenase promoter (PgpdA) in A. fumigatus CEA10b. Figure 5 shows the kinetic of A. fumigatus conidia germination and growth, through the measurement of bioluminescence over 48 h, alone or in confrontation with the five BALF P. aeruginosa isolates. When inoculated alone, A. fumigatus shows an exponential increase in bioluminescence signal after 10 h incubation indicating growth (Figure S1). The positive inhibition control, i.e., cycloheximide, initially inhibited the germination of A. fumigatus conidia. However, after approximately 30 h incubation, an increase in bioluminescence signal was recorded, indicating germination and growth of the fungus (Figure S1). Regarding the confrontation with the five BALF P. aeruginosa isolates, strain b1 showed a partial inhibition effect against A. fumigatus, which conidia were able to swell (Figure S1). On the other hand, strain b2 was able to completely inhibit the germination and growth of A. fumigatus (Figure S1). This was shown by a very weak bioluminescence signal. Finally, strains b3 to b5 showed a partial inhibition of A. fumigatus growth but allowed swelling of some of the conidia. Based on these results, BALF P. aeruginosa strains b1 and b2 were selected for the Calu-3 in-vitro confrontations.
In addition, to assess the specificity of the novel one-step enrichment and isolation method presented in this study, we also tested ten additional P. aeruginosa strains that were isolated from expectoration samples in a medical diagnostics laboratory (Table 2). These strains exhibited varying degrees of inhibition against A. fumigatus, similar to the BALF isolates (Figures S2 and S3). Based on these results, we then tested the isolates b1 and b2 against isolates Pa-1 and Pa-2, the former allowing germination, while the latter does not, as well as isolates PaM-1 and PaM-4, with the first inhibiting the germination, and the second allowing both germination and hyphal growth, in order to be able to compare them (Figures S4 and S5). The expectoration isolate Pa-1 inhibited the germination of A. fumigatus conidia, allowing less conidial swelling compared with isolate b1 (Figure S5). All six selected strains tested demonstrated a similar inhibition ability against A. fumigatus.

3.4. In-Vitro Confrontation of A. fumigatus with BALF P. aeruginosa Isolates on Calu-3 Cell Monolayers

The effect of inoculation of 100 A. fumigatus CEA10b conidia alone or in co-culture with 100 P. aeruginosa b1 or b2 cells was assessed in Calu-3 cell culture monolayers on Transwell® inserts. We first assessed fungal growth by imaging bioluminescence emission by A. fumigatus. The infection template of each of the three independent plates used is depicted on the top in Figure 6a–c, with the corresponding images taken with the bioluminescence imager on the bottom. Detection of light emission by A. fumigatus is visible by the presence of a black spot in the fungus-infected cell inserts (C + F, Figure 6). However, in the co-infected inserts, i.e., C + F + b1 and C + F + b2, no bioluminescence was detected (Figure 6), suggesting a control of A. fumigatus growth by the bacterial isolates b1 and b2.
We then performed confocal imaging to confirm inhibition of A. fumigatus conidia germination by both P. aeruginosa b1 and b2 strains, when co-cultured together on the Calu-3 cell monolayers. After 16 days of incubation, the Calu-3 cells in the ‘no-infection control’ displayed a polygonal shape with the actin filaments clearly visible at the edges of the cells and expressed tight-junctions (ZO-1 protein in red) (Figure 7a). After 19 h of infection, A. fumigatus conidia were able to germinate and grow, as indicated by the presence of hyphae (in red) on top of the monolayer (Figure 7b). Moreover, the orthogonal views of the Z-stacks images of the Calu-3 monolayers infected with A. fumigatus showed that the fungus forms a dense hyphal layer at the surface of the epithelial monolayer (Figure S6a), and that some hyphae penetrate the Calu-3 monolayer (Figure S6b). Infection of the Calu-3 cells with A. fumigatus did not seem to cause significant damage to the monolayer (Figure 7c). This is, however, not the case with both P. aeruginosa isolates b1 and b2, which caused significant damage to the Calu-3 monolayer, as shown by the presence of holes in the epithelial monolayer (Figure 7d,e). Moreover, tight junction proteins were found to be preferentially expressed at the edges of the holes, while actin was not present (Figure 7d,e). In the case of the co-infection conditions, we could confirm that P. aeruginosa strains b1 and b2 were able to control the germination and growth of A. fumigatus conidia, since no hyphae were visible on the Calu-3 monolayers (Figure 7f,h, respectively). Moreover, similar to the conditions in which both P. aeruginosa were alone, the tight junction protein ZO-1 was preferentially more localized at the edges of holes induced by the bacteria, while actin seemed to be absent (Figure 7g,i).
We also assessed the epithelial barrier function of the Calu-3 monolayers through trans-epithelial electrical resistance (TEER) measurements and an LY permeability assay. Figure 8a depicts the evolution of TEER over 16 days. TEER showed a regular increase in all conditions until around 2500 Ω/cm2 at day 14 and stayed constant around this value until day 15, when the infection occurred. Finally, 19 h post-infection, TEER stayed at around 2500 Ω/cm2 for the cells-alone control and the A. fumigatus-alone treatment and dropped at 1000 Ω/cm2 and below in the co-infection treatments.
The LY permeability assay showed similar results. Indeed, compared with the cell-alone control (C), which is at around 1.2% (Figure 8b), the measured LY permeability was significantly higher in the C + b1, C + b2, C + F + b1 and C + F + b2 conditions. Moreover, we also observed that, in the presence of bacteria b2, the permeability was higher than with bacteria b1 (Figure 8b).
Figure 9 shows the assessment of cytotoxicity upon infection with A. fumigatus alone, or co-inoculated with P. aeruginosa strains b1 or b2. Compared with the cells alone (C), A. fumigatus did not seem to induce a strong cytopathic effect (C + F). The same is true when P. aeruginosa b1 is added alone, or together with A. fumigatus, on the cells (C + b1 and C + F + b1). However, in the presence of P. aeruginosa b2 alone (C + b2), or with A. fumigatus (C + F + b2), the measured fluorescence intensity is significantly higher than in the control cells.

4. Discussion

In this study, we presented a novel one-step enrichment and isolation method based on a soft agar overlay plate assay in which bacteria are directly in contact with Aspergillus spp. conidia. This method considers the interkingdom interactions between bacteria and Aspergillus spp. that would occur in the lung environment in-vivo [22,23,35]. It also allows easy observation of fungal growth inhibition by candidate antagonistic bacteria during enrichment, indicated by an inhibition halo around the bacterial inoculum. Traditionally, the enrichment and isolation steps are completely independent from the confrontation. Indeed, antagonistic bacterial strains are first isolated, and then tested against the fungal pathogen of interest in a second step [36,37]. Here, this entire approach is performed in one single step, and is thus directly enriching for bacterial strains that are antagonistic to the fungal pathogen of interest. While standard bacterial–fungal confrontation experiments rely on active fungal mycelium, our approach targets conidia [38], which form the infective stage in the developmental cycle of Aspergillus spp. [39]. Once Aspergillus conidia reach the lungs, they interact with various bacterial strains, which may inhibit their germination and subsequent growth into hyphae. Colonization of the lung tissue by Aspergillus spp. is a known risk factor for the development of invasive pulmonary aspergillosis [4]. While conidia germination is known to be influenced by microenvironmental factors [8,9,10,11,12,13,14], the specific contribution of the lung microbiota in the development of Aspergillus spp. is not yet well understood.
We used five BALF samples from subjects who underwent a lung transplantation and were followed up at the Lausanne University Hospital (CHUV), as sources for potential bacterial isolates inhibiting the germination of Aspergillus conidia. Enrichment and isolation on bi-layered soft agar RPMI medium containing A. fumigatus conidia yielded five bacterial isolates all identified as P. aeruginosa. P. aeruginosa is an opportunistic pathogen and is commonly isolated in lung transplanted patients [40,41]. Interestingly, genotypic profiling through RAPD–PCR revealed that these five isolates were clonal, or at least highly genetically similar, compared with the ten additional P. aeruginosa strains isolated from expectoration samples. RAPD–PCR genotyping was chosen as a fast genotypic profiling technique for the differentiation of the five strains isolated in this study. This profiling technique is commonly used for discriminating closely related P. aeruginosa isolates. Moreover, the primer 272 used in this study was shown to have a higher discriminatory potential compared with other primers used for P. aeruginosa genotyping [30,31]. The predominance of this specific clonal lineage of P. aeruginosa over other genotypes suggests that the enrichment method used here may have exerted strong selective pressure due to the presence of Aspergillus conidia.
RPMI medium, which is commonly used in host–pathogen studies, supports the growth of a diverse range of bacterial species, including those present in the lung microbiota. Das, Bernasconi [27] showed that several lung isolates, such as for instance Micrococcus luteus, Staphylococcus aureus, Staphylococcus epidermidis, Streptococcus vestibularis, and Streptococcus oralis, were able to grow in RPMI. Moreover, Sanchez-Rosario and Johnson [42] and Leonidou, Ostyn [43] respectively showed that Streptococcus pneumoniae and Rothia mucilaginosa were also able to grow in RPMI.
Given the broad range of bacterial species supported by RPMI, the observed predominance of P. aeruginosa in our samples is likely influenced by specific factors associated with lung transplant patients. Notably, three out of the five BALF samples used in this study were obtained from patients who had received antibacterial treatment, which could have influenced the predominance of P. aeruginosa isolates. Antibacterials, as well as antifungals, are often used as prophylactic or therapeutic treatments in lung transplanted patients [44,45]. Das, Bernasconi [27] showed that there is a negative relationship between the number of antibiotics administered to transplanted patients and the imbalance of the lung microbiota, with Pseudomonas spp. being more prevalent when increasing the number of administered antibiotics. While the opportunistic pathogenic nature of P. aeruginosa offers limited value for direct clinical translation for the strains obtained here, the enrichment and isolation approach described in this study can be applied to other BALF or upper respiratory tract samples to isolate commensal bacterial antagonists with greater potential for future clinical application.
We assessed and confirmed the inhibitory potential of the five BALF P. aeruginosa isolates by using, on the one hand, the same bi-layered soft agar RPMI plate assay employed during the enrichment, and, on the other, a high-throughput germination screening assay. The high-throughput germination screening assay permitted us to rapidly identify interesting bacterial candidates able to inhibit the germination of A. fumigatus conidia to test in subsequent Calu-3 cell monolayer models. The bioluminescent strain of A. fumigatus CEA10 used in this study was constructed by Resendiz-Sharpe, da Silva [26] by inserting a codon-optimized thermostable-red-shifted firefly luciferase. As the expression of the red-shifted firefly luciferase is under the control of the constitutively active glyceraldehyde-3-phosphate dehydrogenase promoter (PgpdA), light emission is observed upon germination of conidia and hyphal growth [26]. P. aeruginosa strains b1 and b2 were selected because of their differential inhibitory effect: strain b1 allowed swelling of conidia, while strain b2 completely inhibited conidia germination, which was easily visible in the high-throughput germination screening assay. Their inhibitory potential did not differ compared with the other P. aeruginosa isolates tested in this study, i.e., strains Pa-1 to Pa-5 and PaM-1 to PaM-5. Indeed, the interaction between A. fumigatus and P. aeruginosa is well described and has been reviewed extensively [23,35]. This interaction is common in CF patients and relies mainly on iron [46]. Among other mechanisms, Aspergillus and Pseudomonas mutually inhibit each other through the secretion of gliotoxin or siderophores (hydroxamate), and pyoverdine or dirhamnolipids by A. fumigatus and P. aeruginosa, respectively [23,35]. P. aeruginosa is also known to antagonize other major fungal pathogens such as Candida spp. [47] and Cryptococcus spp. [48].
Furthermore, A. fumigatus CEA10 was confronted with P. aeruginosa strains b1 and b2 on Calu-3 cell monolayers. Inhibition of conidia germination and growth was then assessed by bioluminescence emission, as well as confocal microscopy. Moreover, the impact of these Aspergillus–Pseudomonas confrontations on epithelial barrier function and cytotoxicity was also investigated. We confirmed the inhibitory effect of both P. aeruginosa strains, i.e., b1 and b2, on the germination of A. fumigatus conidia and its mycelial growth on Calu-3 cell monolayers. Indeed, no bioluminescent signal was recorded when A. fumigatus conidia were co-inoculated with P. aeruginosa strains b1 and b2, as compared with when A. fumigatus was inoculated alone. To our knowledge, this is the first time a bioluminescent strain of A. fumigatus has been used in a cell culture model. As light emission is proportional to fungal growth, bioluminescence measurements could be used as a semi-quantitative approach to measure A. fumigatus colonization on an in-vitro lung cell culture model. The inhibitory effect of P. aeruginosa strains b1 and b2 on A. fumigatus growth was also confirmed through confocal microscopy. While fungal hyphae were visible when A. fumigatus was inoculated alone on Calu-3 cell monolayers, no visible growth was observed in the co-cultures with P. aeruginosa b1 and b2.
Moreover, P. aeruginosa strains b1 and b2, either inoculated alone, or co-inoculated with A. fumigatus, were found to cause significant damage to the Calu-3 cell monolayers. Holes were visible in the Calu-3 monolayers, especially in the presence of P. aeruginosa b2. These observations were confirmed by the cytotoxicity assay, which showed a high fluorescent signal in the presence of P. aeruginosa b2 alone, or co-inoculated with A. fumigatus, suggesting the release of high numbers of dead-cell proteases. P. aeruginosa is known to have a strong cytotoxicity effect in lung epithelial cells, notably through the induction of various forms of cell death, leading to cell lysis [49]. However, the exact underlying mechanism for higher cytotoxicity in strain b2 is currently unknown.
Epithelial barrier integrity was assessed through TEER measurements over 16 days, as well as LY permeability assay as an end-point measurement. TEER was found to increase regularly until reaching a value of around 2500 Ω/cm2 at day 15, when the infection was complete. Typical TEER values for healthy Calu-3 cells range between 1000 and 2000 Ω × cm2 in submerged (liquid–liquid interface) conditions [50,51]. TEER values in the cell-control only and A. fumigatus-alone infected Calu-3 monolayers stayed constant around 2500 Ω/cm2. However, a strong decrease in TEER was observed when both P. aeruginosa strains were added to Calu-3 cells alone, or co-inoculated with A. fumigatus. P. aeruginosa has a strong cytotoxicity effect [49] and is known to have a disruptive effect on TEER [52]. Permeability assay using the paracellular marker LY showed similar results. However, TEER was found to be more sensitive. TEER is a strong indicator of the integrity of the barrier, even before the ability to measure it using permeability markers [53]. As shown in the co-culture with bacterial strains b1 and b2, the decrease in TEER values, increase in LY permeability, and visible damage to the Calu-3 cell monolayer observed under microscopy, collectively indicate a significant disruption of epithelial barrier integrity caused by the bacteria.
Here, we have presented an innovative and promising one-step enrichment and isolation method with which to directly confront bacterial strains with A. fumigatus conidia, one that offers significant advantages over traditional methods of bacterial strain isolation. This one-step method not only accelerates the identification of bacterial strains antagonistic to fungal pathogens, but also better reflects interkingdom interactions occurring between bacterial strains from the lung microbiota and lung fungal pathogens such as A. fumigatus. However, our study has several limitations, as follows: (1) the clinical samples originated from a single hospital center, which may affect the broader applicability of the findings and (2) BALF samples had to be pooled because of low microbial biomass, potentially obscuring inter-individual variability.
The implications of the findings highlighted in this study and their translatability to clinical practice are significant. First, commensal bacterial strains isolated using the method and showing a significant germination and growth inhibition of A. fumigatus could be the basis of a microbial-based therapeutic product for the management of Aspergillus infections [54]. Second, these microorganisms can also be used to investigate the interactions with current therapies to better understand drug resistance development.

5. Conclusions

To conclude, we successfully isolated five genotypically similar P. aeruginosa strains capable of inhibiting the germination and growth of A. fumigatus conidia from BALF samples obtained from lung transplant recipients. These bacteria were able to inhibit the germination and growth of A. fumigatus conidia in different experimental set-ups. Although P. aeruginosa is a known opportunistic lung pathogen and antagonist of A. fumigatus, the results presented here serve as proof of concept, validating the experimental pipeline of one-step enrichment and isolation using the RPMI soft agar bi-layered plate assay described in this manuscript. This approach opens up new avenues for the targeted enrichment of antagonistic bacterial strains against specific fungal pathogens.

Supplementary Materials

The following supporting information can be downloaded at https://www.mdpi.com/article/10.3390/microorganisms12102025/s1; Figure S1. Single graphic of the evolution of A. fumigatus conidia germination and growth in the HTP assay in confrontation with the five P. aeruginosa strains (b1–b5); Figure S2. Evolution of A. fumigatus conidia germination and growth in the HTP assay in confrontation with the ten additional P. aeruginosa strains (Pa-1–Pa-5, and PaM-1–PaM-5) provided by ADMED Microbiologie; Figure S3. Single graphic of the evolution of A. fumigatus conidia germination and growth in the HTP assay in confrontation with the ten additional P. aeruginosa strains (Pa-1–Pa-5, and PaM-1–PaM-5) provided by ADMED Microbiologie; Figure S4. Evolution of A. fumigatus conidia germination and growth in the HTP assay in confrontation with selected P. aeruginosa strains (b1, b2, Pa-1, Pa-2, PaM-1, and PaM-4); Figure S5. Single graphic of the evolution of A. fumigatus conidia germination and growth in the HTP assay in confrontation with selected P.aeruginosa strains (b1, b2, Pa-1, Pa-2, PaM-1, and PaM-4); Figure S6. Orthogonal views of confocal microscopic Z-stacks pictures of Calu-3 cells infected by A. fumigatus.

Author Contributions

Conceptualization, F.P. and P.J.; methodology, F.P. and P.J.; software, F.P. and J.D.; validation, F.P., N.U. and P.J.; formal analysis, F.P., M.M., J.D. and M.G.; investigation, F.P., J.D., M.G., M.M., J.H., B.S. and L.B.; resources, C.v.G., N.U. and P.J.; data curation, F.P. and J.D.; writing—original draft preparation, F.P., M.M., J.D. and M.G.; writing—review and editing, All authors; visualization, F.P., M.M., J.D. and M.G.; supervision, P.J.; project administration, P.J.; funding acquisition, P.J., M.P., A.K., E.B. and F.P. All authors have read and agreed to the published version of the manuscript.

Funding

This research was funded by the Swiss National Science Foundation through the BRIDGE Discovery program under grant agreement 194701 (P.J., M.P., A.K.); the Novartis Foundation, through the FreeNovation program (P.J.); the Gebert Rüf Stiftung under grant agreement GRS-064/18 (P.J.); the “Fondation Professeur Placide Nicod” (E.B.); and by the “Ligue Pulmonaire Neuchâteloise” (F.P.).

Institutional Review Board Statement

The study was conducted in accordance with the Declaration of Helsinki and was approved by the local ethics committee (Commission cantonale (VD) d’éthique de la recherche sur l’être humain, CER-VD No 2018-01818, approved on 25 February 2019). All subjects gave their written informed consent. Samples were anonymized according to local ethics committee requirements.

Data Availability Statement

All data are available in the main text or the Supplementary Materials. The R code used for the generation of kinetic bioluminescence graphic in the high-throughput assay can be found at https://github.com/palmierif/htp-biolum-afum (accessed on 30 September 2024).

Acknowledgments

The authors kindly acknowledge Matthias Brock for providing the red-shifted bioluminescent strain of A. fumigatus CEA10, Anthony Croxatto and Aurélie Scherler from ADMED Microbiologie for providing the additional P. aeruginosa strains (Pa-1 to Pa-5, and PaM-1 to PaM-5), and Carlos Wotzkow and Fabian Blank from the Live Cell Imaging Core Facility at the University of Bern for assistance during confocal images acquisition.

Conflicts of Interest

The authors declare no conflicts of interest.

References

  1. Denning, D.W. Global incidence and mortality of severe fungal disease. Lancet Infect. Dis. 2024, 24, e428–e438. [Google Scholar] [CrossRef] [PubMed]
  2. Paulussen, C.; Hallsworth, J.E.; Álvarez-Pérez, S.; Nierman, W.C.; Hamill, P.G.; Blain, D.; Rediers, H.; Lievens, B. Ecology of aspergillosis: Insights into the pathogenic potency of Aspergillus fumigatus and some other Aspergillus species. Microb. Biotechnol. 2017, 10, 296–322. [Google Scholar] [CrossRef] [PubMed]
  3. Latgé, J.P.; Chamilos, G. Aspergillus fumigatus and Aspergillosis in 2019. Clin. Microbiol. Rev. 2019, 33. [Google Scholar] [CrossRef] [PubMed]
  4. Gago, S.; Denning, D.W.; Bowyer, P. Pathophysiological aspects of Aspergillus colonization in disease. Med. Mycol. 2019, 57, S219–S227. [Google Scholar] [CrossRef]
  5. WHO. WHO Fungal Priority Pathogens List to Guide Research, Development and Public Health Action; World Health Organization: Geneva, Switzerland, 2022; Available online: https://www.who.int/publications/i/item/9789240060241 (accessed on 24 September 2024).
  6. Arastehfar, A.; Carvalho, A.; Houbraken, J.; Lombardi, L.; Garcia-Rubio, R.; Jenks, J.D.; Rivero-Menendez, O.; Aljohani, R.; Jacobsen, I.D.; Berman, J.; et al. Aspergillus fumigatus and aspergillosis: From basics to clinics. Stud. Mycol. 2021, 100, 100115. [Google Scholar] [CrossRef]
  7. Palmieri, F.; Koutsokera, A.; Bernasconi, E.; Junier, P.; von Garnier, C.; Ubags, N. Recent Advances in Fungal Infections: From Lung Ecology to Therapeutic Strategies With a Focus on Aspergillus spp. Front. Med. 2022, 9, 832510. [Google Scholar] [CrossRef]
  8. Ortiz, S.C.; Pennington, K.; Thomson, D.D.; Bertuzzi, M. Novel Insights into Aspergillus fumigatus Pathogenesis and Host Response from State-of-the-Art Imaging of Host-Pathogen Interactions during Infection. J. Fungi 2022, 8, 264. [Google Scholar] [CrossRef]
  9. Barda, O.; Maor, U.; Sadhasivam, S.; Bi, Y.; Zakin, V.; Prusky, D.; Sionov, E. The pH-Responsive Transcription Factor PacC Governs Pathogenicity and Ochratoxin A Biosynthesis in Aspergillus carbonarius. Front. Microbiol. 2020, 11, 210. [Google Scholar] [CrossRef]
  10. Bertuzzi, M.; Schrettl, M.; Alcazar-Fuoli, L.; Cairns, T.C.; Munoz, A.; Walker, L.A.; Herbst, S.; Safari, M.; Cheverton, A.M.; Chen, D.; et al. The pH-responsive PacC transcription factor of Aspergillus fumigatus governs epithelial entry and tissue invasion during pulmonary aspergillosis. PLoS Pathog. 2014, 10, e1004413. [Google Scholar] [CrossRef]
  11. Bignell, E.; Negrete-Urtasun, S.; Calcagno, A.M.; Haynes, K.; Arst, H.N., Jr.; Rogers, T. The Aspergillus pH-responsive transcription factor PacC regulates virulence. Mol. Microbiol. 2005, 55, 1072–1084. [Google Scholar] [CrossRef]
  12. Blatzer, M.; Schrettl, M.; Sarg, B.; Lindner, H.H.; Pfaller, K.; Haas, H. SidL, an Aspergillus fumigatus transacetylase involved in biosynthesis of the siderophores ferricrocin and hydroxyferricrocin. Appl. Environ. Microbiol. 2011, 77, 4959–4966. [Google Scholar] [CrossRef]
  13. Haas, H.; Eisendle, M.; Turgeon, B.G. Siderophores in fungal physiology and virulence. Annu. Rev. Phytopathol. 2008, 46, 149–187. [Google Scholar] [CrossRef] [PubMed]
  14. Gresnigt, M.S.; Rekiki, A.; Rasid, O.; Savers, A.; Jouvion, G.; Dannaoui, E.; Parlato, M.; Fitting, C.; Brock, M.; Cavaillon, J.-M.; et al. Reducing hypoxia and inflammation during invasive pulmonary aspergillosis by targeting the Interleukin-1 receptor. Sci. Rep. 2016, 6, 26490. [Google Scholar] [CrossRef]
  15. Hérivaux, A.; Willis, J.R.; Mercier, T.; Lagrou, K.; Gonçalves, S.M.; Gonçales, R.A.; Maertens, J.; Carvalho, A.; Gabaldón, T.; Cunha, C. Lung microbiota predict invasive pulmonary aspergillosis and its outcome in immunocompromised patients. Thorax 2021, 77, 283–291. [Google Scholar] [CrossRef] [PubMed]
  16. Ao, Z.; Xu, H.; Li, M.; Liu, H.; Deng, M.; Liu, Y. Clinical characteristics, diagnosis, outcomes and lung microbiome analysis of invasive pulmonary aspergillosis in the community-acquired pneumonia patients. BMJ Open Respir. Res. 2023, 10, e001358. [Google Scholar] [CrossRef] [PubMed]
  17. Kolwijck, E.; van de Veerdonk, F.L. The potential impact of the pulmonary microbiome on immunopathogenesis of Aspergillus-related lung disease. Eur. J. Immunol. 2014, 44, 3156–3165. [Google Scholar] [CrossRef]
  18. Li, R.; Li, J.; Zhou, X. Lung microbiome: New insights into the pathogenesis of respiratory diseases. Signal Transduct. Target. Ther. 2024, 9, 19. [Google Scholar] [CrossRef]
  19. Zhao, L.; Luo, J.L.; Ali, M.K.; Spiekerkoetter, E.; Nicolls, M.R. The Human Respiratory Microbiome: Current Understandings and Future Directions. Am. J. Respir. Cell Mol. Biol. 2023, 68, 245–255. [Google Scholar] [CrossRef]
  20. Dickson, R.P.; Erb-Downward, J.R.; Martinez, F.J.; Huffnagle, G.B. The Microbiome and the Respiratory Tract. Annu. Rev. Physiol. 2016, 78, 481–504. [Google Scholar] [CrossRef]
  21. Lynch, S.V. The Lung Microbiome and Airway Disease. Ann. Am. Thorac. Soc. 2016, 13, S462–S465. [Google Scholar] [CrossRef]
  22. Debourgogne, A.; Monpierre, L.; Sy, K.A.; Valsecchi, I.; Decousser, J.-W.; Botterel, F. Interactions between Bacteria and Aspergillus fumigatus in Airways: From the Mycobiome to Molecular Interactions. J. Fungi 2023, 9, 900. [Google Scholar] [CrossRef] [PubMed]
  23. Margalit, A.; Carolan, J.C.; Kavanagh, K. Bacterial Interactions with Aspergillus fumigatus in the Immunocompromised Lung. Microorganisms 2021, 9, 435. [Google Scholar] [CrossRef] [PubMed]
  24. Bertuzzi, M.; van Rhijn, N.; Krappmann, S.; Bowyer, P.; Bromley, M.J.; Bignell, E.M. On the lineage of Aspergillus fumigatus isolates in common laboratory use. Med. Mycol. 2020, 59, 7–13. [Google Scholar] [CrossRef]
  25. Bowyer, P.; Currin, A.; Delneri, D.; Fraczek, M.G. Telomere-to-telomere genome sequence of the model mould pathogen Aspergillus fumigatus. Nat. Commun. 2022, 13, 5394. [Google Scholar] [CrossRef]
  26. Resendiz-Sharpe, A.; da Silva, R.P.; Geib, E.; Vanderbeke, L.; Seldeslachts, L.; Hupko, C.; Brock, M.; Lagrou, K.; Vande Velde, G. Longitudinal multimodal imaging-compatible mouse model of triazole-sensitive and -resistant invasive pulmonary aspergillosis. Dis. Model. Mech. 2022, 15, dmm049165. [Google Scholar] [CrossRef]
  27. Das, S.; Bernasconi, E.; Koutsokera, A.; Wurlod, D.-A.; Tripathi, V.; Bonilla-Rosso, G.; Aubert, J.-D.; Derkenne, M.-F.; Mercier, L.; Pattaroni, C.; et al. A prevalent and culturable microbiota links ecological balance to clinical stability of the human lung after transplantation. Nat. Commun. 2021, 12, 2126. [Google Scholar] [CrossRef] [PubMed]
  28. Muyzer, G.; Teske, A.; Wirsen, C.O.; Jannasch, H.W. Phylogenetic relationships of Thiomicrospira species and their identification in deep-sea hydrothermal vent samples by denaturing gradient gel-electrophoresis of 16S rDNA fragments. Arch. Microbiol. 1995, 164, 165–172. [Google Scholar] [CrossRef]
  29. Altschul, S.F.; Gish, W.; Miller, W.; Myers, E.W.; Lipman, D.J. Basic local alignment search tool. J. Mol. Biol. 1990, 215, 403–410. [Google Scholar] [CrossRef] [PubMed]
  30. Hematzadeh, A.; Haghkhah, M. Biotyping of isolates of Pseudomonas aeruginosa isolated from human infections by RAPD and ERIC-PCR. Heliyon 2021, 7, e07967. [Google Scholar] [CrossRef]
  31. Nanvazadeh, F.; Khosravi, A.D.; Zolfaghari, M.R.; Parhizgari, N. Genotyping of Pseudomonas aeruginosa strains isolated from burn patients by RAPD-PCR. Burns 2013, 39, 1409–1413. [Google Scholar] [CrossRef]
  32. Brock, M.; Jouvion, G.; Droin-Bergère, S.; Dussurget, O.; Nicola, M.A.; Ibrahim-Granet, O. Bioluminescent Aspergillus fumigatus, a new tool for drug efficiency testing and in vivo monitoring of invasive aspergillosis. Appl. Environ. Microbiol. 2008, 74, 7023–7035. [Google Scholar] [CrossRef] [PubMed]
  33. Arefin, A.; McCulloch, Q.; Martinez, R.; Martin, S.A.; Singh, R.; Ishak, O.M.; Higgins, E.M.; Haffey, K.E.; Huang, J.H.; Iyer, S.; et al. Micromachining of Polyurethane Membranes for Tissue Engineering Applications. ACS Biomater. Sci. Eng. 2018, 4, 3522–3533. [Google Scholar] [CrossRef]
  34. Quast, J. ggplate: Create Layout Plots of Biological Culture Plates and Microplates. 2023. Available online: https://github.com/jpquast/ggplate (accessed on 24 September 2024).
  35. Sass, G.; Nazik, H.; Penner, J.; Shah, H.; Ansari, S.R.; Clemons, K.V.; Groleau, M.C.; Dietl, A.M.; Visca, P.; Haas, H.; et al. Aspergillus-Pseudomonas interaction, relevant to competition in airways. Med. Mycol. 2019, 57 (Suppl. S2), S228–S232. [Google Scholar] [CrossRef]
  36. Anith, K.N.; Nysanth, N.S.; Natarajan, C. Novel and rapid agar plate methods for in vitro assessment of bacterial biocontrol isolates’ antagonism against multiple fungal phytopathogens. Lett. Appl. Microbiol. 2021, 73, 229–236. [Google Scholar] [CrossRef] [PubMed]
  37. Muñoz, C.Y.; Zhou, L.; Yi, Y.; Kuipers, O.P. Biocontrol properties from phyllospheric bacteria isolated from Solanum lycopersicum and Lactuca sativa and genome mining of antimicrobial gene clusters. BMC Genom. 2022, 23, 152. [Google Scholar] [CrossRef]
  38. Estoppey, A.; Weisskopf, L.; Di Francesco, E.; Vallat-Michel, A.; Bindschedler, S.; Chain, P.S.; Junier, P. Improved methods to assess the effect of bacteria on germination of fungal spores. FEMS Microbiol. Lett. 2022, 369, fnac034. [Google Scholar] [CrossRef]
  39. Verburg, K.; van Neer, J.; Duca, M.; de Cock, H. Novel Treatment Approach for Aspergilloses by Targeting Germination. J. Fungi 2022, 8, 758. [Google Scholar] [CrossRef]
  40. Stjärne Aspelund, A.; Hammarström, H.; Inghammar, M.; Larsson, H.; Hansson, L.; Riise, G.C.; Friman, V.; Christensson, B.; Påhlman, L.I. Microbiological findings in bronchoalveolar lavage fluid from lung transplant patients in Sweden. Transpl. Infect. Dis. 2018, 20, e12973. [Google Scholar] [CrossRef] [PubMed]
  41. Zeglen, S.; Wojarski, J.; Wozniak-Grygiel, E.; Siola, M.; Jastrzebski, D.; Kucewicz-Czech, E.; Zembala, M. Frequency of Pseudomonas aeruginosa colonizations/infections in lung transplant recipients. Transplant. Proc. 2009, 41, 3222–3224. [Google Scholar] [CrossRef]
  42. Sanchez-Rosario, Y.; Johnson, M.D.L. Media Matters, Examining Historical and Modern Streptococcus pneumoniae Growth Media and the Experiments They Affect. Front. Cell Infect. Microbiol. 2021, 11, 613623. [Google Scholar] [CrossRef]
  43. Leonidou, N.; Ostyn, L.; Coenye, T.; Crabbe, A.; Drager, A. Genome-scale model of Rothia mucilaginosa predicts gene essentialities and reveals metabolic capabilities. Microbiol. Spectr. 2024, 12, e0400623. [Google Scholar] [CrossRef] [PubMed]
  44. Okamoto, K.; Santos, C.A.Q. Management and prophylaxis of bacterial and mycobacterial infections among lung transplant recipients. Ann. Transl. Med. 2020, 8, 413. [Google Scholar] [CrossRef] [PubMed]
  45. Patel, T.S.; Eschenauer, G.A.; Stuckey, L.J.; Carver, P.L. Antifungal Prophylaxis in Lung Transplant Recipients. Transplantation 2016, 100, 1815–1826. [Google Scholar] [CrossRef] [PubMed]
  46. Keown, K.; Reid, A.; Moore, J.E.; Taggart, C.C.; Downey, D.G. Coinfection with Pseudomonas aeruginosa and Aspergillus fumigatus in cystic fibrosis. Eur. Respir. Rev. 2020, 29, 200011. [Google Scholar] [CrossRef] [PubMed]
  47. Fourie, R.; Pohl, C.H. Beyond Antagonism: The Interaction Between Candida Species and Pseudomonas aeruginosa. J. Fungi 2019, 5, 34. [Google Scholar] [CrossRef]
  48. Mayer, F.L.; Kronstad, J.W. The Spectrum of Interactions between Cryptococcus neoformans and Bacteria. J. Fungi 2019, 5, 31. [Google Scholar] [CrossRef]
  49. Wood, S.J.; Goldufsky, J.W.; Seu, M.Y.; Dorafshar, A.H.; Shafikhani, S.H. Pseudomonas aeruginosa Cytotoxins: Mechanisms of Cytotoxicity and Impact on Inflammatory Responses. Cells 2023, 12, 195. [Google Scholar] [CrossRef]
  50. Braakhuis, H.M.; He, R.; Vandebriel, R.J.; Gremmer, E.R.; Zwart, E.; Vermeulen, J.P.; Fokkens, P.; Boere, J.; Gosens, I.; Cassee, F.R.; et al. An Air-liquid Interface Bronchial Epithelial Model for Realistic, Repeated Inhalation Exposure to Airborne Particles for Toxicity Testing. JoVE 2020, 159, e61210. [Google Scholar] [CrossRef]
  51. Grainger, C.I.; Greenwell, L.L.; Lockley, D.J.; Martin, G.P.; Forbes, B. Culture of Calu-3 Cells at the Air Interface Provides a Representative Model of the Airway Epithelial Barrier. Pharm. Res. 2006, 23, 1482–1490. [Google Scholar] [CrossRef]
  52. Li, J.; Ramezanpour, M.; Fong, S.A.; Cooksley, C.; Murphy, J.; Suzuki, M.; Psaltis, A.J.; Wormald, P.J.; Vreugde, S. Pseudomonas aeruginosa Exoprotein-Induced Barrier Disruption Correlates With Elastase Activity and Marks Chronic Rhinosinusitis Severity. Front. Cell. Infect. Microbiol. 2019, 9, 38. [Google Scholar] [CrossRef]
  53. Srinivasan, B.; Kolli, A.R.; Esch, M.B.; Abaci, H.E.; Shuler, M.L.; Hickman, J.J. TEER Measurement Techniques for In Vitro Barrier Model Systems. J. Lab. Autom. 2015, 20, 107–126. [Google Scholar] [CrossRef] [PubMed]
  54. Navalkele, B.; Chopra, T. Clinical Application of Live Biotherapeutic Products in Infectious Diseases. Front. Microbiomes 2024, 3, 1415083. [Google Scholar] [CrossRef]
Figure 1. Flow chart diagram illustrating all of the methodological steps (Section 2.1, Section 2.2, Section 2.3, Section 2.4, Section 2.5, Section 2.6, Section 2.7, Section 2.8, Section 2.9, Section 2.10, Section 2.11, Section 2.12, Section 2.13 and Section 2.14) described in this study. Chart was produced using Draw.io (https://www.drawio.com/, accessed on 20 September 2024).
Microorganisms 12 02025 g001
Figure 2. One-step soft agar enrichment and isolation of A. fumigatus conidia germination-inhibiting bacterial strains from BALF samples. (a) Fungus-alone control plate after 24 h incubation. (b) BALF-Aspergillus co-culture plate after 24 h incubation. (c) Close-up stereoscopic image of the co-culture plate where an inhibition zone is visible (double-headed arrow) in-between the bacterial growth zone, which is delineated with a yellow-dashed lined, and the fungal growth zone, which is delineated with a purple-dashed line.
Microorganisms 12 02025 g002
Figure 3. Soft agar confrontation assay between A. fumigatus CEA10 and the five BALF isolates. (a) Macroscopic image of the confrontation plates where A. fumigatus conidia germination inhibition halos are visible around bacterial colonies. Af1 = isolate b1, Af2 = isolate b2, Af3 = isolate b3, Af4 = isolate b4, Af5 = isolate b5. Images (bg) were taken with a stereoscope. (b) Fungal growth control. (c) Isolate b1. (d) Isolate b2. (e) Isolate b3. (f) Isolate b4. (g) Isolate b5.
Microorganisms 12 02025 g003
Figure 4. Genotypic profiling of the isolated P. aeruginosa strains by RAPD–PCR. MM: Molecular marker (Quick-Load® Purple 1 kb Plus DNA Ladder (BioConcept Ltd., Allschwil, Switzerland)), b1–5 = P. aeruginosa strains isolated in this study, Pa-1–5 = P. aeruginosa strains, PaM-1–5 = cystic fibrosis P. aeruginosa strains.
Microorganisms 12 02025 g004
Figure 5. Evolution of A. fumigatus conidia germination and growth in the high-throughput germination screening assay in confrontation with the five Pseudomonas aeruginosa strains (b1–b5). The graph shows the mean bioluminescence signal [photons/sec] of four replicates emitted by A. fumigatus (Afum) over 48 h. Measurements were taken every 30 min. Panel (b) is a close-up view of (a). A. fumigatus alone (Afum Ctrl, in red) was used as a control for conidia germination and growth. A. fumigatus + Cycloheximide (Afum + Cyclo, in green) was used as a positive control of A. fumigatus inhibition. A. fumigatus (Afum) + b1–b5 represent the confrontation treatments with the five different isolates. Two-way ANOVA revealed that the treatment was highly significant (p-value < 2 × 10⁻¹⁶. Tukey multiple comparisons test was performed to compare means of Afum Ctrl with all other treatments (Afum + Cyclo, Afum + b1, Afum + b2, Afum + b3, Afum + b4, Afum + b5). All adjusted p-values (p adj) were highly significant (p-value = 0).
Microorganisms 12 02025 g005
Figure 6. Bioluminescence imaging of infected plates. Plate layout is depicted on the top of each panel. Bioluminescence emission by A. fumigatus CEA10b alone or in the presence of the five BALF P. aeruginosa isolates was recorded and imaged using an Amersham Imager 680 (GE Healthcare, USA) in the chemiluminescence mode. Exposure time was set to 5 min and binning was set to 32×. (a) Plate 1. (b) Plate 2. (c) Plate 3. The black spots visible in the fungal infection condition, i.e., C + F, show bioluminescence emission by A. fumigatus CEA10b. Moreover, no bioluminescence emission was detected in the co-infections, i.e., C + F + b1 and C + F + b2, suggesting a biocontrol of A. fumigatus by the BALF isolates. The plate layout schemes were made in RStudio using the “ggplate” package [34]. C = cells alone. C + F = cells + A. fumigatus. C + b1 = cells + strain b1. C + b2 = cells + strain b2. C + F + b1 = cells + A. fumigatus + strain b1. C + F + b2 = cells + A. fumigatus + strain b2.
Microorganisms 12 02025 g006
Figure 7. Confocal microscopic imaging. Actin is indicated in green, and nuclei in blue. (a) Cells alone control (ZO-1 antibody). (b) Cells + A. fumigatus (anti-Aspergillus antibody). (c) Cells + A. fumigatus (ZO-1 antibody). (d) Cells + b1 (ZO-1 antibody). (e) Cells + b2 (ZO-1 antibody). (f) Cells + A. fumigatus + b1 (anti-Aspergillus antibody). (g) Cells + A. fumigatus + b1 (ZO-1 antibody). (h) Cells + A. fumigatus + b2 (anti-Aspergillus antibody). (i) Cells + A. fumigatus + b2 (ZO-1 antibody).
Microorganisms 12 02025 g007
Figure 8. Epithelial barrier function. (a) TEER measurements. This graph shows the mean TEER in Ω × cm2 (+ - standard deviation) of five replicates. TEER was measured daily across Calu-3 monolayers for 15 days. TEER shows a constant augmentation until around 2500 Ω/cm2 at day 15. Infection was performed at day 16. TEER stayed at around 2500 Ω/cm2 for the cells-alone control and the A. fumigatus-alone treatment and dropped to 1000 Ω/cm2 and below in the co-infection treatments 19 h post-infection. (b) Lucifer Yellow (LY) permeability assay. Permeability is expressed as a percentage compared with the no-cell control, which is set to 100%. This graph shows the mean permeability in % (+ - standard deviation) of three replicates. Compared with the cell-alone control, which is at around 1.2%, the measured LY permeability was significantly higher in the C + b1, C + b2, C + F + b1 and C + F + b2 conditions. In the presence of bacteria b2, the permeability was higher than with bacteria b1. C = cells alone. C + F = cells + A. fumigatus. C + b1 = cells + strain b1. C + b2 = cells + strain b2. C + F + b1 = cells + A. fumigatus + strain b1. C + F + b2 = cells + A. fumigatus + strain b2. Statistical significance was tested by one-way ANOVA with multiple comparisons. Significance level used is the following: **** = p ≤ 0.0001.
Microorganisms 12 02025 g008
Figure 9. Cytotoxicity assay. This graph shows the mean fluorescence intensity in arbitrary units (AU) (+/- standard deviation) of five replicates Significant fluorescence intensity detected in the conditions with b2 compared with the control cells. C = cells alone. C + F = cells + A. fumigatus. C + b1 = cells + strain b1. C + b2 = cells + strain b2. C + F + b1 = cells + A. fumigatus + strain b1. C + F + b2 = cells + A. fumigatus + strain b2. Statistical significance was tested by one-way ANOVA with multiple comparisons. Significance levels used were the following: ** = p ≤ 0.01; **** = p ≤ 0.0001.
Microorganisms 12 02025 g009
Table 1. A. fumigatus strains used in this study.
IDStrain NameReference
CEA10Aspergillus fumigatus CEA10, WT[25]
CEA10bAspergillus fumigatus CEA10, red-shifted bioluminescent strain[26]
Table 2. Additional P. aeruginosa strains used in this study. These strains were kindly provided by ADMED Microbiologie.
Strain CodeSpeciesSample Origin
Pa-1Pseudomonas aeruginosaExpectoration
Pa-2Pseudomonas aeruginosaExpectoration
Pa-3Pseudomonas aeruginosaExpectoration
Pa-4Pseudomonas aeruginosaExpectoration
Pa-5Pseudomonas aeruginosaExpectoration
PaM-1Pseudomonas aeruginosa, cystic fibrosisExpectoration
PaM-2Pseudomonas aeruginosa, cystic fibrosisExpectoration
PaM-3Pseudomonas aeruginosa, cystic fibrosisExpectoration
PaM-4Pseudomonas aeruginosa, cystic fibrosisExpectoration
PaM-5Pseudomonas aeruginosa, cystic fibrosisExpectoration
Table 3. BALF samples used in this study. BALF samples from lung transplanted patients have been obtained from the Lausanne University Hospital (CHUV).
IDAntibacterial ExposureAntibacterial/Antifungal Drugs Administered
BAL1YesColifin (colistimethate)
BAL2YesBactrim (sulfamethoxazole + trimethoprim)
BAL3YesColifin (colistimethate)
BAL4NoAmbisome (amphotericin B)
BAL5NoAmbisome (amphotericin B)
Table 4. Identity of the isolated strains.
Strain CodeSpeciesQuery CoverPer. Ident
b1Pseudomonas aeruginosa100%99.21%
b2Pseudomonas aeruginosa100%97.40%
b3Pseudomonas aeruginosa100%98.64%
b4Pseudomonas aeruginosa100%98.72%
b5Pseudomonas aeruginosa100%99.48%
Disclaimer/Publisher’s Note: The statements, opinions and data contained in all publications are solely those of the individual author(s) and contributor(s) and not of MDPI and/or the editor(s). MDPI and/or the editor(s) disclaim responsibility for any injury to people or property resulting from any ideas, methods, instructions or products referred to in the content.

