Article

Diversity Analysis of Intestinal Bifidobacteria in the Hohhot Population

Inner Mongolia Key Laboratory of Dairy Biotechnology and Engineering, Inner Mongolia Agricultural University, Hohhot 010018, China
*
Author to whom correspondence should be addressed.
Microorganisms 2024, 12(4), 756; https://doi.org/10.3390/microorganisms12040756
Submission received: 16 February 2024 / Revised: 26 March 2024 / Accepted: 4 April 2024 / Published: 9 April 2024
(This article belongs to the Section Food Microbiology)

Abstract

:
(1) Background: Bifidobacterium plays a pivotal role within the gut microbiota, significantly affecting host health through its abundance and composition in the intestine. Factors such as age, gender, and living environment exert considerable influence on the gut microbiota, yet scant attention has been directed towards understanding the specific effects of these factors on the Bifidobacterium population. Therefore, this study focused on 98 adult fecal samples to conduct absolute and relative quantitative analyses of bifidobacteria. (2) Methods: Using droplet digital PCR and the PacBio Sequel II sequencing platform, this study sought to determine the influence of various factors, including living environment, age, and BMI, on the absolute content and biodiversity of intestinal bifidobacteria. (3) Results: Quantitative results indicated that the bifidobacteria content in the intestinal tract ranged from 106 to 109 CFU/g. Notably, the number of bifidobacteria in the intestinal tract of the school population surpassed that of the off-campus population significantly (p = 0.003). Additionally, the group of young people exhibited a significantly higher count of bifidobacteria than the middle-aged and elderly groups (p = 0.041). The normal-weight group displayed a significantly higher bifidobacteria count than the obese group (p = 0.027). Further analysis of the relative abundance of bifidobacteria under different influencing factors revealed that the living environment emerged as the primary factor affecting the intestinal bifidobacteria structure (p = 0.046, R2 = 2.411). Moreover, the diversity of bifidobacteria in the intestinal tract of college students surpassed that in the out-of-school population (p = 0.034). This was characterized by a notable increase in 11 strains, including B. longum, B. bifidum, and B. pseudolongum, in the intestinal tract of college students, forming a more intricate intestinal bifidobacteria interaction network. (4) Conclusions: In summary, this study elucidated the principal factors affecting intestinal bifidobacteria and delineated their characteristics of intestinal bifidobacteria in diverse populations. By enriching the theory surrounding gut microbiota and health, this study provides essential data support for further investigations into the intricate dynamics of the gut microbiota.

1. Introduction

In 2001, Joshua Lederberg introduced the concept of the human microbiome [1]. The primary focus of research revolves around the inheritance and metabolism of microorganisms in various human body sites, including the skin [2], oral cavity [3], vagina [4], and gastrointestinal tract. The objective is to comprehend their impact on host health and pathogenesis. The gut microbiome, a significant subject of human microbiome research, has garnered considerable attention since the proposal of the Human Intestinal Metagenome Initiative (HIMI) during the international conference in 2005 [1]. Over the past two decades, the rapid evolution of sequencing technology has led to an increasing number of reports on the gut microbiome [5]. The gut microbiome encompasses a vast and intricate micro-ecosystem consisting of tens of thousands of bacteria [6], fungi, viruses, and other microorganisms residing in the human gastrointestinal tract. This ecosystem significantly influences human health [7], with imbalances potentially contributing to inflammatory bowel disease [8], immune system disorders, mental health issues, and metabolic diseases. Despite the absence of an accurate definition of a healthy gut microbiome [9], some researchers posit that key attributes include high stability and diversity of the microbiome, robust resistance to stressors such as antibiotics, infection, and immunosuppression, and metabolic pathways beneficial to the human body [9].
Bifidobacterium, a Gram-positive bacterium with a high G+C content, was initially discovered by Tissier in 1899 in the feces of breast-fed infants and was subsequently classified under Actinobacteria [10]. It is one of the most common bacteria in the gastrointestinal tract of both humans and animals. Common bifidobacteria species in humans include B. adolescentis, B. angulatum, B. bifidum, B. breve, B. catenulatum, B. dentium, B. longum, B. pseudocatenulatum, and B. pseudolongum [11]. Studies have indicated the significance of bifidobacteria as one of the important floras maintaining the balance of microbial communities within the gastrointestinal tract [12]. Disruptions in the gut microbiome are often accompanied by variations in the Bifidobacterium levels or species composition [13]. In addition, Bifidobacterium facilitates the treatment of diseases such as Irritable Bowel Syndrome (IBS) [14] and tumors [15]. It also enhances cognitive function [15], alleviates anxiety and depression, and promotes the immune system [16,17].
The gut microbiome of adults can be affected by several factors, including age, gender, geographic location, and living or working environment. From early life, a close relationship between the gut microbiome and human body has been established [18]. Early colonization of the gut microbiome not only plays a critical role in infant growth and development but also can further affect the health of all life [19]. Studies have suggested that healthy lactating infants exhibit lower diversity in their gut microbiome than adults. Nevertheless, the content and abundance of bifidobacteria are higher [18,20]. Upon reaching adulthood, the diversity of the gut microbiome typically increases with age, whereas the abundance and diversity of actinomycetes, such as Bifidobacterium, begin to decline. This trend is more prevalent in females than in males and tends to stabilize after the age of 40 years. As individuals enter old age, their gut microbiome ages [21]. As the elderly population becomes weak, there is a notable reduction in the α diversity of the gut microbiome [22]. This reduction primarily manifests as a decrease in flora diversity, an increase in pathogenic microorganisms, and a decrease in gut microbiome stability [23]. However, Lorenzo Drago et al. conducted a study comparing the gut microbiome of centenarians and young individuals and discovered that the species and quantity of lactic acid bacteria and bifidobacteria isolated from the intestines of centenarians were similar to those of young individuals [24].
Geography can significantly affect the gut microbiome [25]. One study revealed that closer proximity to geographical environments can contribute to higher similarity in the composition of the gut microbiome of the population. Conversely, for different geographical environments, the gut microbiomes can be different. A study on the gut microbiome of inland and island populations in South Korea suggested that inland populations exhibited higher diversity and richness in their gut microbiome compared to island populations [26]. Similarly, a study involving 314 individuals from 20 provinces and seven ethnic groups in China demonstrated that the gut microbiome of subjects clustered according to geographical location [27]. Furthermore, regional differences are often associated with variations in social systems, economic status, lifestyle, dietary habits, and work environment, all of which can change the gut microbiome [26]. Human history has witnessed three distinct survival stages: foraging, agricultural and rural life, and industrialized urban life, and the human gut microbiome has changed [26]. Notably, the gut microbiome of nomadic hunter/gatherers presents a higher diversity and stability. However, with the development of urbanization and industrialization, as well as the improvement of medical care and health levels, humans have reduced their contact with natural environments such as soil, forests, and livestock, gradually adapting to indoor lifestyles [28]. Simultaneously, the dietary composition predominantly comprises refined high-protein foods. Consequently, the Treponema genus that is beneficial for nutrient absorption among hunter/gatherers and traditional agricultural populations has degraded, creating a favorable environment for the development and functional role of the “Western Microbiome” [29].
Although urbanization offers convenience to individuals’ lives, it also introduces various sources of anxiety and stress. This can affect the composition of the gut microbiome. Chronic stress increases susceptibility to diseases through inflammation. Inflammation plays a pivotal role in the modulation of the intestinal microflora. Numerous reports have demonstrated that high stress levels can cause a reduction in the Simpson index and decreases in Lactobacillus and α-diversity in the intestinal environment [30]. Concurrently, another perspective suggests that the increase in beneficial bacteria, such as B. infantis in the intestines, can inhibit the hyperactivity of the Hypothalamic–Pituitary–Adrenal (HPA) axis, reducing norepinephrine secretion and alleviating anxiety and depression [31,32]. The gut microbiome exhibits a high degree of susceptibility and is easy to respond to environmental and host-derived stimuli. It actively regulates its composition and function to coexist and develop harmoniously with the host organism [33]. The alterations in the microbiota can profoundly affect the health of the host, emphasizing the importance of monitoring key factors influencing the gut microbiome.
Currently, the prevalent methods for analyzing gut microbiome quantity include traditional culture techniques and quantitative PCR (q-PCR) for bifidobacterial composition analysis of intestinal samples [34,35]. However, the traditional culture approach is labor-intensive, time-consuming, unable to detect viable but nonculturable (VBNC) cells, and ineffective at distinguishing species or strains with similar colony morphologies [36,37]. It can only detect the total quantity of viable bacteria in a sample. In addition, some studies have found that q-PCR can detect low-content samples, so the combination of q-PCR and specific primers can achieve quantitative detection of bifidobacteria in the intestine. However, q-PCR needs to rely on the standard curve for quantitative detection [38]. Droplet digital PCR (dd-PCR), as a third-generation nucleic acid amplification technology [39], offers a non-cultured quantitative approach capable of directly determining the copy number of target nucleic acid molecules in the sample. It has excellent specificity, high sensitivity, and yields precise results. Advances in high-throughput sequencing technology have provided researchers with more accessible tools. For example, 16S rRNA gene amplicon sequencing is still a standard method for nonculturable studies of microbial diversity and is commonly used to analyze microbial composition in complex samples [40,41]. However, the resolution of 16S rRNA gene sequencing is limited and cannot distinguish between closely related bacterial species [42,43]. In response, our laboratory developed bifidobacteria-specific primers for high-throughput sequencing and dd-PCR quantification, facilitating the investigation of the relative and absolute levels of bifidobacteria at the species level within the intestinal environment.
In summary, the abundance and composition of bifidobacteria in the human gut microbiome is affected by numerous factors. It is necessary to explore the number and composition of bifidobacteria in vivo under different influencing factors. Therefore, this study employed dd-PCR, successfully validated bifidobacteria-specific primer amplification, and third-generation sequencing technology using PacBio Sequel II to analyze the bifidobacterial population and composition within the intestines of adult individuals residing in Hohhot, Inner Mongolia Autonomous Region, China. This study aimed to uncover the impacts of various factors, including living environment, age, and BMI, on bifidobacteria. The results not only established a foundation for future research but also offered potential targets for the prevention, diagnosis, and treatment of specific diseases.

2. Materials and Methods

2.1. Subject Recruitment and Fecal Sample Collection

A total of 118 volunteers were recruited from Hohhot, Inner Mongolia Autonomous Region, China, and 98 fecal samples were collected based on the specific inclusion criteria. Fresh fecal samples were obtained using a tube containing protective solutions and a conventional fecal sampling tube, packaged in ice packs, and transported to the laboratory within 24 h. Subsequently, the fecal samples collected by these two methods were numbered and separated and stored at −80 °C. Fecal samples collected in tubes containing protective solution were used for sequencing, and samples from conventional collection tubes were used for quantitative testing. The inclusion criteria were as follows: (1) participants aged 18 years or older, both male and female, with female volunteers not being pregnant or lactating; (2) no history of severe diarrhea, severe constipation, or gastrointestinal disorders in the preceding month; (3) absence of antibiotic and probiotic use within the last three months; (4) absence of diabetes, hypertension, and hyperlipidemia; and (5) no major illnesses, cognitive impairment, or mental disorders. The excluded criteria were as follows: (1) does not conform to inclusion criteria. (2) poor compliance with the program. Twenty volunteers were excluded from the study based on their willingness to participate and experimental conditions: (1) specific amplification and sequencing failures (n = 18); and (2) volunteers who provided informed consent and physical examinations but could not provide fecal samples (n = 2). This study received approval from the Ethics Committee of the Affiliated Hospital of Inner Mongolia Medical College (Project Number: NO.KY2020014) and was registered with the Chinese Clinical Trial Registry (http://www.chictr.org.cn/ (accessed on 16 February 2024); registration number: ChiCTR2000038746). Informed consent was obtained from all participants before the commencement of the study. Only partial medical examination data were referenced, and the study did not involve human experiments. The collection of fecal samples posed no foreseeable risks of harm or discomfort to the participants (Figure 1).

2.2. DNA Extraction and PacBio Sequel II Sequencing

The total DNA from fecal samples stored in two fecal sampling tubes was extracted using the SPINeasy DNA Spin Kit for Feces (MP Biomedicals, Santa Ana, CA, USA), following the manufacturer’s instructions. Bifidobacterium-specific gene sequences were targeted amplified from all genomic DNA samples by polymerase chain reaction (PCR) for PacBio Sequel II sequencing, using the forward sequencing primer (Bif-11F: 5′-AAGAAGAAGGCCACCAAGTAYT-3′) and the reverse sequencing primer (Bif-11R: 5′-GGTAAGAGTCGGACGCTGTGCAATAA-3′) [44]. In the PCR experiment, pure water was used as a template for negative control. The PCR program consisted of the following steps: 95 °C for 1 min, 30 cycles of 95 °C for 1 min, 60 °C for 1 min, and 72 °C for 2 min, with a final extension at 72 °C for 7 min. The amplicons of the Bifidobacterium-specific gene were applied to construct DNA libraries using the Pacific Biosciences SMRT Bell™ template prep kit, as previously described [45,46]. DNA that could not be repaired was removed with exonuclease (Pacifc Biosciences, Menlo Park, CA, USA), and the repaired DNA was re-purified to build a high-quality circularized DNA library [47]. The quality of the library was assessed using a Qubit@ 2.0 Fluorometer (Thermo Scientific, Waltham, MA, USA) and the FEMTO Pulse system. According to the instructions, more than 60% of the fragments in the library are within 1600 bp, which is a qualified library. Finally, the library was sequenced using the PacBio Sequel platform. The Sequel II System performs sequencing up to 30 h and features more than eight times the sequencing data output compared to the Sequel System [45].

2.3. dd-PCR

Bif-D-7 specific quantitative primers were used for dye method dd-PCR. Pure water was used as negative control in the experiment. The dd-PCR system consisted of the following components: BIF-D7f primer (ATCAATGATTCAGCAGGAAACGC), 0.2 μL; BIF-D7r primer (GTTCTCGTCGAACTTGATGTAGG), 0.2 μL; DNA (or H2O), 2 μL; ddH2O, 7.6 μL; QX200 dd-PCR EvaGreen SuperMix, 10 μL; and Droplet Generation Oil for EvaGreen, 70 μL [48]. The dd-PCR program was as follows: 95 °C for 10 min, 40 cycles of 94 °C for 30 s and 60 °C for 1 min, followed by cooling at 4 °C for 5 min, an extension step at 90 °C for 5 min, and holding at 12 °C. Upon completion of the PCR cycles, a QX 200TM Droplet Reader was used to read the amplified microdroplets, and the results were calculated using Formula (1).
N ( C F U g ) = 20 × s o l u t i o n   v o l u m e   ( μ L ) × d i l u t i o n   f a c t o r × c o p y   n u m b e r   ( c o p i e s / μ L ) 2 × s a m p l e   m a s s   r e q u i r e d   f o r   D N A   e x t r a c t i o n   ( g )

2.4. Bioinformatics Analyses and Statistical Analyses

According to Yang et al., bioinformatics analysis was conducted on the extracted high-quality sequences using the Quantitative Insights into Microbial Ecology (QIIME1) package (version 1.7). Biological analyses also were performed using the QIIME platform in this study. Sequence proofreading was performed using PyNAST. A two-step UCLUST merging procedure was executed to establish a single sequence set without duplication and operational taxonomic unit (OTU) at 97% similarity thresholds. Chimera Slayer was adopted to eliminate OTUs containing chimeric sequences. Representative sequences of OTUs were aligned with a custom-built Bifidobacterium database to annotate the bacterial taxonomy at various levels. Based on the relative abundance of different species, the Upset package in R 4.3.2 software was employed for analyses [49]. Significant differences in alpha diversity indexes between the two groups were identified using Wilcoxon tests. The beta diversity was calculated by using weighted UniFrac distance and displayed using principal coordinate analysis (PCoA) [47]. The generated heatmap demonstrated the distribution of the dominant species (average relative abundance > 0.1%) across different individuals. Subsequently, the Wilcoxon test was employed to assess species differences in bifidobacteria within the intestinal tracts of all volunteers (p < 0.05). Furthermore, Spearman rank correlation analysis (|R| > 0.3, p < 0.05) was conducted to explore bacterial interaction relationships (https://www.omicstudio.cn/tool (accessed on 25 January 2024)).

3. Results

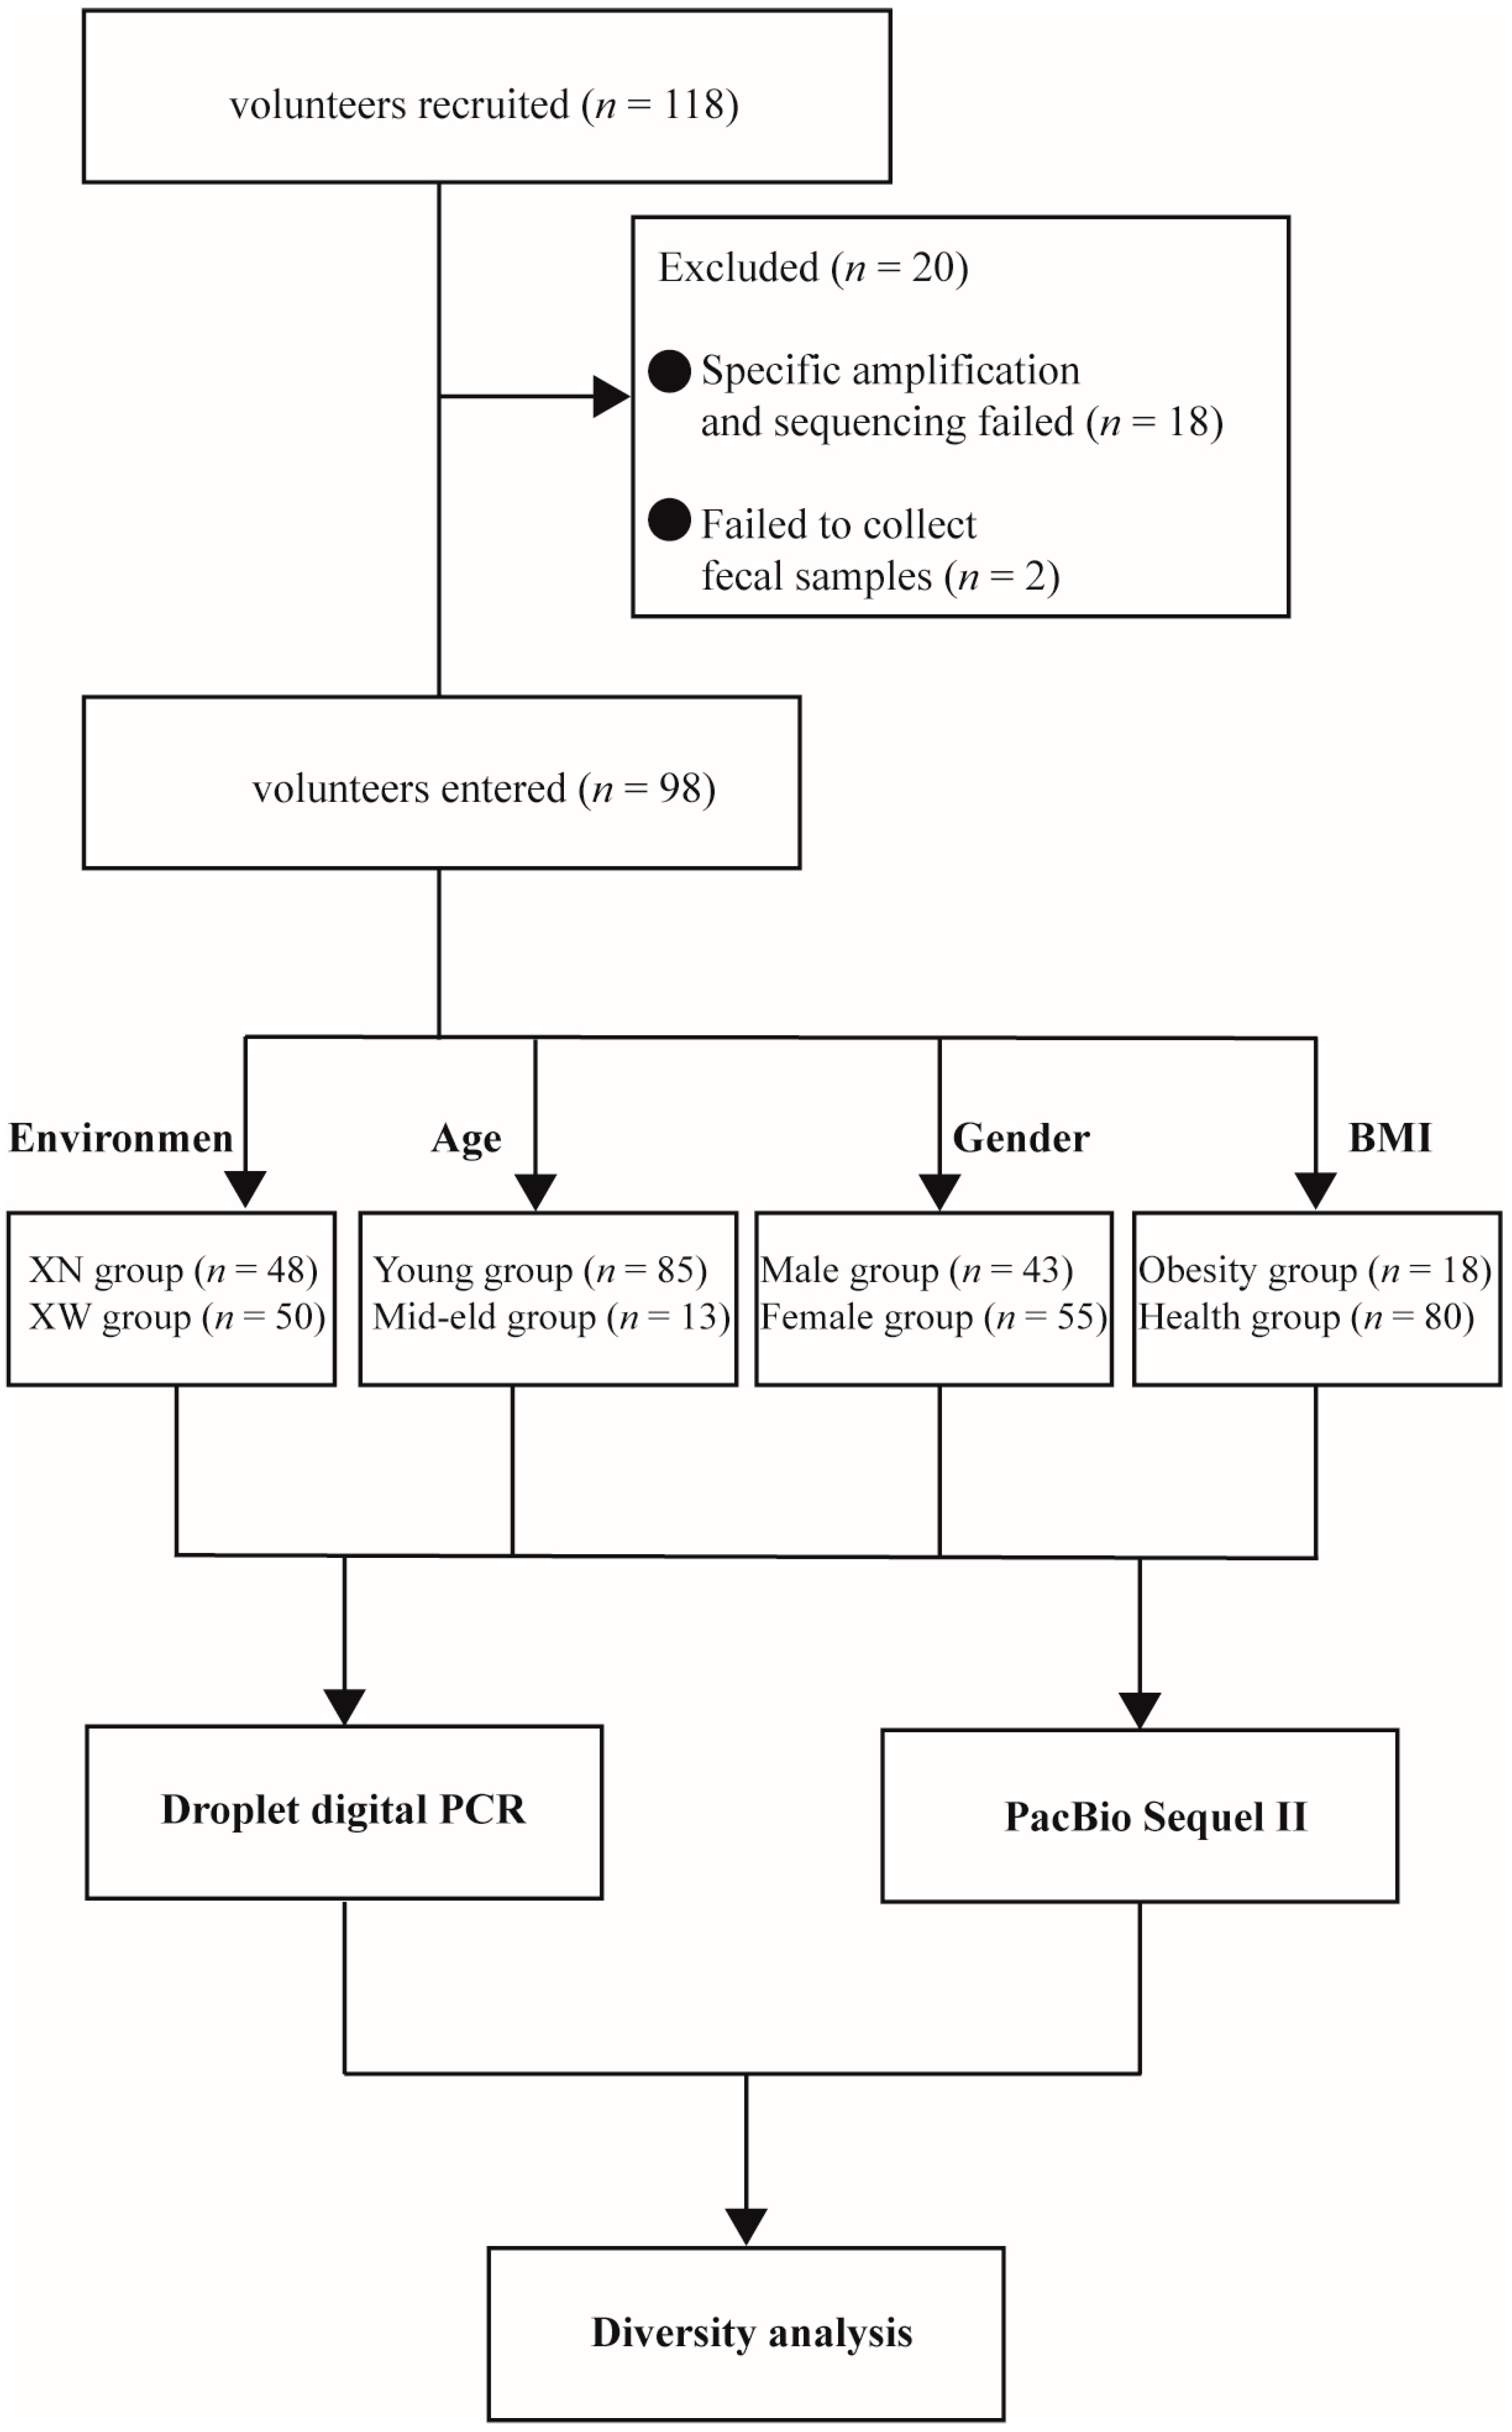
3.1. Volunteer Data and Grouping Information

This study comprised 98 volunteers aged 18–64 years, consisting of 43 males and 55 females (Table A1). According to the different environments in which the volunteers live, 48 volunteers are college students living on campus, and the other 52 volunteers are social groups living outside the school. They were divided into the school group, named “XN group” and the off-campus group, named “XW group”. In addition, volunteers were grouped according to age, BMI and gender, and the details are shown in Table 1.

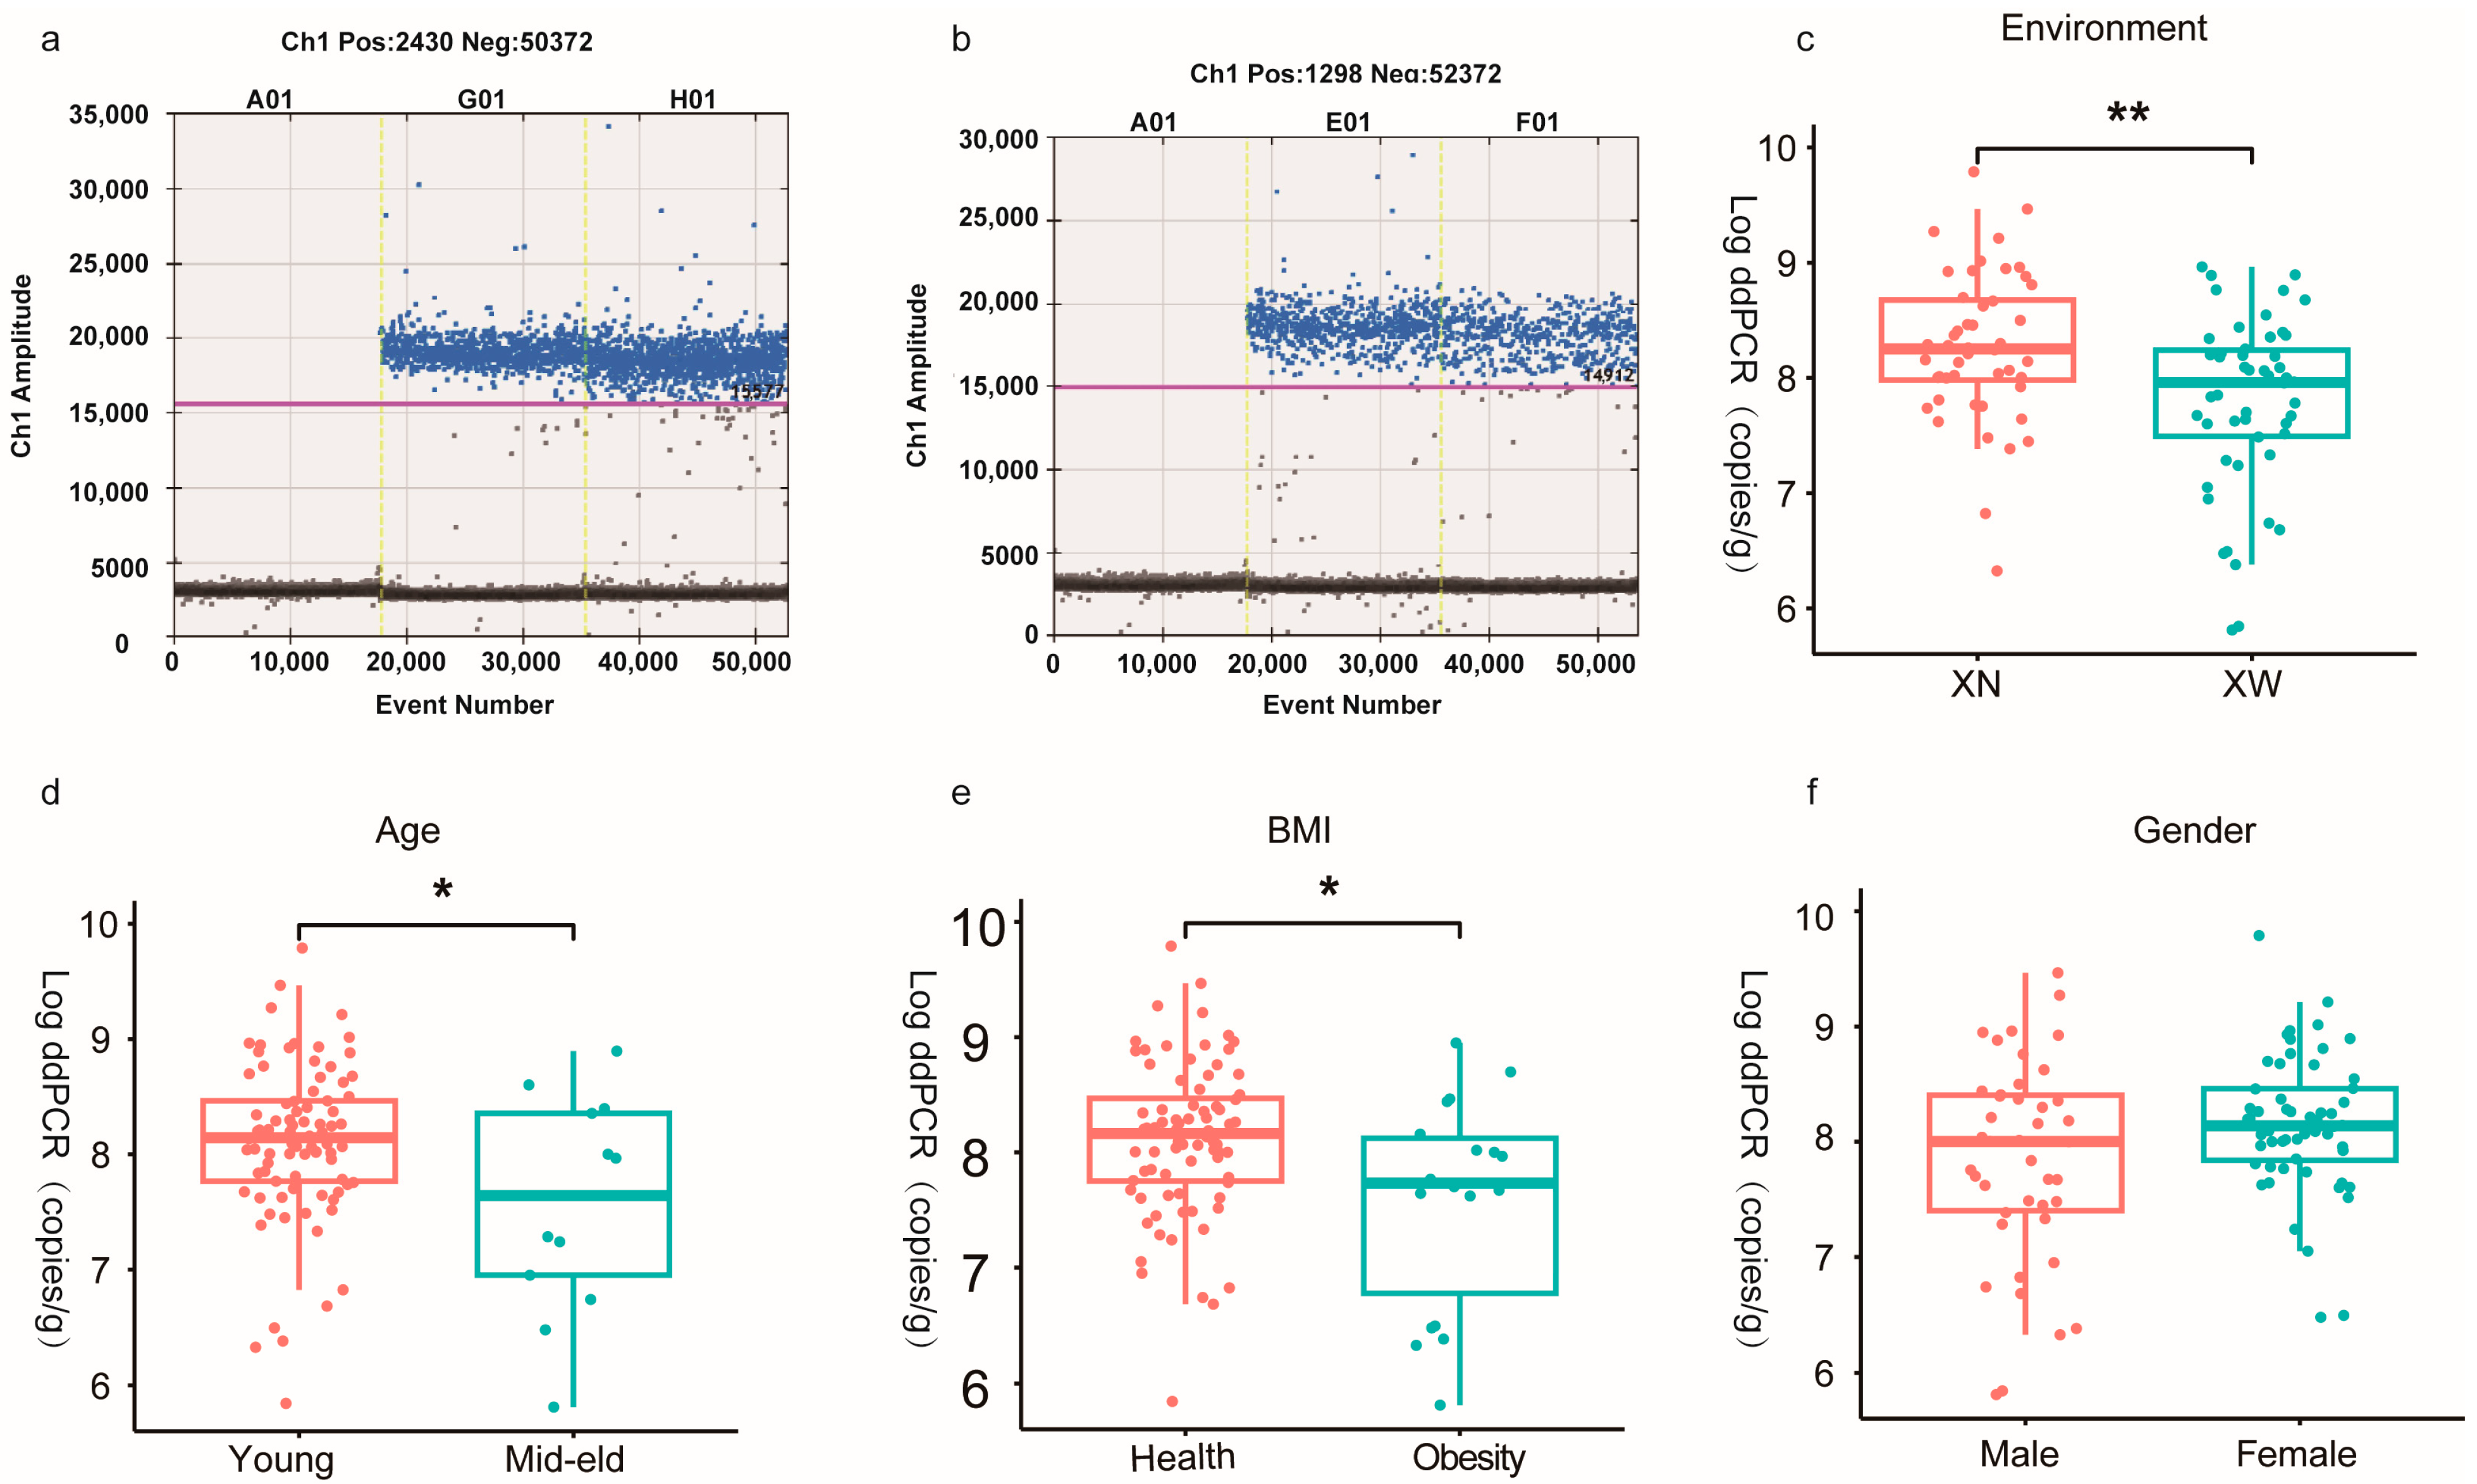
3.2. Absolute Quantitative Analysis of Bifidobacterium

First, the absolute quantification of bifidobacteria in the adult intestine was conducted using dd-PCR (Table A2). The findings revealed that bifidobacteria counts in all volunteers ranged from approximately 106 to 109 CFU/g, with the majority (86.73%) concentrated in the 107 to 108 CFU/g range. A small proportion (13.27%) exhibited counts of either 106 or 109 CFU/g, with the former being exclusive to the social population and the latter limited to college students. Subsequently, the influence of various factors on the content of bifidobacteria in the human intestine was assessed based on the living environment, age, BMI, and gender. The average bifidobacteria biomass in the XN group was (5.1 ± 10) × 108 CFU/g, and the average biomass of bifidobacteria in the XW group was (1.6 ± 2.2) × 108 CFU/g. The XN group of bifidobacteria was significantly larger in the XN group than in the XW group (p = 0.0027). Furthermore, the Young group exhibited a significantly higher number of intestinal bifidobacteria than the mid–eld group (p = 0.041) in the age analysis. However, the Obesity group displayed a significantly lower bifidobacterial count than the healthy group (p = 0.027). Additionally, female individuals demonstrated a higher bifidobacterial content than that in male individuals (p = 0.111). In summary, the number of intestinal bifidobacteria was affected by factors such as the living environment, age, BMI, and gender. Among these factors, the living environment appeared to exert a more pronounced effect on intestinal bifidobacterial counts than others (Figure 2).

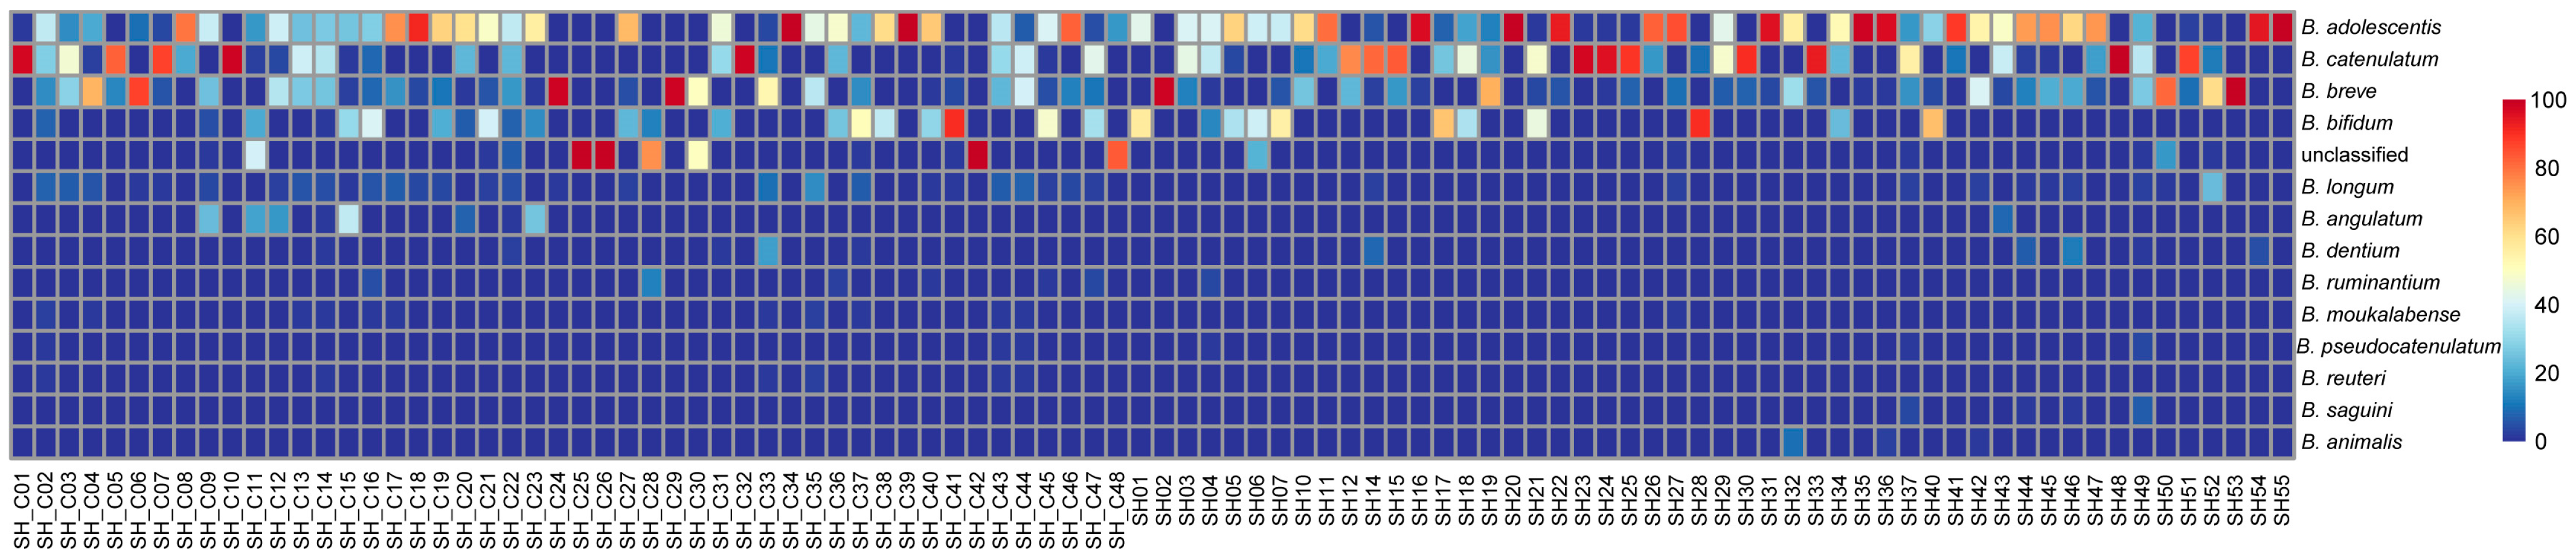
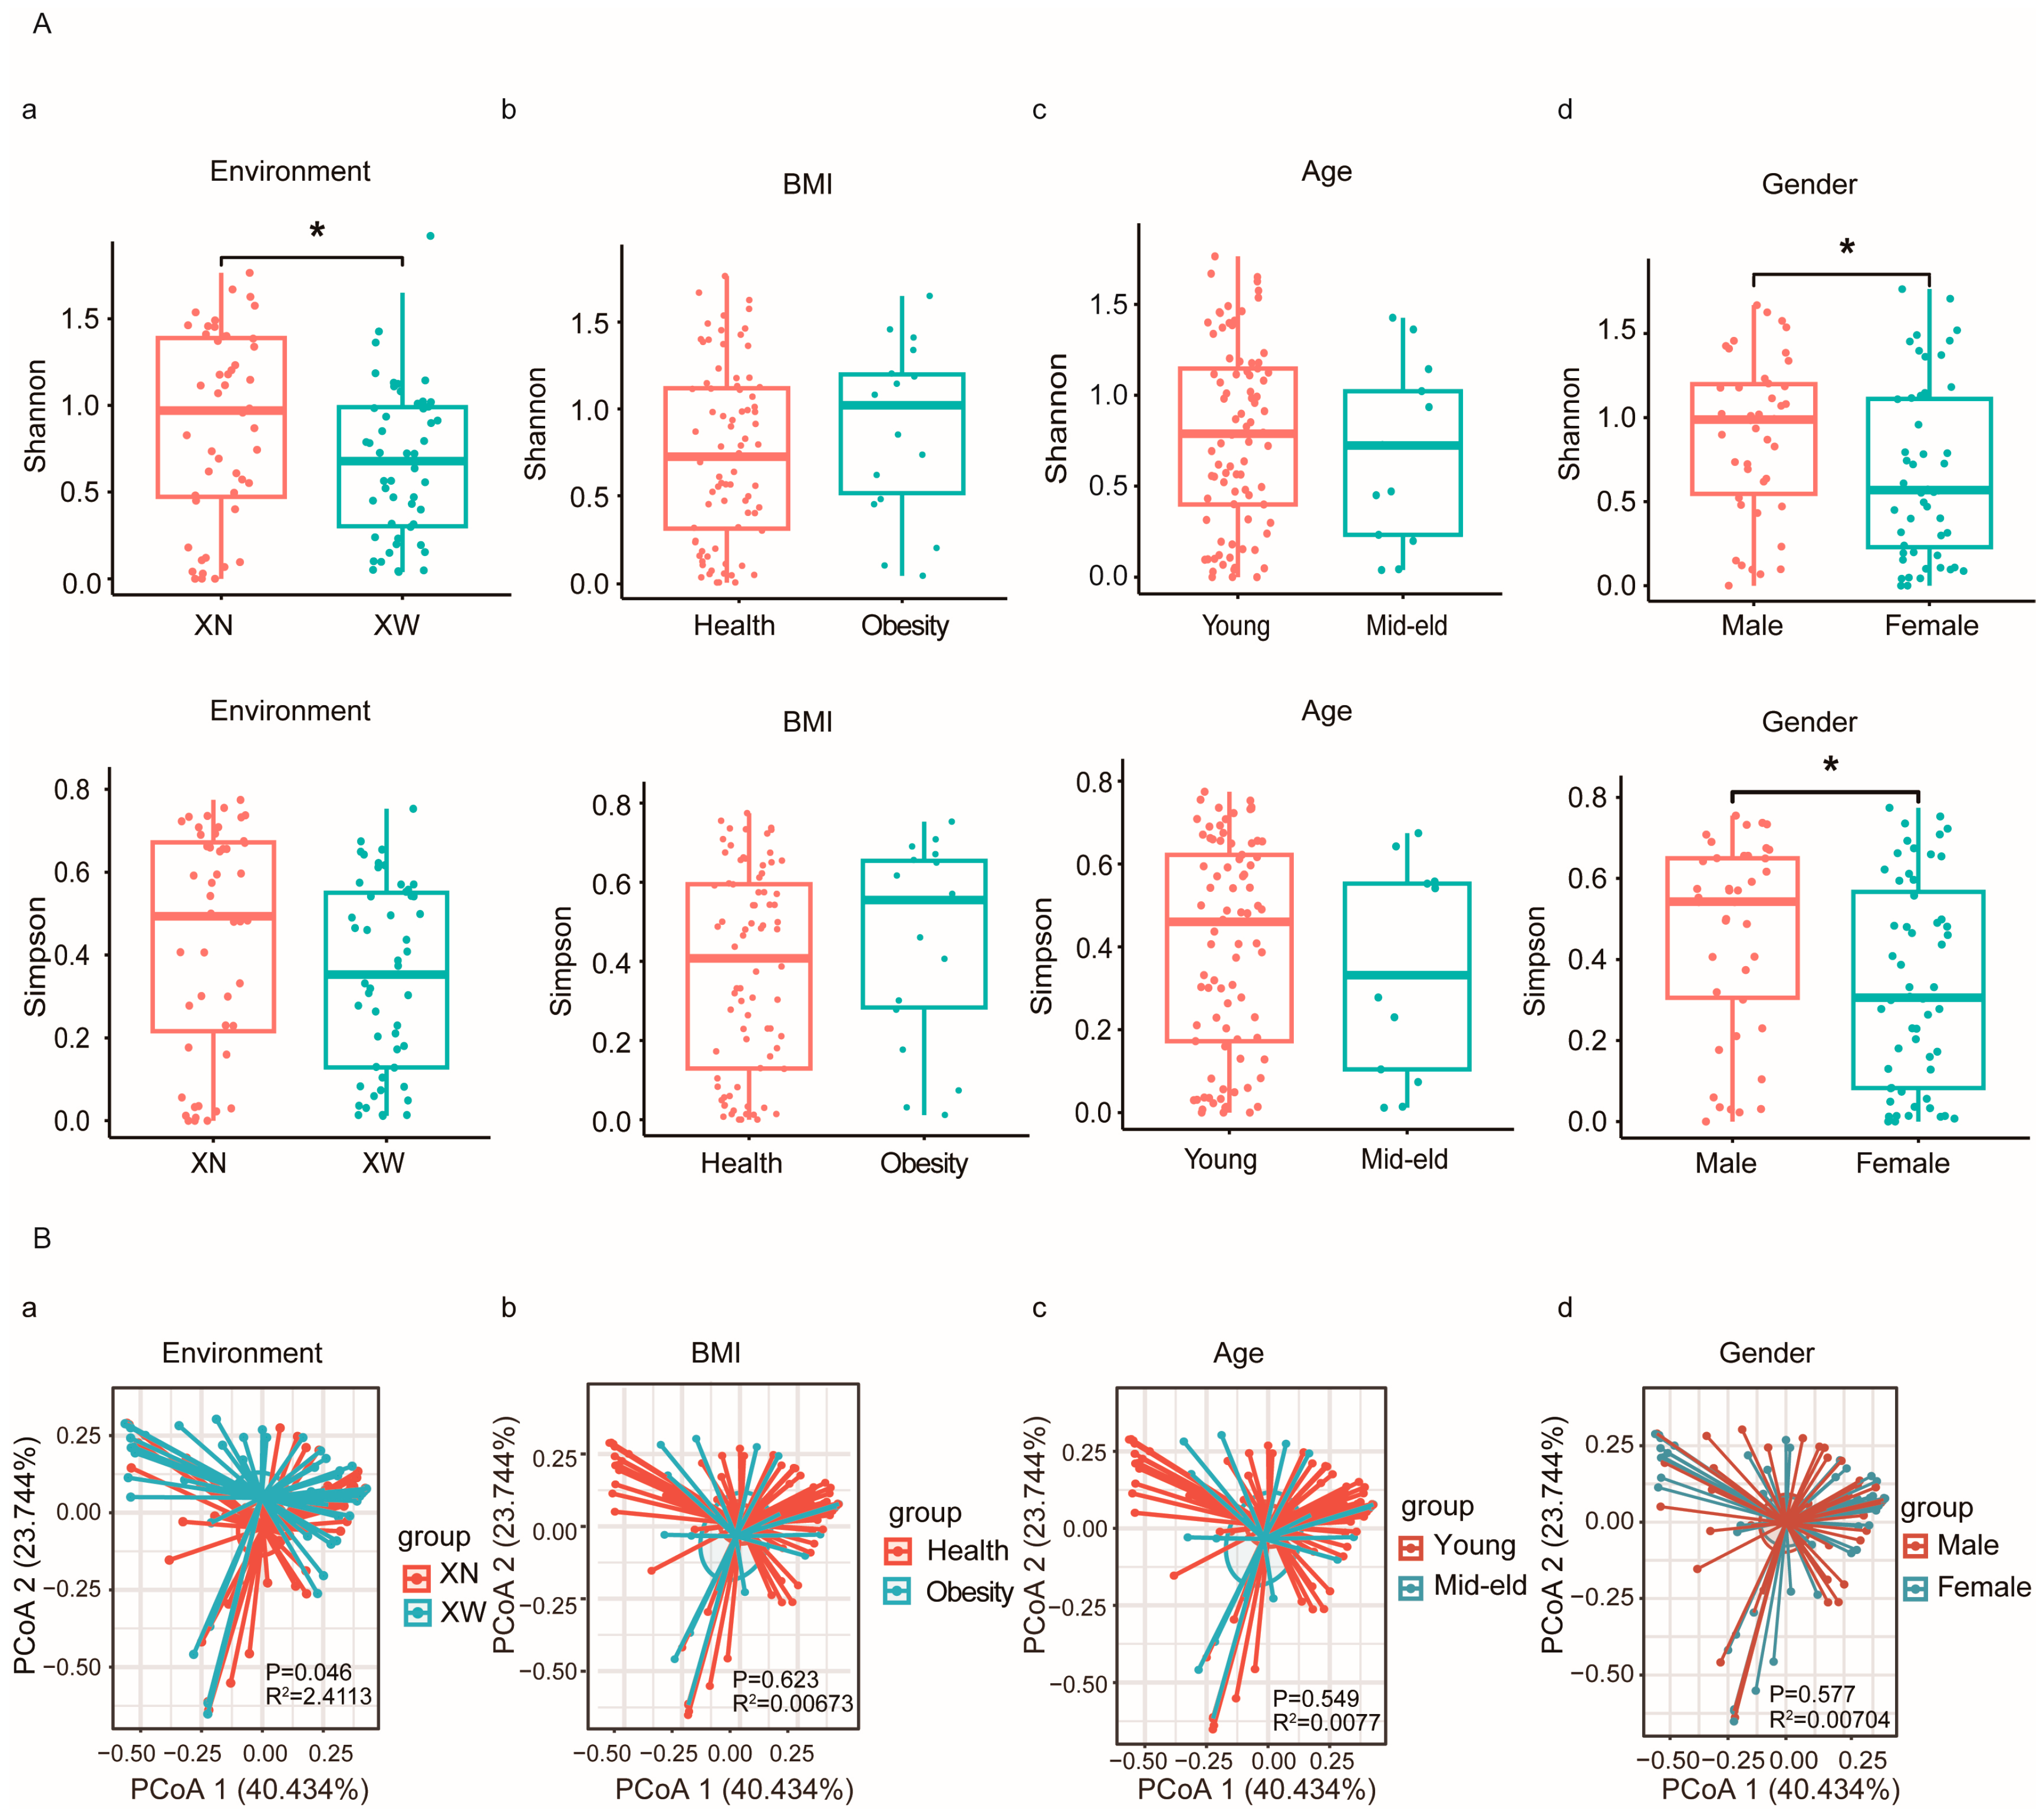
3.3. Diversity Analysis of Bifidobacterium

Subsequently, the effects of various factors on the diversity of bifidobacteria were further investigated. Across all samples, 43 distinct bifidobacterial species were identified, and the dominant species of bifidobacteria (with an average relative content exceeding 0.1%) were screened. The distribution of bifidobacteria within the intestines of different volunteers was thoroughly examined, identifying 14 predominant bifidobacterial species. These species included B. adolescentis (37.18%), B. catenulatum (23.35%), B. breve (16.32%), B. bifidum (11.15%), unclassified (6.25%), B. longum (1.85%), B. angulatum (1.45%), B. dentium (0.70%), B. ruminantium (0.43%), B. moukalabense (0.33%), B. pseudocatenulatum (0.26%), B. reuteri (0.20%), B. saguini (0.19%), and B. animalis (0.17%) (Figure 3).
The α diversity index among different groups was analyzed, revealing significant effects of living environment and gender on the diversity of intestinal bifidobacteria. Specifically, the Shannon index showed a significantly higher diversity of intestinal bifidobacteria in the XN group than in the XW group (p = 0.034). Furthermore, the Shannon index (p = 0.029) and Simpson index (p = 0.02) indicated a significantly higher diversity of bifidobacteria among male volunteers than among female volunteers. Although the Young group exhibited higher diversity in intestinal bifidobacteria than the mid–eld group, this difference was not statistically significant. Notably, the diversity of bifidobacteria in the intestines of the obese individuals exceeded that of the normal group. Subsequent application of PCoA revealed distinct separation trends in bifidobacteria within the intestines of individuals living in different environments (p = 0.046, R2 = 2.4113), and other groups did not display noticeable separation trends. Hence, when considering factors such as age, BMI, and gender, the living environment predominantly affected the diversity of intestinal bifidobacteria in adults. Specifically, the α diversity in the XN group was significantly higher than that in the XW group. Combined with the quantitative and diversity results, the living environment played a pivotal role in affecting both the quantity and structural composition of intestinal bifidobacteria compared to age, BMI, and gender. Therefore, subsequent analysis was based on the impact of the living environment on bifidobacteria (Figure 4).

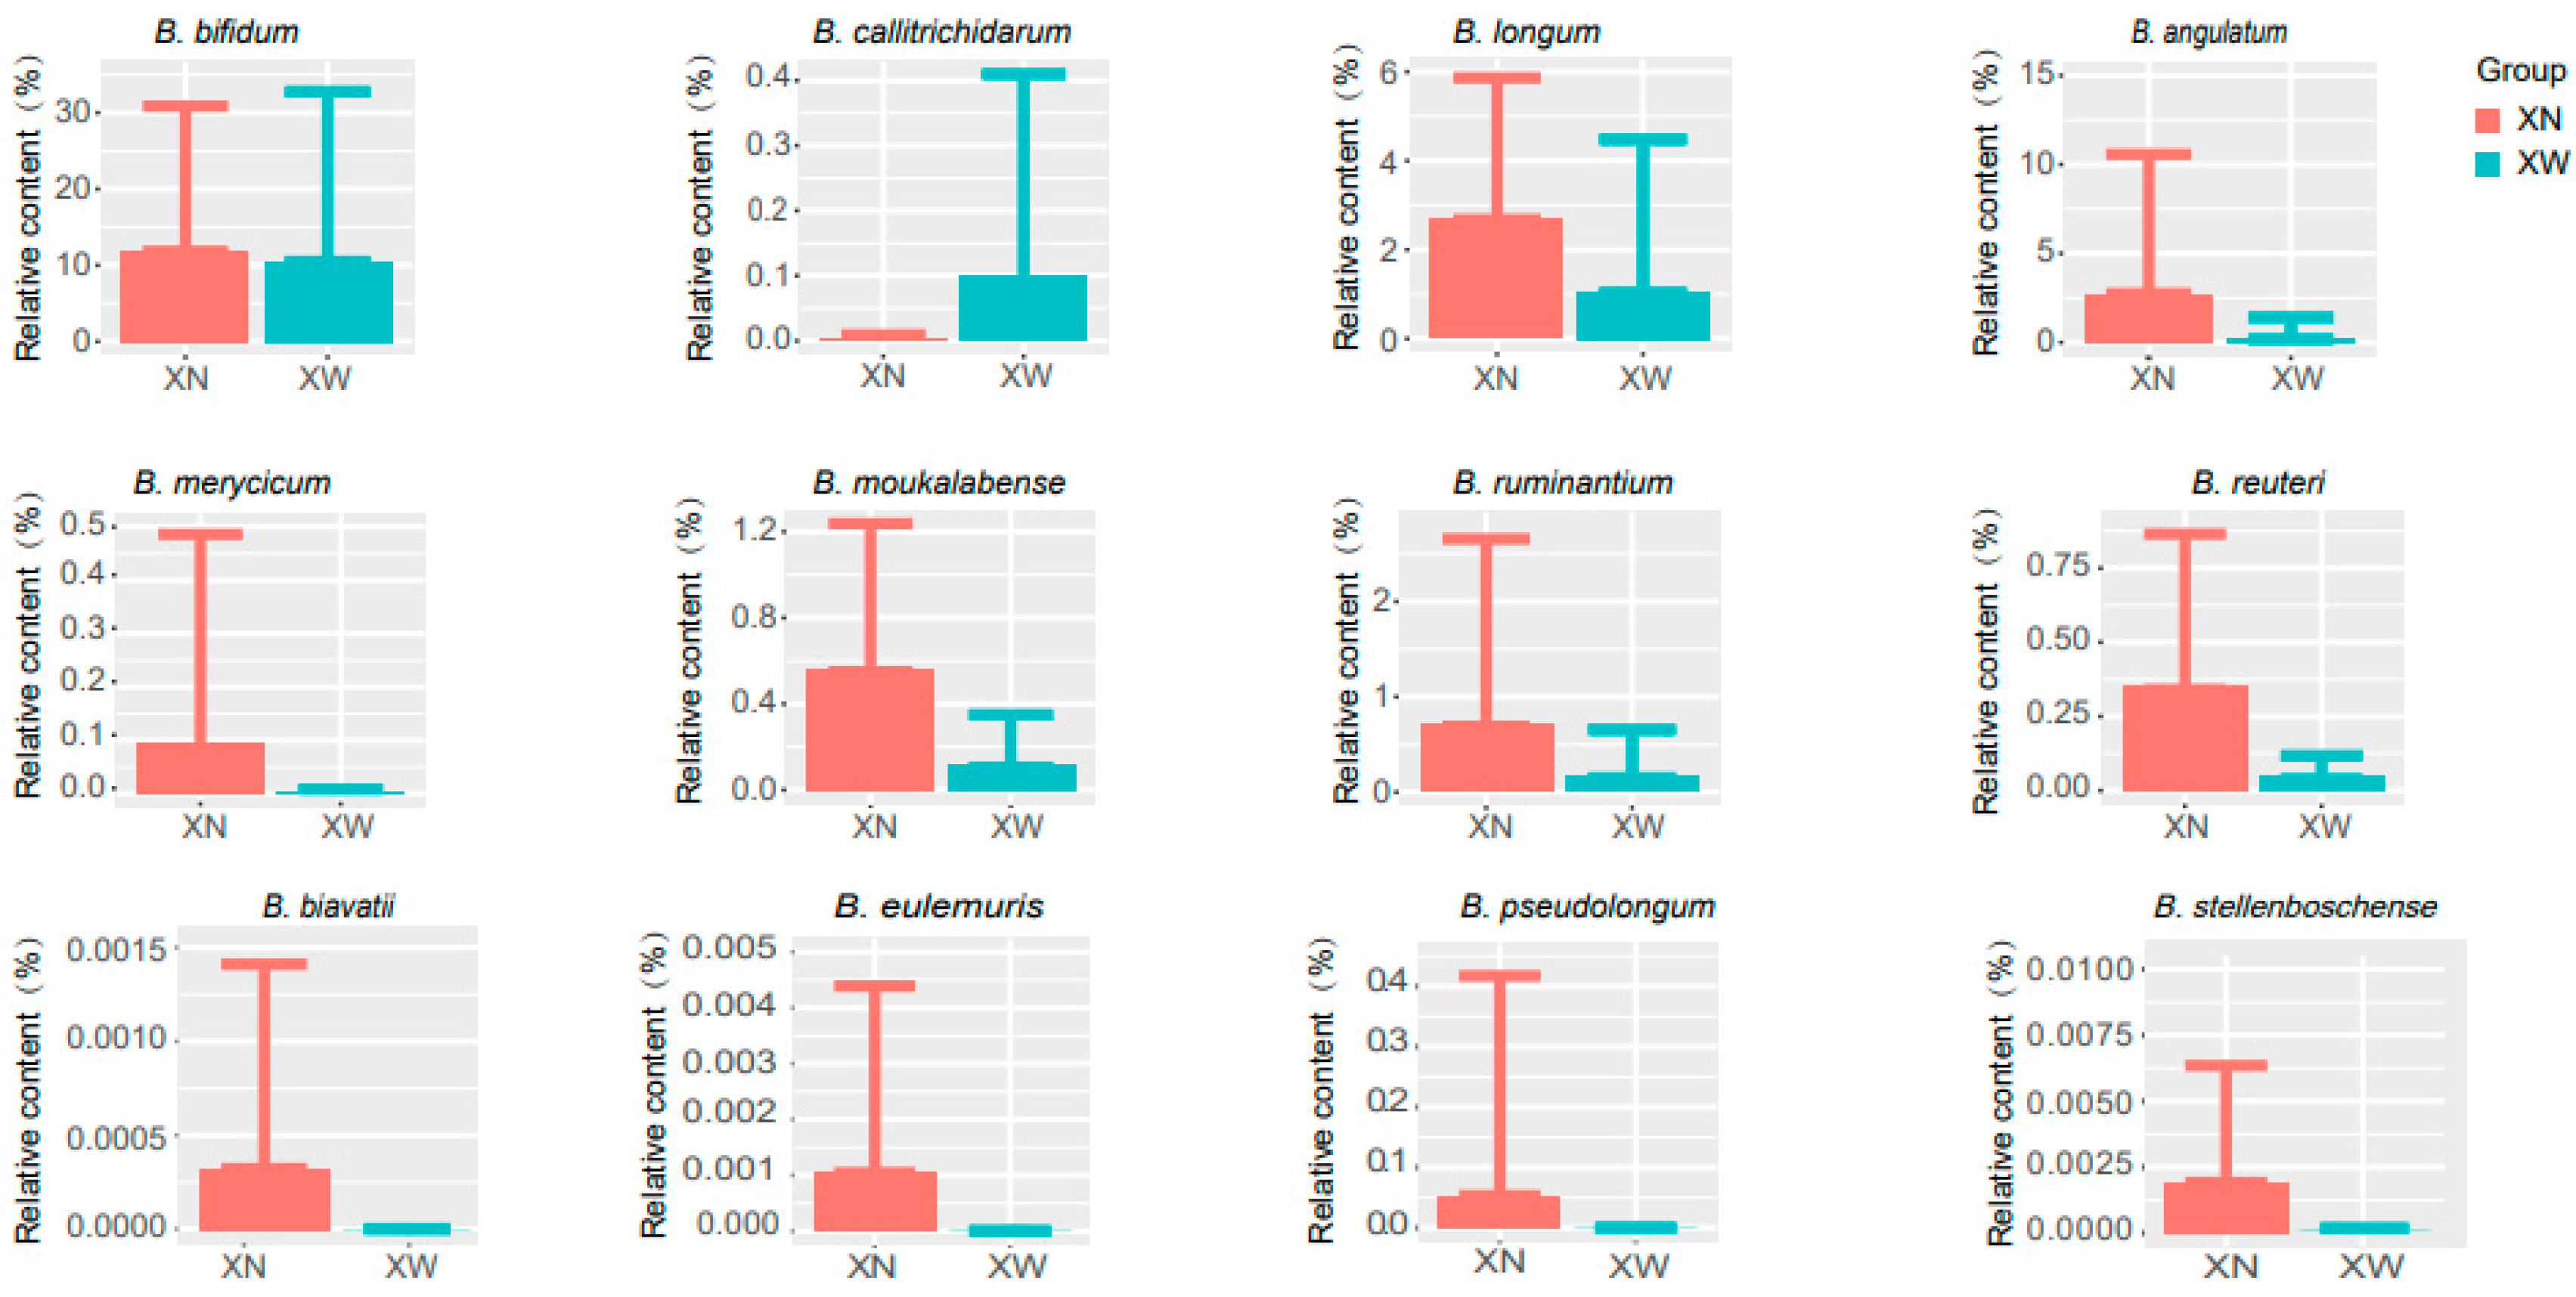
3.4. Analysis of Differential Bacteria

The Wilcoxon test was applied to analyze the differential species of intestinal bifidobacteria, identifying a total of 12 strains with significant differences (p < 0.05). These strains included B. angulatum, B. moukalabense, B. stellenboschense, B. reuteri, B. merycicum, B. longum, B. ruminantium, B. eulemuris, B. bifidum, B. pseudolongum, B. biavatii, and B. callitrichidarum. Noteworthy findings included a significantly higher content of B. callitrichidarum in the XW group than in the XN group (XW vs. XN: 0.100% ± 0.310% vs. 0.003% ± 0.006%). In the XN group, the following species were found to have higher levels compared to the XW group: B. angulatum (XN vs. XW: 2.763% ± 7.816% vs. 0.190% ± 1.211%), B. moukalabense (XN vs. XW: 0.100% ± 0.310% vs. 0.100% ± 0.515%), B. stellenboschense (XN vs. XW: 0.002% ± 0.004% vs. 0% ± 0%), B. reuteri (XN vs. XW: 0.351% ± 0.004% vs. 0% ± 0%), B. merycicum (XN vs. XW: 0.093% ± 0.393% vs. 0.0011% ± 0.007%), B. longum (XN vs. XW: 2.688% ± 3.180% vs. 1.045% ± 3.431%), B. ruminantium (XN vs. XW: 0.701% ± 1.956% vs. 0.161% ± 0.495%), B. eulemuris (XN vs. XW: 0.001% ± 0.003% vs. 0% ± 0%), B. bifidum (XN vs. XW: 11.839% ± 19.041% vs. 10.490% ± 22.273%), B. pseudolongum (XN vs. XW: 0.054% ± 0.364% vs. 0% ± 0%), B. biavatii (XN vs. XW: 0.0003% ± 0.0011% vs. 0% ± 0%), and B. callitrichidarum (XN vs. XW: 0.003% ± 0.006% vs. 0.010% ± 0.310%). Among them, B. biavatii, B. eulemuris, B. pseudolongum, and B. stellenboschense were exclusively present in the XN group (Figure 5).

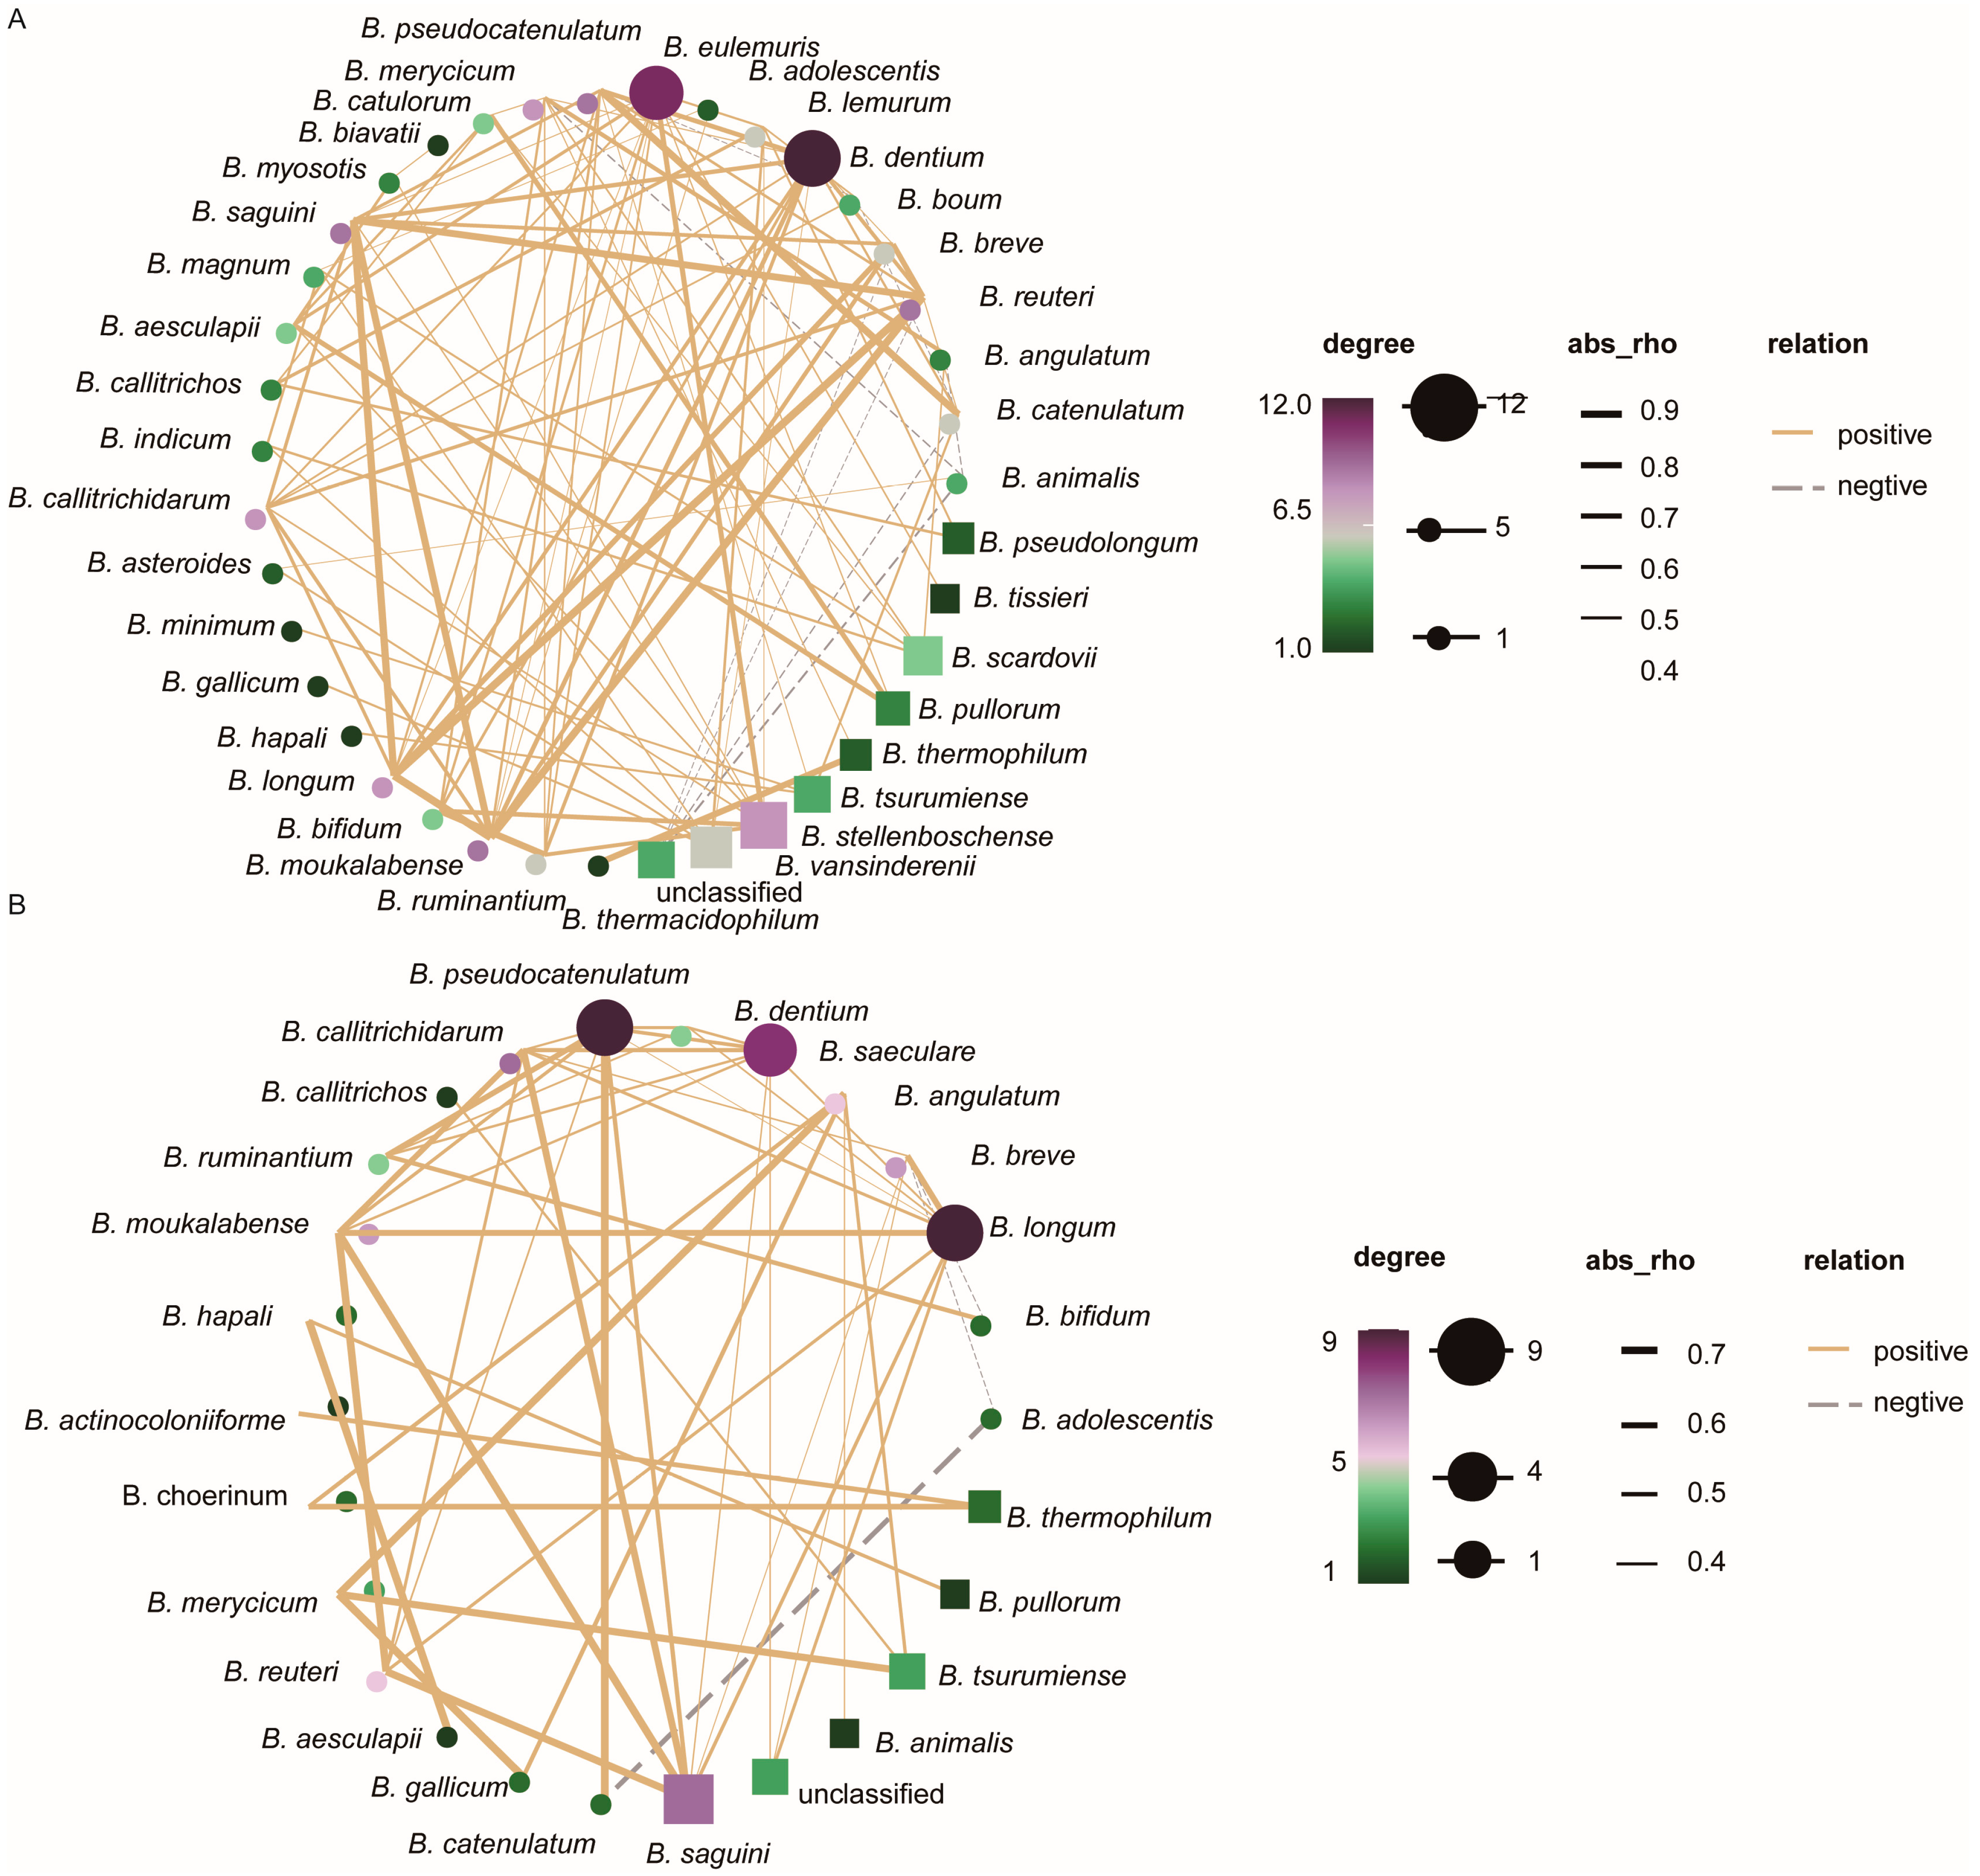
3.5. Analysis of Interaction Relationships of Flora Network

Finally, Spearman correlation analysis was conducted to examine the impacts of environmental factors on the network interactions of intestinal bifidobacteria. The correlation strength was defined as follows, according to the report by Zhao et al. [50] and Silva et al. [51]: very strong (|R| ≥ 0.8), strong (0.6 ≤ |R| < 0.8), moderate (0.5 ≤ |R| < 0.6), and weak (0.3 < |R| < 0.5). The analysis revealed that the network relationships among intestinal bifidobacteria in the XN group were denser than those in the XW group. Notably, there were 49 pairs of species interactions, including two weak negative correlations, such as B. breve and B. adolescentis (R = −0.31), and B. breve and B. bifidum (R = −0.31). Additionally, a moderate negative correlation was observed between B. adolescentis and B. catenulatum (R = −0.55). Furthermore, there were 27 weak positive correlations, including B. breve and B. calitrichidarum (R = 0.34), and B. angulatum and B. animalis (R = 0.32). Moreover, eight moderate positive correlations were observed, including B. ruminantium and B. pseudocatenulatum (R = 0.59), and B. actinocoloniiforme and B.thermophilum (R = 0.54). Finally, 11 strong positive correlations were observed, including B. catenulatum and B. pseudocatenulatum (R = 0.72), and B. longum and B. breve (R = 0.61). In contrast, the XN group exhibited ninety-five pairs of species interactions, encompassing eight weak negative correlations, such as B. boum and B. pseudocatenulatum (R = −0.30), and B. angulatum and B. angulatum (R = −0.33). Furthermore, 55 weak positive correlations were identified, e.g., B. bifidum and B. dentium (R = 0.49), and B. longum and B. pseudocatenulatum (R = 0.43). Additionally, moderate positive correlations were evident between B. dentium and B. longum (R = 0.58), and B. breve and B. saguini (R = 0.58). There were 11 strong positive correlations, such as B. dentium and B. pseudocatenulatum (R = 0.66), and B. catulorum and B. pullorum (R = 0.68). Finally, nine strong positive correlations were observed: B. longum and B. moukalabense (R = 0.96), B. saguini and B. reuteri (R = 0.87), and B. catenulatum and B. pseudocatenulatum (R = 0.89) (Figure 6).

4. Discussion

The gut microbiota plays a vital role in overall health, and bifidobacteria residing in the intestines are recognized as indicators of health [52]. The structure, diversity, and composition of the gut microbiota are affected by several factors including age, geographical location, and dietary habits. In this study, bifidobacteria-specific primers were utilized combined with the PacBio sequencing platform to elucidate the differences in the abundance, diversity, and composition of bifidobacteria among volunteers residing in diverse environmental settings.
In addition to gender and age, BMI and living environment exert significant impacts on the abundance of bifidobacteria in the intestines. However, these findings differ from those of Zhang et al., which emphasized that gender was the most influencing factor affecting gut microbiota composition [53]. This can be attributed to two key reasons. First, there was regional variation among volunteers. Zhang’s study focused on individuals in the Pinggu district of Beijing, whereas our research focused on volunteers in Inner Mongolia. Although these regions are geographically close, their dietary and lifestyle disparities are considerable. Second, the adopted sequencing methods were different. Zhang primarily employed metagenomic sequencing to obtain the relative abundance of Bifidobacterium in the intestines, whereas this study adopted Bifidobacterium genus-specific primers combined with dd-PCR to obtain the absolute content of Bifidobacterium in the intestines. Therefore, this study complemented the limitations of previous studies. Additionally, the results were consistent with those of previous studies [54], demonstrating that the absolute content of bifidobacteria in the intestines of young individuals significantly surpassed that in the elderly group. Furthermore, college students exhibited a notably higher absolute content of intestinal bifidobacteria than social workers. Moreover, individuals with normal BMI exhibited higher bifidobacterial content than that of obese people. Bifidobacteria colonized vigorously in early life, constituting approximately 60–70% of the total intestinal flora. This population gradually declined with age, decreasing to 5% or less in the intestines of the elderly population. However, a significant increase in the long-lived population was evident [54]. This study similarly observed this phenomenon, although the oldest volunteer in our study was 64 years old, categorizing them as Bifidobacterium long-lived elderly individuals in this study. Additionally, bifidobacteria in the intestines have long been regarded as markers of good health, and a high BMI can be associated with various diseases [55], including cardiovascular, digestive, and respiratory diseases. Significantly reduced bifidobacterial content has been observed in patients or disease models related to these conditions [56,57,58]. College students predominantly face academic stress, whereas social workers contend with life and familial and occupational pressures, leading to differences in dietary and lifestyle patterns between both groups. Therefore, we hypothesized that the variance in bifidobacterial content may be linked to the higher stress and anxiety levels experienced by the social worker population compared to college students, in addition to divergent dietary and lifestyle habits.
Subsequently, we conducted a Bifidobacterium-specific analysis to examine the differences in Bifidobacterium populations among different groups. Our findings revealed that compared to other factors, the living environment exerted the most significant impact on intestinal bifidobacteria. Notably, the diversity of intestinal bifidobacteria was substantially increased in college students, particularly with a marked increase in the content of B. longum, B. bifidum, and B. pseudolongum in the intestines of the XN group. An increase in gut microbiota diversity is widely associated with better health, and bifidobacteria in the intestine are recognized to be integral to overall well-being [59]. A deficiency in bifidobacteria has been directly linked to anxiety and stress [16,60]. In an RCT experiment, we observed that B. longum supplementation regulated neural activity during rest, enhanced vitality, and reduced mental fatigue in volunteers, thereby mitigating negative emotions [16]. Furthermore, B. pseudolongum, a producer of acetic acid [61], and chronic stress-induced diseases can be alleviated by modulating immune cells through acetic acid supplementation [62]. Additionally, supplementation with B. bifidum strains has been shown to enhance cognitive flexibility in the elderly, increase stress scores, and increase serum levels of brain-derived neurotrophic factor (BDNF) [63]. Simultaneously, studies have indicated that B. longum is prevalent in the intestinal tracts of adults, and its metabolism adapts to specific carbohydrate components in the host. The observed change in gut microbiota composition can further verify our hypothesis that stress and anxiety levels in college students were lower than those in social workers. This difference in the absolute and relative abundance of intestinal bifidobacteria between the two groups can be attributed to this trend. In addition, B. longum exhibited characteristics related to the interaction between the gut microbiota and host in the intestines. Our observations revealed that the interaction network of bifidobacteria in the intestines of college students, where B. longum content was significantly elevated, was more tightly connected, which was consistent with prior research [64]. Furthermore, we identified a significant positive correlation between B. longum in the intestines of college students, and between B. dentium and B. moukalabense., frequently isolated from healthy infant stools, which stimulated intestinal serotonin production and produced the neurotransmitter γ-aminobutyric acid, thereby regulating the gut–brain axis in gnotobiotic mice. Notably, B. moukalabense was significantly more abundant in the college student group than in the social worker group. Hence, we hypothesized that specific bifidobacteria, such as B. longum, in the gut can affect stress and anxiety regulation by modulating microbial communities [65].

5. Conclusions

In summary, this study involved the sequencing of absolute bifidobacterial content and diversity within distinct population groups. Our findings indicated that compared to other factors, living environment and occupational type were the most influential factors affecting intestinal bifidobacteria. Specifically, we observed a substantial increase in both the content and diversity of intestinal bifidobacteria among college students compared to the social population. Furthermore, the interaction network of bifidobacteria displayed greater connectivity, particularly involving flora such as B. longum, B. moukalabense, and B. bifidum, all of which played roles in the regulation of stress and anxiety.

Author Contributions

Writing—original draft: S.Y., F.Z. and X.S.; Writing—review and editing: S.W.; Data curation: S.Y. and Z.Z.; Visualization: X.Y.; Resources: M.Z.; Investigation: F.W.; Funding acquisition: Z.S. and B.M.; Supervision: B.M. All authors have read and agreed to the published version of the manuscript.

Funding

This research was funded by the National Key R&D Program of China (2018YFE0123500), grant number 2018YFE0123500 and the earmarked fund for CARS36 (CARS36), grant number CARS36.

Data Availability Statement

The raw sequence data reported in this paper have been deposited in the Genome Sequence Archive (Genomics, Proteomics & Bioinformatics 2021) in National Genomics Data Center (Nucleic Acids Res 2022), China National Center for Bioinformation/Beijing Institute of Genomics, Chinese Academy of Sciences (GSA: CRA015535) that are publicly accessible at https://ngdc.cncb.ac.cn/gsa (accessed on 25 March 2024).

Acknowledgments

In this section, we want to acknowledge all the volunteers in this study for their participation and cooperation.

Conflicts of Interest

The authors declare no competing interest.

Appendix A

Table A1. Information of volunteers.
SampleAgeGenderHeight (m)Weight (kg)BMI
SH_C0118Female1.77826.98962
SH_C0218Male1.765718.40134
SH_C0319Male1.89529.32099
SH_C0419Female1.66525.39063
SH_C0519Female1.585120.42942
SH_C0619Female1.665118.50777
SH_C0719Female1.756019.59184
SH_C0820Female1.666021.77384
SH_C0920Male1.836519.40936
SH_C1020Male1.786018.937
SH_C1120Female1.655520.20202
SH_C1220Female1.758026.12245
SH_C1320Female1.655219.10009
SH_C1420Male1.715518.80921
SH_C1520Male1.8510630.97151
SH_C1620Male1.756320.57143
SH_C1720Male1.867020.23355
SH_C1820Male1.787022.09317
SH_C1920Male1.76020.76125
SH_C2020Male1.87523.14815
SH_C2120Female1.654717.26354
SH_C2220Female1.76020.76125
SH_C2320Female1.585020.02884
SH_C2420Male1.848023.62949
SH_C2520Female1.645219.33373
SH_C2620Female1.656222.77319
SH_C2720Female1.584819.22769
SH_C2820Male1.8410731.60444
SH_C2920Female1.645319.70553
SH_C3020Male1.86018.51852
SH_C3121Male1.8512536.52301
SH_C3221Male1.786520.51509
SH_C3321Female1.737023.38869
SH_C3421Female1.585421.63115
SH_C3521Male1.796018.72601
SH_C3622Male1.786018.937
SH_C3722Female1.584518.02596
SH_C3822Female1.666824.67702
SH_C3922Female1.615521.21832
SH_C4022Male1.97219.9446
SH_C4122Male1.7811536.29592
SH_C4222Male1.86520.06173
SH_C4322Female1.725719.26717
SH_C4422Male1.856518.99196
SH_C4522Male1.756621.55102
SH_C4623Male1.910529.08587
SH_C4723Male1.8110030.5241
SH_C4823Female1.698329.06061
SH0153Male1.7572.523.67347
SH0225Male1.7687.628.27996
SH0325Female1.6248.218.3661
SH0441Female1.55825.77778
SH0531Female1.77024.22145
SH0637Female1.6158.922.72289
SH0725Male1.7981.225.34253
SH1027Male1.7576.224.88163
SH1133Male1.7783.626.68454
SH1233Male1.7584.527.59184
SH1455Female1.5759.524.13891
SH1553Female1.595019.7777
SH1638Male1.7171.724.52037
SH1738Female1.6269.926.63466
SH1826Male1.85124.236.28926
SH1931Female1.566928.35306
SH2048Female1.547129.93759
SH2133Male1.6884.730.00992
SH2224Female1.686021.2585
SH2323Female1.574719.06771
SH2423Female1.685318.77834
SH2528Female1.6557.721.19376
SH2626Female1.7181.327.80343
SH2727Female1.5741.516.83638
SH2826Female1.5850.620.26919
SH2924Male1.968.819.05817
SH3028Female1.5757.623.36809
SH3127Female1.6255.521.14769
SH3225Male1.7965.820.53619
SH3329Female1.666.225.85938
SH3435Male1.7894.929.95203
SH3536Female1.596224.52435
SH3661Female1.5979.831.56521
SH3753Male1.728227.71769
SH4025Female1.6447.617.6978
SH4124Male1.8574.121.65084
SH4263Male1.6163.624.53609
SH4323Female1.762.521.6263
SH4424Female1.6572.126.48301
SH4537Female1.6159.622.99294
SH4664Female1.5769.628.23644
SH4737Female1.5854.221.71126
SH4838Female1.666122.13674
SH4933Female1.5674.630.65417
SH5025Female1.6451.118.99911
SH5159Male1.6568.425.12397
SH5264Male1.729030.42185
SH5324Female1.7158.219.90356
SH5464Male1.6264.424.53894
SH5562Female1.5857.723.11328
Table A2. Details of dd-PCR.
SampleFecal Quantity (g)Return Solution Volume (μL)Dilution MultipleCopy Number (Copies/μL)N (CFU/g)
SH_C010.121002001171.95 × 108
SH_C020.141001001441.03 × 108
SH_C030.131001001092.918.41 × 108
SH_C040.1100100018.311.83 × 108
SH_C050.110010054.75.47 × 107
SH_C060.121001005994.99 × 108
SH_C070.1210010007406.17 × 109
SH_C080.15100100017.51.17 × 108
SH_C090.13100100013.011.00 × 108
SH_C100.1100100091.439.14 × 108
SH_C110.1110010011391.04 × 109
SH_C120.261002003742.88 × 108
SH_C130.131001001110.918.55 × 108
SH_C140.11100100028.112.56 × 108
SH_C150.111001002.332.12 × 106
SH_C160.1810020066.67 × 106
SH_C170.131001000242.931.87 × 109
SH_C180.23100100031.431.37 × 108
SH_C190.111001000321.932.93 × 109
SH_C200.1100100031.633.16 × 108
SH_C210.0910010001471.63 × 109
SH_C220.121001005594.66 × 108
SH_C230.121001007746.45 × 108
SH_C240.1210010006.835.69 × 107
SH_C250.17100100178.931.05 × 108
SH_C260.1910010083.74.41 × 107
SH_C270.141001002681.91 × 108
SH_C280.11100100015.831.44 × 108
SH_C290.19100100011.15.84 × 107
SH_C300.131001000115.738.90 × 108
SH_C310.111001008377.61 × 108
SH_C320.121002002534.22 × 108
SH_C330.121001002191.83 × 108
SH_C340.25100100043.931.76 × 108
SH_C350.151001001641.09 × 108
SH_C360.19100100044.62.35 × 108
SH_C370.12100100034.912.91 × 108
SH_C380.151001001268.40 × 107
SH_C390.12100100016.711.39 × 108
SH_C400.181001001821.01 × 108
SH_C410.110010041.84.18 × 107
SH_C420.12100200119.41.99 × 108
SH_C430.191001001921.01 × 108
SH_C440.210010005.632.82 × 107
SH_C450.1410010034.032.43 × 107
SH_C460.121001001951.63 × 108
SH_C470.1410010042.333.02 × 107
SH_C480.2100100128.936.45 × 107
SH010.2710010005.21.93 × 107
SH020.1310010006.14.70 × 107
SH030.11200100050.79.22 × 108
SH040.120010021.94.38 × 107
SH050.120010016.43.28 × 107
SH060.1220010095.41.59 × 108
SH070.13200100203.08 × 107
SH100.18200100013.71.52 × 108
SH110.15100100010.36.87 × 107
SH120.111001005.34.82 × 106
SH140.1310010010227.86 × 108
SH150.1710010029.61.74 × 107
SH160.1810010038.72.15 × 107
SH170.1210010013.51.13 × 107
SH180.121001003312.76 × 108
SH190.1710010000.533.12 × 106
SH200.11100100110.21.00 × 108
SH210.1610010080.65.04 × 107
SH220.1100500472.35 × 108
SH230.2910050023.44.03 × 107
SH240.1110050019.99.05 × 107
SH250.1310050046.41.78 × 108
SH260.171001002091.23 × 108
SH270.131001004583.52 × 108
SH280.1310050040.11.54 × 108
SH290.1110050010.44.73 × 107
SH300.1210050028.11.17 × 108
SH310.0810050026.21.64 × 108
SH320.11005000.147.00 × 105
SH330.0910050020.81.16 × 108
SH340.151002001.82.40 × 106
SH350.1100500442.20 × 108
SH360.11005000.63.00 × 106
SH370.121001002722.27 × 108
SH400.111001001731.57 × 108
SH410.11100500126.75.76 × 108
SH420.141005002.58.93 × 106
SH430.121001001491.24 × 108
SH440.081001003814.76 × 108
SH450.110010060.66.06 × 107
SH460.1810050033.39.25 × 107
SH470.1100500116.55.83 × 108
SH480.0610050093.27.77 × 108
SH490.141001001461.04 × 108
SH500.111005009.34.23 × 107
SH510.21005002.25.50 × 106
SH520.11005000.136.50 × 105
SH530.21001001427.10 × 107
SH540.1110050054.82.49 × 108
SH550.1710050013.64.00 × 107

References

  1. Peterson, J.; Garges, S.; Giovanni, M.; McInnes, P.; Wang, L.; Schloss, J.A.; Bonazzi, V.; McEwen, J.E.; Wetterstrand, K.A.; Deal, C.; et al. The NIH Human Microbiome Project. Genome Res. 2009, 19, 2317–2323. [Google Scholar] [CrossRef] [PubMed]
  2. Gao, Z.; Tseng, C.H.; Pei, Z.; Blaser, M.J. Molecular analysis of human forearm superficial skin bacterial biota. Proc. Natl. Acad. Sci. USA 2007, 104, 2927–2932. [Google Scholar] [CrossRef] [PubMed]
  3. Faveri, M.; Mayer, M.P.; Feres, M.; de Figueiredo, L.C.; Dewhirst, F.E.; Paster, B.J. Microbiological diversity of generalized aggressive periodontitis by 16S rRNA clonal analysis. Oral. Microbiol. Immunol. 2008, 23, 112–118. [Google Scholar] [CrossRef] [PubMed]
  4. Hyman, R.W.; Fukushima, M.; Diamond, L.; Kumm, J.; Giudice, L.C.; Davis, R.W. Microbes on the human vaginal epithelium. Proc. Natl. Acad. Sci. USA 2005, 102, 7952–7957. [Google Scholar] [CrossRef] [PubMed]
  5. Walker, A.W.; Hoyles, L. Human microbiome myths and misconceptions. Nat. Microbiol. 2023, 8, 1392–1396. [Google Scholar] [CrossRef]
  6. Kuziel, G.A.; Rakoff-Nahoum, S. The gut microbiome. Curr. Biol. 2022, 32, R257–R264. [Google Scholar] [CrossRef]
  7. Heintz-Buschart, A.; Wilmes, P. Human Gut Microbiome: Function Matters. Trends Microbiol. 2018, 26, 563–574. [Google Scholar] [CrossRef]
  8. Fan, Y.; Pedersen, O. Gut microbiota in human metabolic health and disease. Nat. Rev. Microbiol. 2021, 19, 55–71. [Google Scholar] [CrossRef] [PubMed]
  9. Bäckhed, F.; Fraser, C.M.; Ringel, Y.; Sanders, M.E.; Sartor, R.B.; Sherman, P.M.; Versalovic, J.; Young, V.; Finlay, B.B. Defining a healthy human gut microbiome: Current concepts, future directions, and clinical applications. Cell Host Microbe 2012, 12, 611–622. [Google Scholar] [CrossRef]
  10. Lee, J.H.; O’Sullivan, D.J. Genomic insights into bifidobacteria. Microbiol. Mol. Biol. Rev. 2010, 74, 378–416. [Google Scholar] [CrossRef]
  11. Turroni, F.; Foroni, E.; Pizzetti, P.; Giubellini, V.; Ribbera, A.; Merusi, P.; Cagnasso, P.; Bizzarri, B.; de’Angelis, G.L.; Shanahan, F.; et al. Exploring the diversity of the bifidobacterial population in the human intestinal tract. Appl. Environ. Microbiol. 2009, 75, 1534–1545. [Google Scholar] [CrossRef] [PubMed]
  12. Ventura, M.; Turroni, F.; Zomer, A.; Foroni, E.; Giubellini, V.; Bottacini, F.; Canchaya, C.; Claesson, M.J.; He, F.; Mantzourani, M.; et al. The Bifidobacterium dentium Bd1 genome sequence reflects its genetic adaptation to the human oral cavity. PLoS Genet. 2009, 5, e1000785. [Google Scholar] [CrossRef] [PubMed]
  13. Tojo, R.; Suárez, A.; Clemente, M.G.; de los Reyes-Gavilán, C.G.; Margolles, A.; Gueimonde, M.; Ruas-Madiedo, P. Intestinal microbiota in health and disease: Role of bifidobacteria in gut homeostasis. World J. Gastroenterol. 2014, 20, 15163–15176. [Google Scholar] [CrossRef] [PubMed]
  14. Staudacher, H.M.; Lomer, M.C.E.; Farquharson, F.M.; Louis, P.; Fava, F.; Franciosi, E.; Scholz, M.; Tuohy, K.M.; Lindsay, J.O.; Irving, P.M.; et al. A Diet Low in FODMAPs Reduces Symptoms in Patients With Irritable Bowel Syndrome and A Probiotic Restores Bifidobacterium Species: A Randomized Controlled Trial. Gastroenterology 2017, 153, 936–947. [Google Scholar] [CrossRef] [PubMed]
  15. Ren, Z.; Chen, S.; Lv, H.; Peng, L.; Yang, W.; Chen, J.; Wu, Z.; Wan, C. Effect of Bifidobacterium animalis subsp. lactis SF on enhancing the tumor suppression of irinotecan by regulating the intestinal flora. Pharmacol. Res. 2022, 184, 106406. [Google Scholar] [CrossRef] [PubMed]
  16. Ma, T.; Jin, H.; Kwok, L.Y.; Sun, Z.; Liong, M.T.; Zhang, H. Probiotic consumption relieved human stress and anxiety symptoms possibly via modulating the neuroactive potential of the gut microbiota. Neurobiol. Stress. 2021, 14, 100294. [Google Scholar] [CrossRef]
  17. Azuma, N.; Mawatari, T.; Saito, Y.; Tsukamoto, M.; Sampei, M.; Iwama, Y. Effect of Continuous Ingestion of Bifidobacteria and Dietary Fiber on Improvement in Cognitive Function: A Randomized, Double-Blind, Placebo-Controlled Trial. Nutrients 2023, 15, 4175. [Google Scholar] [CrossRef] [PubMed]
  18. Ouyang, R.; Ding, J.; Huang, Y.; Zheng, F.; Zheng, S.; Ye, Y.; Li, Q.; Wang, X.; Ma, X.; Zou, Y.; et al. Maturation of the gut metabolome during the first year of life in humans. Gut Microbes 2023, 15, 2231596. [Google Scholar] [CrossRef] [PubMed]
  19. Ventura, M.; Canchaya, C.; Tauch, A.; Chandra, G.; Fitzgerald, G.F.; Chater, K.F.; van Sinderen, D. Genomics of Actinobacteria: Tracing the evolutionary history of an ancient phylum. Microbiol. Mol. Biol. Rev. 2007, 71, 495–548. [Google Scholar] [CrossRef]
  20. Olm, M.R.; Dahan, D.; Carter, M.M.; Merrill, B.D.; Yu, F.B.; Jain, S.; Meng, X.; Tripathi, S.; Wastyk, H.; Neff, N.; et al. Robust variation in infant gut microbiome assembly across a spectrum of lifestyles. Science 2022, 376, 1220–1223. [Google Scholar] [CrossRef]
  21. de la Cuesta-Zuluaga, J.; Kelley, S.T.; Chen, Y.; Escobar, J.S.; Mueller, N.T.; Ley, R.E.; McDonald, D.; Huang, S.; Swafford, A.D.; Knight, R.; et al. Age- and Sex-Dependent Patterns of Gut Microbial Diversity in Human Adults. mSystems 2019, 4, e00261-19. [Google Scholar] [CrossRef] [PubMed]
  22. Jackson, M.A.; Jeffery, I.B.; Beaumont, M.; Bell, J.T.; Clark, A.G.; Ley, R.E.; O’Toole, P.W.; Spector, T.D.; Steves, C.J. Signatures of early frailty in the gut microbiota. Genome Med. 2016, 8, 8. [Google Scholar] [CrossRef] [PubMed]
  23. Pang, S.; Chen, X.; Lu, Z.; Meng, L.; Huang, Y.; Yu, X.; Huang, L.; Ye, P.; Chen, X.; Liang, J.; et al. Longevity of centenarians is reflected by the gut microbiome with youth-associated signatures. Nat. Aging 2023, 3, 436–449. [Google Scholar] [CrossRef] [PubMed]
  24. Drago, L.; Toscano, M.; Rodighiero, V.; De Vecchi, E.; Mogna, G. Cultivable and pyrosequenced fecal microflora in centenarians and young subjects. J. Clin. Gastroenterol. 2012, 46, S81–S84. [Google Scholar] [CrossRef] [PubMed]
  25. Hansen, M.E.B.; Rubel, M.A.; Bailey, A.G.; Ranciaro, A.; Thompson, S.R.; Campbell, M.C.; Beggs, W.; Dave, J.R.; Mokone, G.G.; Mpoloka, S.W.; et al. Population structure of human gut bacteria in a diverse cohort from rural Tanzania and Botswana. Genome Biol. 2019, 20, 16. [Google Scholar] [CrossRef]
  26. Shin, J.H.; Sim, M.; Lee, J.Y.; Shin, D.M. Lifestyle and geographic insights into the distinct gut microbiota in elderly women from two different geographic locations. J. Physiol. Anthropol. 2016, 35, 31. [Google Scholar] [CrossRef]
  27. Zhang, J.; Guo, Z.; Xue, Z.; Sun, Z.; Zhang, M.; Wang, L.; Wang, G.; Wang, F.; Xu, J.; Cao, H.; et al. A phylo-functional core of gut microbiota in healthy young Chinese cohorts across lifestyles, geography and ethnicities. ISME J. 2015, 9, 1979–1990. [Google Scholar] [CrossRef]
  28. Parizadeh, M.; Arrieta, M.C. The global human gut microbiome: Genes, lifestyles, and diet. Trends Mol. Med. 2023, 29, 789–801. [Google Scholar] [CrossRef]
  29. Gupta, V.K.; Paul, S.; Dutta, C. Geography, Ethnicity or Subsistence-Specific Variations in Human Microbiome Composition and Diversity. Front. Microbiol. 2017, 8, 1162. [Google Scholar] [CrossRef]
  30. Michels, N.; Van de Wiele, T.; Fouhy, F.; O’Mahony, S.; Clarke, G.; Keane, J. Gut microbiome patterns depending on children’s psychosocial stress: Reports versus biomarkers. Brain Behav. Immun. 2019, 80, 751–762. [Google Scholar] [CrossRef]
  31. Sudo, N.; Chida, Y.; Aiba, Y.; Sonoda, J.; Oyama, N.; Yu, X.N.; Kubo, C.; Koga, Y. Postnatal microbial colonization programs the hypothalamic-pituitary-adrenal system for stress response in mice. J. Physiol. 2004, 558, 263–275. [Google Scholar] [CrossRef]
  32. Mackos, A.R.; Varaljay, V.A.; Maltz, R.; Gur, T.L.; Bailey, M.T. Role of the Intestinal Microbiota in Host Responses to Stressor Exposure. Int. Rev. Neurobiol. 2016, 131, 1–19. [Google Scholar] [CrossRef]
  33. Stecher, B. The Roles of Inflammation, Nutrient Availability and the Commensal Microbiota in Enteric Pathogen Infection. Microbiol. Spectr. 2015, 3, 297–320. [Google Scholar] [CrossRef]
  34. Rada, V.; Petr, J. A new selective medium for the isolation of glucose non-fermenting bifidobacteria from hen caeca. J. Microbiol. Methods 2000, 43, 127–132. [Google Scholar] [CrossRef]
  35. Ishikawa, E.; Matsuki, T.; Kubota, H.; Makino, H.; Sakai, T.; Oishi, K.; Kushiro, A.; Fujimoto, J.; Watanabe, K.; Watanuki, M.; et al. Ethnic diversity of gut microbiota: Species characterization of Bacteroides fragilis group and genus Bifidobacterium in healthy Belgian adults, and comparison with data from Japanese subjects. J. Biosci. Bioeng. 2013, 116, 265–270. [Google Scholar] [CrossRef]
  36. Austin, B. The value of cultures to modern microbiology. Antonie Leeuwenhoek 2017, 110, 1247–1256. [Google Scholar] [CrossRef]
  37. Arvizu, I.S.; Murray, S.R. A simple, quantitative assay for the detection of viable but non-culturable (VBNC) bacteria. STAR Protoc. 2021, 2, 100738. [Google Scholar] [CrossRef]
  38. Junick, J.; Blaut, M. Quantification of human fecal bifidobacterium species by use of quantitative real-time PCR analysis targeting the groEL gene. Appl. Environ. Microbiol. 2012, 78, 2613–2622. [Google Scholar] [CrossRef]
  39. Morisset, D.; Štebih, D.; Milavec, M.; Gruden, K.; Žel, J. Quantitative analysis of food and feed samples with droplet digital PCR. PLoS ONE 2013, 8, e62583. [Google Scholar] [CrossRef]
  40. Chen, S.; He, F.; Cheng, X. Analysis of subgingival bacterial and fungal diversity in patients with peri-implantitis based on 16sRNA and internal transcribed spacer sequencing. Future Microbiol. 2023, 19. [Google Scholar] [CrossRef]
  41. Klindworth, A.; Pruesse, E.; Schweer, T.; Peplies, J.; Quast, C.; Horn, M.; Glöckner, F.O. Evaluation of general 16S ribosomal RNA gene PCR primers for classical and next-generation sequencing-based diversity studies. Nucleic Acids Res. 2013, 41, e1. [Google Scholar] [CrossRef]
  42. Turroni, F.; Marchesi, J.R.; Foroni, E.; Gueimonde, M.; Shanahan, F.; Margolles, A.; van Sinderen, D.; Ventura, M. Microbiomic analysis of the bifidobacterial population in the human distal gut. ISME J. 2009, 3, 745–751. [Google Scholar] [CrossRef]
  43. Hu, L.; Lu, W.; Wang, L.; Pan, M.; Zhang, H.; Zhao, J.; Chen, W. Assessment of Bifidobacterium Species Using groEL Gene on the Basis of Illumina MiSeq High-Throughput Sequencing. Genes 2017, 8, 336. [Google Scholar] [CrossRef]
  44. Zheng, H.; Bai, X.; Gao, X.; Sun, Z.; Zhang, H. Screening and optimization of Bifidobacterium-specific sequencing primers. Microbiol. China 2019, 46, 1736–1747. [Google Scholar]
  45. Athanasopoulou, K.; Boti, M.A.; Adamopoulos, P.G.; Skourou, P.C.; Scorilas, A. Third-Generation Sequencing: The Spearhead towards the Radical Transformation of Modern Genomics. Life 2021, 12, 30. [Google Scholar] [CrossRef]
  46. Mosher, J.J.; Bowman, B.; Bernberg, E.L.; Shevchenko, O.; Kan, J.; Korlach, J.; Kaplan, L.A. Improved performance of the PacBio SMRT technology for 16S rDNA sequencing. J. Microbiol. Methods 2014, 104, 59–60. [Google Scholar] [CrossRef]
  47. Zhao, F.; Bai, X.; Zhang, J.; Kwok, L.Y.; Shen, L.; Jin, H.; Sun, T.; Sun, Z.; Zhang, H. Gut Bifidobacterium responses to probiotic Lactobacillus casei Zhang administration vary between subjects from different geographic regions. Appl. Microbiol. Biotechnol. 2022, 106, 2665–2675. [Google Scholar] [CrossRef]
  48. Gao, X.; Bai, X.; Zheng, H.; Sun, Z.; Zhang, H.; Zhong, Z. Design and evaluation of Bifidobacterium genus-specific primer for quantification. Acta Microbiol. Sin. 2020, 60, 545–555. [Google Scholar]
  49. Yang, C.; Zhao, F.; Hou, Q.; Wang, J.; Li, M.; Sun, Z. PacBio sequencing reveals bacterial community diversity in cheeses collected from different regions. J. Dairy Sci. 2020, 103, 1238–1249. [Google Scholar] [CrossRef]
  50. Zhao, F.; Guo, Z.; Kwok, L.Y.; Zhao, Z.; Wang, K.; Li, Y.; Sun, Z.; Zhao, J.; Zhang, H. Bifidobacterium lactis Probio-M8 improves bone metabolism in patients with postmenopausal osteoporosis, possibly by modulating the gut microbiota. Eur. J. Nutr. 2023, 62, 965–976. [Google Scholar] [CrossRef]
  51. Silva, F.M.; Petrica, J.; Serrano, J.; Paulo, R.; Ramalho, A.; Lucas, D.; Ferreira, J.P.; Duarte-Mendes, P. The Sedentary Time and Physical Activity Levels on Physical Fitness in the Elderly: A Comparative Cross Sectional Study. Int. J. Environ. Res. Public Health 2019, 16, 3697. [Google Scholar] [CrossRef]
  52. Mäkeläinen, H.; Tahvonen, R.; Salminen, S.; Ouwehand, A.C. In vivo safety assessment of two Bifidobacterium longum strains. Microbiol. Immunol. 2003, 47, 911–914. [Google Scholar] [CrossRef]
  53. Zhang, X.; Zhong, H.; Li, Y.; Shi, Z.; Ren, H.; Zhang, Z.; Zhou, X.; Tang, S.; Han, X.; Lin, Y.; et al. Sex- and age-related trajectories of the adult human gut microbiota shared across populations of different ethnicities. Nat. Aging 2021, 1, 87–100. [Google Scholar] [CrossRef]
  54. Arboleya, S.; Watkins, C.; Stanton, C.; Ross, R.P. Gut Bifidobacteria Populations in Human Health and Aging. Front. Microbiol. 2016, 7, 1204. [Google Scholar] [CrossRef]
  55. Kivimäki, M.; Strandberg, T.; Pentti, J.; Nyberg, S.T.; Frank, P.; Jokela, M.; Ervasti, J.; Suominen, S.B.; Vahtera, J.; Sipilä, P.N.; et al. Body-mass index and risk of obesity-related complex multimorbidity: An observational multicohort study. Lancet Diabetes Endocrinol. 2022, 10, 253–263. [Google Scholar] [CrossRef]
  56. Kappel, B.A.; De Angelis, L.; Puetz, A.; Ballanti, M.; Menghini, R.; Marx, N.; Federici, M. Antibiotic-induced gut microbiota depletion exacerbates host hypercholesterolemia. Pharmacol. Res. 2023, 187, 106570. [Google Scholar] [CrossRef]
  57. Su, Q.; Tun, H.M.; Liu, Q.; Yeoh, Y.K.; Mak, J.W.Y.; Chan, F.K.; Ng, S.C. Gut microbiome signatures reflect different subtypes of irritable bowel syndrome. Gut Microbes 2023, 15, 2157697. [Google Scholar] [CrossRef]
  58. Mahdavinia, M.; Fyolek, J.P.; Jiang, J.; Thivalapill, N.; Bilaver, L.A.; Warren, C.; Fox, S.; Nimmagadda, S.R.; Newmark, P.J.; Sharma, H.; et al. Gut microbiome is associated with asthma and race in children with food allergy. J. Allergy Clin. Immunol. 2023, 152, 1541–1549.e1541. [Google Scholar] [CrossRef]
  59. Roslund, M.I.; Puhakka, R.; Grönroos, M.; Nurminen, N.; Oikarinen, S.; Gazali, A.M.; Cinek, O.; Kramná, L.; Siter, N.; Vari, H.K.; et al. Biodiversity intervention enhances immune regulation and health-associated commensal microbiota among daycare children. Sci. Adv. 2020, 6, eaba2578. [Google Scholar] [CrossRef]
  60. Zhou, B.; Jin, G.; Pang, X.; Mo, Q.; Bao, J.; Liu, T.; Wu, J.; Xie, R.; Liu, X.; Liu, J.; et al. Lactobacillus rhamnosus GG colonization in early life regulates gut-brain axis and relieves anxiety-like behavior in adulthood. Pharmacol. Res. 2022, 177, 106090. [Google Scholar] [CrossRef]
  61. Song, Q.; Zhang, X.; Liu, W.; Wei, H.; Liang, W.; Zhou, Y.; Ding, Y.; Ji, F.; Ho-Kwan Cheung, A.; Wong, N.; et al. Bifidobacterium pseudolongum-generated acetate suppresses non-alcoholic fatty liver disease-associated hepatocellular carcinoma. J. Hepatol. 2023, 79, 1352–1365. [Google Scholar] [CrossRef]
  62. Ye, L.; Hou, Y.; Hu, W.; Wang, H.; Yang, R.; Zhang, Q.; Feng, Q.; Zheng, X.; Yao, G.; Hao, H. Repressed Blautia-acetate immunological axis underlies breast cancer progression promoted by chronic stress. Nat. Commun. 2023, 14, 6160. [Google Scholar] [CrossRef]
  63. Kim, C.S.; Cha, L.; Sim, M.; Jung, S.; Chun, W.Y.; Baik, H.W.; Shin, D.M. Probiotic Supplementation Improves Cognitive Function and Mood with Changes in Gut Microbiota in Community-Dwelling Older Adults: A Randomized, Double-Blind, Placebo-Controlled, Multicenter Trial. J. Gerontol. A Biol. Sci. Med. Sci. 2021, 76, 32–40. [Google Scholar] [CrossRef]
  64. Derrien, M.; Turroni, F.; Ventura, M.; van Sinderen, D. Insights into endogenous Bifidobacterium species in the human gut microbiota during adulthood. Trends Microbiol. 2022, 30, 940–947. [Google Scholar] [CrossRef]
  65. Engevik, M.A.; Danhof, H.A.; Hall, A.; Engevik, K.A.; Horvath, T.D.; Haidacher, S.J.; Hoch, K.M.; Endres, B.T.; Bajaj, M.; Garey, K.W.; et al. The metabolic profile of Bifidobacterium dentium reflects its status as a human gut commensal. BMC Microbiol. 2021, 21, 154. [Google Scholar] [CrossRef] [PubMed]
Figure 1. Flow diagram of subject selection.
Microorganisms 12 00756 g001
Figure 2. Absolute quantification of bifidobacteria (the LOG value calculated by dd-PCR): (a,b) Number of droplets distribution of Bifidobacterium in the intestinal tract of college students and social workers; The colored line is the dividing line between positive droplets and negative droplets. The positive droplets are on the line and the negative droplets are off the line. (cf) Box plot showing the number of bifidobacteria based on the living environment, age, BMI, and gender. The “*” represents the intensity of significant difference (*, p < 0.05; **, p < 0.01).
Microorganisms 12 00756 g002
Figure 3. Heat map representing the distribution of bifidobacterial species in each individual.
Microorganisms 12 00756 g003
Figure 4. Microbial diversity: (A) Shannon index and Simpson index showed the α diversity of each group under different groups: (a) is the Shannon index and Simpson index of different living environment; (b) is the Shannon index and Simpson index of different BMI; (c) is the Shannon index and Simpson index of different ages; (d) is the Shannon index and Simpson index of different genders. (B) Principal coordinate analysis (PCoA) scores of the two groups under different influencing factors. (* p < 0.05); B (ad) is the PCoA diagram of different living environment, BMI, age and gender groups.
Microorganisms 12 00756 g004
Figure 5. Based on the annotated relative abundance of bifidobacteria, species with significant differences in intestinal bifidobacteria between the two groups of people in different living environments were selected (p < 0.05), and the content of bifidobacteria in each group is represented by a histogram.
Microorganisms 12 00756 g005
Figure 6. Species co-occurrence network of Bifidobacterium in different living environments. Solid and dotted lines represent positive correlation and negative correlation, respectively. Thick and thin lines represent the corresponding correlation strength, respectively (|R| > 0.3, p < 0.05). (A) represents the network interaction diagram of bifidobacteria in the intestinal tract of college students (XN group); (B) represents the network interaction diagram of bifidobacteria in the intestinal tract of the social population (XW group).
Microorganisms 12 00756 g006
Table 1. The volunteer grouping information.
GroupLiving EnvironmentAgeGenderBMI
Fundamentum divisionsDifferences in
living environment
18 ≤ Age ≤ 39, Young;
Age > 39, Middle aged
and elderly people.
----BMI > 28, Obesity;
BMI < 28, Health.
Group nameXNXWYoungMid–eldMaleFemaleObesityHealth
Number (n)4850851343551880
Disclaimer/Publisher’s Note: The statements, opinions and data contained in all publications are solely those of the individual author(s) and contributor(s) and not of MDPI and/or the editor(s). MDPI and/or the editor(s) disclaim responsibility for any injury to people or property resulting from any ideas, methods, instructions or products referred to in the content.

