Article

Symbiodiniaceae and Ruegeria sp. Co-Cultivation to Enhance Nutrient Exchanges in Coral Holobiont

State Key Laboratory of Marine Resource Utilization in South China Sea, Hainan University, Haikou 570228, China
*
Author to whom correspondence should be addressed.
Microorganisms 2024, 12(6), 1217; https://doi.org/10.3390/microorganisms12061217
Submission received: 30 May 2024 / Revised: 11 June 2024 / Accepted: 13 June 2024 / Published: 17 June 2024

Abstract

:
The symbiotic relationship between corals and their associated microorganisms is crucial for the health of coral reef eco-environmental systems. Recently, there has been a growing interest in unraveling how the manipulation of symbiont nutrient cycling affects the stress tolerance in the holobiont of coral reefs. However, most studies have primarily focused on coral–Symbiodiniaceae–bacterial interactions as a whole, neglecting the interactions between Symbiodiniaceae and bacteria, which remain largely unexplored. In this study, we proposed a hypothesis that there exists an inner symbiotic loop of Symbiodiniaceae and bacteria within the coral symbiotic loop. We conducted experiments to demonstrate how metabolic exchanges between Symbiodiniaceae and bacteria facilitate the nutritional supply necessary for cellular growth. It was seen that the beneficial bacterium, Ruegeria sp., supplied a nitrogen source to the Symbiodiniaceae strain Durusdinium sp., allowing this dinoflagellate to thrive in a nitrogen-free medium. The Ruegeria sp.–Durusdinium sp. interaction was confirmed through 15N-stable isotope probing–single cell Raman spectroscopy, in which 15N infiltrated into the bacterial cells for intracellular metabolism, and eventually the labeled nitrogen source was traced within the macromolecules of Symbiodiniaceae cells. The investigation into Symbiodiniaceae loop interactions validates our hypothesis and contributes to a comprehensive understanding of the intricate coral holobiont. These findings have the potential to enhance the health of coral reefs in the face of global climate change.

1. Introduction

Algae, commonly recognized as major components of phytoplankton, play a crucial role as primary producers in aquatic ecosystems. They contribute to approximately 50% of the biospheric net primary productivity and represent approximately 0.2% of the global primary producer biomass [1]. The dissolved organic carbon from phytoplankton exudation serves as a major energy source to drive heterotrophic prokaryote respiration and growth. In return, inorganic nutrients produced by heterotrophic prokaryotes enhance mineralization for phytoplankton [2,3,4].
Within marine ecosystems, coral hosts form an endosymbiosis with their microbiota, comprising Symbiodiniaceae, fungi, bacteria, archaea and viruses, and more, to create the coral holobiont. Among them, Symbiodiniaceae are photosynthetic dinoflagellates, which are also colloquially known as zooxanthellae. They are single-cell microalgae and constitute the phototrophic components of the coral holobiont [5,6,7]. The photosynthetic products of Symbiodiniaceae are transferred to the coral host, supplying them as a source of energy, which is vital for coral growth and the construction of calcium carbonate skeletons. Corals assist Symbiodiniaceae by providing carbon dioxide and trace elements through the marine environment, and heterotrophically fix the photosynthetically derived organic carbon by Symbiodiniaceae [8]. Simultaneously, symbiotic bacteria play a pivotal role in maintaining the health of the coral holobiont and facilitating the adaptations of this intricate biological system in the ocean [9]. Numerous studies have demonstrated that symbiotic microalgae and bacteria act in concert to maintain coral in homeostasis, as any destruction in either component results in the dissociation of the coral holobiont [10,11,12].
The mechanism of symbiotic relationships between microalgae and bacteria in the coral holobiont was confirmed by earlier studies, which elucidated that algal photosynthesis provides a high concentration of molecular oxygen (>200% saturation), aiding coral and associated prokaryotic microorganisms in respiration and biosynthesis [13,14]. The bacterial community residing in coral skeletons has been estimated to fulfill 50% of the total nitrogen requirements of their symbiotic partners, with organic compounds produced by cyanobacteria aiding the coral tissue [15]. On the other hand, bacteria produce antibiotics to protect their hosts and Symbiodiniaceae from the diseases caused by pathogens, thereby maintaining symbiotic health and improving its resilience to environmental stresses, ultimately preventing coral bleaching [16,17]. Bacterial communities in coral holobionts have been proven to be beneficial for the animal hosts and Symbiodiniaceae, in particular, as the diazotrophs to provide nitrogen sources. Therefore, the investigation of Symbiodiniaceae–bacteria interactions becomes a logical step toward understanding the mechanisms underlying the intricate multi-partner associations that occur within the coral holobiont.
Recent advancements in deep-sequencing methodologies have been employed to explore the impact of bacterial metabolism on Symbiodiniaceae’s nutrition and survival [18]. Over the decades, the development of rapid and cost-effective sequencing technologies has provided microbiologists with access to genome fragments and even the complete genomes of marine microbes. Despite the availability of such rich genomic information, the interpretation of the metabolite exchange within coral holobionts from the omic data remains difficult.
Currently, secondary ion mass spectrometry (NanoSIMS) has been applied to reveal the transfer of carbon (C) and nitrogen (N) among coral, Symbiodiniaceae and microorganisms by measuring 13C and 15N enrichment at the single-cell level [19]. However, mass spectroscopy, including NanoSIMS, is a destructive technique, preventing cells of interest from further studies, such as single-cell genomics and even cultivation. Single-cell Raman spectroscopy (SCRS) refers to the collection of Raman spectra obtained from individual cells. Raman spectroscopy is a non-destructive technique that measures the vibrational modes of molecules in a sample, providing information about its molecular composition and the structure of a single cell. In microbiology, this technique has been reported, for example, for the rapid spectroscopic identification of bacteria and fungi [20], and for studying bacterial metabolism and interactions at single-cell level [21]. The SCRS technique uses laser light to generate a chemical fingerprint of a single cell, and can identify different metabolic phenotypes of cells based on the Raman peaks in the spectra. Analyzing the Raman spectra of multiple cells in a population or symbiosis allows for the creation of a ramanome, which represents a metabolic snapshot of the population. A spectrum analysis of microbial cells, although more intricate than biofilms, facilitates the identification of several compounds, such as phenylalanine [22], tryptophan [23], carotenoids [24] and cytochrome c [25].
Isotope-labeling techniques, combined with SCRS, provide a tool to measure the cellular intake rates of substrates [26,27], monitor the biosynthetic profiles of cells, such as carotenoids, proteins and triacylglycerols [28], and characterize cellular responses to environmental changes [29].
In this study, we proposed a hypothesis that there exists an inner symbiotic loop of Symbiodiniaceae and bacteria (Symbiodiniaceae loop) within the coral symbiotic loop (coral–Symbiodiniaceae–bacteria). While previous coral studies have predominantly focused on the holistic interactions involving corals, Symbiodiniaceae, and bacteria, the nuanced relationship between Symbiodiniaceae and bacteria has been largely unexplored. Notably, we delved into the lesser-explored Symbiodiniaceae loop interactions to demonstrate how metabolic exchanges in the Symbiodiniaceae loop facilitate the nutritional supply necessary for cellular growth. We conducted a comprehensive screening and an in vitro cultivation of symbiotic microorganisms isolated from the reef-building corals Acropora hyacinthus [30] and Galaxea fascicularis [31], which resulted in the identification of a Ruegeria sp. strain containing nitrogen fixation genes. We evaluated the photosynthetic efficiency of Symbiodiniaceae under varying concentrations of Ruegeria sp. MR31c using chlorophyll fluorescence in vivo, as well as the accumulation of main photosynthetic pigments. Our investigation further substantiated the role of this beneficial bacterium in supplying nitrogenous compounds to Durusdinium sp. for intracellular nutrition, as confirmed through 15N-stable isotope probing–single-cell Raman spectroscopy (15N-SIP-SCRS). This technique unveiled the infiltration of 15N into bacterial cells, where it was utilized for intracellular metabolism. Eventually, we traced the labeled nitrogen source within the macromolecules, including proteins, carbohydrates and lipids, within the Symbiodiniaceae cells.

2. Materials and Methods

2.1. Sampling Procedures

A. hyacinthus and G. fascicularis corals were collected at the Wuzhizhou island, Sanya, Hainan, China (18°18′52.8″ N 109°46′07.9″ E). These two coral species were transported in sterile plastic bags and then packed in Styrofoam boxes containing 1 L of seawater and sent by car to a laboratory. Upon arrival at the research station, the coral colonies were fragmented using a pair of pliers (Maxspect, Ltd., Hongkong, China) in 5 cm fragments.

2.2. Isolation of Bacterial Strains and Symbiodiniaceae from Corals

Three previously tagged fragments of A. hyacinthus and G. fascicularis were used as a material to isolate bacterial and Symbiodiniaceae strains. Two approaches were used for microbial isolation. First, sterile seawater was used to rinse the coral surface to remove impurities. After cleaning, coral fragments were placed in a sterile mortar and continuously ground with sterile seawater until they were sufficiently fine, then transferred to a 50 mL tube and subsequently centrifuged at 5000× g for 5 min. Triplicate samples (50–100 μL) were inoculated into Petri dishes containing 20 mL of Marine Agar 2216E medium (19.45 g NaCl, 8.8 g MgCl2, 5 g tryptone, 3.24 g Na2SO3, 1.8 g CaCl2, 1 g yeast extract, 0.55 g KCl, 0.16 g NaHCO3, 0.1 g FeCl2, 0.08 g KBr, 0.03 g SrCl2, 0.02 g H3BO3, and 15 g of agar in 1 L distilled water at pH 7.6 ± 0.2), 2.5% NaCl Luria-bertani medium (10 g tryptone, 5 g yeast extract, 25 g NaCl and 15 g of agar in 1 L distilled water), sea water medium (1000 mL of seawater and 15 g of agar), SaltCzapek-DoxAgar (CDA) medium (2 g NaNO3, 1 g K2HPO4, 0.5 g MgSO4, 0.5 g KCl, 0.01 g FeSO4, 30 g Sucrose, and 15 g of agar in 1 L distilled water) and L1 medium (75 μg L−1 NaNO3, 5 μg L−1 NaH2PO4·H2O, trace elements and Vitamin) with antibiotics [32] (antibiotic composition: final concentration of 50 mg L−1 ampicillin, kanamycin, chloramphenicol, chlortetracycline, streptomycin and penicillin). In addition, the centrifuged pellet was resuspended in sterile seawater and triplicate subsamples (50–100 μL) of 10−1, 10−2, 10−3, 10−4, 10−5 dilutions were inoculated by the above medium. All the plates were incubated at 26 °C for 72 h, and followed day/night cycles (12 h/12 h) with 60 μmol of photons m−2 s−1 from 07:00 to 19:00 daily. A total of 42 colonies were isolated, and, based on the colony color and morphology, 24 strains were derived from milled slurries and 15 were derived from resuspensions. Each morphologically different colony was snap frozen in liquid nitrogen and stored in −80 °C fridge with a final concentration of 25% glycerol, and recovered when necessary for screening.

2.3. Functional Screening for Probiotic Bacteria Using 16S/ITS2 rDNA Gene Sequencing

Depending on the required biomass, Symbiodiniaceae cultures were grown in 6-well plates for the suspended cell cultures (3516, Corning, Corning, NY, USA), sealed with parafilm to prevent evaporation, and in 250 mL polycarbonate flasks for the purified single colonies with vented caps (17211, Beijing labgic technology Co., Ltd., Beijing, China). Bacterial genomes were isolated using TIANamp Bacteria DNA Kit (TianGen Biotech Co., Ltd., Beijing, China), following the manufacturer’s instructions. The DNA concentration was determined using the micro ultraviolet spectrophotometer (Nanodrop-2000, Thermo Fisher, Waltham, MA, USA). The purified 16S rRNA gene was amplified using the primers 27F (5′-AGAGTTTGATCCTGGCTCAG-3′) and 1492R (5′-TACCTTGTTACGACTT-3′) by 2 × Taq PCR master mix (TianGen Biotech Co Ltd., Beijing, China) and polymerase chain reaction (PCR). PCR cycles included 3 min of pre-denaturation at 94 °C, 30 cycles of 94 °C for 40 s, 55 °C for 1 min, 72 °C for 2 min and a final extension cycle of 10 min at 72 °C. Symbiodiniaceae genomes were isolated using the Hi-DNA secure Plant Kit (TianGen Biotech Co Ltd., Beijing, China), following the manufacturer’s instructions. To amplify the fungi ITS2 rDNA gene, the primers forward (5′-ATCGATGAAGAACGCAGC-3′) and reverse (5′-TCCTCCGCTTATTGATATGCCCCG-3′) were used. The thermal cycler conditions were as follows: initial denaturation at 95 °C for 3 min, 30 cycles of 95 °C for 30 s, 53 °C for 30 s, and 72 °C for 2 min, followed by a final extension at 72 °C for 5 min. Next, 5 μL of each PCR product was run on a 1% agarose gel to confirm successful amplification. PCR products were sequenced on the 3730xl DNA analyzer (Illumina PE150, Guangzhou, China) platform. The sequences were quality trimmed using Sequencher 4.6 and analyzed by BLAST of National Biotechnology Information Center. They were initially aligned using ClustalW as implemented in MegaX.
Each phenotypically distinct strain of bacteria was screened for beneficial traits for corals, according to Peixoto et al. [33]. Nitrogen cycle genes, such as dinitrogenase reductase genes (nifH) and nitrite reductase genes (nirK and nirS), were screened from genomic DNA samples by PCR (primer and PCR cycling information are shown in the Supplemental File Table S1). The PCR amplification products were subjected to agarose gel electrophoresis, and bacteria with nitrogen-fixing genes were screened out as potential probiotic bacteria of Symbiodiniaceae.

2.4. Symbiodiniaceae-Bacteria Co-Culture

Bacterial were inoculated into 50 mL flasks with L1 medium and cultivated at 25 °C for 48 h, with shaking at 150 rpm. The cells were centrifuged at 10,000 rpm, washed twice with sterile seawater, and transferred to fresh nitrogen-free L1 medium to reach a level of absorbance at 600 nm of 0.005, 0.01, 0.05, 0.1, 0.5. Symbiodiniaceae was inoculated into 200 mL of nitrogen-free L1 medium containing different concentrations of bacteria with a density of 105 cells mL−1. The algal growth in the culture was determined by the daily detection of cell density and chlorophyll fluorescence, and photosynthetic pigments were measured within 14 days. The number of algal cells was measured by direct counting under a microscope using a Sedgwick-Rafter counting chamber, and their abundance was calculated based on the sample volume. The photochemical efficiency of the AG11 was assessed using pulse amplitude-modulated (PAM) fluorometry (Dual-PAM-100, WALZ, Effeltrich, Germany). The control experiment included a bacterial culture with sterile nitrogen-free L1 medium and mixed Symbiodiniaceae–bacterial cultures, in which the initial Symbiodiniaceae concentration was 105 cells mL−1.

2.5. Labeling Bacteria with Stable Isotope 15N-NH4Cl

The nutrient exchanges between Symbiodiniaceae and bacteria were determined using 15N-labelled nitrogen sources. For this, 75 mg mL−1 of 15N-NH4Cl was added to L1 medium and cultured with a constant temperature shaker (THZ-D, Shenglan, Ltd., Changzhou, China) for 48 h, with shaking at 150 rpm. The control group was added with the same concentration of NH4Cl.

2.6. SIP-Bacteria and Symbiodiniaceae Co-Culture

Bacterial cultures were centrifuged at 10,000 rpm, washed twice with sterile seawater and transferred to fresh nitrogen-free L1 medium to reach a level of absorbance at 600 nm of 0.5. Bacteria and Symbiodiniaceae were co-cultured in the same manner as in 2.4. After 72 h, the signals of microalgae and bacteria were detected by single-cell Raman, respectively.

2.7. Determination of Photosynthetic Pigments

For the photosynthetic pigment assay, samples of 2 mL cell suspension were harvested by centrifugation at 6000× g for 7 min, supernatant was discarded, and 2 mL of pre-cooled methanol (−4 °C) was added to the pellet with the alginate. The mixture was placed in darkness at 4 °C and incubated for 60 min or longer until the precipitate became white. The absorbance of the supernatant was measured at 470 nm, 665 nm, 720 nm.
Chl a and total carotenoid concentrations were calculated according to the following formulas:
Chl a (μg/mL) = 12.9447 × (A665 − A720)
Total carotenoids (μg/mL) = [1000 × (A470 − A720) − 2.86 × (Chl a (μg/mL))]/221

2.8. Single-Cell Raman Spectrum Analysis

A portion of the cell mixture was dewatered using a centrifuge (5810R, EPPENDORF, Hamburg, Germany) at 6000 rpm for 5 min. The microalgal pellet was rinsed and resuspended with deionized water for three times. The resuspended algal liquid was sucked into a capillary (50 mm length × 1 mm width × 0.1 mm height, Camlab, Cambridge, UK) and placed on a slide. The slide was placed on the motorized stage of Horiba Raman spectrometer (Horiba LabRAM HR Evolution, HORIBA Scientific, Northampton, UK). A 100× magnifying dry objective (NA = 0.9, Olympus Co., Ltd., Southend-on-Sea, UK) was used for sample observation and Raman spectra acquisition. The Raman scattering from the cells was excited by a 532 nm laser with an approximate laser power of 100 mW, and the collection time was 10 s per spectrum. Each sample was randomly selected from 20 microalgal cells and 4 blank regions to collect Raman spectra.

2.9. Raman Spectra Analysis

All Raman spectra were recorded, combined, smoothed and baseline corrected by LabSpec 6. Spectra smoothing was accomplished using the polynomial function (Savitzky–Golay) method. The positions of the spectra bands were determined using a GaussLor constructor and subsequently imported into Origin 2021 for further analysis.

3. Results

3.1. Screening Results of Coral Symbiotic Microorganisms

We obtained 41 cultivable bacterial isolates associated with the corals A. hyacinthus and G. fascicularis by 5 different media. These bacteria were identified as belonging to various genera, including Vibrio sp., Ruegeria sp., Bacillus sp., Thalassotalea sp., and others such as Microbulbifer sp. (Table 1). The quantity and species diversity of the strains varied across the different culture media, with the most diverse strains identified in the MA2216E medium. It was found that Ruegeria sp. was the dominant strain, which outnumbered Vibrio sp. among all the cultivable bacteria. We further investigated the nitrogen fixation potential of these strains by amplifying specific gene sequences. Among the three Ruegeria sp. strains, Ruegeria sp. MR31c was positive for nirK and nifH, Ruegeria conchae was positive for nirS, and Ruegeria lacuscaerulensis was positive for nifH, respectively. Subsequently, we selected the Ruegeria sp. MR31c strain for further investigation. The phylogenetic relationship among these three stains of Ruegeria sp. was shown in Figure S1. At the same time, we isolated a strain of Symbiodinium sp. that was identified as Durusdinium sp.

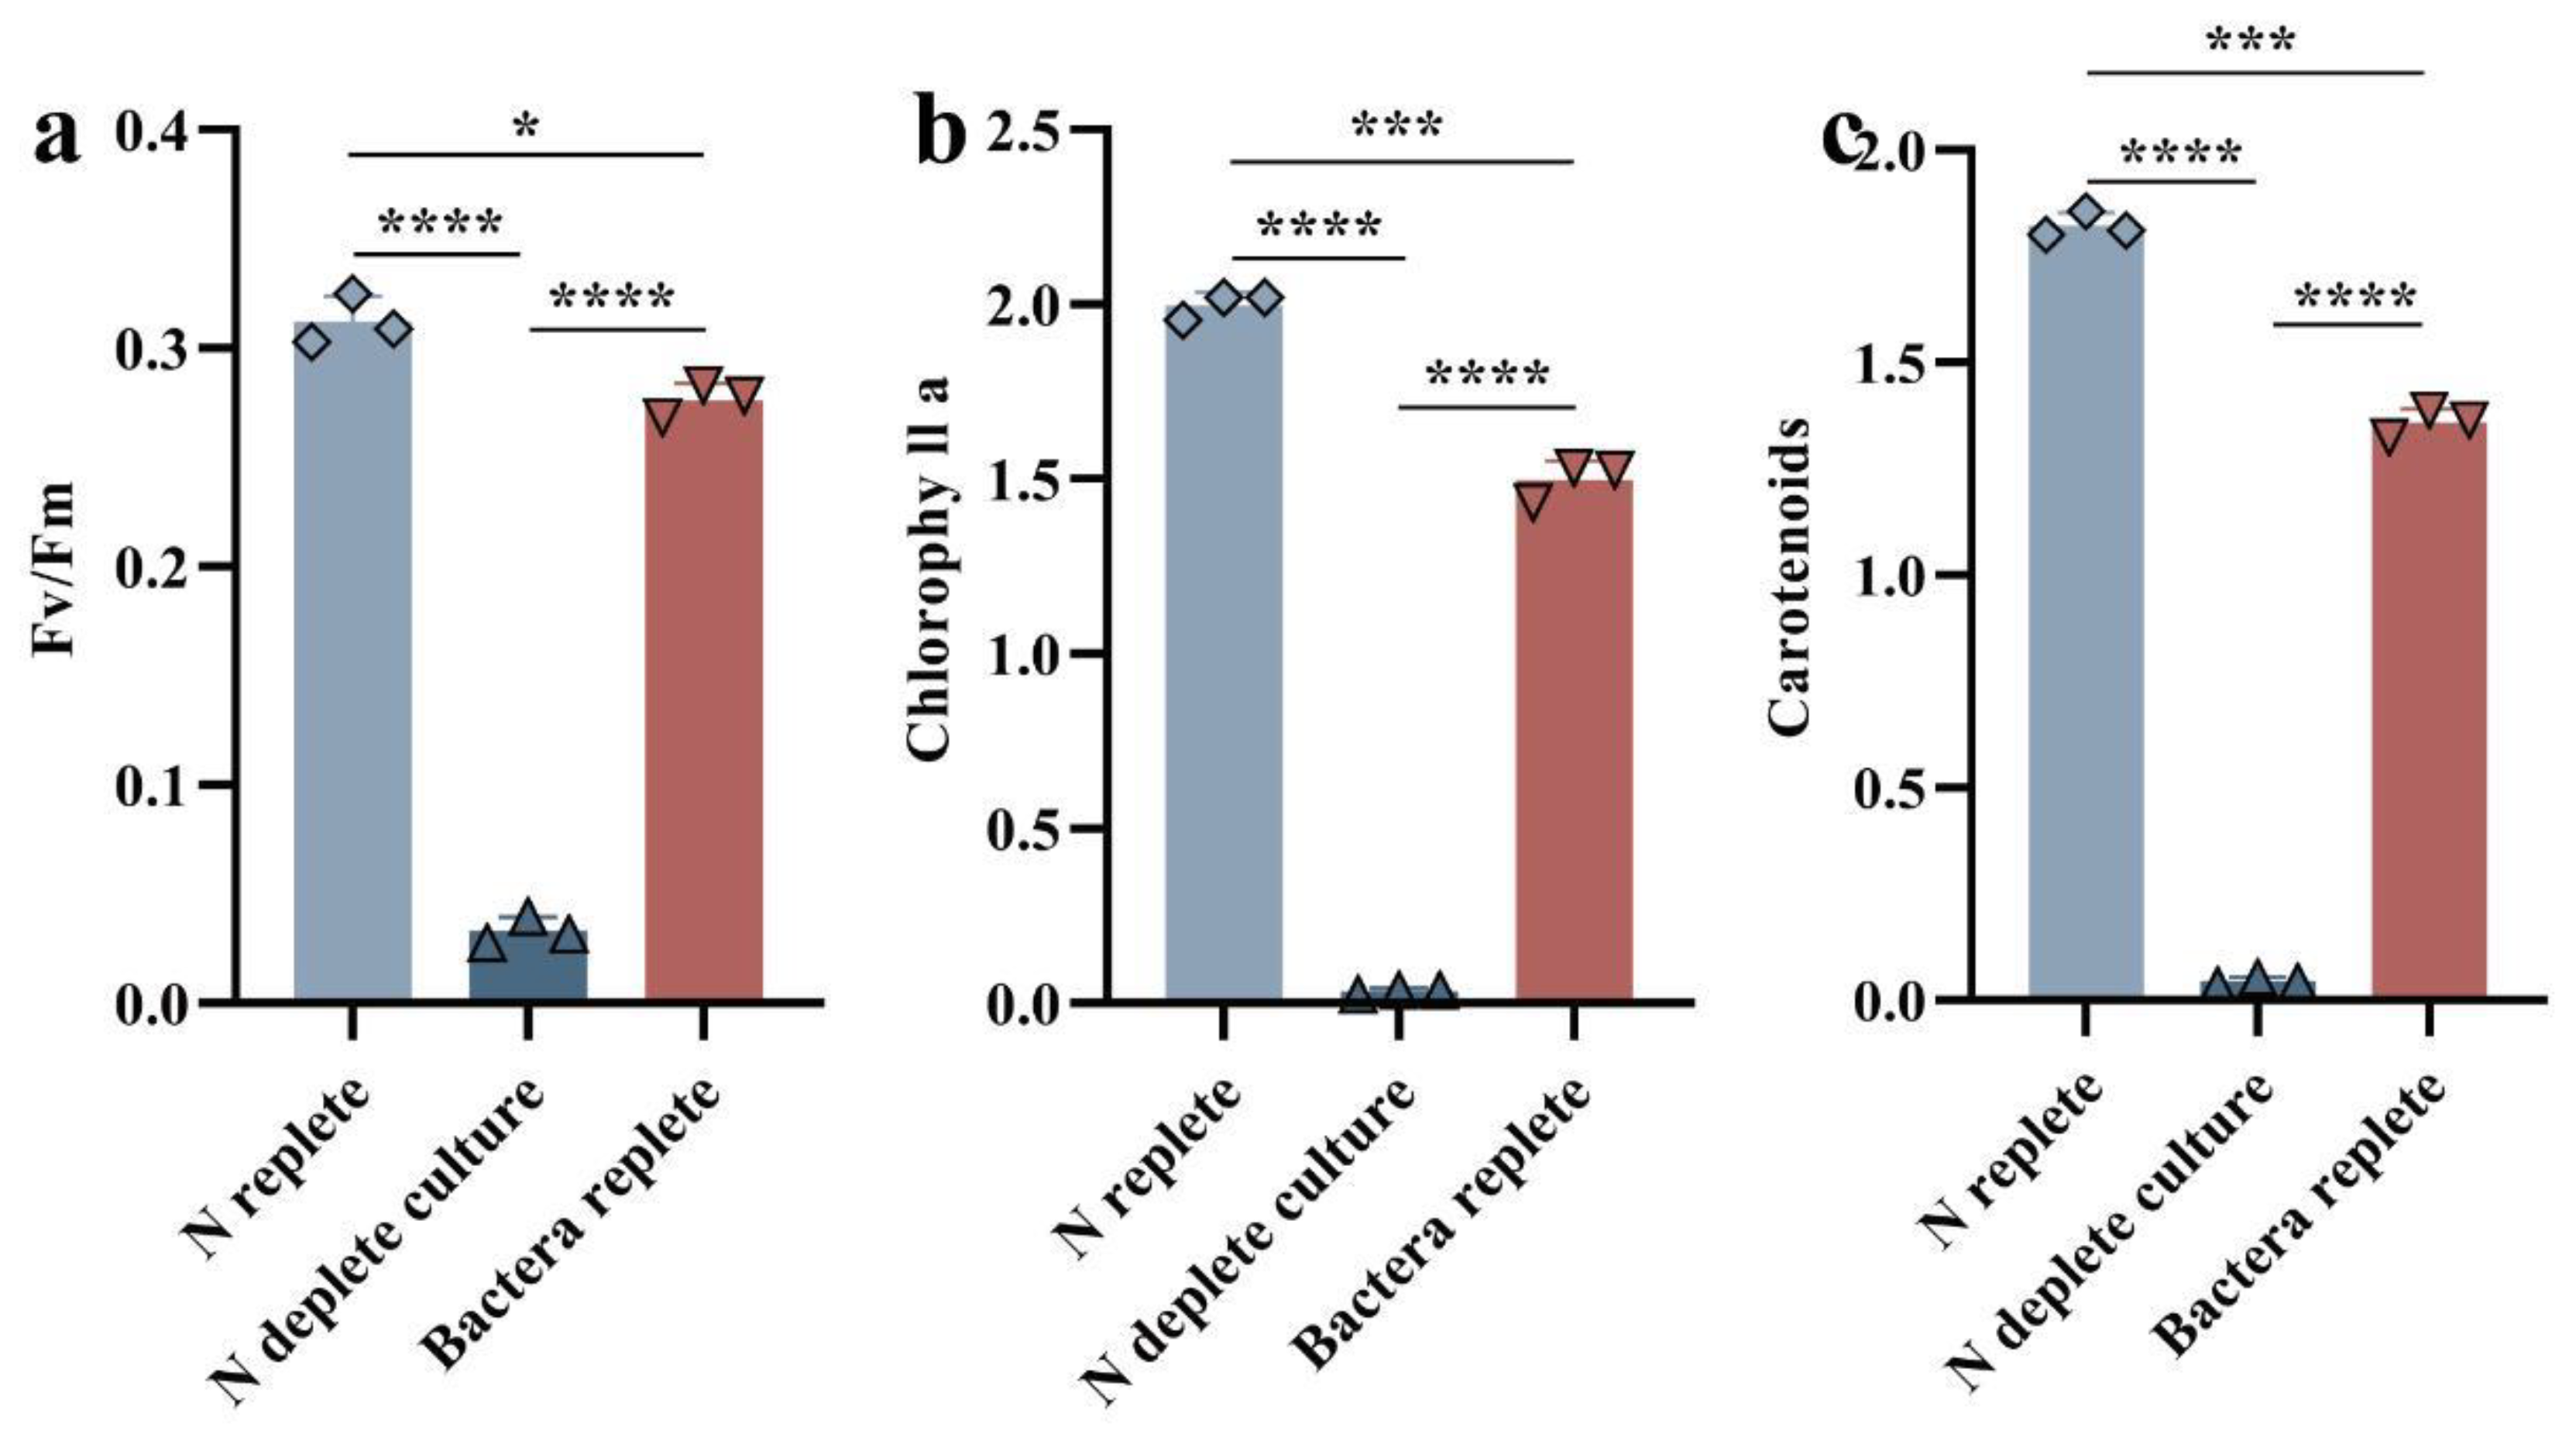
3.2. Physiological and Photosynthetic Response to Co-Cultivation of Symbiodiniaceae and Bacteria

The photosynthetic efficiency of Symbiodiniaceae, with the treatment of varying Ruegeria sp. MR31c concentrations, was evaluated by chlorophyll fluorescence in vivo and by the accumulation of main photosynthetic pigments. The Durusdinium sp. growth was observed to be influenced by both nutrient availability and co-cultured Ruegeria sp. MR31c concentrations. To account for potential issues arising from excessive bacterial concentration, such as an overabundance of nitrogen that can destabilize the coral–Durusdinium sp.–bacterial symbiosis, and medium turbidity that causes shading, the maximum co-culture concentration selected by the laboratory was OD600 = 0.5 [34].
Figure 1 illustrates the impact of probiotic bacterium Ruegeria sp. MR31c on the Durusdinium sp. growth alone and bacteria-added batch cultures vs. time and bacterial concentration (represented by Fv/Fm). As shown in Figure 1A, in the culture without Ruegeria sp. MR31c (as the control), it was found that the Fv/Fm of Durusdinium sp. decreased within the first 7 days of culture from 0.062 to a minimum of 0.012, then the value of Fv/Fm was up to 0.033 by day 7 to 14. In 14-day mixed cultures with low Ruegeria sp. MR31c concentrations (the optical density OD600 = 0.005 and 0.01), Fv/Fm values of Durusdinium sp. were similar to those of the control. While it was observed that when the bacterial cell density achieved OD600 > 0.01, Fv/Fm of Durusdinium sp. increased proportionally with the increasing bacteria concentrations. Particularly, when the optical density of Ruegeria sp. MR31c was up to OD600 = 0.5, Fv/Fm of Durusdinium sp. increased from 0.089 to 0.276 between the 6th and 14th day of culture, indicating that the addition of probiotic Ruegeria sp. MR31c at sufficiently high concentrations significantly enhanced the maximum quantum efficiency of PS II in Symbiodiniaceae and promoted the cell growth.
The relative accumulations of chlorophyll a (Chl a) and total carotenoids were measured specrophotometrically in 14-day algal cultures under nitrate-depleted conditions. We found that both the Chl a and total carotenoids of Durusdinium sp. grown alone were significantly reduced under nitrate-depleted conditions compared to Ruegeria sp. MR31c-added conditions (Figure 1B). However, when the optical density of bacteria OD600 was less than or equal to 0.01, the relative ratio of Chl a and total carotenoids showed no significant changes, as observed during the 14-day culture. As depicted in Figure 1C, when the optical density (OD600) of Ruegeria sp. MR31c increased from 0.05 to 0.5, the mixed cultures appeared darker, with a yellowish-brown color. In contrast, when the bacteria OD600 was less than 0.01, the color of the co-cultures remained essentially unchanged. Additionally, cultures with bacteria only remained grayish-white in the 14-day culture, irrespective of Ruegeria sp. (Figure 1D). This phenomenon suggests that low concentrations of bacteria could not rescue the algae from nutrient deprivation and may even lead to algal starvation and death in nitrogen-free medium, whereas a higher concentration of bacteria may provide organic nutrients to support algal growth. It is important to note that our current experiments indicated that while higher concentrations of the symbiotic microbes can meet the nutritional needs of Symbiodiniaceae in oligotrophic environmental conditions, excessive growth of certain symbionts could disrupt the coral–Symbiodiniaceae–microbial equilibrium, as symbionts may compete for substrates and nutrients. The existing literature also highlights the importance of controlling symbiont populations within the hosts to maintain the symbiotic relationship and prevent adverse consequences, such as blenching and pathogen infection [35].

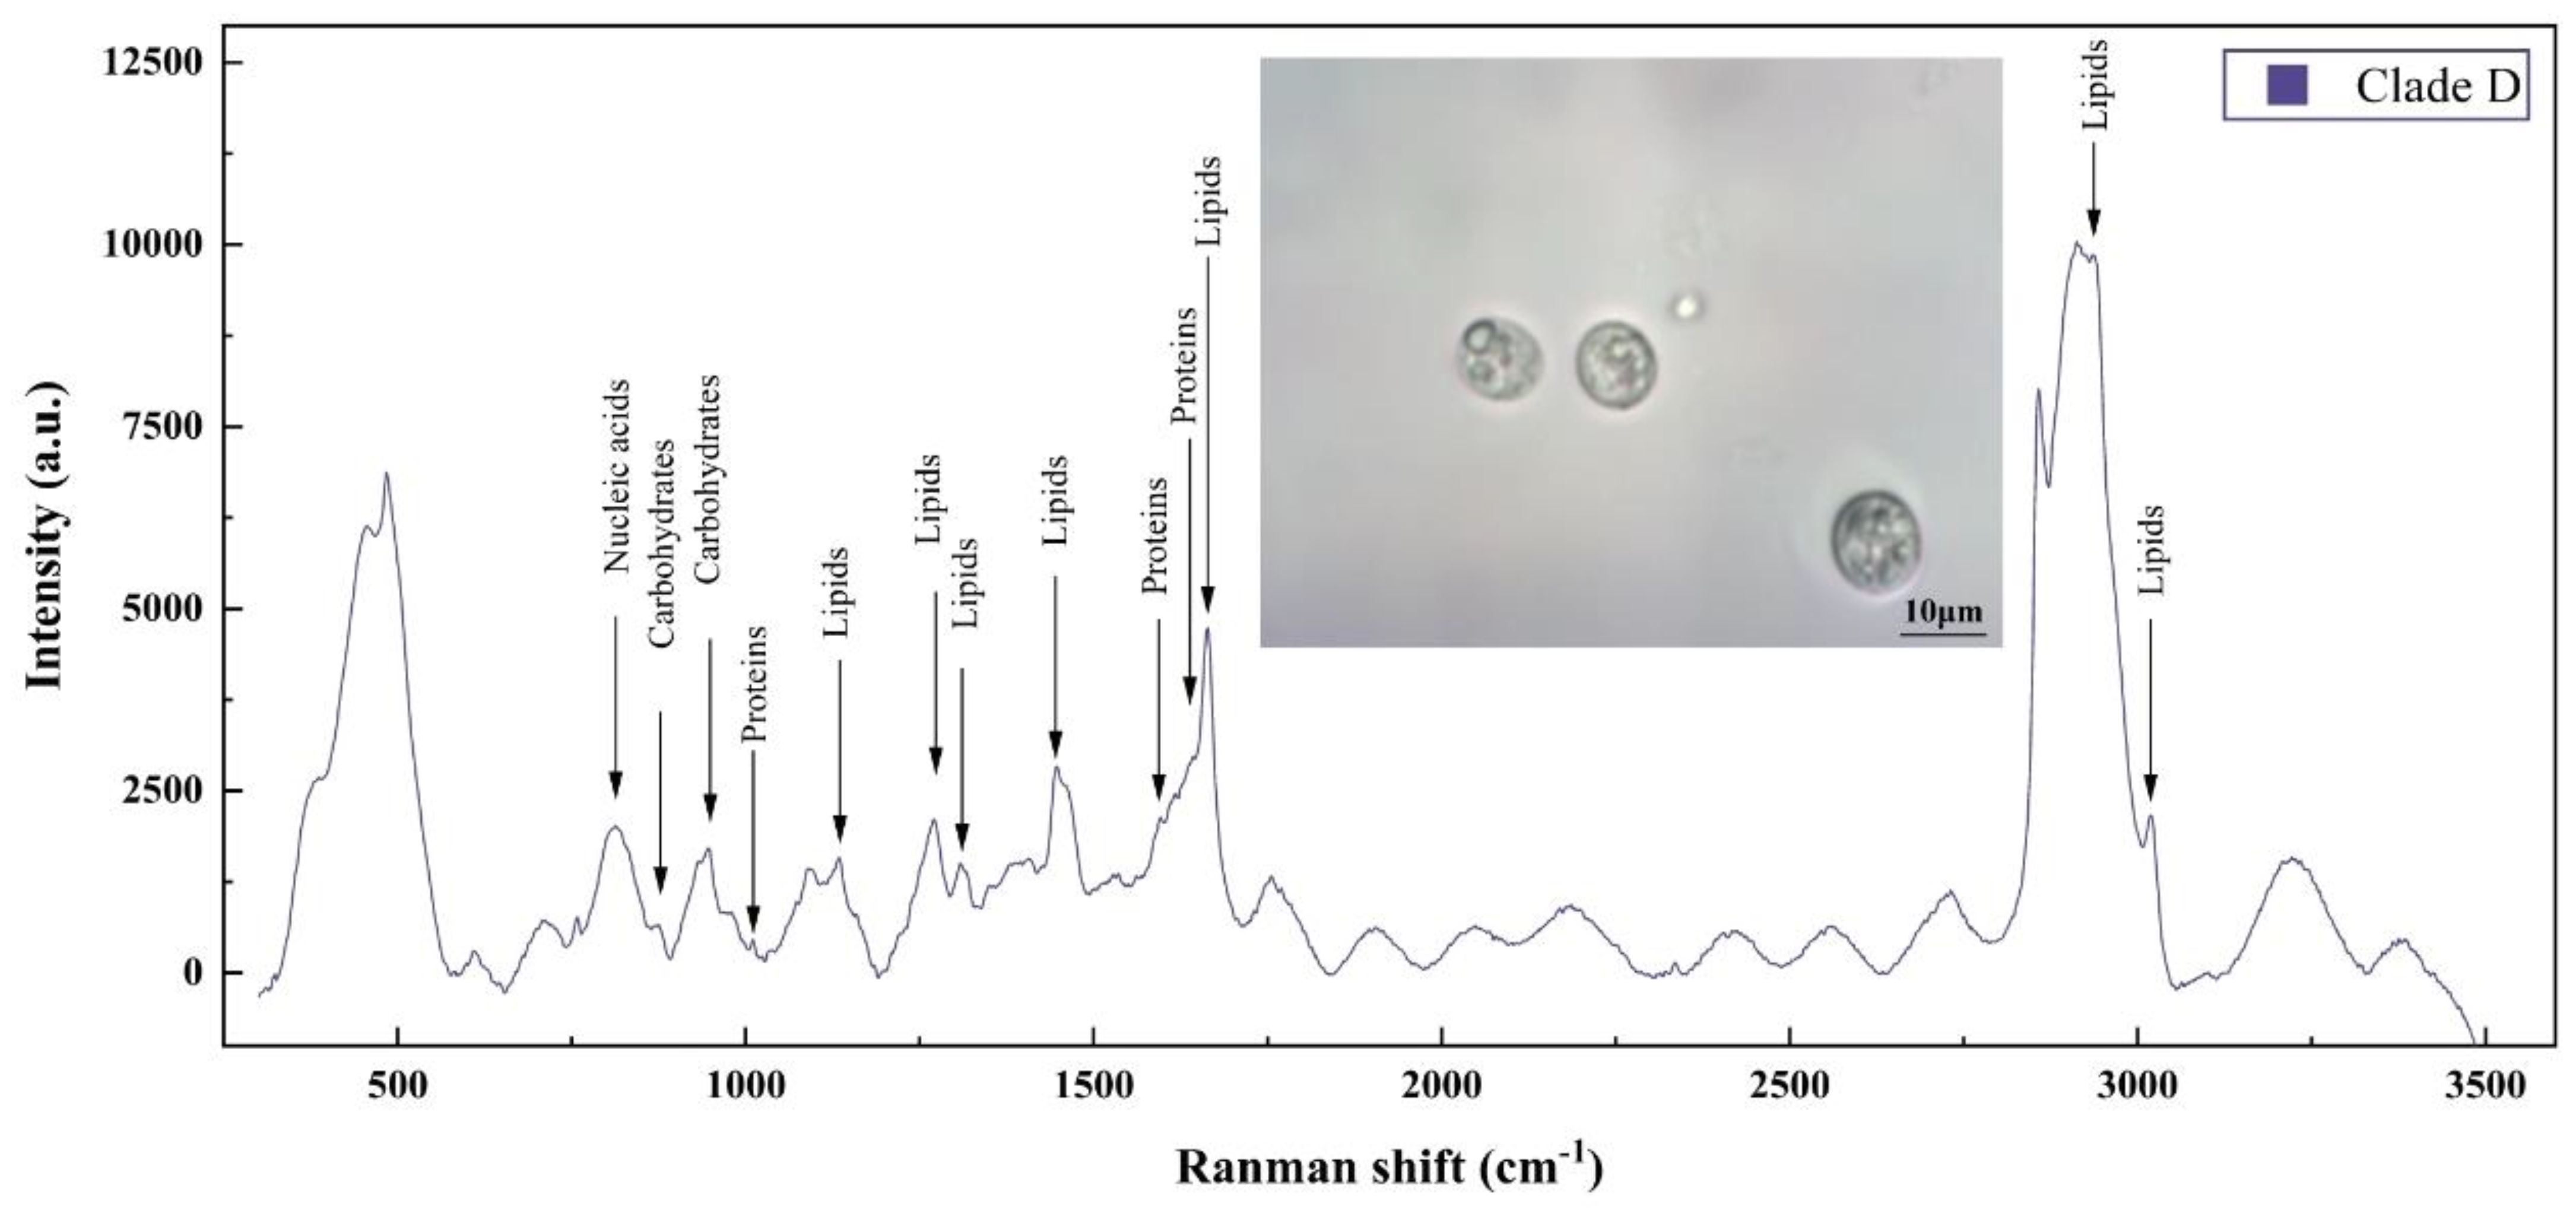
3.3. Raman Spectra of Single Microalgal Cell

Averaged Raman spectra for the single cell Durusdinium sp. is shown in Figure 2, with the corresponding biological band assignments detailed in Table 2. These spectra were generated using a laser power of 100 mW with an exposure time of 1 s. To ensure sufficient sample coverage at each time point, we followed a sampling strategy to collect a total of 60 SCRS per time point, as demonstrated in a prior study by He et al. [36]. Therefore, we selected 20 cells in each of the triplicate cultures to test their SCRS. Figure 2 displays Durusdinium sp. cells within the capillary tube, observed under a 100× objective microscope. The acquired spectral range covered from 300 to 3500 cm−1. The characteristic peaks determined from the literature [36,37,38] for abundant cellular components such as lipids, carbohydrates, proteins, and nucleic acids were clearly visible in the spectra. Noteworthy peaks include the ring breathing at 655.246 cm−1, amide III random at 1269.12 cm−1, and the C-N stretching at 1130.31 cm−1.

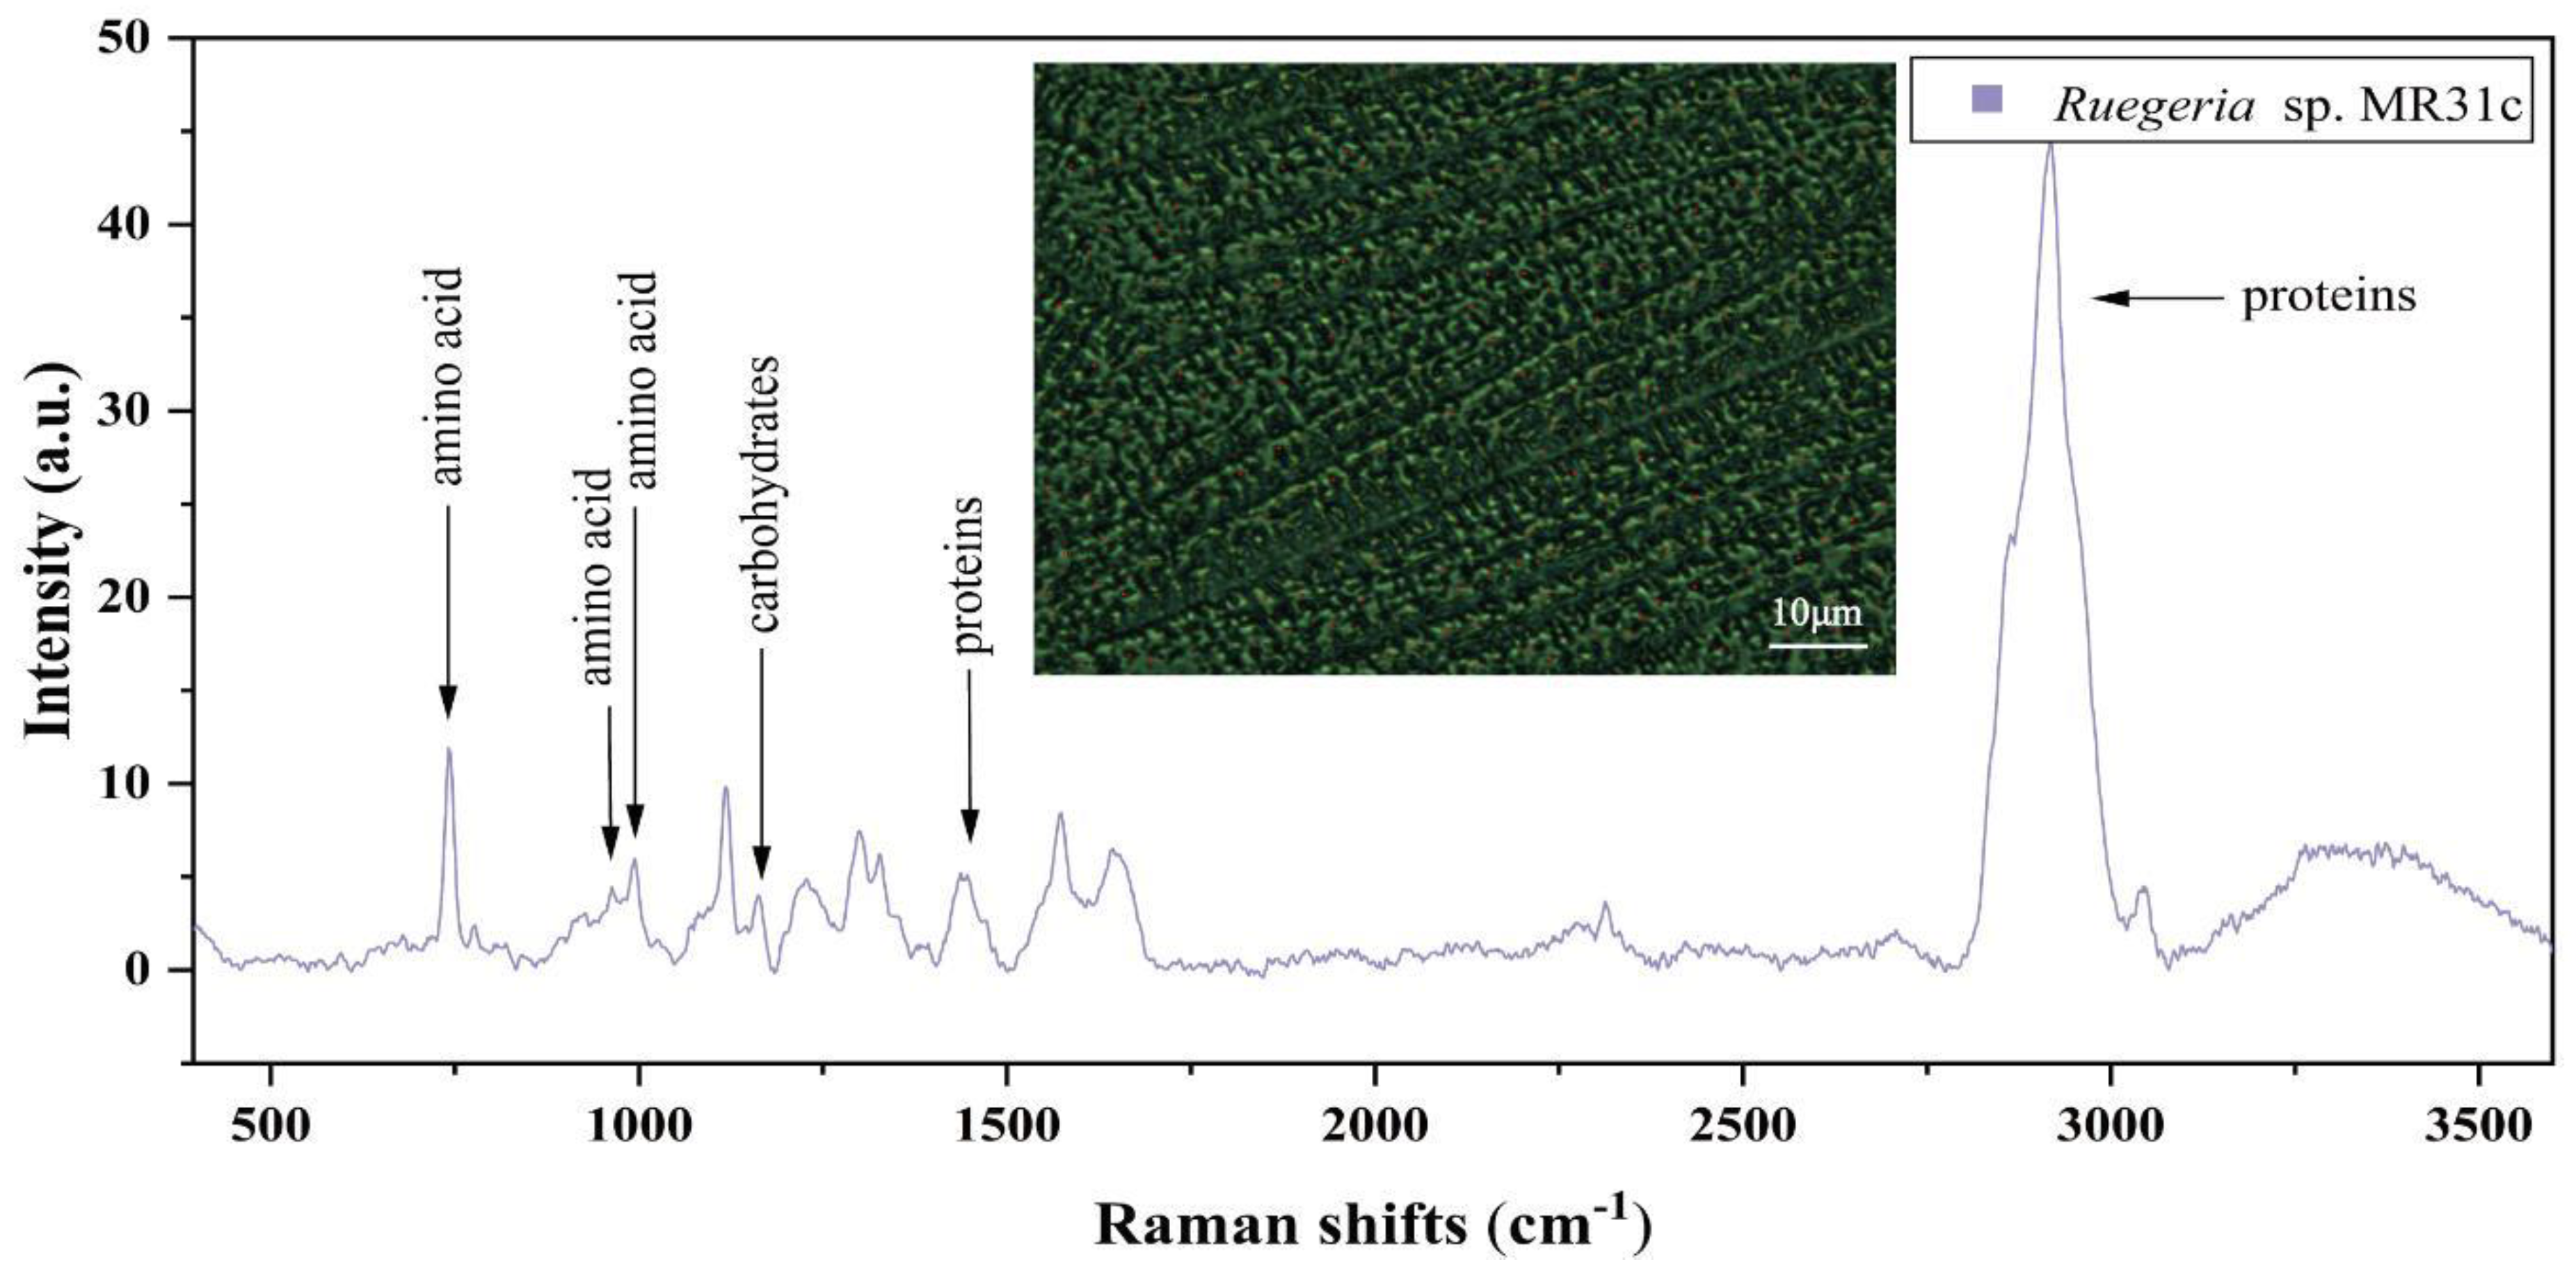
3.4. Raman Spectra of Single Bacterial Cell

On calcium fluoride (CaF2) microscope slides, a laser at the wavelength of 532 nm was employed to randomly pick and measure 60–80 bacterial cells. The spectral range spanned from 394.11 to 3540.90 cm−1. The Raman spectrum of Ruegeria sp. MR31c is shown in Figure 3, with peaks assigned to the intracellular components, such as amino acids, carbohydrates, proteins and lipids. The biological assignment of bands corresponding to the Raman spectrum is listed in Table 3.

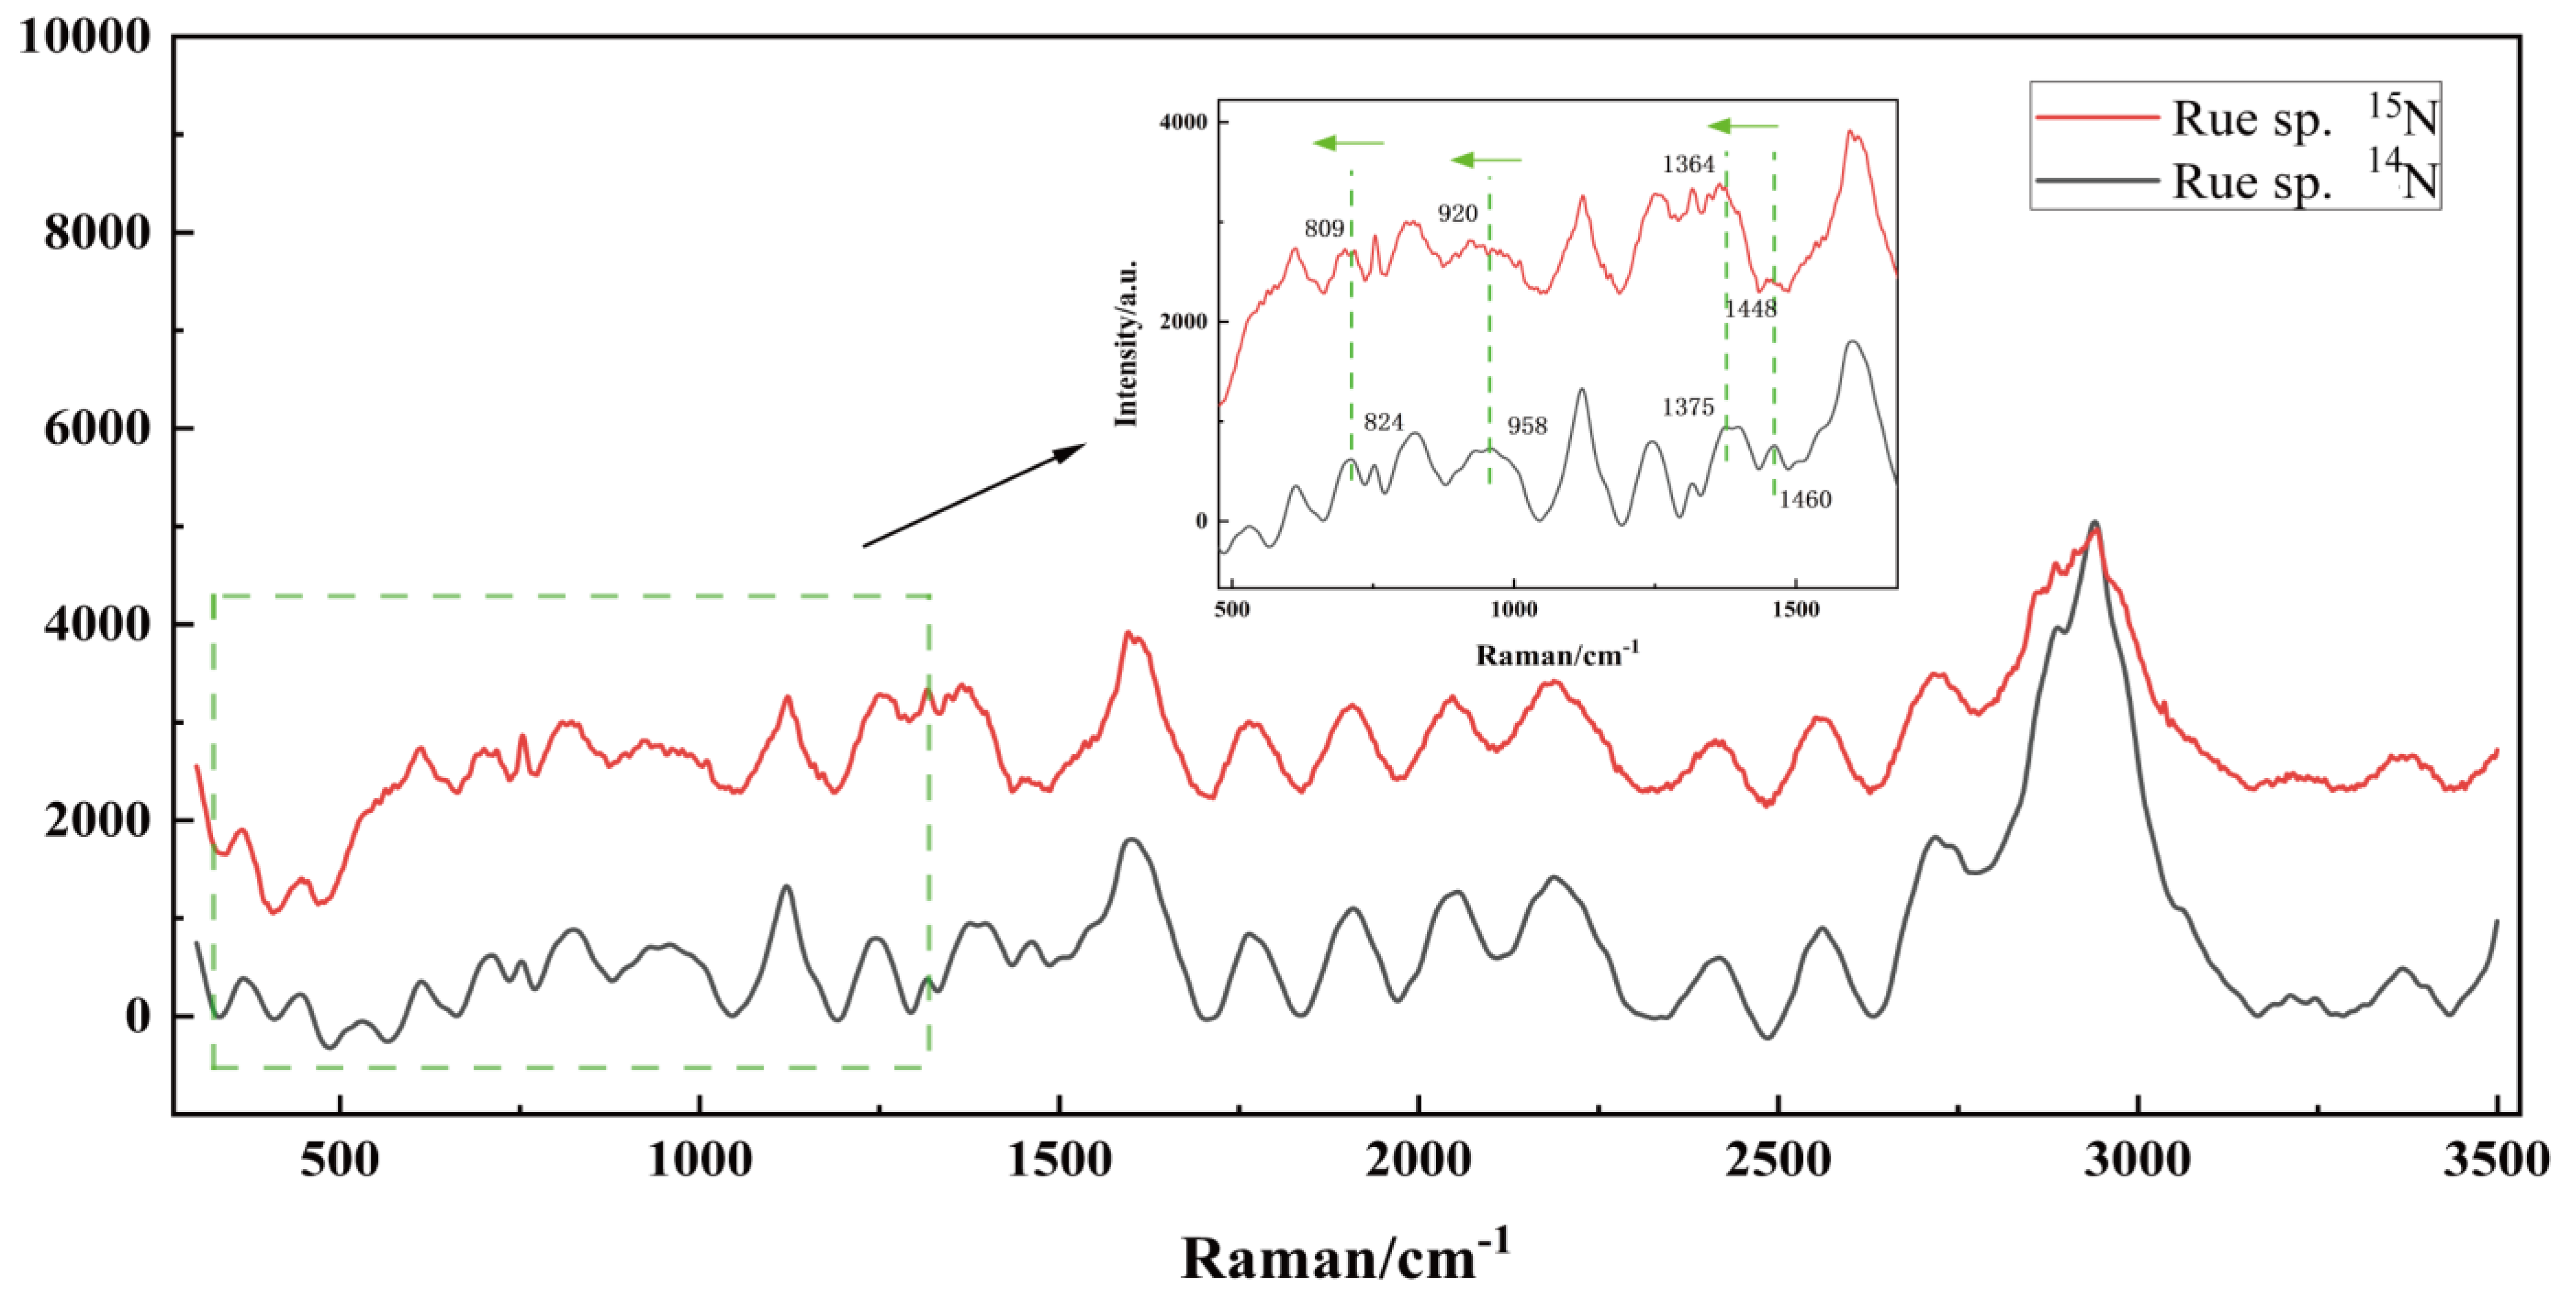
3.5. SCRS Dynamics of Forward 15N-Labelling in the Culture of Ruegeria sp. MR31c

Recently, 15N-stable isotope probing–single cell Raman spectroscopy (15N-SIP-SCRS) has been developed for cellular research. SCRS offers superior signal quality compared to fluorescent signals for revealing bacterial, metabolic and regulatory information, as it provides insight into intracellular structures. Isotope labeling involves replacing one or more atoms in a molecule or compound with isotopes of the same element but with a different atomic mass. When isotopes are introduced into a molecule or compound, it affects the mass of the atoms involved in the vibrations, subsequently alters the vibrational frequencies. This often leads to a red shift in Raman spectra, where the Raman peaks are shifted to lower energy or longer wavelengths compared to the spectra of the non-isotope-labeled molecule. The extent of the shift depends on the specific atoms involved and the positions at which isotopic substitution occurs. It has recently been found that some nitrogen-associated bands of bacterial SCRS shifted to a lower or higher wavelength after Ruegeria sp. MR31c cells were fed with isotope-labeled 15N-nitrogen substrates [39]. To investigate the impact of 15N-incorporation on bacterial metabolism using Raman spectroscopy, we cultured Ruegeria sp. MR31c on L1 medium with either 14N- or 15N-NH4Cl as the sole source of nitrogen. Centrifuged and rinsed 15N-labeled bacteria were inoculated into sterile, nitrogen-free Durusdinium sp. growth at a density of 109 cells mL−1 as the mixed culture for sampling. A comparison of these spectra revealed red shifts in the characteristic regions, with all shifted bands originating from nitrogen-associated compounds, as shown in Figure 4. In 48 h of incubation, the original 14N in the Ruegeria sp. MR31c cells was gradually replaced by the fed 15N, causing forward shifts from 14N Raman bands at 824, 958, 1375, and 1460 cm−1 back to 15N Raman bands at 804, 920, 1364 and 1448 cm−1. This red-shift phenomenon in the Raman spectra indicates that 15N-labelling substrate has participated in the biosynthesis of intracellular cytoskeletons for Ruegeria sp. MR31c. Among them, bands at 824 and 958 cm−1 were associated with the amino acids, tyrosine and proline, respectively, which have been well demonstrated by Thmos et al., Mary et al., and also supported by other bacterial SERS works [40,41]. Tyrosine and proline both contain amino groups situated on branched chains and ring structures, which accounts for the significant red shift in 824 and 958 cm−1 band when 15N substitutes 14N in these amino acids. Meanwhile, the band from 1375 cm−1 was assigned to nucleotide bases (thymine, adenine, guanine), and displayed a shift of 11 cm−1. Guanine and adenine contain four nitrogen atoms in their ring structure and one nucleobase in the side chain, respectively, and thymine contains two nitrogen atoms in its ring structure, contributing to the observed approximately 11 cm−1 corresponding shifts. Furthermore, the protein maker band shifted 12 cm−1 from 14N-SCRS at 1460 cm−1 to 15N-SCRS at 1448 cm−1. This displacement suggests that 15N-ammonium is infiltrated into the cell to participate in protein synthesis.

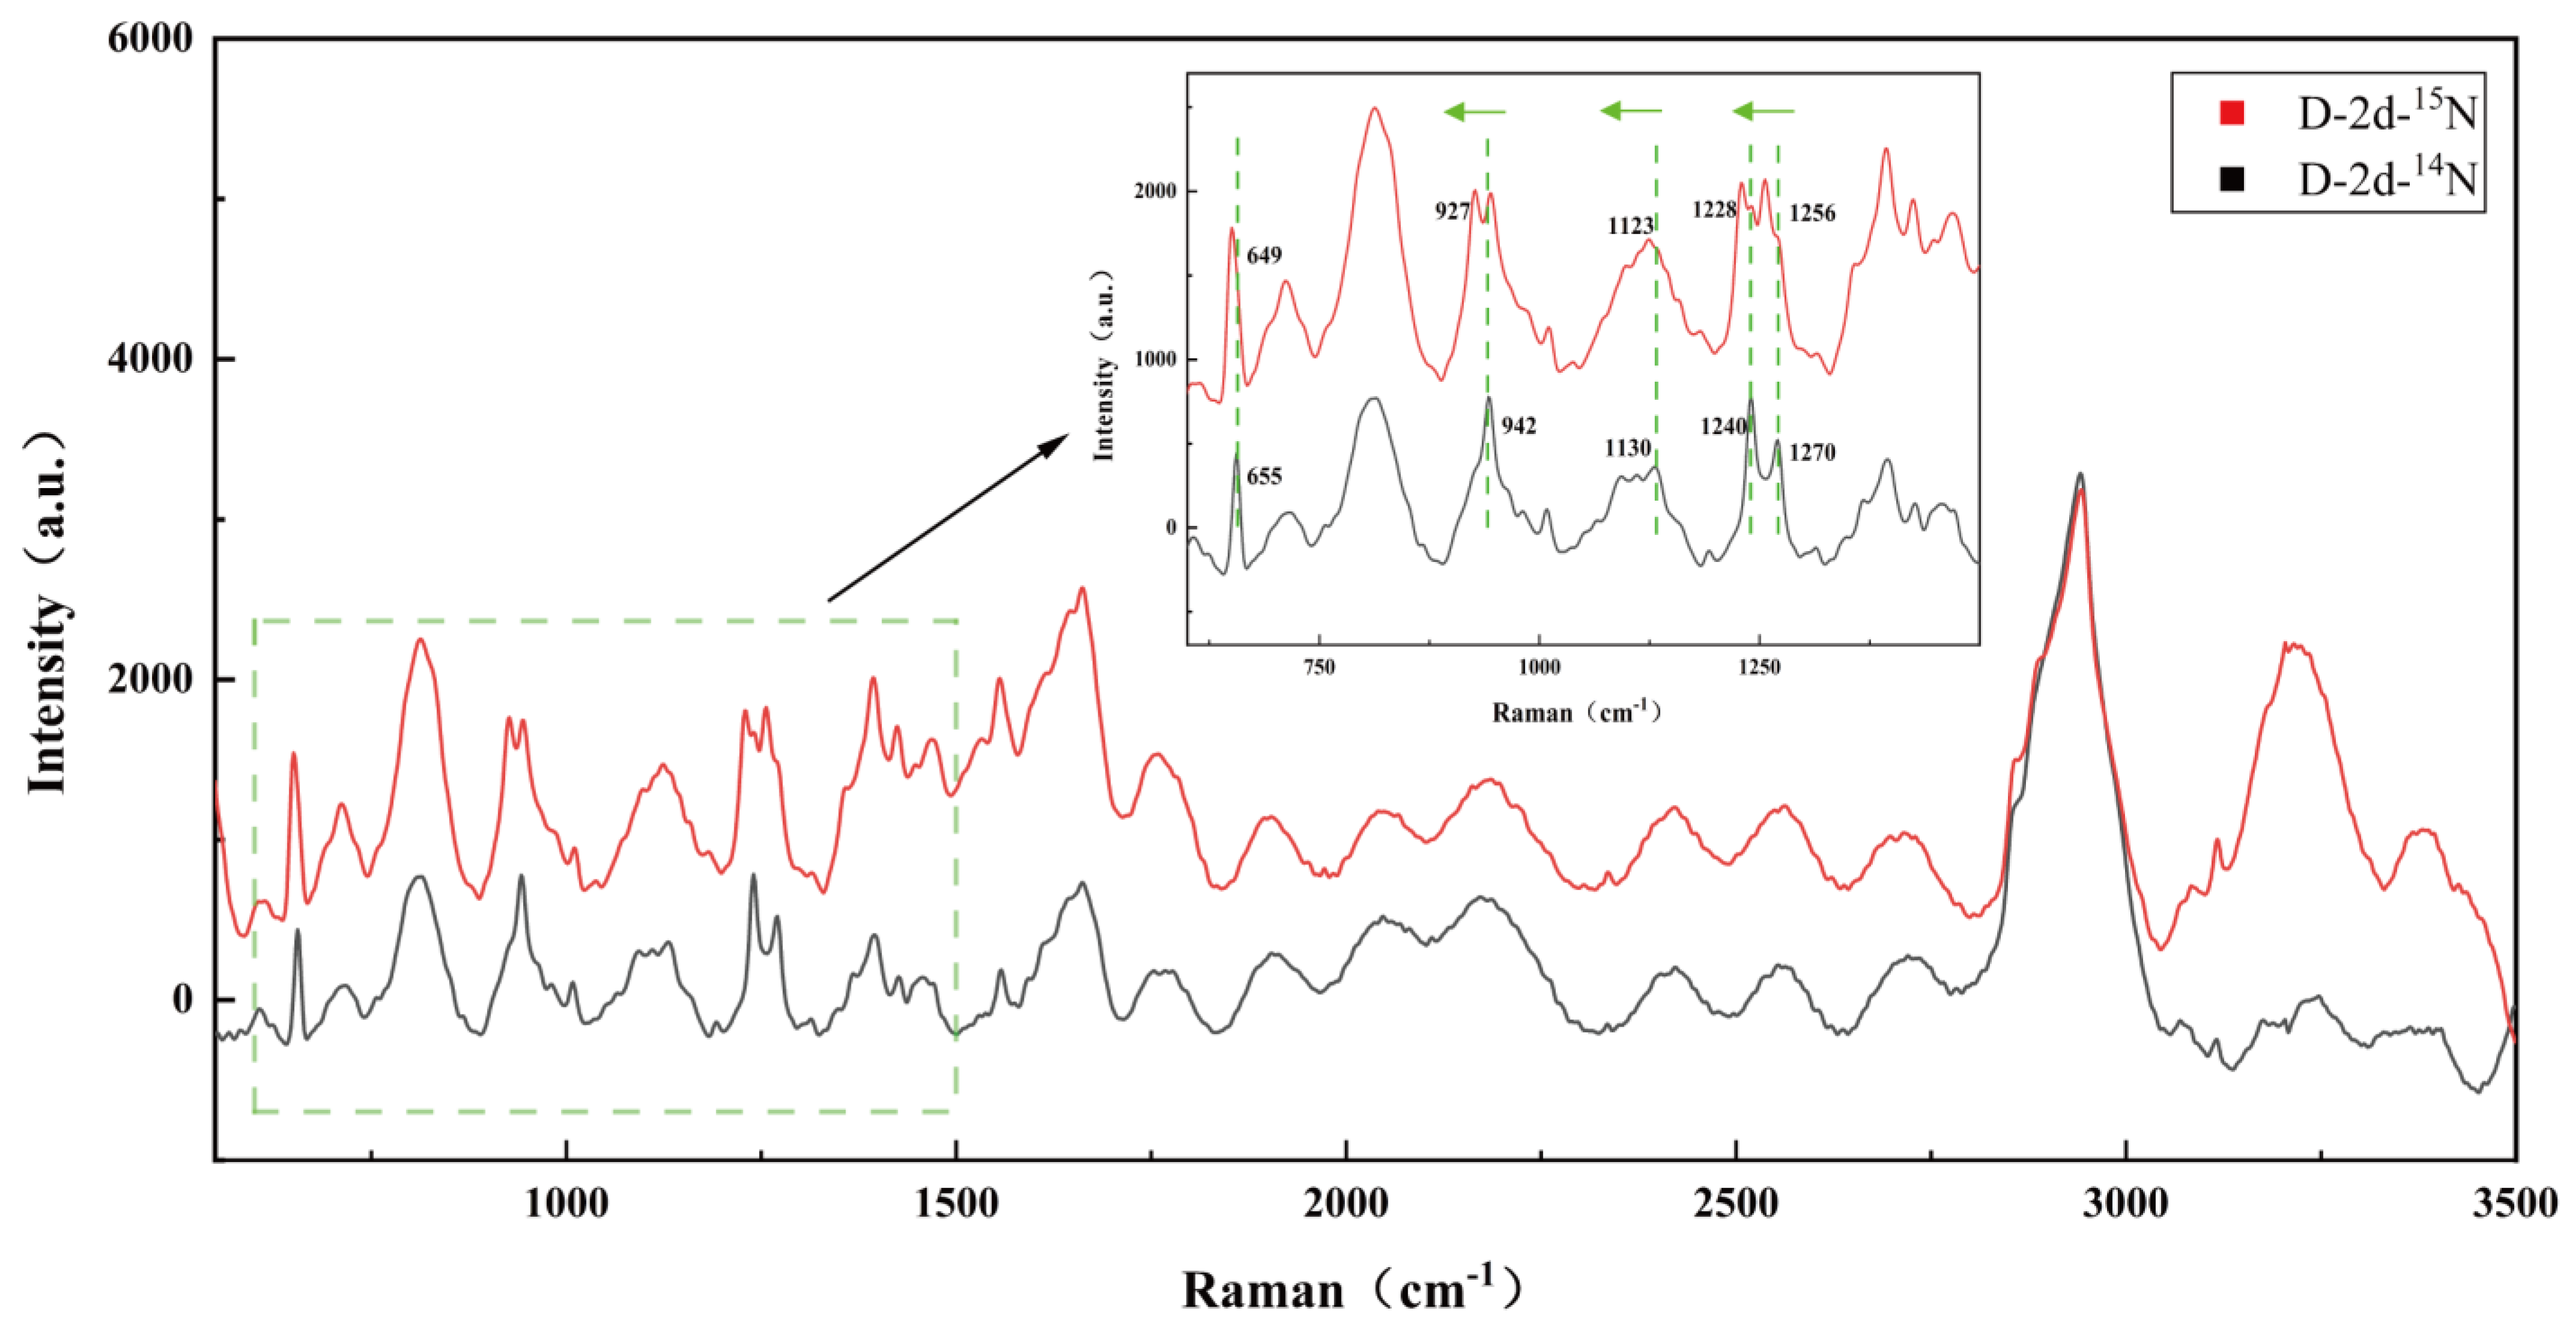
3.6. Dynamics of SCRS Characteristic Bands in Algal and Bacteria Co-Culture

Figure 5 shows all the shifted SCRS bands induced by 15N assimilation in the Symbiodiniaceae–bacterial co-culture. Among them, the 655 cm−1 band was assigned to guanine-related biomolecules, displaying a small shift of 7 cm−1. Guanine, containing four nitrogen atoms in its ring structure, contributed to the observed 15N-corresponding shift in the Raman spectra. The band at 1130 cm−1 (Cytochrome c) and 1270 cm−1 (lipids) were assigned to the C-N stretch and amide III random, exhibiting shifts of 7 cm−1 and 14 cm−1, respectively, and providing a potential goal to incorporate 15N-NH4Cl stable isotope into C-N. Cytochrome c (Cyt c) is a cytosolic encoded hemoglobin involved in photosynthetic electron transport. The heme b (Fe-protoporphyrin IX) is always attached to the Cyt c via a CX2CH motif, and the polar amino acid histidine is coordinated to the heme iron ion and two cysteines, with their sulfhydryl groups bound to heme by two thioether bonds. Both histidine and cysteine are polar amino acids distributed on the outer surface of the Cyt c, which is approximately spherical in shape [42]. Histidine contains three nitrogen atoms in its ring structure and one nitrogen atom in the side alkyl chain, and cysteine contains one nitrogen atom in the side alkyl chain. These characteristics explain the significant shift in the 1130 cm−1 band when 15N substitutes 14N in Cyt c in Figure 5. The shift of the SCRS from 1270 cm−1 to 1256 cm−1 in Raman spectra suggests that bacteria may be involved in the synthesis of unsaturated fatty acids during the growth of Durusdinium sp. A majority of cellular nitrogen was also found in protein-containing amide groups. The SCRS band from amide III of protein-related (1240 cm−1) displayed a large shift of 12 cm−1. The 942 cm−1 band was assigned to C-O stretching, C-O-C and the C-O-H deformation of starch. The shift from 942 cm−1 to 927 cm−1 suggests that 15N may be involved in material and energy transformations during photosynthetic respiration when it enters Symbiodiniaceae cells.
Surprisingly, protein-associated shifts were not observed in SCRS bands of 1008 and 1643 cm−1. The 1008 cm−1 band was assigned to the benzene ring breathing vibration of phenylalanine. Since the only nitrogen in phenylalanine is located on the side alkyl chain of the benzene ring, its effect on ring breathing vibration is likely to be minimal, explaining the lack of shifts. The SCRS band of 1643 cm−1 was assigned to the amide I vibration associated with the secondary protein structure of α-helix and β-sheet, and thus could be not sensitive enough to 15N substitution. Notably, 972 (C-C wagging), 1090 (C-O stretching) and 1446 cm−1 (CH2, CH3 bending), that were not involved in nitrogen metabolism, displayed no shifts with 15N substitution in biomass. Despite the limited sensitivity of the nitrogen-related bands following 15N assimilation, significant alterations in nucleotide bases and other molecules still hold the potential to enhance our comprehension of crucial biochemical processes. It is noteworthy that, from the above spectral analysis, the combination of isotope-labeling and single Raman spectroscopy, or 15N-stable isotope probing–single cell Raman spectroscopy (15N-SIP-SCRS), has demonstrated to be a powerful technique to visualize the isotope transformation process from the labeled substrate into intracellular substances of Ruegeria sp. MR31c, and subsequently into synthesized cytoskeletons of Durusdinium sp.

4. Discussion

The emerging evidence suggests that specific bacterial taxa and Symbiodiniaceae interactions may be crucial to uphold holobiont metabolic functioning [43,44]. However, the precise impact of bacteria on Symbiodiniaceae and their potential contribution of nitrogen-related substances to Symbiodiniaceae have remained elusive. Here, we found that the co-culture of Durusdinium sp. with native, potentially beneficial bacteria induced significant alterations in the photosynthetic system and pigment accumulation, which coincided with changes in cell color. Consequently, we conducted further investigations to determine whether the bacteria supply N-containing compounds to support Durusdinium sp. growth based on 15N-SIP-SCRS.
In our research, it was found that the most abundant and culturable core members of coral-associated bacterial communities were Ruegeria sp., followed by vibrio sp., and the genus of α-proteobacteria and γ-proteobacteria, respectively. Ruegeria sp. has surged in scientific attention lately, as its ubiquity under eutrophic conditions and its denitrification potential make this type of marine bacteria promising candidates for the use of probiotic applications to enhance coral health. However, our understanding of the functional role of Ruegeria sp. in the coral holobiont and its interaction with other holobiont members remains limited. Notably, the Vibrio species have been implicated in causing diseases in marine organisms, with Vibrio coralliilyticus identified as a pathogen responsible for coral bleaching and tissue lysis [45]. In recent studies, the relative abundance of Vibrio increased in coral colonies at higher temperatures, while the relative abundance of Ruegeria sp. decreased, indicating that the occurrence of coral disease might be linked to the decrease in Ruegeria sp. in abundance during sea surface temperature elevation [46]. Meanwhile, Ruegeria sp. was seen to play vital roles in marine ecosystems by supplying vitamin B12 to plankton and contributing to carbon and sulfur cycles [18]. Hence, Ruegeria sp., which belong to the Rosebacter clade, are not only potential probiotics for Symbiodiniaceae, but also integral members of coral symbiotic systems.
One of the predominant characteristics exhibited by many unicellular algae subjected to N-deprival is a reduction in photosynthetic activity [47]. This phenomenon is substantiated by the findings presented in Figure 6. During N limitation, decreased chlorophyll content and photosynthetic function in microalgae, which may be related to the decreased levels of transcripts and proteins associated with photosynthetic activity [48]. Additionally, N deficiency also typically results in ease of reproduction and accumulated photosynthate [49]. By contrast, co-culturing Symbiodiniaceae cells with bacterial solution exhibited minimal differences in PSII activity, Chl a level, and total carotenoids compared to nutrient-replete conditions, likely due to the bacterial conversion of atmospheric nitrogen into intracellular compounds, such as ammonium, for other organisms’ utilization (Figure 6) [43,44]. In fact, we found that the photosynthetic capacity and pigment accumulation during the mixed Symbiodiniaceae–bacterial culture were lower than in the N-sufficient L1 medium, implying some degree of limitation on algal growth. This limitation might be attributed to the turbidity caused by bacterial growth and the relatively high quantity of bacteria attached to the surface of the algal cells, resulting in a reduced light intensity of less than 60 μmol of photons m−2 s−1. On the other hand, changes in the bacteria metabolism presumably led to a reduced availability of N for the algae, resulting in a slower rate of algal cell growth.
Our study demonstrated the efficacy of combining Raman spectroscopy with 15N-stable isotope labeling (15N-SIP-SCRS) in tracing the labeled nitrogen source to be transported from one species to another. In more detail, 15N was infiltrated into bacterial cells in the culture medium to participate in the intracellular metabolic activities. The nitrogen source was then found in the macromolecules, such as carbohydrates, proteins and lipids, inside Symbiodiniaceae cells. 15N assimilation in cells induced a clear red shift in SCRS. Cui et al. probed the nitrogen assimilation by bacteria at single-cell level, which showed multiple distinguishable SCRS band shifts and displayed a linear relationship with 15N content. This shift was evident in multiple distinguishable SCRS band shifts, including bands at 824 and 958 cm−1, which were assigned to tyrosine (plane ring breathing) and proline (C-N stretching), suggesting that 15N was incorporated into bacterial intracellular amino acid synthesis. Tyrosine is a commercially important compound, as it is widely used in food, chemical, pharmaceutical and cosmetic industries [50]. In bacteria, tyrosine is usually the end product of its biosynthetic pathway [51]. Proline is a natural penetrant and antioxidant, affecting numerous metabolic processes in organisms, such as signaling, stress protection and energy production [52]. Proline metabolism associated with the TCA cycle impact NADP+/NADPH levels, thereby driving the pentose phosphate pathway and promoting nucleotide synthesis and cell division [53]. Amino acids like tyrosine and proline serve as the fundamental building blocks of biological macromolecules, which makes it easy to explain that the band at 1240 cm−1 attributed to the protein has shifted by 12 cm−1. Moreover, the band at 1375 cm−1 was assigned to nucleotide bases (thymine, adenine, guanine), exhibiting a shift of 11 cm−1, which can be attributed to the unique molecular structure of the bases. It has been reported that adenine, in particular, has a greater potential to induce larger shifts in the Raman spectrum compared to guanine and cytosine, which could be involved in adenine moiety for the production of co-enzymes or co-factors (e.g., ATP, NAD, NADP and FAD) in cells. They are thus involved in a variety of anabolic reactions (e.g., tricarboxylic acid cycle and Calvin cycle). Therefore, 15N may have more opportunities to be doped into adenine-containing molecules [42].
Our research provides insights into the crucial role of bacterial contributions in supplying nitrogenous compounds to Durusdinium sp. in the Symbiodiniaceae loop, which are integral for the synthesis of essential nutrients within the cellular structures of microalgae. Nitrogen metabolism in microalgae is of critical importance for their growth [54]. In environments where an adequate inorganic nitrogen source is available, inorganic salts traverse the cytosol via transporter proteins and undergo reduction to ammonium salts through the action of reductase enzymes. Subsequently, glutamine is synthesized, participating in amino acid metabolism. In addition to inorganic salts, microalgae can also utilize organic nitrogen sources such as urea, purines, and some amino acids [55,56]. In our study, the band from 655 cm−1 to 649 cm−1 was assigned to the ring breathing of guanine-related biomolecules, indicating that the purines produced by bacterial metabolism were utilized by Durusdinium sp. Meanwhile, the bands at 942 cm−1 and 1270 cm−1 were assigned to C-O/C-O-C/C-O-H stretching and Amide III random vibrations, respectively, related to starch and lipids. Microalgae demonstrate exceptional efficiency in converting solar energy and carbon dioxide into intracellular energy-dense macromolecules, which mainly includes carbohydrates, proteins and lipids [57,58]. Starch and lipid synthesis in microalgae occurs concomitantly, utilizing carbon precursors produced during the Calvin cycle. This intricate process necessitates the involvement of coenzymes and cofactors [59]. The shifts observed in the peaks associated with starch and lipids may be attributed to the synthesis of co-enzymes implicated in the TCA cycle following the assimilation of purines into the cells. In addition, the intensity of the C-N stretching band at 1130 cm−1 decreased, and the corresponding 15N-substituted band emerges at 1123 cm−1. Similarly, the protein band at 1240 cm−1 disappeared, while a new band appeared at 1228 cm−1. Cyt c is also a cytosolic encoded hemoglobin involved in photosynthetic electron transport. The protein is bound to the heme group via amino acid, and the distortion of the heme group by the surrounding protein leads to characteristic spectra. We hypothesize that the red shift of the two bands on proteins is due to the protein synthesis using the amino acids transported from the symbiotic bacteria. Most dinoflagellates are difficult to grow in pure cultures without associated bacteria, exemplified by Pfisteria, which was unable to grow or even perished in a sterile medium, while the addition of the symbiotic bacterium α-proteobacteria strain restored its normal growth [60]. This phenomenon suggests that the bacteria present in dinoflagellate cultures provide the necessary components for the successful growth of dinoflagellates outside the coral host. Furthermore, corals acquire bacteria during early developmental stages, preferentially uptake members of the Roseobacter clade, demonstrating that bacteria may play a role in the early stages of coral development and coral colonization [61]. The characterization of Symbiodinium species from different oceans showed that Roseobacter branch is closely related to the Symbiodinium clade, being detected in clade A–F [62]. Additionally, Symbiodiniaceae displayed selective associations with specific microbiota. In cases such as Chlorella and Scenedesmus, the bacteria with the most active transcription of key genes associated with plant–microbe interactions belong to the phylum of α-proteobacteria [63].

5. Conclusions

In this study, we investigated interactions between Symbiodiniaceae and beneficial bacteria, with the hypothesis that there exists an inner symbiotic loop of Symbiodiniaceae and bacteria within the coral symbiotic loop, and the metabolic exchanges among them facilitate the essential nutritional interplay required for the Symbiodiniaceae cellular growth and proliferation.
The nitrogen-fixing bacterium strain Ruegeria sp. and the Symbiodiniaceae strain Durusdinium sp. were selected to study how the beneficial bacterium enables Symbiodiniaceae to thrive in a nitrogen-deficient environment. Our findings validated the hypothesis and substantiated the significant role of potentially beneficial bacteria in fostering the growth of Symbiodiniaceae within isolated cultures. Moreover, it underscores the capacity of bacteria to supply inorganic nitrogen sources in vitro, thereby supplying nitrogen-containing compounds to Symbiodiniaceae and actively participating in the nitrogen cycle.
Our research results indicated that 15N-SIP-SCRS is a novel method for revealing the dynamic features of the inter-cellular transport of nutrients, based on the combination of the labeling of the nitrogen source by 15N-SIP and the identification of intracellular biomolecules present in individual cells by Raman spectroscopy. The technique enabled the uptake of the labeled nitrogen source by the beneficial bacterium to be traced, and eventually the labeled substrates were integrated into the intracellular components of Symbiodiniaceae cells. It thus supported our assumption that metabolites function as a nutritional currency for the symbiotic systems.
We believe that beneficial reciprocity needs to be shown within the coral holobiont, and further research endeavors should aim to employ labeling techniques for symbiotic bacteria, Symbiodiniaceae and coral, to demonstrate the multi-directional benefits of their symbiosis. In the interim, we are quantifying key cellular metabolites to facilitate non-destructive, unlabeled metabolic flow studies. Future investigations into coral–Symbiodiniaceae–bacteria interactions are needed for a comprehensive understanding of the intricate coral reefs.

Supplementary Materials

The following supporting information can be downloaded at: https://www.mdpi.com/article/10.3390/microorganisms12061217/s1, Figure S1: Excerpt of the music notes of the sonata for two pianos in D major, K.448 for the music treatment group (a). The illustration of white noise signals and histogram of white noise following a gaussian distribution for the white noise treatment group (b); Table S1: Relevant information of primers used in Quantitative real-time PCR.

Author Contributions

Conceptualization, P.F. and Y.L.; methodology, Y.H.; software, Y.L.; validation, H.W. and P.F.; formal analysis, Y.S.; investigation, Y.L.; resources, P.F.; data curation, Y.H.; writing—original draft preparation, Y.L.; writing—review and editing, P.F.; visualization, Y.L.; supervision, P.F.; project administration, P.F.; funding acquisition, P.F. All authors have read and agreed to the published version of the manuscript.

Funding

This research was funded by Research Start-Up Funds from Hainan University in China, grant number KYQD_ZR2017212, and Finance Science and Technology project of Hainan Province, grant number ZDYF2019031.

Data Availability Statement

The sequencing data of this study have been uploaded on 15 September 2023 to the Genome Sequence Archive in BIG Data Center (https://ngdc.cncb.ac.cn/?lang=en), Beijing Institute of Genomics (BIG), Chinese Academy of Sciences, with the accession number: PRJCA018758.

Acknowledgments

The authors are thankful to the financial support by Research Start-Up Funds from Hainan University in China (KYQD_ZR2017212).

Conflicts of Interest

The authors declare no conflicts of interest.

References

  1. Field, C.B.; Behrenfeld, M.J.; Randerson, J.T.; Falkowski, P. Primary production of the biosphere: Integrating terrestrial and oceanic components. Science 1998, 281, 237–240. [Google Scholar] [CrossRef]
  2. Karl, D.M.; Hebel, D.V.; Björkman, K.; Letelier, R.M. The role of dissolved organic matter release in the productivity of the oligotrophic North Pacific Ocean. Limnol. Oceanogr. 2003, 43, 1270–1286. [Google Scholar] [CrossRef]
  3. Mague, T.H.; Friberg, E.; Hughes, D.J.; Morris, I. Extracellular Release of Carbon by Marine Phytoplankton: A Physiological Approach. Limnol. Oceanogr. 1980, 25, 262–279. [Google Scholar] [CrossRef]
  4. Hellebust, J.A. Excretion of some organic compounds by marine phytoplankton. Limnol. Oceanogr. 1965, 10, 192–206. [Google Scholar] [CrossRef]
  5. Gascuel, D.; Bozec, Y.M.; Chassot, E.; Colomb, A.; Laurans, M. The trophic spectrum: Theory and application as an ecosystem indicator. ICES J. Mar. Sci. 2005, 62, 443–452. [Google Scholar] [CrossRef]
  6. Hoegh-Guldberg, O.; Mumby, P.J.; Hooten, A.J.; Steneck, R.S.; Greenfield, P.; Gomez, E.; Harvell, C.D.; Sale, P.F.; Edwards, A.J.; Caldeira, K.; et al. Coral Reefs Under Rapid Climate Change and Ocean Acidification. Science 2007, 318, 1737–1742. [Google Scholar] [CrossRef]
  7. Hughes, T.; Baird, A.H.; Bellwood, D.R.; Card, M.; Connolly, S.R.; Folke, C.; Grosberg, R.; Hoegh-Guldberg, O.; Jackson, J.B.C.; Kleypas, J.; et al. Climate change, human impact, and the resilience of coral reefs. Science 2003, 301, 929–933. [Google Scholar] [CrossRef]
  8. Haine, E.R. Symbiont-mediated protection. Proc. R. Soc. B Biol. Sci. 2008, 275, 353–361. [Google Scholar] [CrossRef]
  9. Kushmaro, A.; Loya, Y.; Fine, M.; Rosenberg, E. Bacterial infection and coral bleaching. Nature 1996, 380, 396. [Google Scholar] [CrossRef]
  10. Barott, K.L.; Rodriguez-Brito, B.; Janouškovec, J.; Marhaver, K.L.; Smith, J.E.; Keeling, P.; Rohwer, F.L. Microbial diversity associated with four functional groups of benthic reef algae and the reef-building coral Montastraea annularis. Environ Microbiol. 2011, 13, 1192–1204. [Google Scholar] [CrossRef]
  11. Reshef, L.; Koren, O.; Loya, Y.; Zilber-Rosenberg, I.; Rosenberg, E. The coral probiotic hypothesis. Environ. Microbiol. 2006, 8, 2068–2073. [Google Scholar] [CrossRef]
  12. Barott, K.L.; Rodriguez-Mueller, B.; Youle, M.; Marhaver, K.L.; Vermeij, M.J.; Smith, J.E.; Rohwer, F.L. Microbial to reef scale interactions between the reef-building coral Montastraea annularis and benthic algae. Proc. R. Soc. B Biol. Sci. 2011, 279, 1655–1664. [Google Scholar] [CrossRef]
  13. Kuhl, M.; Cohen, Y.; Dalsgaard, T.; Jørgensen, B.B.; Revsbech, N.P. Microenvironment and photosynthesis of zooxanthellae in scleractinian corals studied with microsensors for O2, pH and light. Mar. Ecol. Prog. Ser. 1995, 117, 159–172. [Google Scholar] [CrossRef]
  14. Muscatine, L.; McCloskey, L.R.; Marian, R.E. Marian, and Oceanography, Estimating the daily contribution of carbon from zooxanthellae to coral animal respiration 1. Limnol. Oceanogr. 1981, 26, 601–611. [Google Scholar] [CrossRef]
  15. Fine, M.; Loya, Y. Endolithic algae: An alternative source of photoassimilates during coral bleaching. Proc. R. Soc. B Biol. Sci. 2002, 269, 1205–1210. [Google Scholar] [CrossRef]
  16. Lema, K.A.; Willis, B.L.; Bourne, D.G. Corals Form Characteristic Associations with Symbiotic Nitrogen-Fixing Bacteria. Appl. Environ. Microbiol. 2012, 78, 3136–3144. [Google Scholar] [CrossRef]
  17. Mouchka, M.E.; Hewson, I.; Harvell, C.D. Coral-Associated Bacterial Assemblages: Current Knowledge and the Potential for Climate-Driven Impacts. Integr. Comp. Biol. 2010, 50, 662. [Google Scholar] [CrossRef]
  18. Amin, S.A.; Hmelo, L.R.; van Tol, H.M.; Durham, B.P.; Carlson, L.T.; Heal, K.R.; Morales, R.L.; Berthiaume, C.T.; Parker, M.S.; Djunaedi, B.; et al. Interaction and signalling between a cosmopolitan phytoplankton and associated bacteria. Nature 2015, 522, 98–101. [Google Scholar] [CrossRef]
  19. de-Bashan, L.E.; Mayali, X.; Bebout, B.M.; Weber, P.K.; Detweiler, A.M.; Hernandez, J.-P.; Prufert-Bebout, L.; Bashan, Y. Establishment of stable synthetic mutualism without co-evolution between microalgae and bacteria demonstrated by mutual transfer of metabolites (NanoSIMS isotopic imaging) and persistent physical association (Fluorescent in situ hybridization). Algal Res. 2016, 15, 179–186. [Google Scholar] [CrossRef]
  20. Jarvis, R.M.; Goodacre, R. Goodacre, Discrimination of Bacterial Using Surface-Enhanced Raman Spectroscopy. Anal. Chem. 2004, 76, 40–47. [Google Scholar] [CrossRef] [PubMed]
  21. Wang, Y.; Song, Y.; Tao, Y.; Muhamadali, H.; Goodacre, R.; Zhou, N.-Y.; Preston, G.M.; Xu, J.; Huang, W.E. Reverse and Multiple Stable Isotope Probing to Study Bacterial Metabolism and Interactions at the Single Cell Level. Anal. Chem. 2016, 88, 9443–9450. [Google Scholar] [CrossRef] [PubMed]
  22. Wei, F.; Zhang, D.; Halas, N.J.; Hartgerink, J.D. Aromatic Amino Acids Providing Characteristic Motifs in the Raman and SERS Spectroscopy of Peptides. J. Phys. Chem. B 2008, 112, 9158–9164. [Google Scholar] [CrossRef] [PubMed]
  23. Huang, W.E.; Bailey, M.J.; Thompson, I.P.; Whiteley, A.S.; Spiers, A.J. Single-Cell Raman Spectral Profiles of Pseudomonas fluorescens SBW25 Reflects in vitro and in planta Metabolic History. Microb. Ecol. 2007, 53, 414–425. [Google Scholar] [CrossRef] [PubMed]
  24. Rösch, P.; Harz, M.; Schmitt, M.; Peschke, K.-D.; Ronneberger, O.; Burkhardt, H.; Motzkus, H.-W.; Lankers, M.; Hofer, S.; Thiele, H.; et al. Chemotaxonomic Identification of Single Bacteria by Micro-Raman Spectroscopy: Application to Clean-Room-Relevant Biological Contaminations. Appl. Environ. Microbiol. 2005, 71, 1626–1637. [Google Scholar] [CrossRef] [PubMed]
  25. Pätzold, R.; Keuntje, M.; Theophile, K.; Müller, J.; Mielcarek, E.; Ngezahayo, A.; Anders-von Ahlften, A. In situ mapping of nitrifiers and anammox bacteria in microbial aggregates by means of confocal resonance Raman microscopy. J. Microbiol. Methods 2008, 72, 241–248. [Google Scholar] [CrossRef] [PubMed]
  26. Hatzenpichler, R.; Krukenberg, V.; Spietz, R.L.; Jay, Z.J. Next-generation physiology approaches to study microbiome function at single cell level. Nat. Rev. Microbiol. 2020, 18, 241–256. [Google Scholar] [CrossRef] [PubMed]
  27. Azemtsop Matanfack, G.; Pistiki, A.; Rösch, P.; Popp, J. Raman 18O-labeling of bacteria in visible and deep UV-ranges. J. Biophotonics 2021, 14, e202100013. [Google Scholar] [CrossRef] [PubMed]
  28. Jing, X.; Gong, Y.; Xu, T.; Davison, P.A.; MacGregor-Chatwin, C.; Hunter, C.N.; Xu, L.; Meng, Y.; Ji, Y.; Ma, B.; et al. Revealing CO2-Fixing SAR11 Bacteria in the Ocean by Raman-Based Single-Cell Metabolic Profiling and Genomics. BioDesign Res. 2022, 2022, 9782712. [Google Scholar] [CrossRef] [PubMed]
  29. Liu, M.; Zhu, P.; Zhang, L.; Gong, Y.; Wang, C.; Sun, L.; Wang, L.; Chen, R.; Mao, Y.; Fu, X.; et al. Single-Cell Identification, Drug Susceptibility Test, and Whole-genome Sequencing of Helicobacter pylori Directly from Gastric Biopsy by Clinical Antimicrobial Susceptibility Test Ramanometry. Clin. Chem. 2022, 68, 1064–1074. [Google Scholar] [CrossRef]
  30. Dana, J.D.; Wilkes, C. Structure and Classification Of Zoophytes, United States Exploring Expedition 1838–1842. Available online: https://www.biodiversitylibrary.org/bibliography/4789 (accessed on 30 May 2024).
  31. Veron, J.E.N. Corals of Australia and the Indo-Pacific. Environmental Science, Biology, Geology. 1993. Available online: https://www.semanticscholar.org/paper/Corals-of-Australia-and-the-Indo-Pacific-Veron/f236d971121dfa985122da86342eb5cae0421e89 (accessed on 30 May 2024).
  32. Guillard, R. Culture of phytoplankton for feeding marine invertebrates. In Culture of Marine Invertebrate Animals; Smith, W.L., Chanley, M.H., Eds.; Springer: Boston, MA, USA, 1975. [Google Scholar]
  33. Peixoto, R.S.; Rosado, P.M.; Leite DC, D.A.; Rosado, A.S.; Bourne, D.G. Beneficial Microorganisms for Corals (BMC): Proposed Mechanisms for Coral Health and Resilience. Front. Microbiol. 2017, 8, 236713. [Google Scholar] [CrossRef]
  34. Wiedenmann, J.; D’Angelo, C.; Smith, E.G.; Hunt, A.N.; Legiret, F.E.; Postle, A.D.; Achterberg, E.P. Nutrient enrichment can increase the susceptibility of reef corals to bleaching. Nat. Clim. Change 2013, 3, 160–164. [Google Scholar] [CrossRef]
  35. Muscatine, L.; Ferrier-Pages, C.; Blackburn, A.; Gates, R.D.; Baghdasarian, G.; Allemand, D. Cell-specific density of symbiotic dinoflagellates in tropical anthozoans. Coral Reefs 1998, 17, 329–337. [Google Scholar] [CrossRef]
  36. He, Y.; Zhang, P.; Huang, S.; Wang, T.; Ji, Y.; Xu, J. Label-free, simultaneous quantification of starch, protein and triacylglycerol in single microalgal cells. Biotechnol. Biofuels 2017, 10, 275. [Google Scholar] [CrossRef]
  37. Huang, W.E.; Griffiths, R.I.; Thompson, I.P.; Bailey, M.J.; Whiteley, A.S. Raman microscopic analysis of single microbial cells. Anal. Chem. 2004, 76, 4452–4458. [Google Scholar] [CrossRef]
  38. Huang, W.E.; Ward, A.D.; Whiteley, A.S. Raman tweezers sorting of single microbial cells. Environ. Microbiol. Rep. 2009, 1, 44–49. [Google Scholar] [CrossRef]
  39. Cui, L.; Yang, K.; Li, H.-Z.; Zhang, H.; Su, J.-Q.; Paraskevaidi, M.; Martin, F.L.; Ren, B.; Zhu, Y.-G. Functional Single-Cell Approach to Probing Nitrogen-Fixing Bacteria in Soil Communities by Resonance Raman Spectroscopy with 15N2 Labeling. Anal. Chem. 2018, 90, 5082–5089. [Google Scholar] [CrossRef] [PubMed]
  40. Mary, Y.S.; Ushakumari, L.; Harikumar, B.; Varghese, H.T.; Panicker, C.Y. FT-IR, FT-raman and SERS spectra of L-proline. J. Iran. Chem. Soc. 2009, 6, 138–144. [Google Scholar] [CrossRef]
  41. Thomas, G.J.; Prescott, B.; Olins, D.E. Secondary Structure of Histones and DNA in Chromatin. Science 1977, 197, 385–388. [Google Scholar] [CrossRef]
  42. Cui, L.; Yang, K.; Zhou, G.; Huang, W.E.; Zhu, Y.G. Surface-Enhanced Raman Spectroscopy Combined with Stable Isotope Probing to Monitor Nitrogen Assimilation at Both Bulk and Single-Cell Level. Anal. Chem. 2017, 89, 5793–5800. [Google Scholar] [CrossRef]
  43. Lesser, M.P.; Mazel, C.H.; Gorbunov, M.Y.; Falkowski, P.G. Discovery of Symbiotic Nitrogen-Fixing Cyanobacteria in Corals. Science 2004, 305, 997–1000. [Google Scholar] [CrossRef]
  44. Lesser, M.P.; Falcón, L.I.; Rodríguez-Román, A.; Enríquez, S.; Hoegh-Guldberg, O.; Iglesias-Prieto, R. Nitrogen fixation by symbiotic cyanobacteria provides a source of nitrogen for the scleractinian coral Montastraea cavernosa. Mar. Ecol. Prog. Ser. 2007, 346, 143–152. [Google Scholar] [CrossRef]
  45. Paillard, C.; Le Roux, F.; Borrego, J.J. Bacterial disease in marine bivalves, a review of recent studies: Trends and evolution. Aquat. Living Resour. 2004, 17, 477–498. [Google Scholar] [CrossRef]
  46. Miura, N.; Motone, K.; Takagi, T.; Aburaya, S.; Watanabe, S.; Aoki, W.; Ueda, M. Ruegeria sp. Strains Isolated from the Reef-Building Coral Galaxea fascicularis Inhibit Growth of the Temperature-Dependent Pathogen Vibrio coralliilyticus. Mar. Biotechnol. 2019, 21, 1–8. [Google Scholar]
  47. Rees TA, V. Are Symbiotic Algae Nutrient Deficient? Proc. R. Soc. Lond. Ser. B Biol. Sci. 1991, 243, 227–233. [Google Scholar]
  48. Schmollinger, S.; Mühlhaus, T.; Boyle, N.R.; Blaby, I.K.; Casero, D.; Mettler, T.; Moseley, J.L.; Kropat, J.; Sommer, F.; Strenkert, D.; et al. Nitrogen-Sparing Mechanisms in Chlamydomonas Affect the Transcriptome, the Proteome, and Photosynthetic Metabolism. Plant Cell 2014, 26, 1410–1435. [Google Scholar] [CrossRef] [PubMed]
  49. Bottrill, D.E.; Possingham, J.V.; Kriedemann, P.E. The effect of nutrient deficiencies on phosynthesis and respiration in spinach. Plant Soil 1970, 32, 424–438. [Google Scholar] [CrossRef]
  50. Bongaerts, J.; Krämer, M.; Müller, U.; Raeven, L.; Wubbolts, M. Metabolic Engineering for Microbial Production of Aromatic Amino Acids and Derived Compounds. Metab. Eng. 2001, 3, 289–300. [Google Scholar] [CrossRef] [PubMed]
  51. Gosset, G. Production of aromatic compounds in bacteria. Curr. Opin. Biotechnol. 2009, 20, 651–658. [Google Scholar] [CrossRef]
  52. Saibi, W.; Feki, K.; Yacoubi, I.; Brini, F. Bridging Between Proline Structure, Functions, Metabolism, and Involvement in Organism Physiology. Appl. Biochem. Biotechnol. 2015, 176, 2107–2119. [Google Scholar] [CrossRef]
  53. Liu, W.; Hancock, C.N.; Fischer, J.W.; Harman, M.; Phang, J.M. Proline biosynthesis augments tumor cell growth and aerobic glycolysis: Involvement of pyridine nucleotides. Sci. Rep. 2015, 5, 17206. [Google Scholar] [CrossRef]
  54. Brennan, L.; Owende, P. Biofuels from microalgae—A review of technologies for production, processing, and extractions of biofuels and co-products. Renew. Sustain. Energy Rev. 2010, 14, 557–577. [Google Scholar] [CrossRef]
  55. Philips, S.; Laanbroek, H.J.; Verstraete, W. Origin, causes and effects of increased nitrite concentrations in aquatic environments. Rev. Environ. Sci. Biotechnol. 2002, 1, 115–141. [Google Scholar] [CrossRef]
  56. Williams, S.K.; Hodson, R.C. Transport of urea at low concentrations in Chlamydomonas reinhardi. J. Bacteriol. 1977, 130, 266–273. [Google Scholar] [CrossRef] [PubMed]
  57. Wijffels, R.H.; Barbosa, M.J. An Outlook on Microalgal Biofuels. Science 2010, 329, 796–799. [Google Scholar] [CrossRef] [PubMed]
  58. Mussatto, S.I.; Dragone, G.; Guimarães, P.M.R.; Silva, J.P.A.; Carneiro, L.M.; Roberto, I.C.; Vicente, A.; Domingues, L.; Teixeira, J.A. Technological trends, global market, and challenges of bio-ethanol production. Biotechnol. Adv. 2010, 28, 817–830. [Google Scholar] [CrossRef] [PubMed]
  59. Breuer, G.; de Jaeger, L.; Artus, V.G.; Martens, D.E.; Springer, J.; Draaisma, R.B.; Eggink, G.; Wijffels, R.H. Superior triacylglycerol (TAG) accumulation in starchless mutants of Scenedesmus obliquus: (II) evaluation of TAG yield and productivity in controlled photobioreactors. Biotechnol. Biofuels 2014, 7, 70. [Google Scholar] [CrossRef] [PubMed]
  60. Dixon, G.K.; Syrett, P.J. The growth of dinoflagellates in laboratory cultures. New Phytol. 1988, 109, 297–302. [Google Scholar] [CrossRef]
  61. Apprill, A.; Marlow, H.Q.; Martindale, M.Q.; Rappé, M.S. The onset of microbial associations in the coral Pocillopora meandrina. ISME J. 2009, 3, 685–699. [Google Scholar] [CrossRef] [PubMed]
  62. Alavi, M.; Alavi, M.; Miller, T.; Erlandson, K.; Schneider, R.; Belas, R. Bacterial community associated with Pfiesteria-like dinoflagellate cultures. Environ. Microbiol. 2001, 3, 380–396. [Google Scholar] [CrossRef]
  63. Krohn-Molt, I.; Alawi, M.; Förstner, K.U.; Wiegandt, A.; Burkhardt, L.; Indenbirken, D.; Thieß, M.; Grundhoff, A.; Kehr, J.; Tholey, A.; et al. Insights into Microalga and Bacteria Interactions of Selected Phycosphere Biofilms Using Metagenomic, Transcriptomic, and Proteomic Approaches. Front. Microbiol. 2017, 8, 1941. [Google Scholar] [CrossRef]
Figure 1. Photosynthetic function of Durusdinium sp. cells growing in flask. (A) chlorophyll a levels and total carotenoids for Durusdinium sp. cell density vs. Ruegeria sp. MR31c concentrations. (B) Maximum PS II efficiency Fv/Fm, for Durusdinium sp. Cell density vs. Ruegeria sp. MR31c concentrations. (C) Mixed culture solution with Ruegeria sp. MR31c concentrations. (D) Probiotic Ruegeria sp. MR31c cell culture. Means ± SDs for three independent trials are shown with the p-values (t-test) for the probabilities that the differences are significant. (ns, p > 0.05; ** p < 0.01; *** p < 0.001; **** p < 0.0001).
Microorganisms 12 01217 g001
Figure 2. Raman spectra of Durusdinium sp. with 100× objective imaging.
Microorganisms 12 01217 g002
Figure 3. Raman spectrum of individual of Ruegeria sp. MR31c cell, with 100× objective imaging.
Microorganisms 12 01217 g003
Figure 4. “red-shift” of SCRS by the comparison of 15N- (red or light line) and 14N- (black or dark line) SCRS with the bacterium Ruegeria sp. MR31c grown in L1, in which the 15N labeled NH4Cl was the sole nitrogen source. The arrow indicates the dynamic change of the "red shift" of the Ruegeria sp. resonance Raman signal.
Microorganisms 12 01217 g004
Figure 5. “red-shift” of SCRS by the comparison of 15N- (red or light line) and 14N- (black or dark line) SCRS with Durusdinium sp. single cell from the mixture culture of Symbiodiniaceae with Ruegeria sp. MR31c in fresh L1 medium. The arrow indicates the dynamic change of the "red shift" of the Durusdinium sp. resonance Raman signal.
Microorganisms 12 01217 g005
Figure 6. Photosynthetic function in Durusdinium sp. cells growing in different conditions. (ac) Fv/Fm, chlorophyll a levels and total carotenoids were determined for Durusdinium sp. cells at steady state in N-deplete culture, N-replete culture, as well as for bacterial N-replete cultures, as described in Materials and Methods. Means ± SDs for three independent trials are shown with the p-values (t-test) for the probabilities that the differences observed are significant. (* p < 0.05; *** p < 0.001; **** p < 0.0001).
Microorganisms 12 01217 g006
Table 1. 41 culturable symbiotic microbial strains isolated from coral reefs.
GenusNo.NameGenbank Accession NumberMediumAffiliated Coral TypesIdentity
VibrioJW-1Vibrio owensiiCP045859.1LB; L1A. hyacinthus(1412/1412) 100%
JW-2Vibrio vulnificusMN860081.1LBA. hyacinthus(1448/1448) 100%
JW-3Vibrio coralliilyticusCP031472.1LBA. hyacinthus(1394/1408) 99%
JW-4Vibrio sp. Strain JC009CP092106.1L1A. hyacinthus(1452/1452) 100%
JW-5Vibrio alginolyticusCP054700.1MA2216EG. fascicularis(1389/1390) 99.9%
JW-6Vibrio rotiferianusAP019798.1MA2216EG. fascicularis(1415/1416) 99.9%
RuegeriaJW-7Ruegeria conchaeCP031472.1MA2216EA. hyacinthus(1358/1358) 100%
JW-8Ruegeria sp. MR31cHQ439523.1MA2216EA. hyacinthus(1334/1348) 99%
JW-9Ruegeria sp. atlanticaMW828512.1MA2216EA. hyacinthus(1308/1308) 100
JW-10Ruegeria sp. LR4KU560503.1MA2216EA. hyacinthus(1341/1354) 99%
JW-11Ruegeria sp. strain MP15.1OQ435566.1MA2216EA. hyacinthus; G. fascicularis(1317/1330) 99%
JW-12Ruegeria arenilitorisMG896151.1MA2216EG. fascicularis(1309/1322) 99%
JW-13Ruegeria lacuscaerulensisMH283799.1L1G. fascicularis(1432/1446) 99%
BacillusJW-14Bacillus horikoshiiDQ289065.1MA2216EG. fascicularis(1434/1448) 99%
JW-15Bacillus weihaiensisCP016020.1MA2216EG. fascicularis(1434/1434) 100%
JW-16Bacillus coahuilensisEF014447.1MA2216EG. fascicularis(1449/1449) 100%
ThalassotaleaJW-17Thalassotalea euphylliaeMW828496.1L1A. hyacinthus; G. fascicularis(1379/1392) 99%
JW-18Thalassomonas loyanaHQ439553.1MA2216EG. fascicularis(1408/1422) 99%
JW-19Thalassomonas agarivoransHQ439504.1MA2216EG. fascicularis(14111425) 99%
ThalassospiraJW-20Thalassospira sp. 2ta1FJ952805.1MA2216EA. hyacinthus(1361/1374) 99%
MicrobulbiferJW-21Microbulbifer sp. Alg-AMLN-14-8MK453424.1MA2216EA. hyacinthus(1406/1406) 100%
PhaeobacterJW-22Phaeobacter sp. strain 088MK801649.1MA2216EA. hyacinthus(1333/1333) 100%
AlteromonasJW-23Alteromonas aestuariivivensNR157790.1L1A. hyacinthus(1457/1517) 96%
JW-24Alteromonas macleodiiOX359243.1L1; CDAA. hyacinthus; G. fascicularis(1394/1408) 99%
RoseovariusJW-25Roseovarius sp.MZ262971.1MA2216EA. hyacinthus(1311/1324) 99%
Roseobacter-aceaeJW-26Shima sp. LR11KU560500.1NSWA. hyacinthus(1352/1352) 100%
JW-27Shimia isoporaeMH283808.1L1G. fascicularis(1355/1355) 100%
MarinobacterJW-28Marinobacter sp.MT210870.1MA2216EA. hyacinthus(1503/1503) 100%
LabrenziaJW-29Labrenzia sp.MK493531.1MA2216EA. hyacinthus(1389/1403) 99%
PsychrosphaeraJW-30Psychrosphaera sp.MZ262895.1L1A. hyacinthus(1385/1385) 100%
MicrobacteriumJW-31Microbacterium esteraromaticumMT453933.1MA2216EG. fascicularis(1393/1393) 100%
JW-32Microbacterium sp. OB57JN942151.1MA2216EG. fascicularis(1418/1432) 99%
RossellomoreaJW-33Rossellomorea aquimarisMK256784.1MA2216EG. fascicularis(1451/1451) 100%
TropicibacterJW-34Tropicibacter sp.MK801651.1MA2216EG. fascicularis(1336/1336) 100%
StutzerimonasJW-35Stutzerimonas stutzeriMT356167.1CDAG. fascicularis(1461/1475) 99%
AcinetobacterJW-36Acinetobacter seifertiiOP114754.1CDAG. fascicularis(1409/1423) 99%
JW-37Acinetobacter soliOP854766.1CDAG. fascicularis1403/1403 100%
EnterobacterJW-38Enterobacter cancerogenusCP025225.1CDAG. fascicularis(1406/1406) 100%
MarinomonasJW-39Marinomonas sp.MG099520.1CDAG. fascicularis(1462/1476) 99%
AerococcusJW-40Aerococcus viridansMT502756.1MA2216EG. fascicularis(1423/1437) 99%
PseudoalteromonasJW-41Pseudoalteromonas shioyasakiensisKU321310.1MA2216EG. fascicularis(1407/1421) 99%
Table 2. The reference Raman bands highly correlated with Symbiodiniaceae.
ComponentRaman Bands (cm−1)Assignment
unknown655.246v (C-S) gauche
unknown754.235Symmetric breathing of tryptophan
nucleic acids810.75C-O-P-O-C in RNA backbone
carbohydrates872.62C-C stretching, Hydroxyproline
carbohydrates943.17C-O stretching; C-O-C and C-O-H deformation; α-helix C-C backbone
lipids972.30V (C-C) wagging
proteins1008.68C-C aromatic
unknown1090.82C-O stretching
proteins1130.31C-N stretching
lipids1269.12Amide III random, lipids
lipids1305.86CH3/CH2 twisting or bending mode of lipids
unknown1364.78vs (CH3) Adenine, guanine, tyrosine, tryptophan
unknown1405.91v (COO-)
lipids1446.82CH2, CH3 bending modes
proteins1595.28C=N and C=C stretching in quinoid ring
proteins1609.89Cytosine (NH2)
proteins1643.04Amide I band (protein band)
lipids1663.69(C=C) cis, lipids, fatty acids
lipids2857.48CH2 symmetric stretch of lipids
lipids3017.76v=CH of lipids
Table 3. The reference Raman bands highly correlated with Ruegeria sp. MR31c.
ComponentRaman Bands (cm−1)Assignment
amino acid743.26C-S stretch
amino acid958.87C-N stretching
amino acid824.35aromatic ring vibration
amino acid994.42C-C aromatic and symmetric ring breath
carbohydrates1157.26C-C, C=C band stretch
unknown1231.47Amide III, C-N stretch, N-H coupling
unknown1329.66DNA, Phospholipids, purine
nucleobase1375.36Thymine, adenine, guanine
proteins1460.45CH2 bending mode, C-H vibrations
unknown1573.91Amide II, nucleic acid, Peptidoglycan
lipids2918.07C-H vibrations
Disclaimer/Publisher’s Note: The statements, opinions and data contained in all publications are solely those of the individual author(s) and contributor(s) and not of MDPI and/or the editor(s). MDPI and/or the editor(s) disclaim responsibility for any injury to people or property resulting from any ideas, methods, instructions or products referred to in the content.

