
Exploring Pathogen Presence Prediction in Pastured Poultry Farms through Transformer-Based Models and Attention Mechanism Explainability

 ,
,
Abstract
1. Introduction
2. Dataset
2.1. Farm Management Practices Dataset
2.2. Microbiome Dataset
Microbiome Analysis
3. Method
3.1. Data Pre-Processing
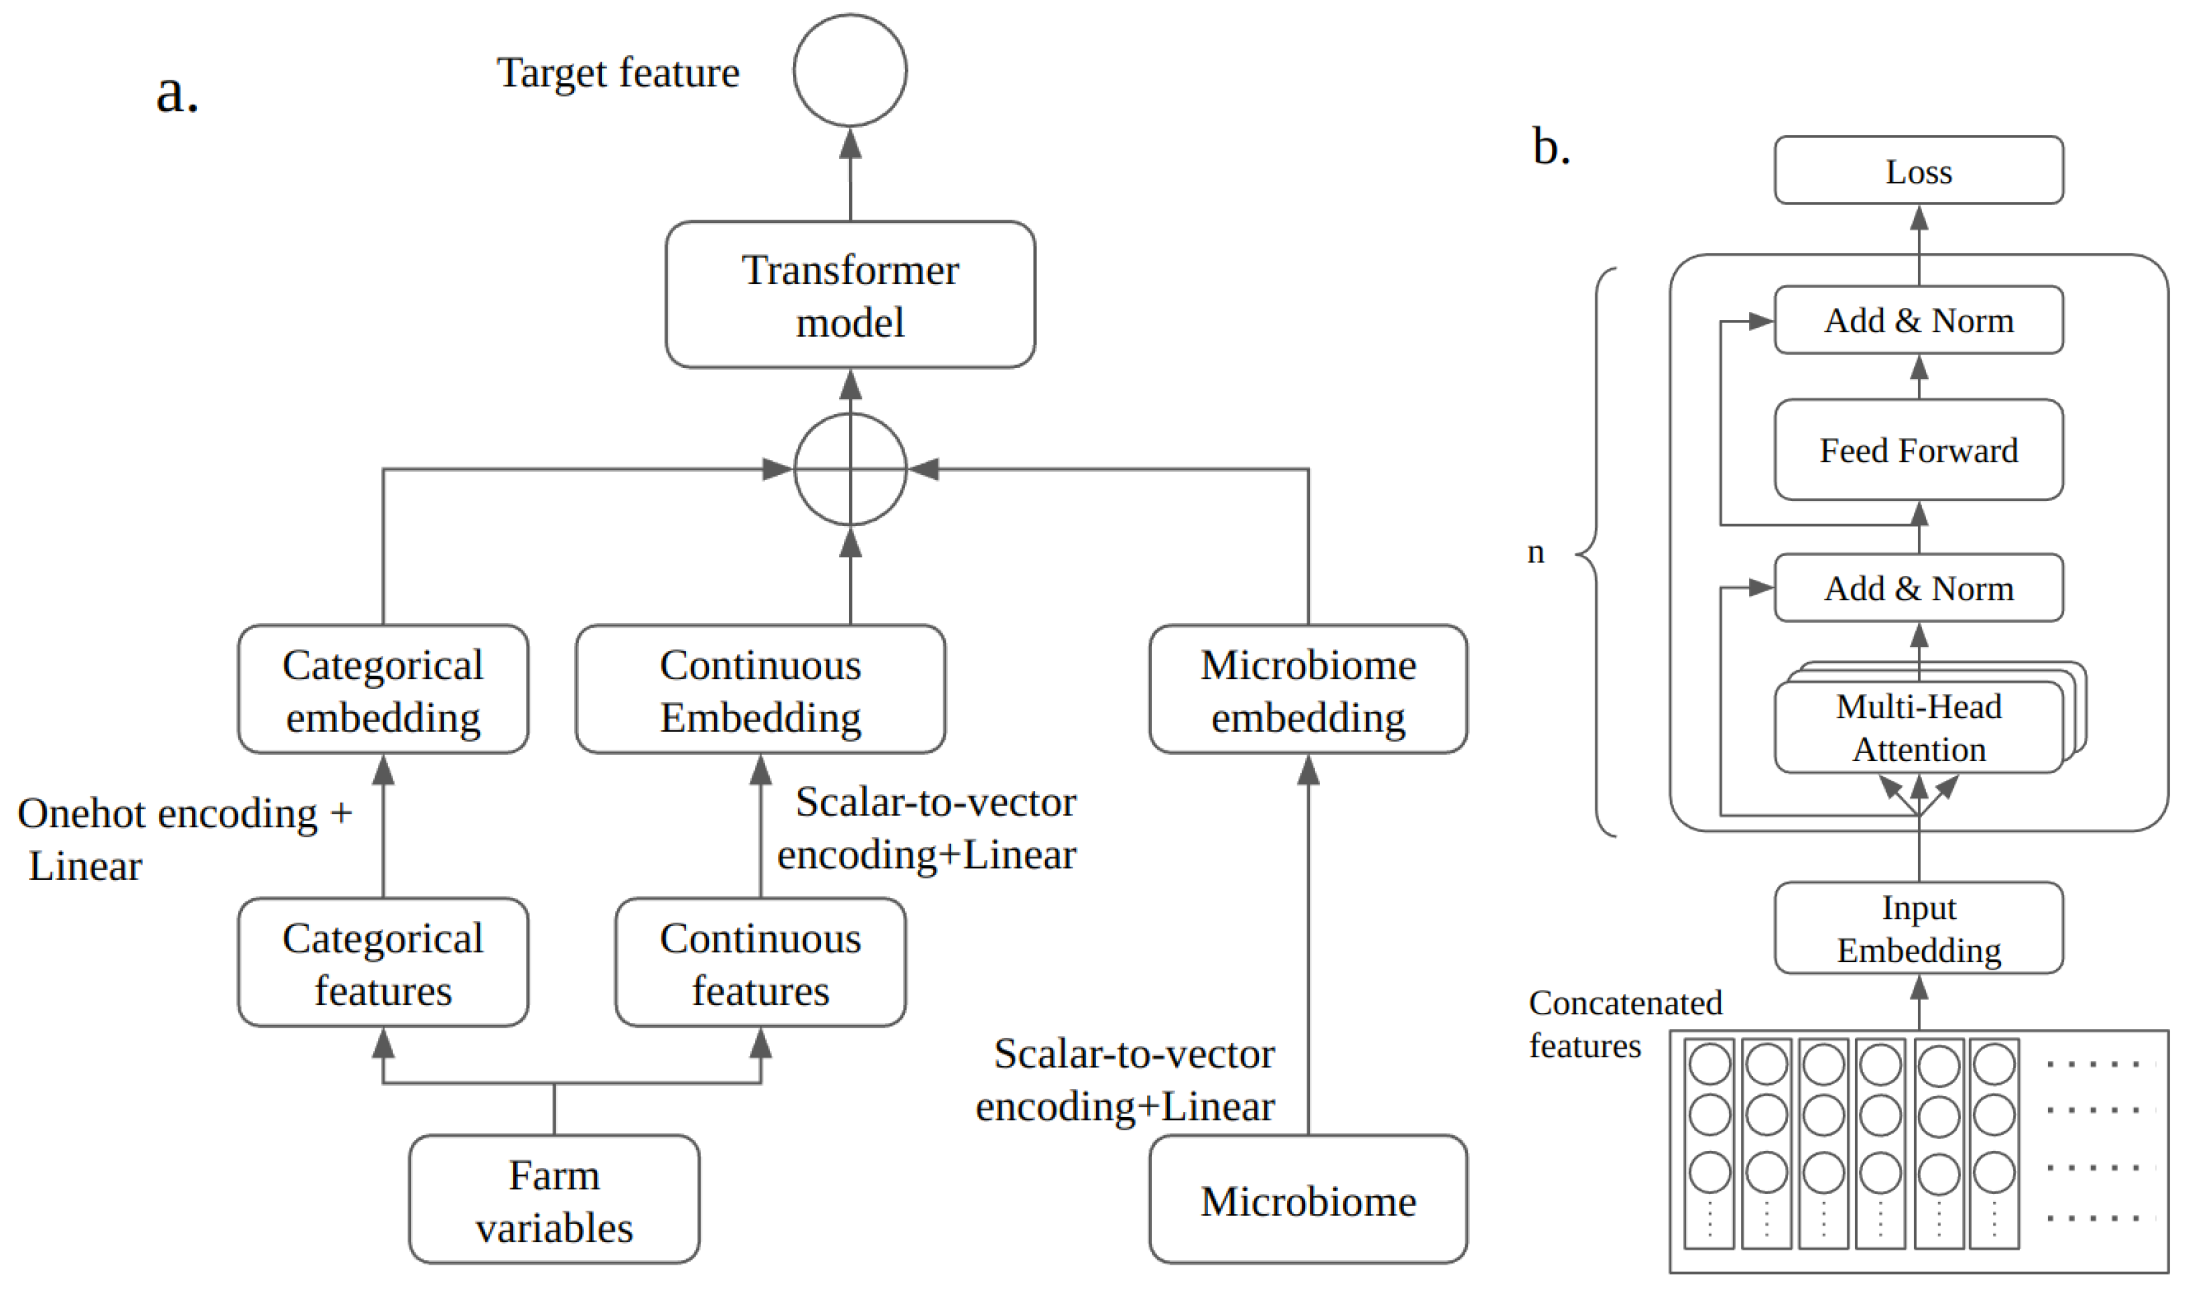
3.2. Model
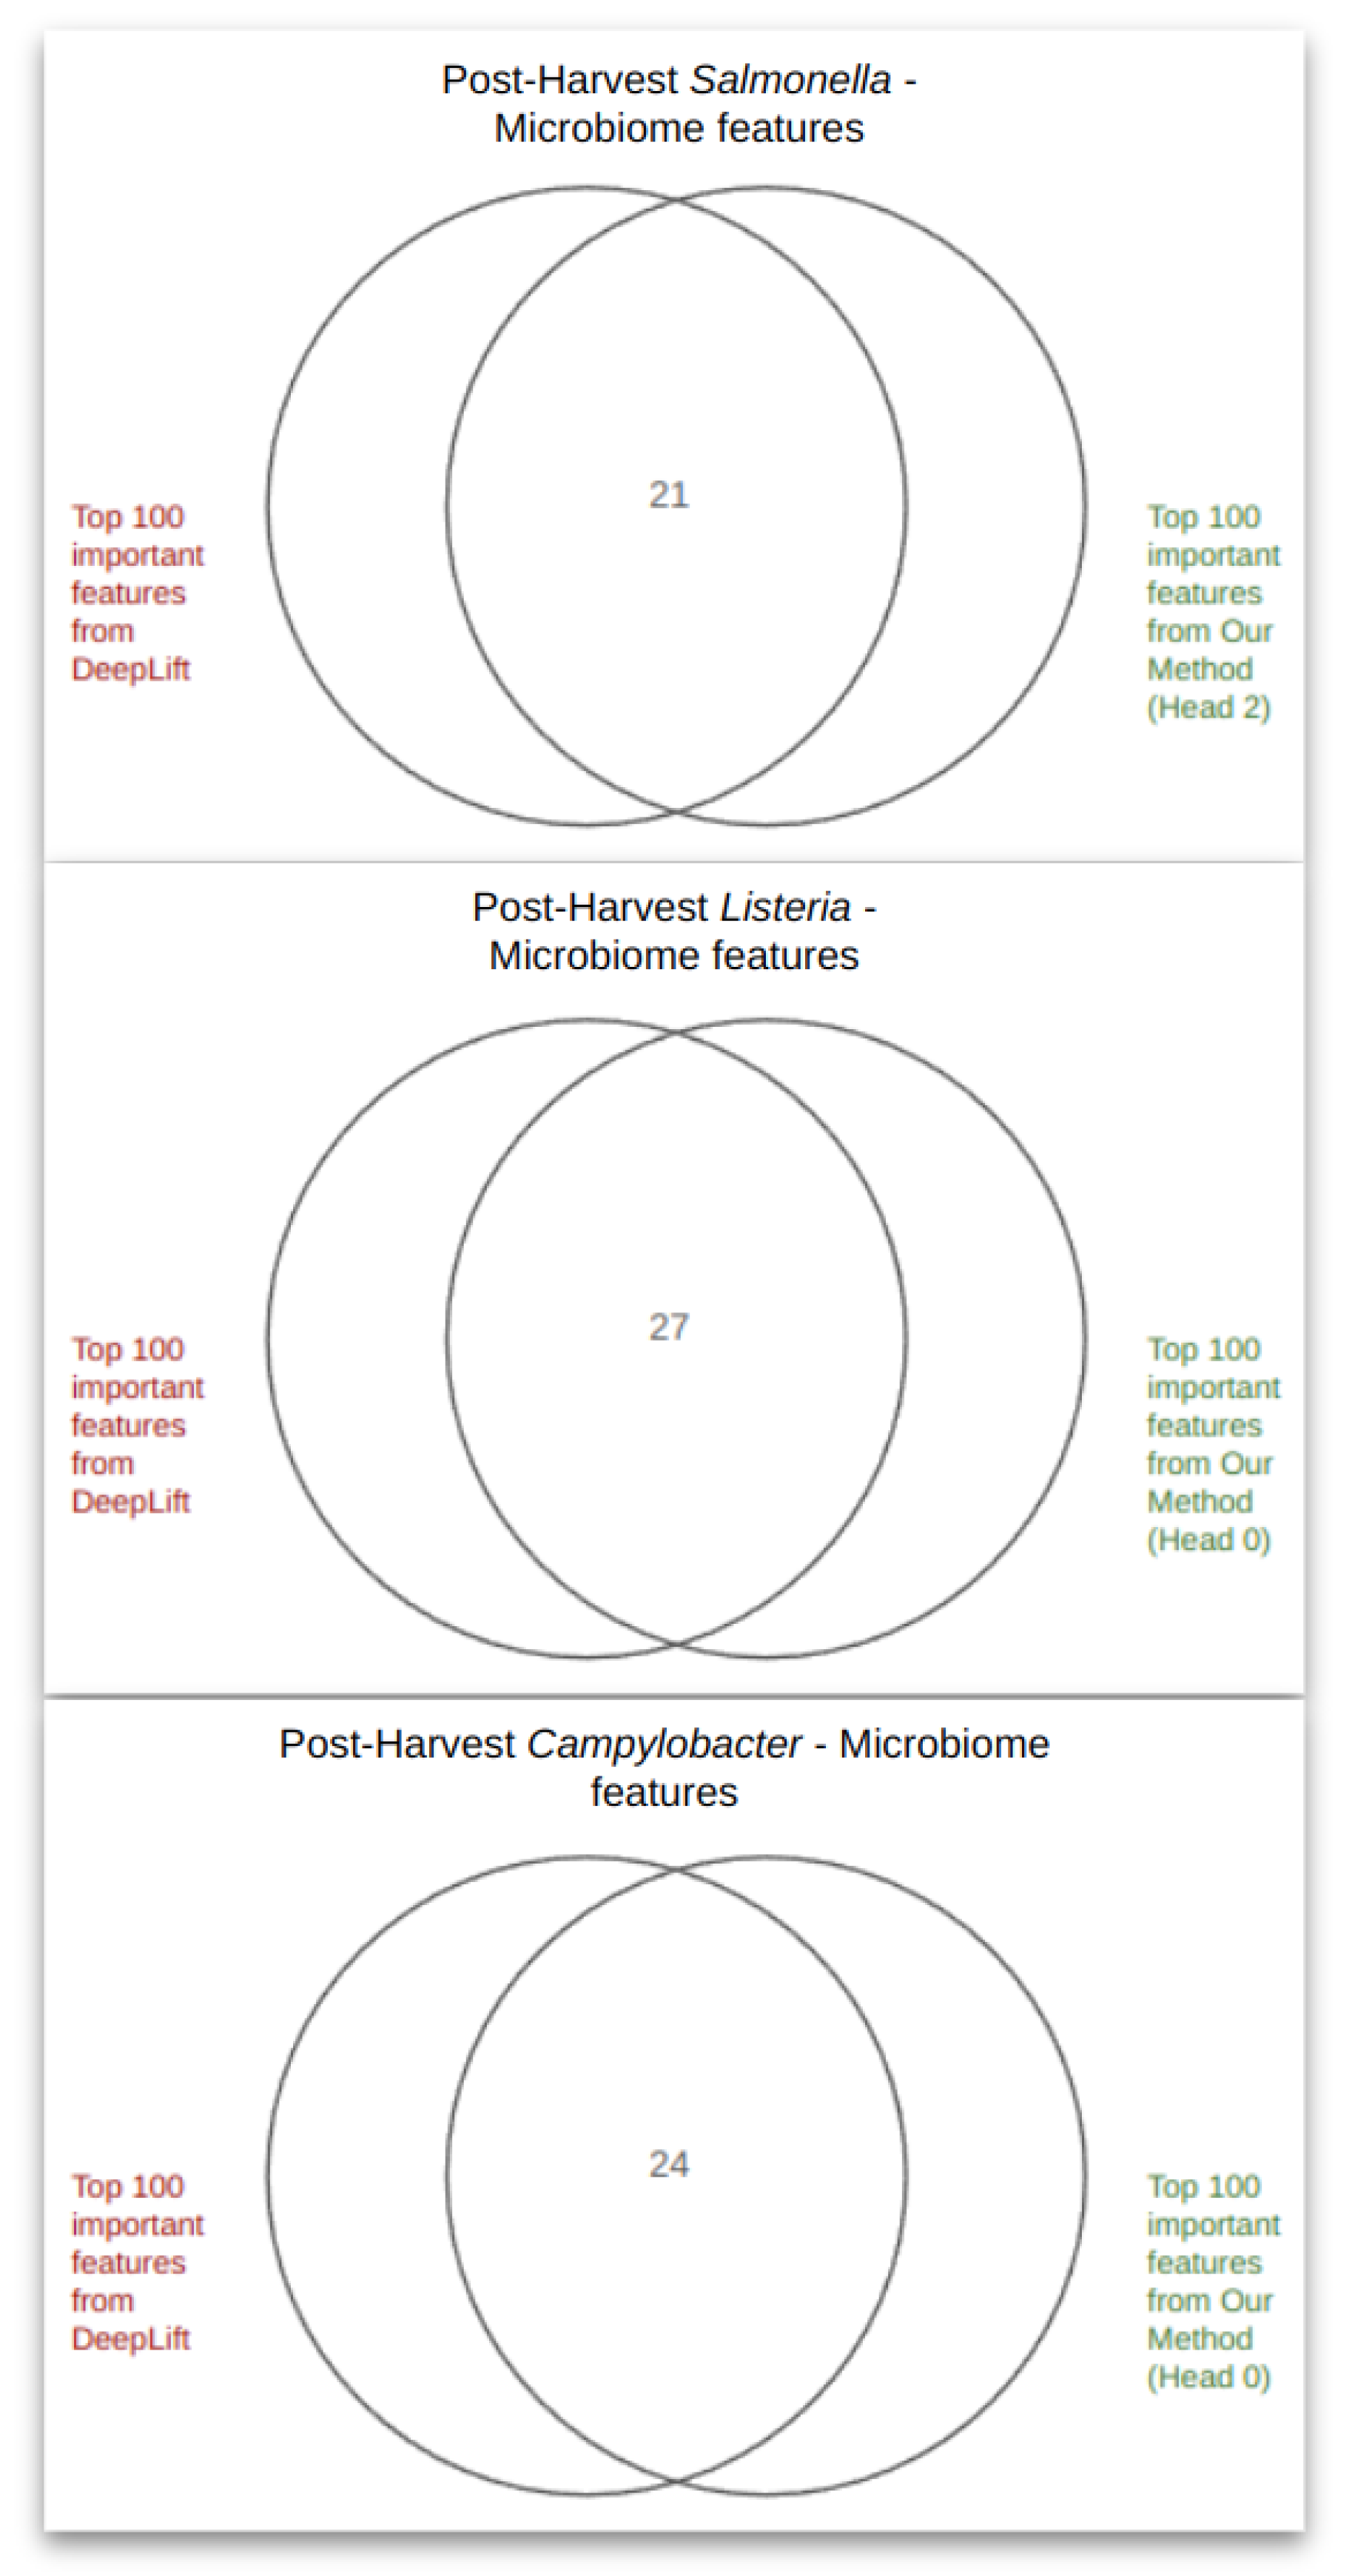
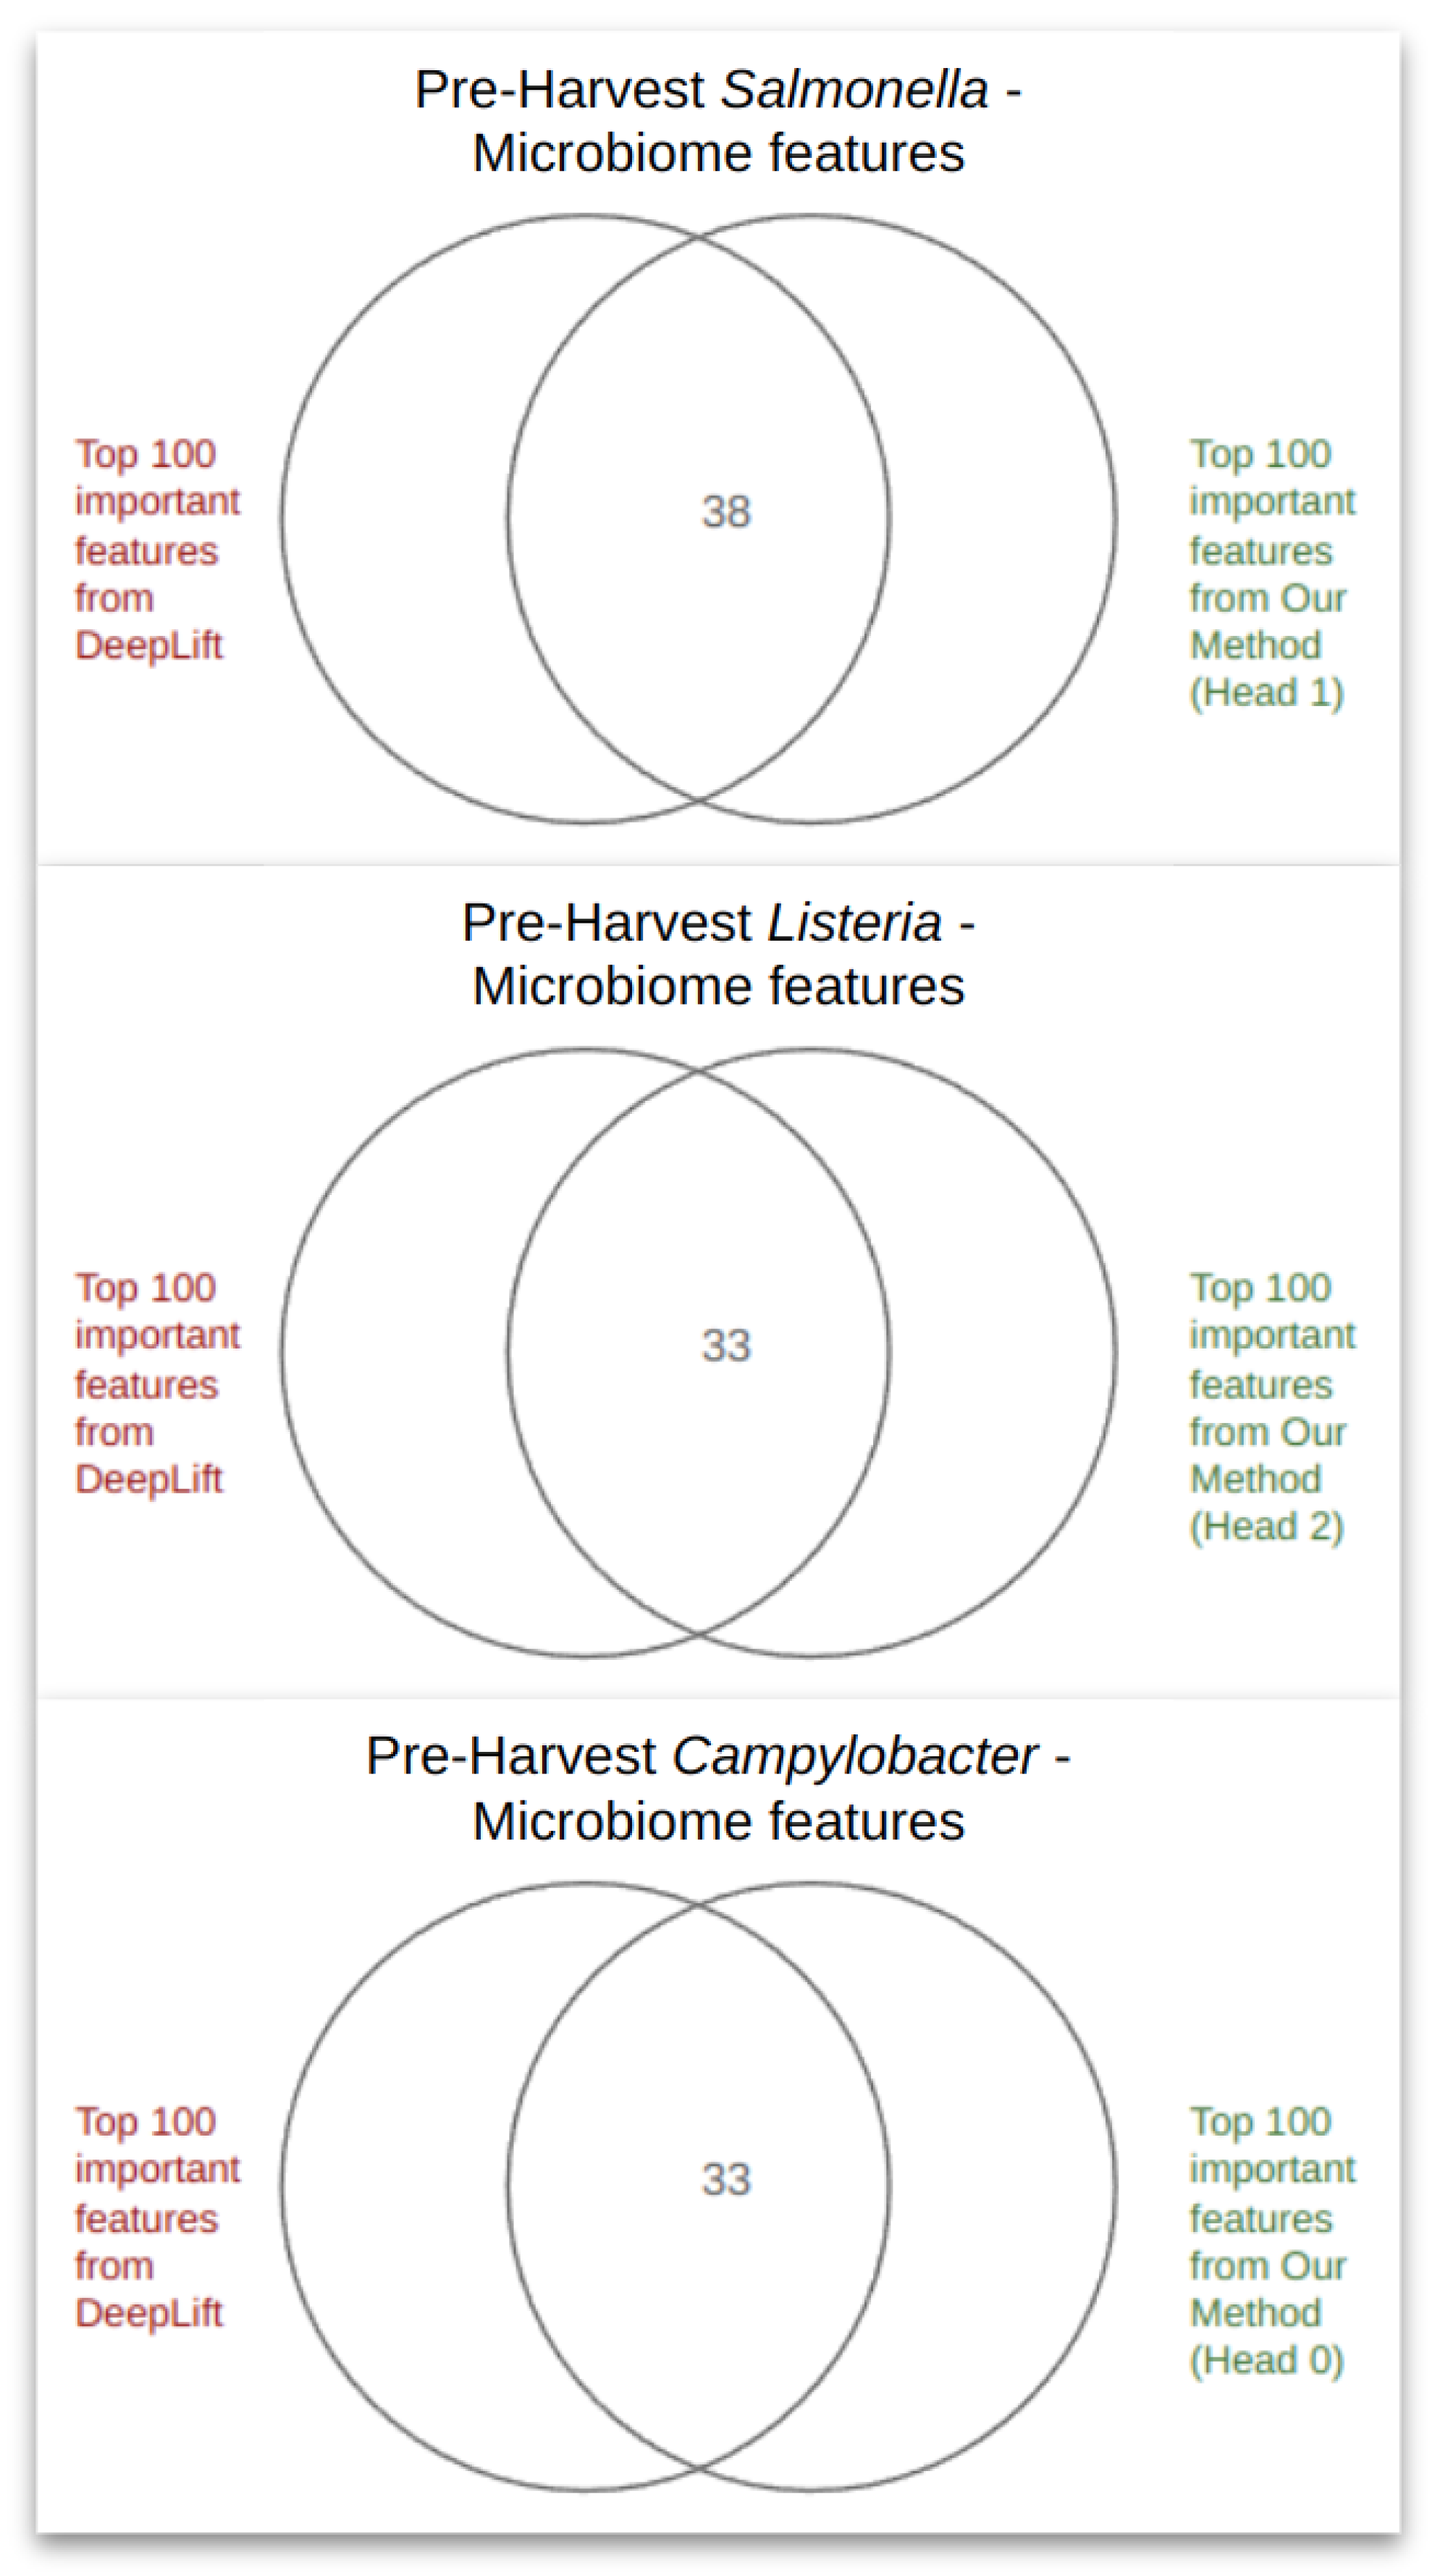
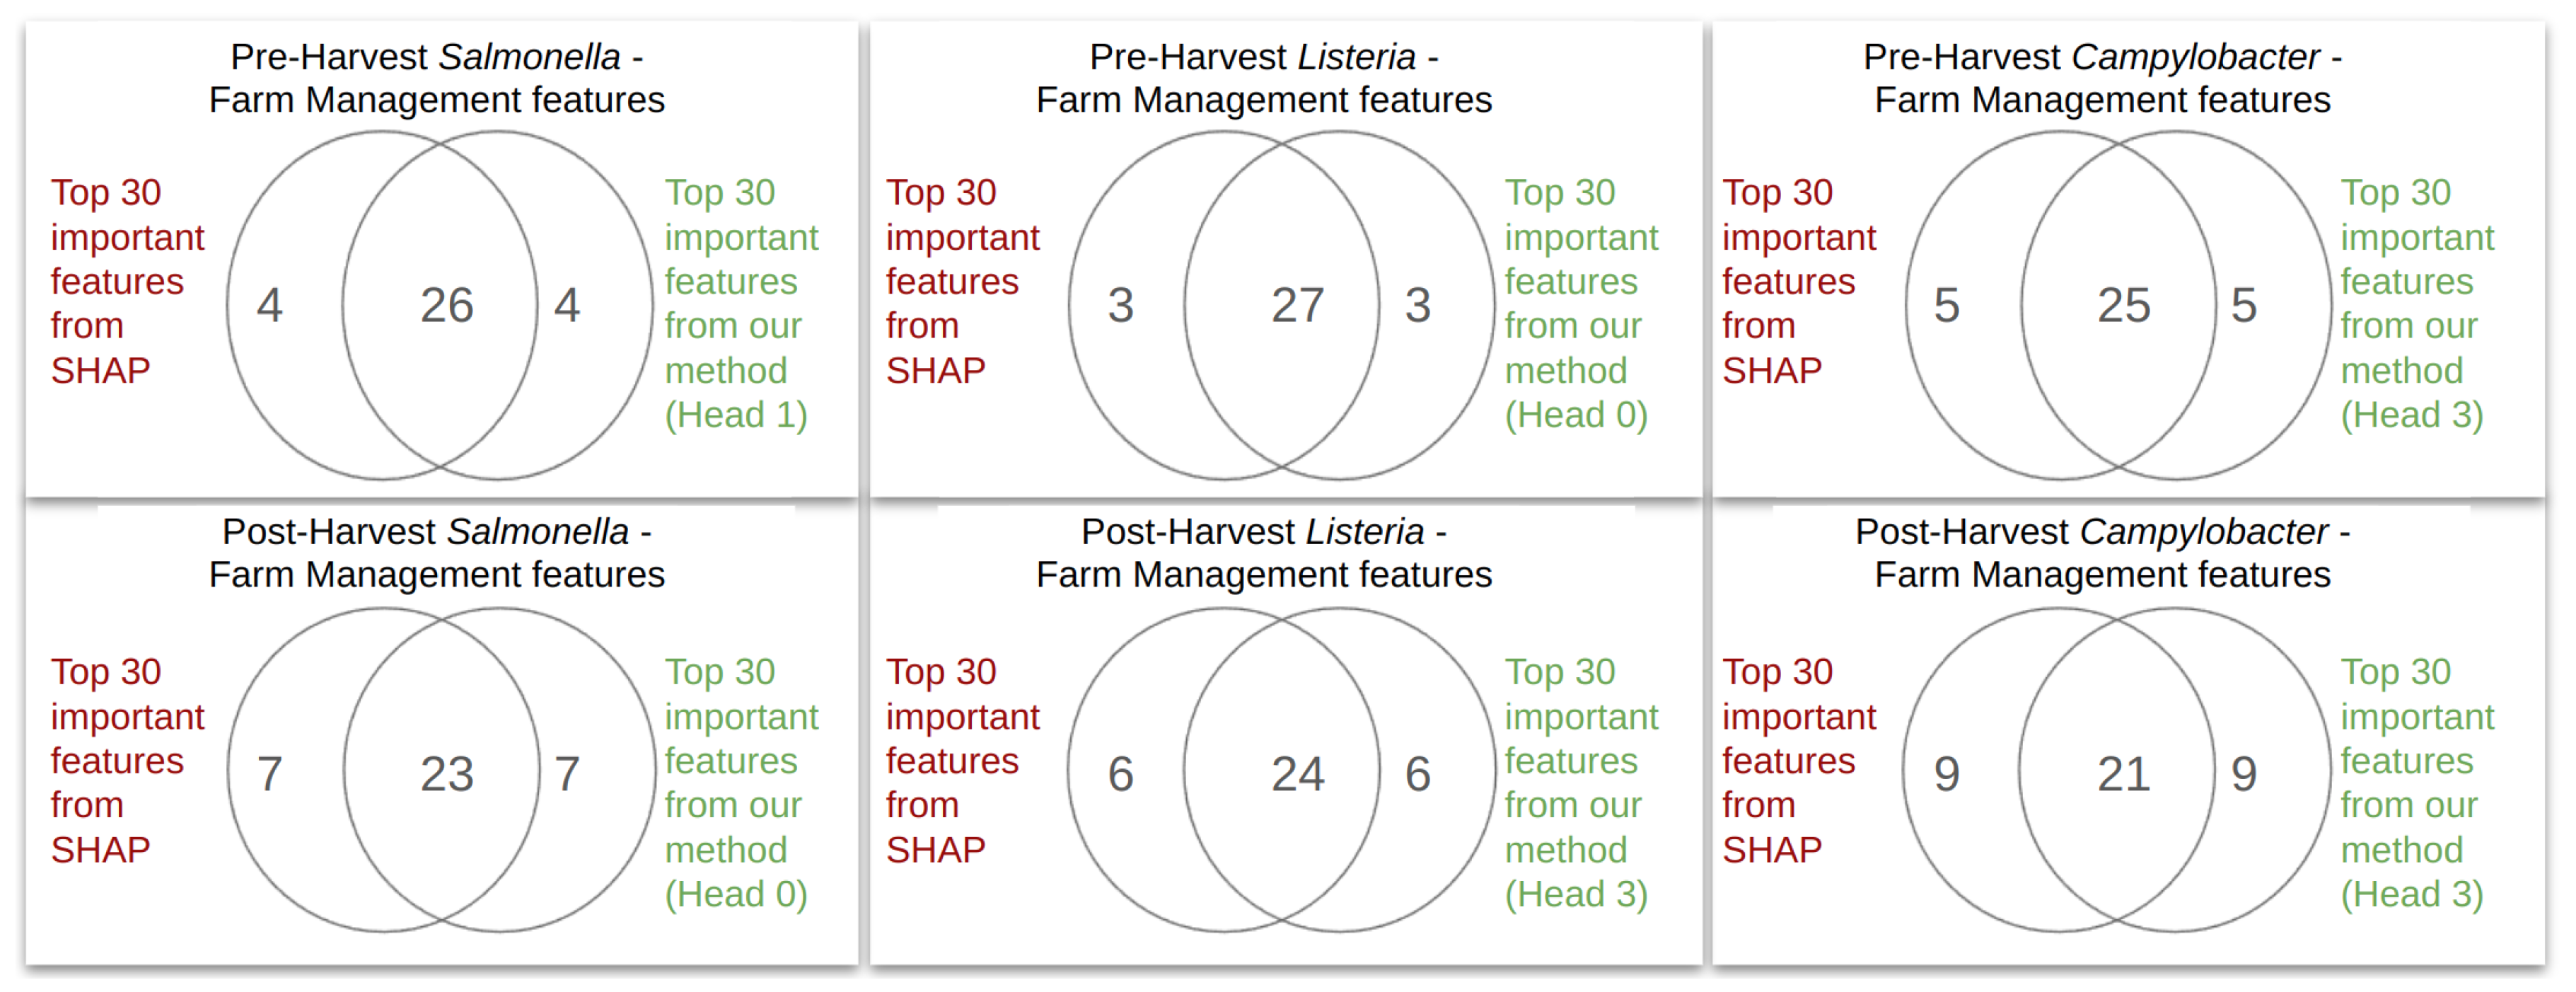
3.3. Model Decoding
- is the vector of PageRank values for all features;
- is the damping factor;
- A is the attention matrix, where element denotes the softmax attention weight of feature i to feature j;
- N is the total number of features;
- 1 is a vector with all elements equal to 1.
4. Experiments and Results
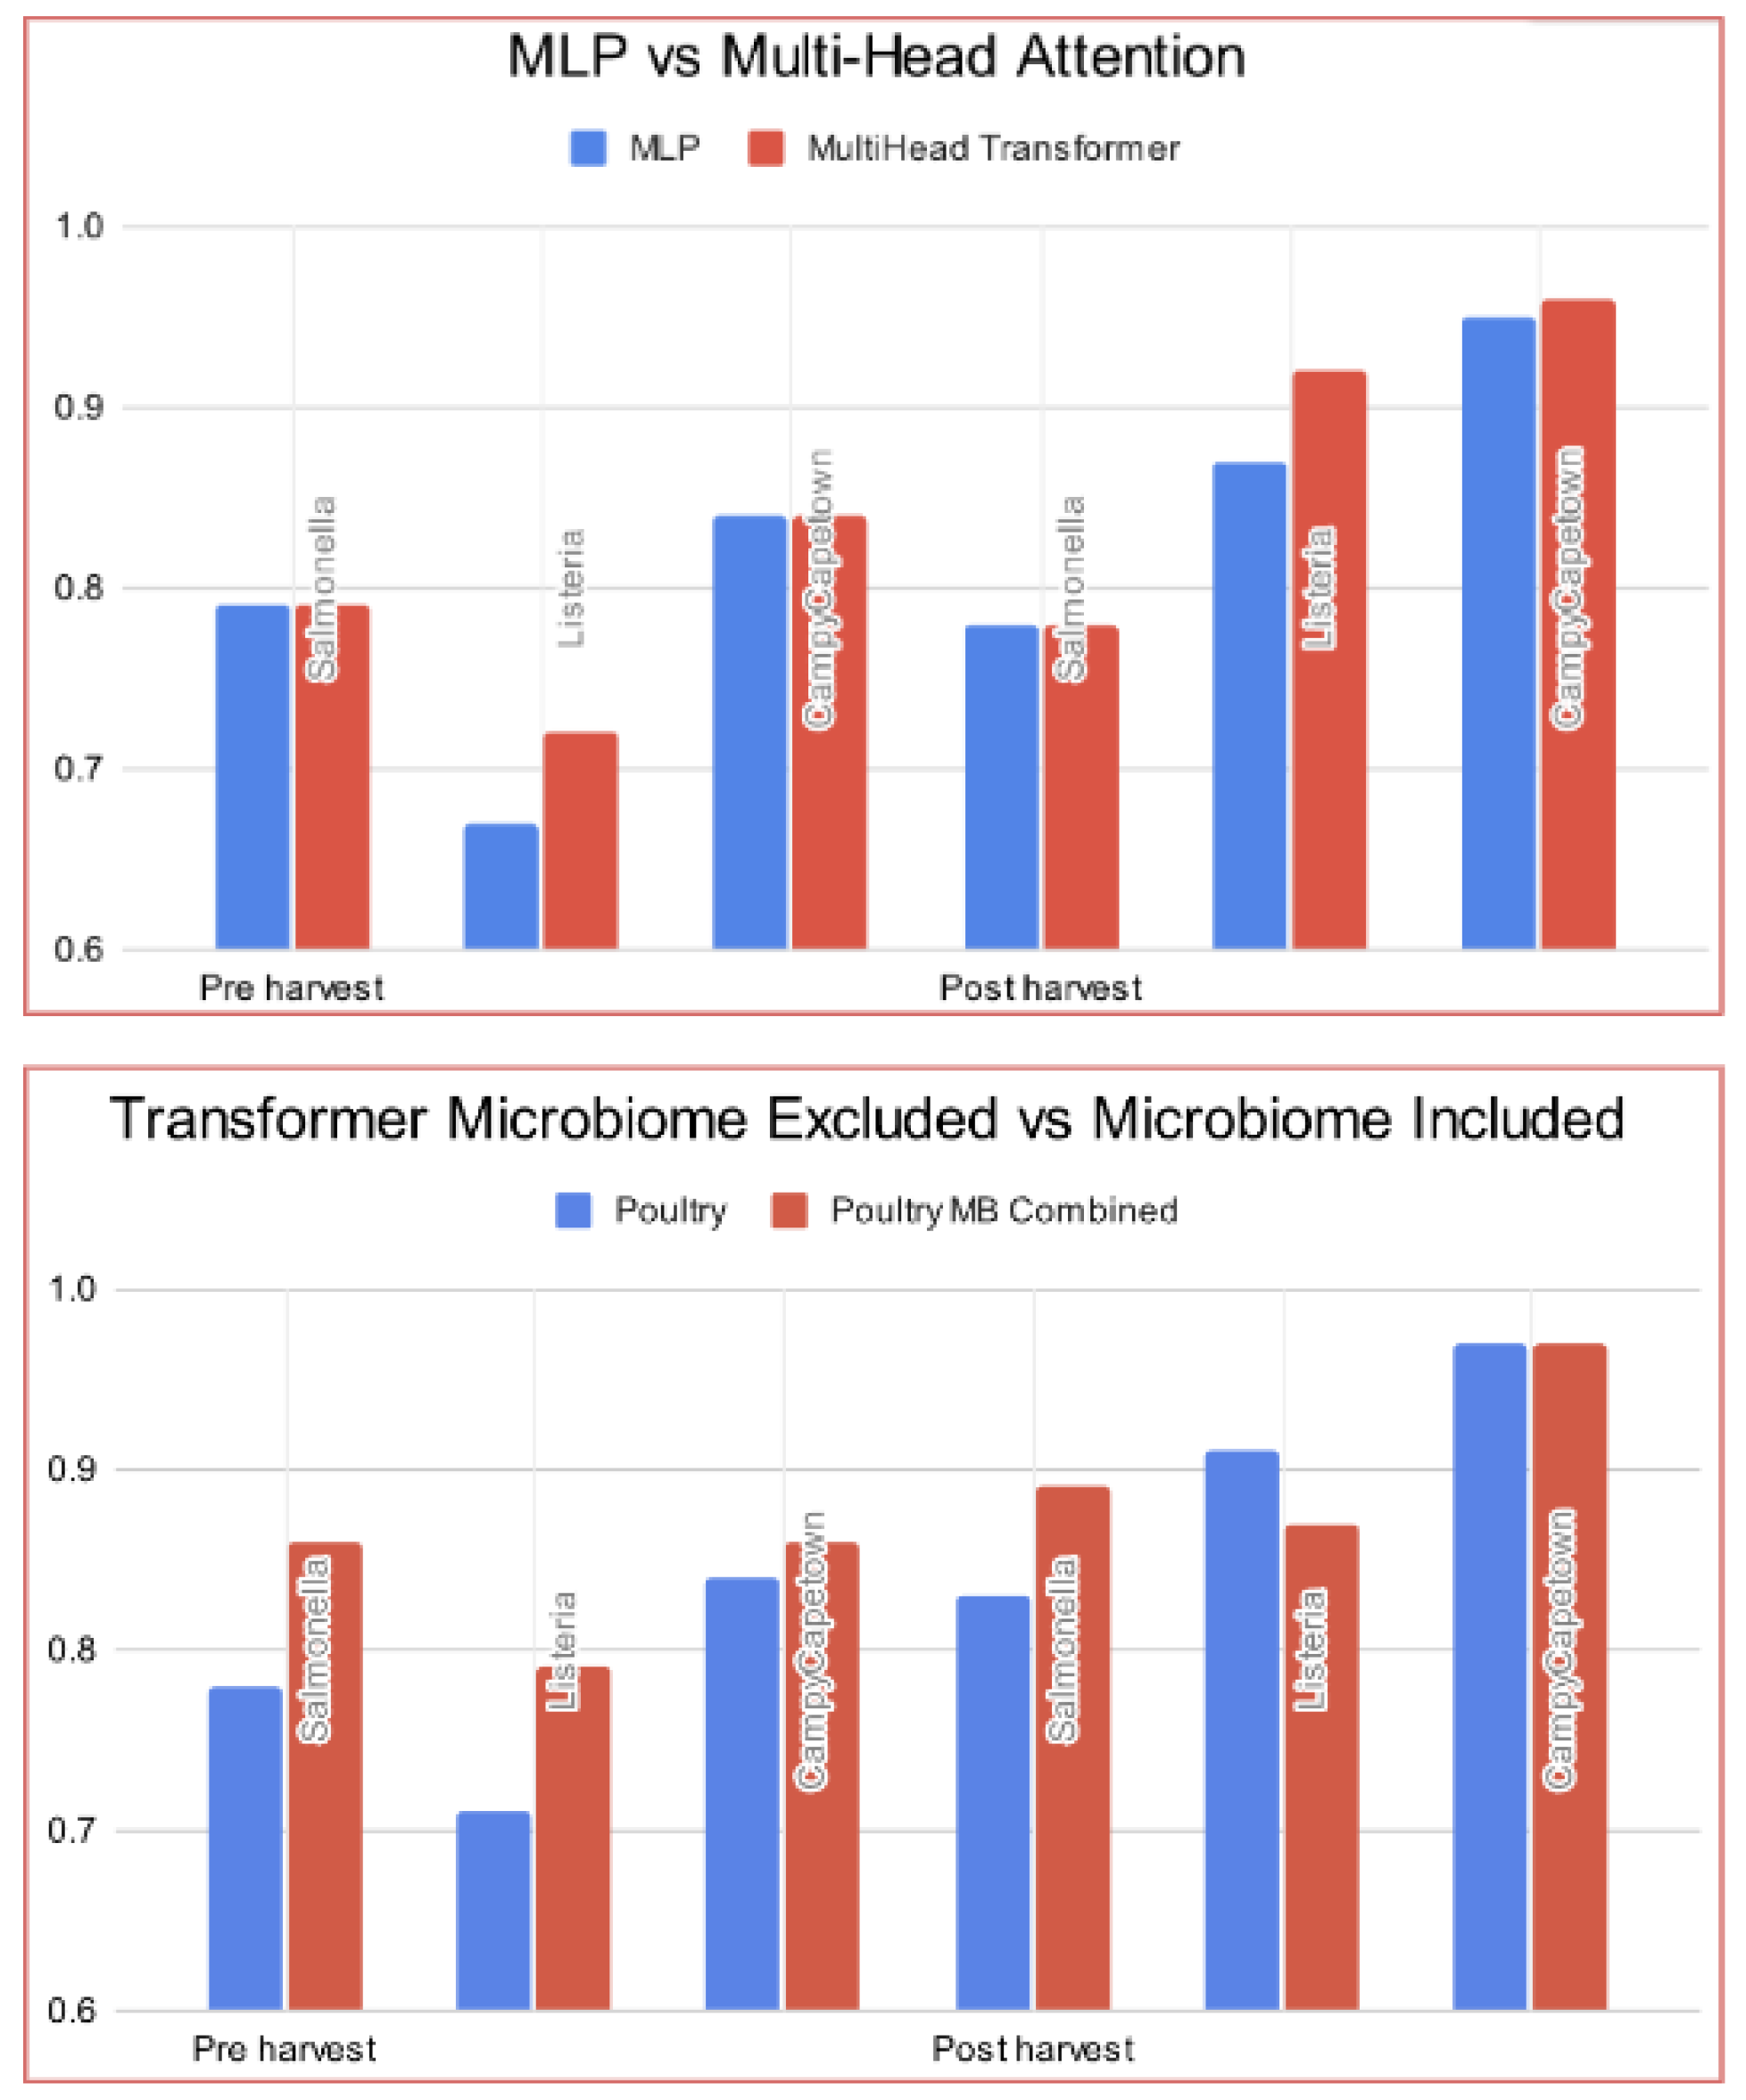
4.1. Transformer Model Evaluation
- Pre-harvest Salmonella samples;
- Pre-harvest Listeria samples;
- Pre-harvest CampyCapetown samples;
- Post-harvest Salmonella samples;
- Post-harvest Listeria samples;
- Post-harvest CampyCapetown samples.
- Multi-layer perceptron (MLP) - Farm Management Practice Variables.
- Multi-head transformers without scalar-to-vector embedding—Farm Management Practice variables.
- Multi-head transformers with scalar-to-vector embedding—Farm Management Practice variables.
- Multi-head transformers with scalar-to-vector embedding—Farm Management Practice variables and Microbiome.
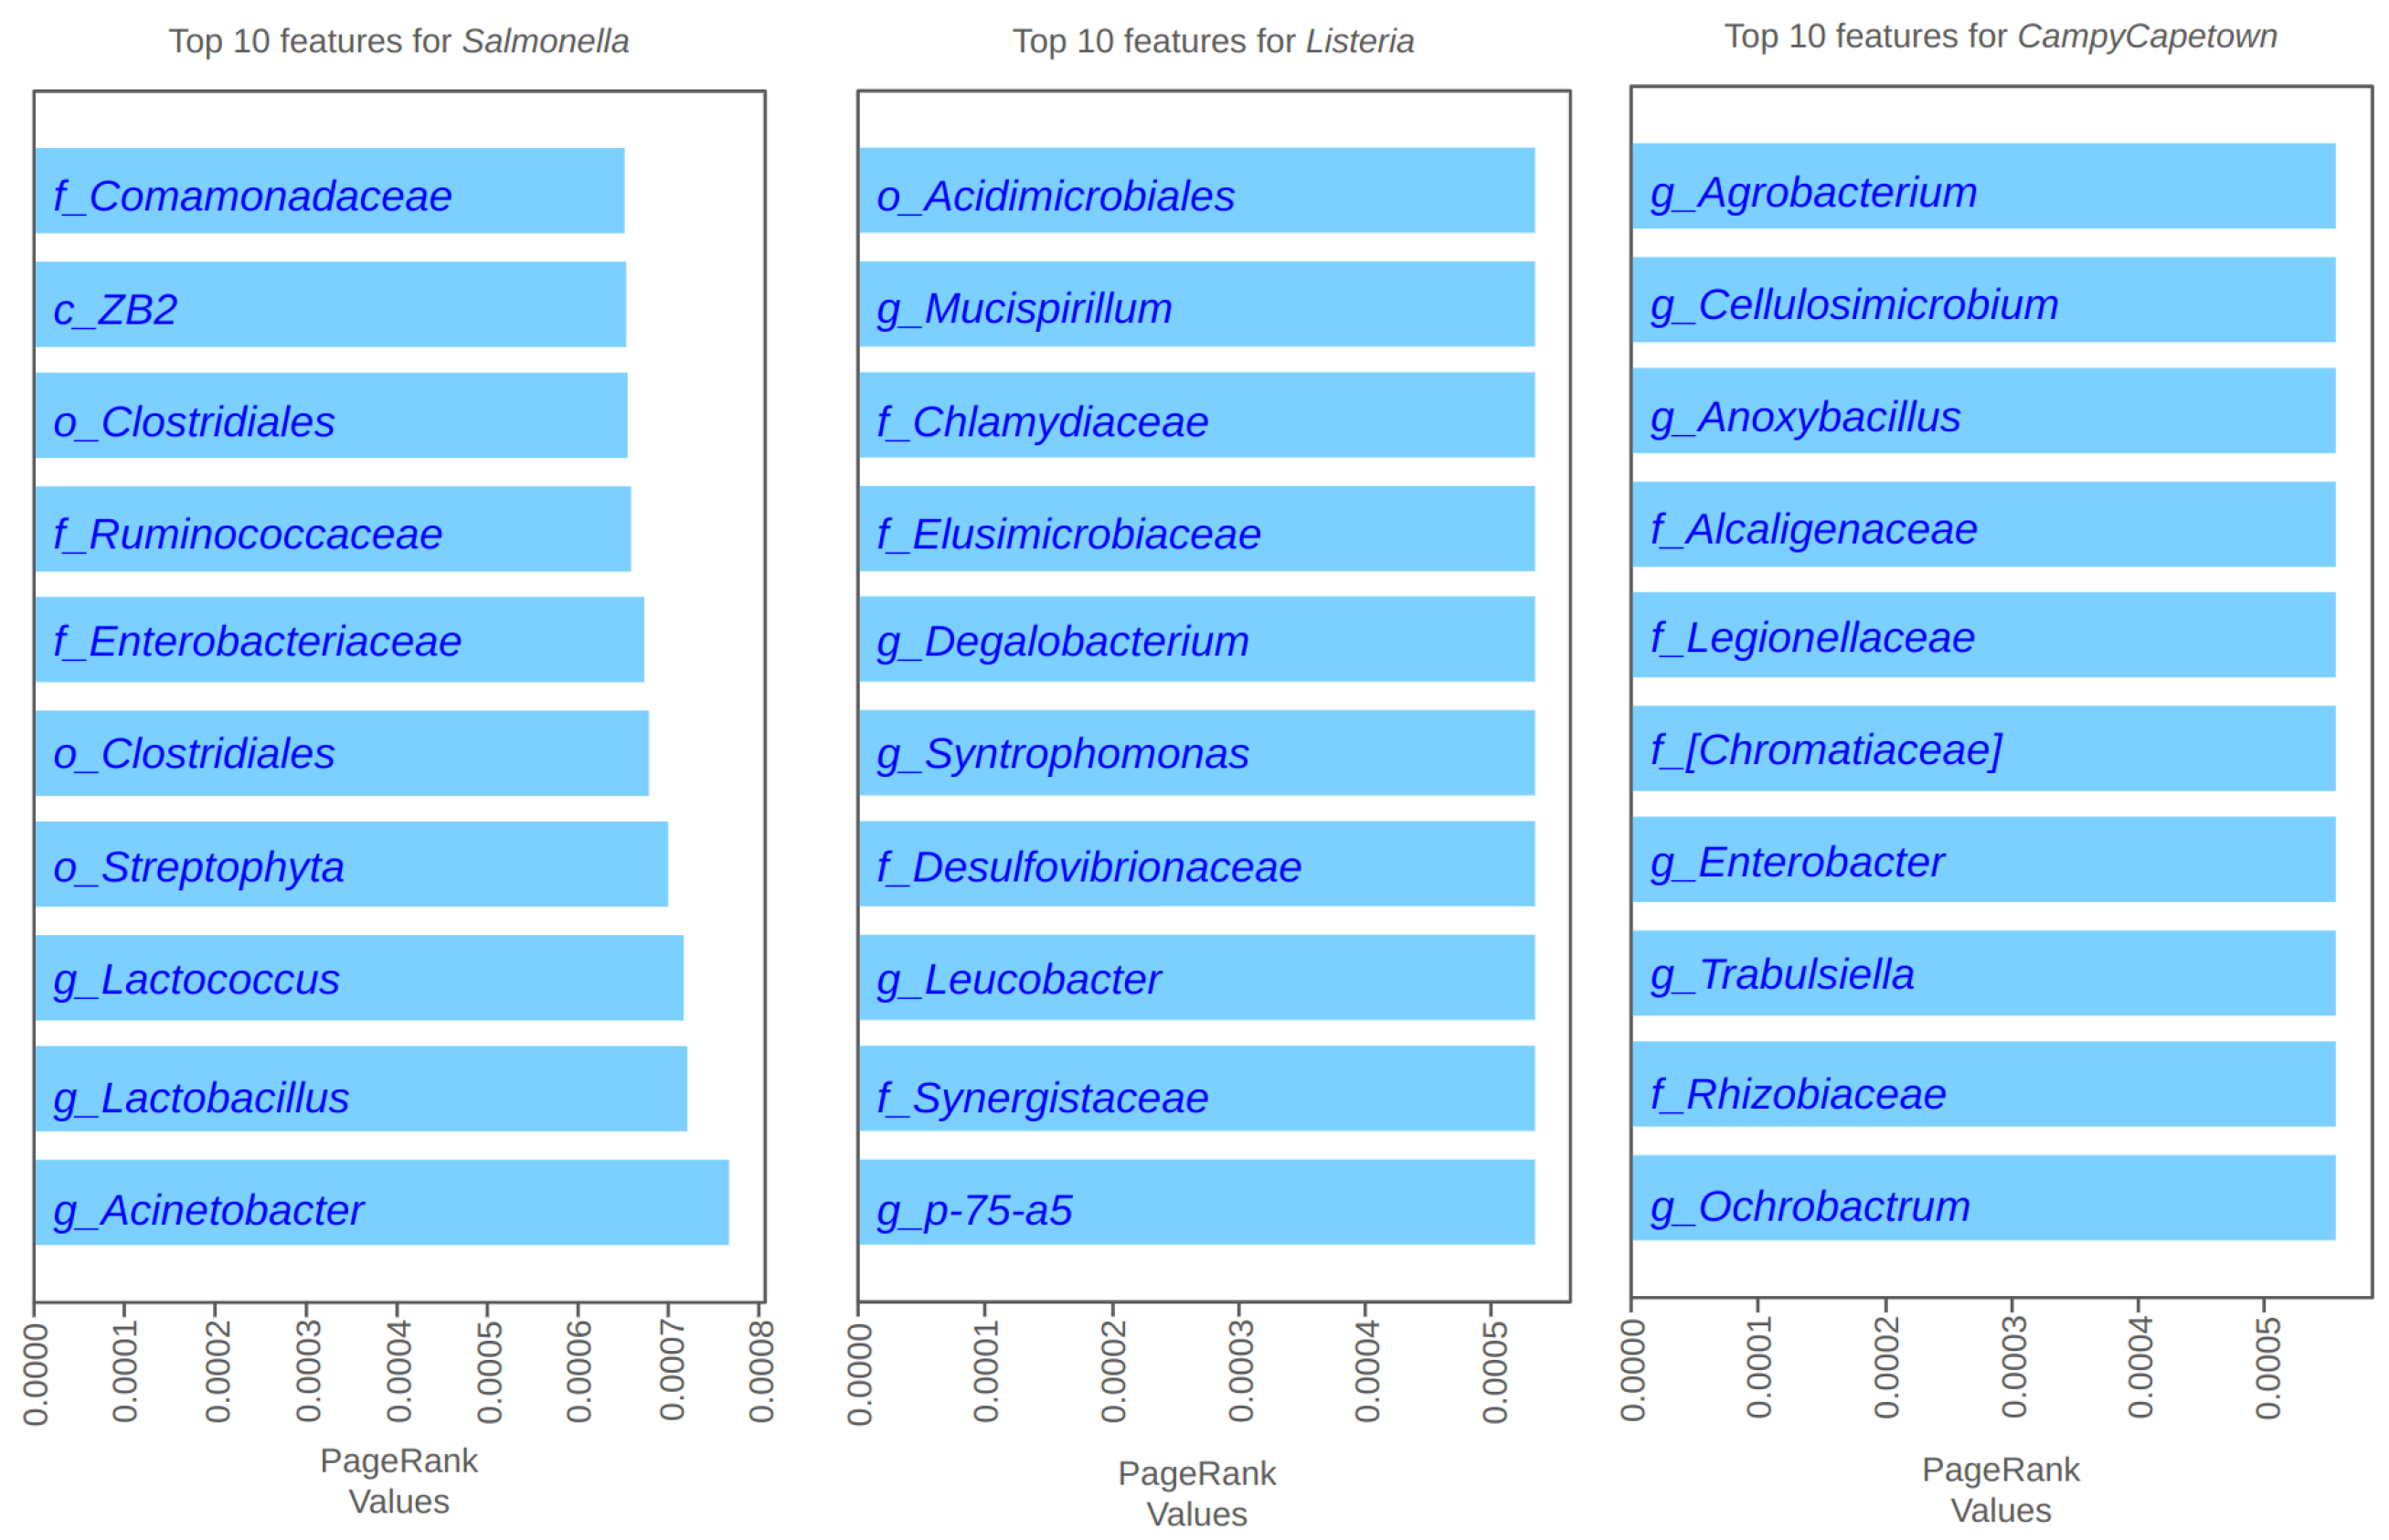
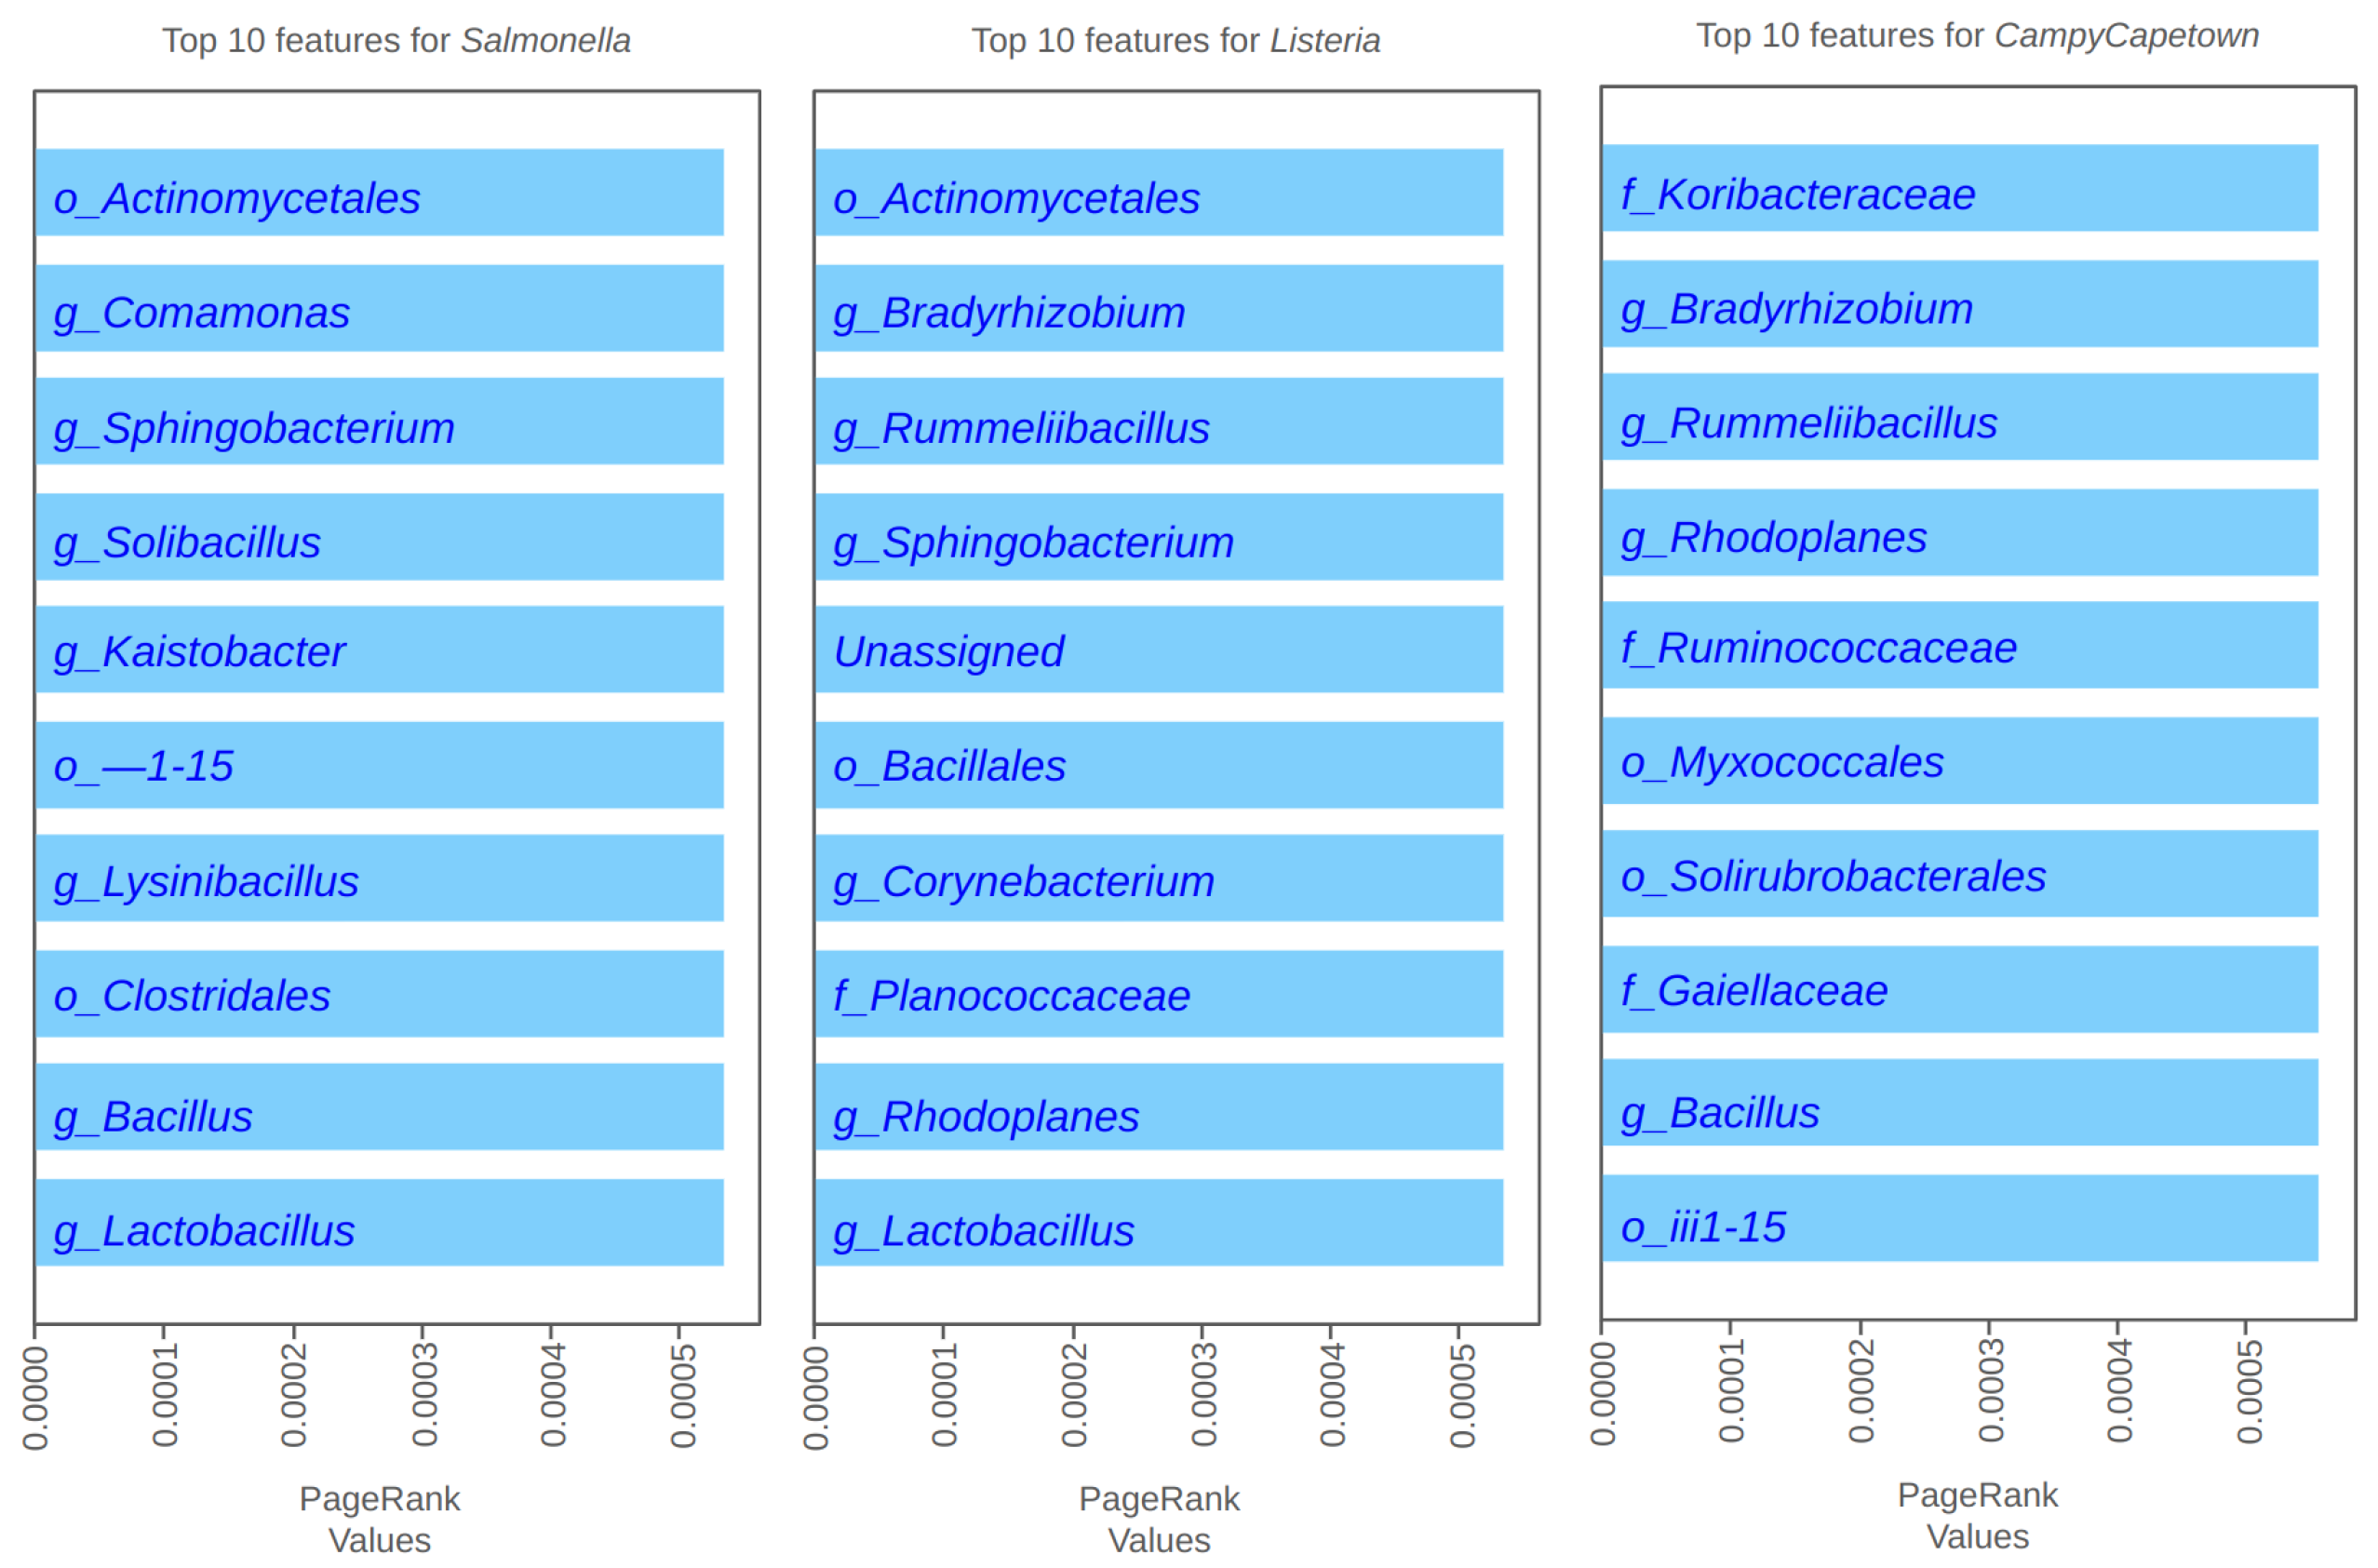
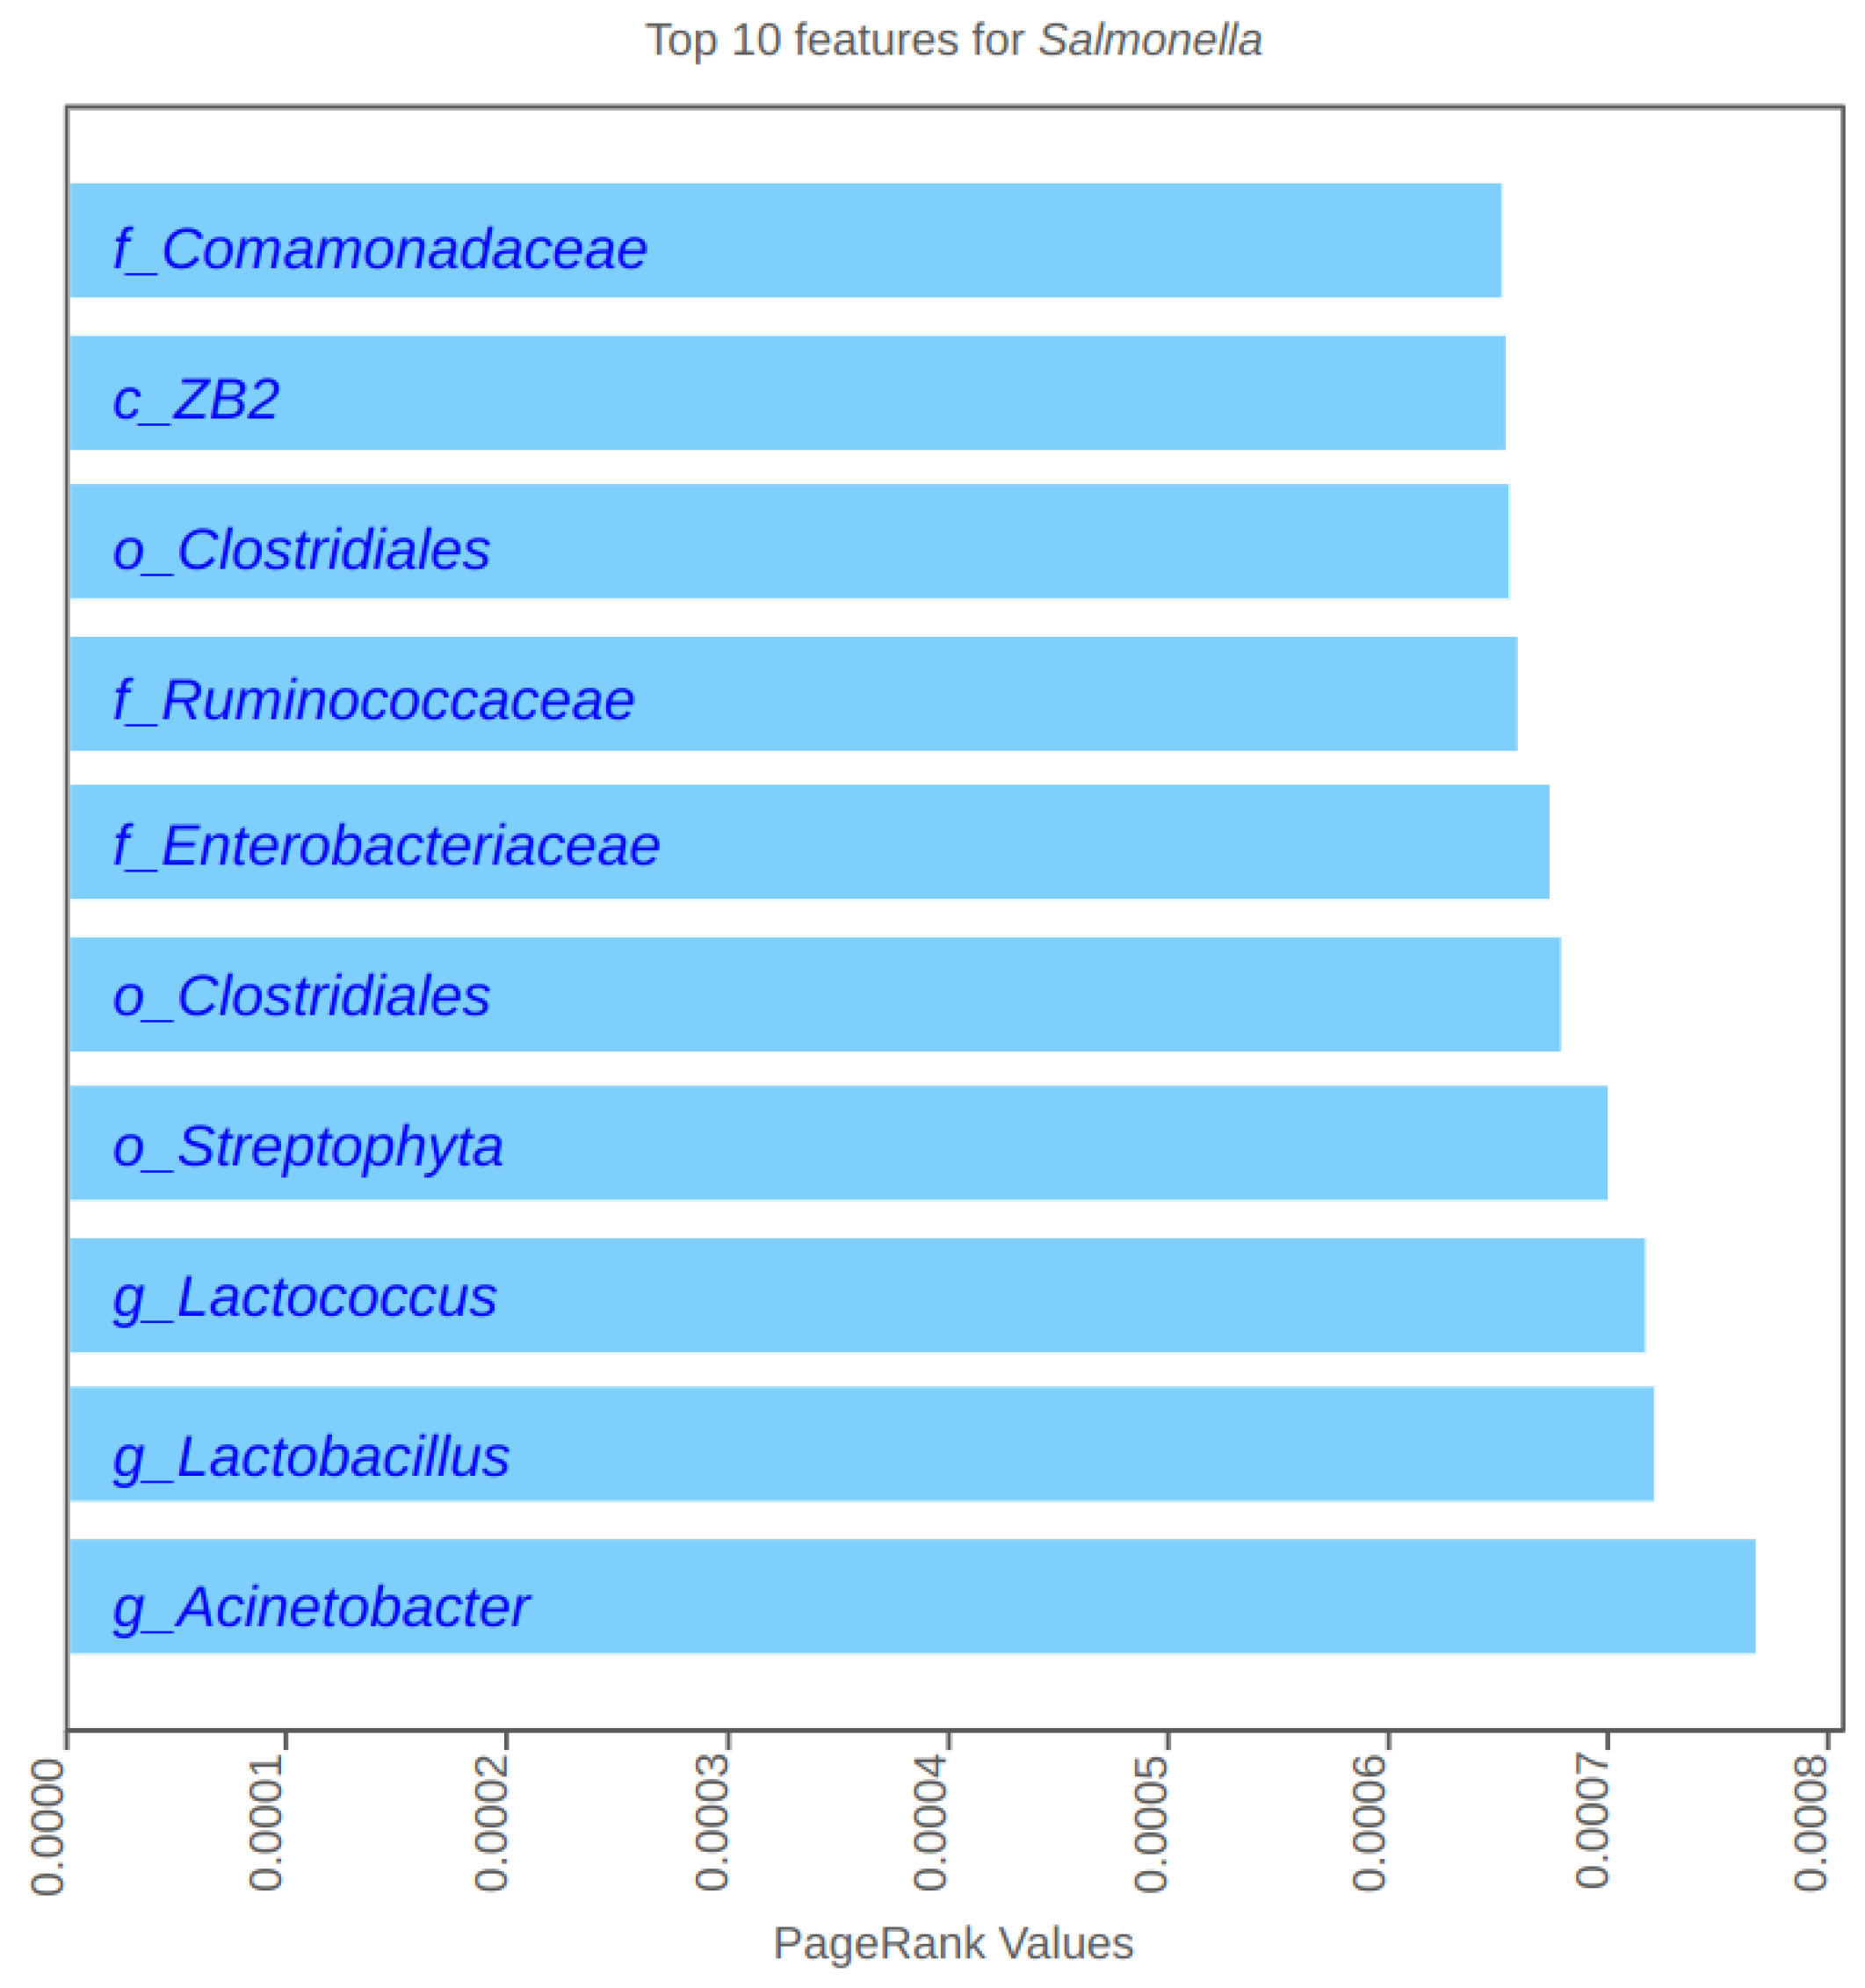
4.2. PageRank Results and Evaluation
4.3. Spectral Clustering Results
5. Discussion
5.1. Role of Firmicutes
5.2. Role of Proteobacteria
5.3. Clustering to Uncover the Microbial Community Structure
- ClusterA
- ClusterB
6. Conclusions
Author Contributions
Funding
Data Availability Statement
Conflicts of Interest
Appendix A
Appendix A.1. Transformer Model Performance
Appendix A.2. PageRank Results
References
- Rothrock, M.J.; Davis, M.L.; Locatelli, A.; Bodie, A.; McIntosh, T.G.; Donaldson, J.R.; Ricke, S.C. Listeria Occurrence in Poultry Flocks: Detection and Potential Implications. Front. Vet. Sci. 2017, 4, 125. [Google Scholar] [CrossRef]
- DuPont, H.L. The growing threat of foodborne bacterial enteropathogens of animal origin. Clin. Infect. Dis. 2007, 45, 1353–1361. [Google Scholar] [CrossRef]
- Authority, European Food Safety. The European Union summary report on trends and sources of zoonoses, zoonotic agents and food-borne outbreaks in 2017. EFSa J. 2018, 16. [Google Scholar]
- Adadi, A.; Berrada, M. Peeking inside the black-box: A survey on explainable artificial intelligence (XAI). IEEE Access 2018, 6, 52138–52160. [Google Scholar] [CrossRef]
- Aruwa, C.E.; Pillay, C.; Nyaga, M.M.; Sabiu, S. Poultry gut health–microbiome functions, environmental impacts, microbiome engineering and advancements in characterization technologies. J. Anim. Sci. Biotechnol. 2021, 12, 119. [Google Scholar] [CrossRef] [PubMed]
- Asnicar, F.; Thomas, A.M.; Passerini, A.; Waldron, L.; Segata, N. Machine learning for microbiologists. Nat. Rev. Microbiol. 2024, 22, 191–205. [Google Scholar] [CrossRef]
- Malakar, S.; Sutaoney, P.; Madhyastha, H.; Shah, K.; Chauhan, N.S.; Banerjee, P. Understanding gut microbiome-based machine learning platforms: A review on therapeutic approaches using deep learning. Chem. Biol. Drug Des. 2024, 103, e14505. [Google Scholar] [CrossRef]
- Lundberg, S.; Lee, S.I. A Unified Approach to Interpreting Model Predictions. arXiv 2017, arXiv:1705.07874v2. [Google Scholar]
- Shrikumar, A.; Greenside, P.; Kundaje, A. Learning Important Features Through Propagating Activation Differences. arXiv 2019, arXiv:1704.02685. [Google Scholar]
- Vaswani, A.; Shazeer, N.; Parmar, N.; Uszkoreit, J.; Jones, L.; Gomez, A.N.; Kaiser, L.u.; Polosukhin, I. Attention is All you Need. In Advances in Neural Information Processing Systems; Guyon, I., Luxburg, U.V., Bengio, S., Wallach, H., Fergus, R., Vishwanathan, S., Garnett, R., Eds.; Curran Associates, Inc.: San Jose, CA, USA, 2017; Volume 30. [Google Scholar]
- Page, L.; Brin, S.; Motwani, R.; Winograd, T. The PageRank Citation Ranking: Bringing Order to the Web. In Proceedings of the The Web Conference, Toronto, ON, Canada, 11–14 May 1999. [Google Scholar]
- Xu, K.; Ba, J.; Kiros, R.; Cho, K.; Courville, A.; Salakhudinov, R.; Zemel, R.; Bengio, Y. Show, attend and tell: Neural image caption generation with visual attention. In Proceedings of the International Conference on Machine Learning, PMLR, Lille, France, 6 July–11 July 2015; pp. 2048–2057. [Google Scholar]
- Choi, E.; Bahadori, M.T.; Sun, J.; Kulas, J.; Schuetz, A.; Stewart, W. Retain: An interpretable predictive model for healthcare using reverse time attention mechanism. Adv. Neural Inf. Process. Syst. 2016, 29. [Google Scholar]
- Lei, T.; Barzilay, R.; Jaakkola, T. Rationalizing neural predictions. arXiv 2016, arXiv:1606.04155. [Google Scholar]
- Jain, S.; Wallace, B.C. Attention is not explanation. arXiv 2019, arXiv:1902.10186. [Google Scholar]
- Liu, G.; Zhang, J.; Chan, A.B.; Hsiao, J.H. Human attention-guided explainable artificial intelligence for computer vision models. Neural Networks 2024, 177, 106392. [Google Scholar] [CrossRef] [PubMed]
- Kotipalli, B. The Role of Attention Mechanisms in Enhancing Transparency and Interpretability of Neural Network Models in Explainable AI. Master’s Thesis, Harrisburg University of Science and Technology, Harrisburg, PA, USA, 2024. [Google Scholar]
- Hwang, D.; Rothrock, M.J.; Pang, H.; Dev Kumar, G.; Mishra, A. Farm management practices that affect the prevalence of Salmonella in pastured poultry farms. LWT 2020, 127, 109423. [Google Scholar] [CrossRef]
- Rothrock Jr, M.J.; Locatelli, A.; Feye, K.M.; Caudill, A.J.; Guard, J.; Hiett, K.; Ricke, S.C. A microbiomic analysis of a pasture-raised broiler flock elucidates foodborne pathogen ecology along the farm-to-fork continuum. Front. Vet. Sci. 2019, 6, 260. [Google Scholar] [CrossRef]
- Xu, X.; Rothrock, M.J.; Mohan, A.; Kumar, G.D.; Mishra, A. Using farm management practices to predict Campylobacter prevalence in pastured poultry farms. Poult. Sci. 2021, 100, 101122. [Google Scholar] [CrossRef]
- Rothrock Jr, M.J.; Hiett, K.L.; Gamble, J.; Caudill, A.C.; Cicconi-Hogan, K.M.; Caporaso, J.G. A hybrid DNA extraction method for the qualitative and quantitative assessment of bacterial communities from poultry production samples. J. Vis. Exp. JoVE 2014, 94, e52161. [Google Scholar]
- Caporaso, J.G.; Lauber, C.L.; Walters, W.A.; Berg-Lyons, D.; Lozupone, C.A.; Turnbaugh, P.J.; Fierer, N.; Knight, R. Global patterns of 16S rRNA diversity at a depth of millions of sequences per sample. Proc. Natl. Acad. Sci. USA 2011, 108, 4516–4522. [Google Scholar] [CrossRef]
- Caporaso, J.G.; Kuczynski, J.; Stombaugh, J.; Bittinger, K.; Bushman, F.D.; Costello, E.K.; Fierer, N.; Peña, A.G.; Goodrich, J.K.; Gordon, J.I.; et al. QIIME allows analysis of high-throughput community sequencing data. Nat. Methods 2010, 7, 335–336. [Google Scholar] [CrossRef]
- Edgar, R.C. Search and clustering orders of magnitude faster than BLAST. Bioinformatics 2010, 26, 2460–2461. [Google Scholar] [CrossRef]
- DeSantis, T.Z.; Hugenholtz, P.; Larsen, N.; Rojas, M.; Brodie, E.L.; Keller, K.; Huber, T.; Dalevi, D.; Hu, P.; Andersen, G.L. Greengenes, a chimera-checked 16S rRNA gene database and workbench compatible with ARB. Appl. Environ. Microbiol. 2006, 72, 5069–5072. [Google Scholar] [CrossRef]
- Caporaso, J.G.; Bittinger, K.; Bushman, F.D.; DeSantis, T.Z.; Andersen, G.L.; Knight, R. PyNAST: A flexible tool for aligning sequences to a template alignment. Bioinformatics 2010, 26, 266–267. [Google Scholar] [CrossRef] [PubMed]
- Huang, X.; Khetan, A.; Cvitkovic, M.; Karnin, Z.S. TabTransformer: Tabular Data Modeling Using Contextual Embeddings. arXiv 2020, arXiv:2012.06678. [Google Scholar]
- Von Luxburg, U. A tutorial on spectral clustering. Stat. Comput. 2007, 17, 395–416. [Google Scholar] [CrossRef]
- MacQueen, J. Some methods for classification and analysis of multivariate observations. In Proceedings of the Fifth Berkeley Symposium on Mathematical Statistics and Probability, Oakland, CA, USA, 21 June 1967; Volume 1, pp. 281–297. [Google Scholar]
- Jain, A.K.; Murty, M.N.; Flynn, P.J. Data clustering: A review. ACM Comput. Surv. (CSUR) 1999, 31, 264–323. [Google Scholar] [CrossRef]
- Hoffmann, S.A.; Maculloch, B.; Batz, M. Economic Burden of Major Foodborne Illnesses Acquired in the United States, 2015. Available online: https://www.ers.usda.gov/webdocs/publications/43984/52807_eib140.pdf?v=2344.4 (accessed on 1 June 2024).
- Vos, P.; Garrity, G.; Jones, D.; Krieg, N.R.; Ludwig, W.; Rainey, F.A.; Schleifer, K.H.; Whitman, W.B. Bergey’s Manual of Systematic Bacteriology: Volume 3: The Firmicutes; Springer Science & Business Media: Berlin/Heidelberg, Germany, 2011; Volume 3. [Google Scholar]
- Doyle, M.P.; Diez-Gonzalez, F.; Hill, C. Food Microbiology: Fundamentals and Frontiers; John Wiley & Sons: Hoboken, NJ, USA, 2020. [Google Scholar]
- Muyyarikkandy, M.S.; Parzygnat, J.; Thakur, S. Uncovering changes in microbiome profiles across commercial and backyard poultry farming systems. Microbiol. Spectr. 2023, 11, e01682-23. [Google Scholar] [CrossRef] [PubMed]
- Leser, T.D.; Mølbak, L. Better living through microbial action: The benefits of the mammalian gastrointestinal microbiota on the host. Environ. Microbiol. 2009, 11, 2194–2206. [Google Scholar] [CrossRef] [PubMed]
- Liu, L.; Lin, L.; Zheng, L.; Tang, H.; Fan, X.; Xue, N.; Li, M.; Liu, M.; Li, X. Cecal microbiome profile altered by Salmonella enterica, serovar Enteritidis inoculation in chicken. Gut Pathog. 2018, 10, 34. [Google Scholar] [CrossRef]
- Zhu, J.; Chen, Y.; Imre, K.; Arslan-Acaroz, D.; Istanbullugil, F.R.; Fang, Y.; Ros, G.; Zhu, K.; Acaroz, U. Mechanisms of probiotic Bacillus against enteric bacterial infections. One Health Adv. 2023, 1, 21. [Google Scholar] [CrossRef]
- Caulier, S.; Nannan, C.; Gillis, A.; Licciardi, F.; Bragard, C.; Mahillon, J. Overview of the antimicrobial compounds produced by members of the Bacillus subtilis group. Front. Microbiol. 2019, 10, 435128. [Google Scholar] [CrossRef]
- Šimunović, K.; Stefanic, P.; Klančnik, A.; Erega, A.; Mandic Mulec, I.; Možina, S.S. Bacillus subtilis PS-216 antagonistic activities against Campylobacter jejuni NCTC 11168 are modulated by temperature, oxygen, and growth medium. Microorganisms 2022, 10, 289. [Google Scholar] [CrossRef] [PubMed]
- Luise, D.; Bosi, P.; Raff, L.; Amatucci, L.; Virdis, S.; Trevisi, P. Bacillus spp. probiotic strains as a potential tool for limiting the use of antibiotics, and improving the growth and health of pigs and chickens. Front. Microbiol. 2022, 13, 801827. [Google Scholar] [CrossRef] [PubMed]
- Mazanko, M.S.; Popov, I.V.; Prazdnova, E.V.; Refeld, A.G.; Bren, A.B.; Zelenkova, G.A.; Chistyakov, V.A.; Algburi, A.; Weeks, R.M.; Ermakov, A.M.; et al. Beneficial effects of spore-forming Bacillus probiotic bacteria isolated from poultry microbiota on broilers’ health, growth performance, and immune system. Front. Vet. Sci. 2022, 9, 877360. [Google Scholar] [CrossRef] [PubMed]
- Vivant, A.L.; Garmyn, D.; Piveteau, P. Listeria monocytogenes, a down-to-earth pathogen. Front. Cell. Infect. Microbiol. 2013, 3, 87. [Google Scholar] [CrossRef] [PubMed]
- Anjana, A.; Tiwari, S.K. Bacteriocin-producing probiotic lactic acid bacteria in controlling dysbiosis of the gut microbiota. Front. Cell. Infect. Microbiol. 2022, 12, 851140. [Google Scholar]
- Zhang, G.; Raheem, A.; Gao, X.; Zhang, J.; Shi, L.; Wang, M.; Li, M.; Yin, Y.; Li, S.; Cui, X.; et al. Cytoprotective Effects of Lactobacilli on Mouse Epithelial Cells during Salmonella Infection. Fermentation 2022, 8, 101. [Google Scholar] [CrossRef]
- Webb, L.; Ma, L.; Lu, X. Impact of lactic acid bacteria on the control of Listeria monocytogenes in ready-to-eat foods. Food Qual. Saf. 2022, 6, fyac045. [Google Scholar] [CrossRef]
- Rushdy, A.A.; Gomaa, E.Z. Antimicrobial compounds produced by probiotic Lactobacillus brevis isolated from dairy products. Ann. Microbiol. 2013, 63, 81–90. [Google Scholar] [CrossRef]
- Kadam, J.H.; Pawar, R.S.; Din, M.F.M.; Zambare, V. Advances on Probiotics Utilization in Poultry Health and Nutrition. In Advances in Probiotics for Health and Nutrition; IntechOpen: London, UK, 2023. [Google Scholar]
- Hafez, H.M. Poultry meat and food safety: Pre–and post-harvest approaches to reduce foodborne pathogens. World’s Poult. Sci. J. 1999, 55, 269–280. [Google Scholar] [CrossRef]
- Naureen, Z.; Rehman, N.U.; Hussain, H.; Hussain, J.; Gilani, S.A.; Al Housni, S.K.; Mabood, F.; Khan, A.L.; Farooq, S.; Abbas, G.; et al. Exploring the potentials of Lysinibacillus sphaericus ZA9 for plant growth promotion and biocontrol activities against phytopathogenic fungi. Front. Microbiol. 2017, 8, 1477. [Google Scholar] [CrossRef]
- Saw, J.H.; Mountain, B.W.; Feng, L.; Omelchenko, M.V.; Hou, S.; Saito, J.A.; Stott, M.B.; Li, D.; Zhao, G.; Wu, J.; et al. Encapsulated in silica: Genome, proteome and physiology of the thermophilic bacterium Anoxybacillus flavithermus WK1. Genome Biol. 2008, 9, 1–16. [Google Scholar] [CrossRef] [PubMed]
- Mak, P.H.; Rehman, M.A.; Kiarie, E.G.; Topp, E.; Diarra, M.S. Production systems and important antimicrobial resistant-pathogenic bacteria in poultry: A review. J. Anim. Sci. Biotechnol. 2022, 13, 148. [Google Scholar] [CrossRef] [PubMed]
- Sanjorjo, R.A.; Tseten, T.; Kang, M.K.; Kwon, M.; Kim, S.W. In Pursuit of Understanding the Rumen Microbiome. Fermentation 2023, 9, 114. [Google Scholar] [CrossRef]
- Fusco, W.; Lorenzo, M.B.; Cintoni, M.; Porcari, S.; Rinninella, E.; Kaitsas, F.; Lener, E.; Mele, M.C.; Gasbarrini, A.; Collado, M.C.; et al. Short-Chain Fatty-Acid-Producing Bacteria: Key Components of the Human Gut Microbiota. Nutrients 2023, 15, 2211. [Google Scholar] [CrossRef] [PubMed]
- Zhao, Y.; Wei, H.M.; Yuan, J.L.; Xu, L.; Sun, J.Q. A comprehensive genomic analysis provides insights on the high environmental adaptability of Acinetobacter strains. Front. Microbiol. 2023, 14, 1177951. [Google Scholar] [CrossRef] [PubMed]
- Davies, A.R.; Board, R.; Board, R. Microbiology of Meat and Poultry; Springer Science & Business Media: Berlin/Heidelberg, Germany, 1998. [Google Scholar]
- Joshi, S.G.; Litake, G.M. Acinetobacter baumannii: An emerging pathogenic threat to public health. World J. Clin. Infect. Dis. 2013, 3, 25–36. [Google Scholar] [CrossRef]
- Samtiya, M.; Matthews, K.R.; Dhewa, T.; Puniya, A.K. Antimicrobial resistance in the food chain: Trends, mechanisms, pathways, and possible regulation strategies. Foods 2022, 11, 2966. [Google Scholar] [CrossRef] [PubMed]
- Calderon, R.B.; Jeong, C.; Ku, H.H.; Coghill, L.M.; Ju, Y.J.; Kim, N.; Ham, J.H. Changes in the microbial community in soybean plots treated with biochar and poultry litter. Agronomy 2021, 11, 1428. [Google Scholar] [CrossRef]
- Shah, D.H.; Board, M.M.; Crespo, R.; Guard, J.; Paul, N.C.; Faux, C. The occurrence of Salmonella, extended-spectrum β-lactamase producing Escherichia coli and carbapenem resistant non-fermenting Gram-negative bacteria in a backyard poultry flock environment. Zoonoses Public Health 2020, 67, 742–753. [Google Scholar] [CrossRef]
- Herrera, P.; Kwon, Y.M.; Ricke, S.C. Ecology and pathogenicity of gastrointestinal Streptococcus bovis. Anaerobe 2009, 15, 44–54. [Google Scholar] [CrossRef]
- Hyun, D.W.; Whon, T.W.; Cho, Y.J.; Chun, J.; Kim, M.S.; Jung, M.J.; Shin, N.R.; Kim, J.Y.; Kim, P.S.; Yun, J.H.; et al. Genome sequence of the moderately halophilic bacterium Salinicoccus carnicancri type strain Crm T (=DSM 23852 T). Stand. Genom. Sci. 2013, 8, 255–263. [Google Scholar] [CrossRef] [PubMed]
- Cycil, L.M.; DasSarma, S.; Pecher, W.; McDonald, R.; AbdulSalam, M.; Hasan, F. Metagenomic insights into the diversity of halophilic microorganisms indigenous to the Karak Salt Mine, Pakistan. Front. Microbiol. 2020, 11, 1567. [Google Scholar] [CrossRef] [PubMed]
- Klein, G. Taxonomy, ecology and antibiotic resistance of enterococci from food and the gastro-intestinal tract. Int. J. Food Microbiol. 2003, 88, 123–131. [Google Scholar] [CrossRef] [PubMed]
- Micallef, S.A.; Goldstein, R.E.R.; George, A.; Ewing, L.; Tall, B.D.; Boyer, M.S.; Joseph, S.W.; Sapkota, A.R. Diversity, distribution and antibiotic resistance of Enterococcus spp. recovered from tomatoes, leaves, water and soil on US Mid-Atlantic farms. Food Microbiol. 2013, 36, 465–474. [Google Scholar] [CrossRef]
- Bao, Y.; Dolfing, J.; Guo, Z.; Chen, R.; Wu, M.; Li, Z.; Lin, X.; Feng, Y. Important ecophysiological roles of non-dominant Actinobacteria in plant residue decomposition, especially in less fertile soils. Microbiome 2021, 9, 84. [Google Scholar] [CrossRef]

| Pre Harvest | Post Harvest | |||||
|---|---|---|---|---|---|---|
| Salmonella | Listeria | Campy | Salmonella | Listeria | Campy | |
| MLP | 0.79 | 0.67 | 0.84 | 0.78 | 0.87 | 0.95 |
| Multi-Head Transformer w/o scalar-to-vector embedding | 0.79 | 0.72 | 0.84 | 0.78 | 0.92 | 0.96 |
| Multi-Head Transformer w/ scalar-to-vector embedding | 0.78 | 0.71 | 0.84 | 0.83 | 0.91 | 0.97 |
| Multi-Head Transformer w/ scalar-to-vector embedding | 0.86 | 0.79 | 0.86 | 0.89 | 0.92 | 0.97 |
| Bacteria | Cluster |
|---|---|
| g__Rummeliibacillus | 2 |
| g__Salinicoccus | 2 |
| g__Enterococcus | 2 |
| g__Streptococcus | 2 |
| f__Enterobacteriaceae;g__ | 2 |
| g__Candidatus Nitrososphaera | 0 |
| o__iii1-15;f__;g__ | 0 |
| o__RB41;f__;g__ | 0 |
| f__Ellin6075;g__ | 0 |
| f__Gaiellaceae;g__ | 0 |
| o__Solirubrobacterales;f__;g__ | 0 |
| f__Solirubrobacteraceae;g__ | 0 |
| f__Cytophagaceae;g__ | 0 |
| o__Sphingobacteriales;f__;g__ | 0 |
| f__Chitinophagaceae;g__ | 0 |
| g__Bacillus | 0 |
| g__Rhodoplanes | 0 |
| o__Myxococcales;f__;g__ | 0 |
| g__DA101 | 0 |
Disclaimer/Publisher’s Note: The statements, opinions and data contained in all publications are solely those of the individual author(s) and contributor(s) and not of MDPI and/or the editor(s). MDPI and/or the editor(s) disclaim responsibility for any injury to people or property resulting from any ideas, methods, instructions or products referred to in the content. |
© 2024 by the authors. Licensee MDPI, Basel, Switzerland. This article is an open access article distributed under the terms and conditions of the Creative Commons Attribution (CC BY) license (https://creativecommons.org/licenses/by/4.0/).
Share and Cite
Ram Das, A.; Pillai, N.; Nanduri, B.; Rothrock, M.J., Jr.; Ramkumar, M. Exploring Pathogen Presence Prediction in Pastured Poultry Farms through Transformer-Based Models and Attention Mechanism Explainability. Microorganisms 2024, 12, 1274. https://doi.org/10.3390/microorganisms12071274
Ram Das A, Pillai N, Nanduri B, Rothrock MJ Jr., Ramkumar M. Exploring Pathogen Presence Prediction in Pastured Poultry Farms through Transformer-Based Models and Attention Mechanism Explainability. Microorganisms. 2024; 12(7):1274. https://doi.org/10.3390/microorganisms12071274
Chicago/Turabian StyleRam Das, Athish, Nisha Pillai, Bindu Nanduri, Michael J. Rothrock, Jr., and Mahalingam Ramkumar. 2024. "Exploring Pathogen Presence Prediction in Pastured Poultry Farms through Transformer-Based Models and Attention Mechanism Explainability" Microorganisms 12, no. 7: 1274. https://doi.org/10.3390/microorganisms12071274
APA StyleRam Das, A., Pillai, N., Nanduri, B., Rothrock, M. J., Jr., & Ramkumar, M. (2024). Exploring Pathogen Presence Prediction in Pastured Poultry Farms through Transformer-Based Models and Attention Mechanism Explainability. Microorganisms, 12(7), 1274. https://doi.org/10.3390/microorganisms12071274