
Comparing the Microbiome of the Adenoids in Children with Secretory Otitis Media and Children without Middle Ear Effusion
 , , , , and
Abstract
:1. Introduction
2. Materials and Methods
2.1. Ethics Statement
2.2. Patient Selection, Inclusion, and Exclusion Criteria
2.2.1. Inclusion Criteria
- Patients 3 to 7 years old.
- Endoscopic findings—second/third/fourth-grade adenoid hyperplasia and/or computed tomography/magnetic resonance imaging findings.
- Tympanometry findings for the otitis media with effusion group—B type tympanogram either bilaterally or unilaterally.
- Tympanometry findings for the group with no middle ear effusion—A type tympanometry, strictly bilaterally.
- Operation under general anesthesia.
- Patients and their representatives agreed to participate in our research and sign an informed consent.
2.2.2. Exclusion Criteria
- Patients older or younger than our designated age gap.
- Patients and/or their representatives did not agree to participate in the study.
- Patients traveling to Latvia from other countries for the operation.
- Patients with signs of acute upper respiratory infectious disease (elevated temperature, cough, nasal purulent discharge, painful swallowing, objective signs of throat mucosal hyperemia and tonsillar exudate) as well as acute middle ear infections.
- Patients receiving or have received antibiotic treatment over the last two weeks.
- Immunocompromised patients: HIV positive/AIDS patients, hepatitis A/B/C, patients, patients undergoing chemotherapy due to oncological diseases, diabetes mellitus patients, patients with chronic autoimmune diseases (sarcoidosis, Wegner’s granulomatosis).
- Patients receiving or having received probiotics or any other microbiome-altering substances.
- Patients with congenital cleft malformations.
2.3. Material Collection
2.4. Sample Processing and Sequencing
2.5. Data Analysis
3. Results
3.1. Population Statistics
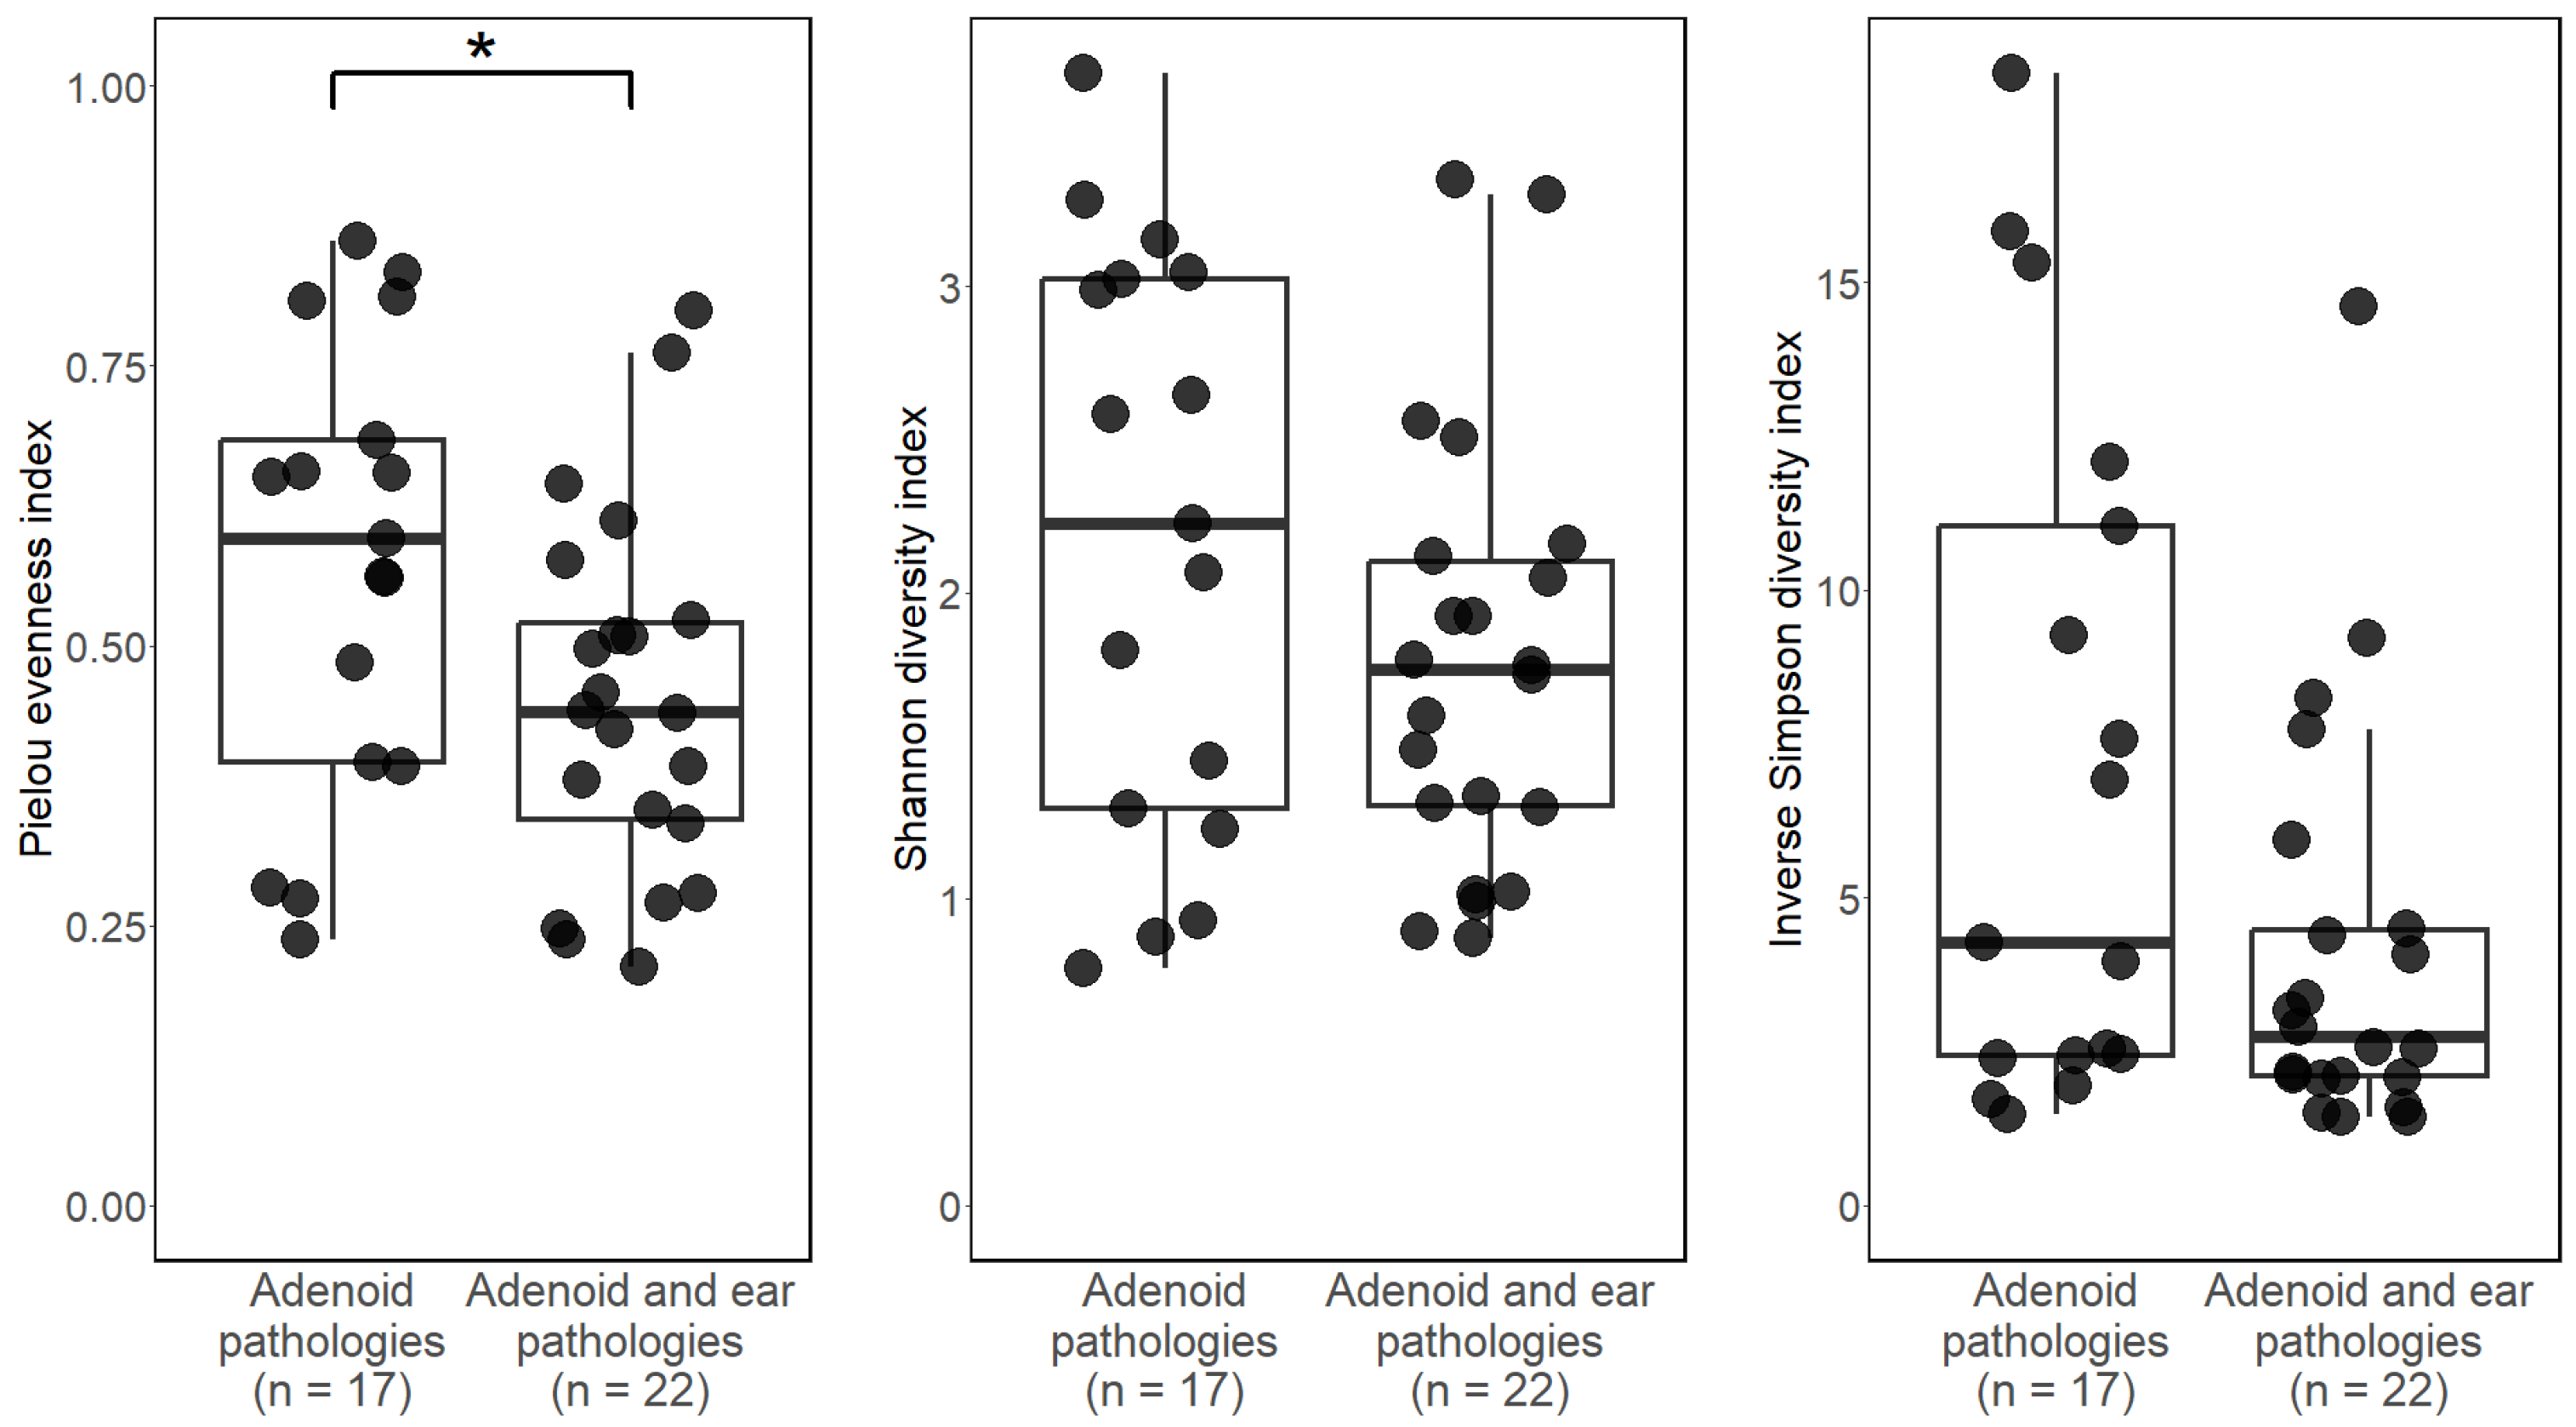
3.2. Alpha Diversity
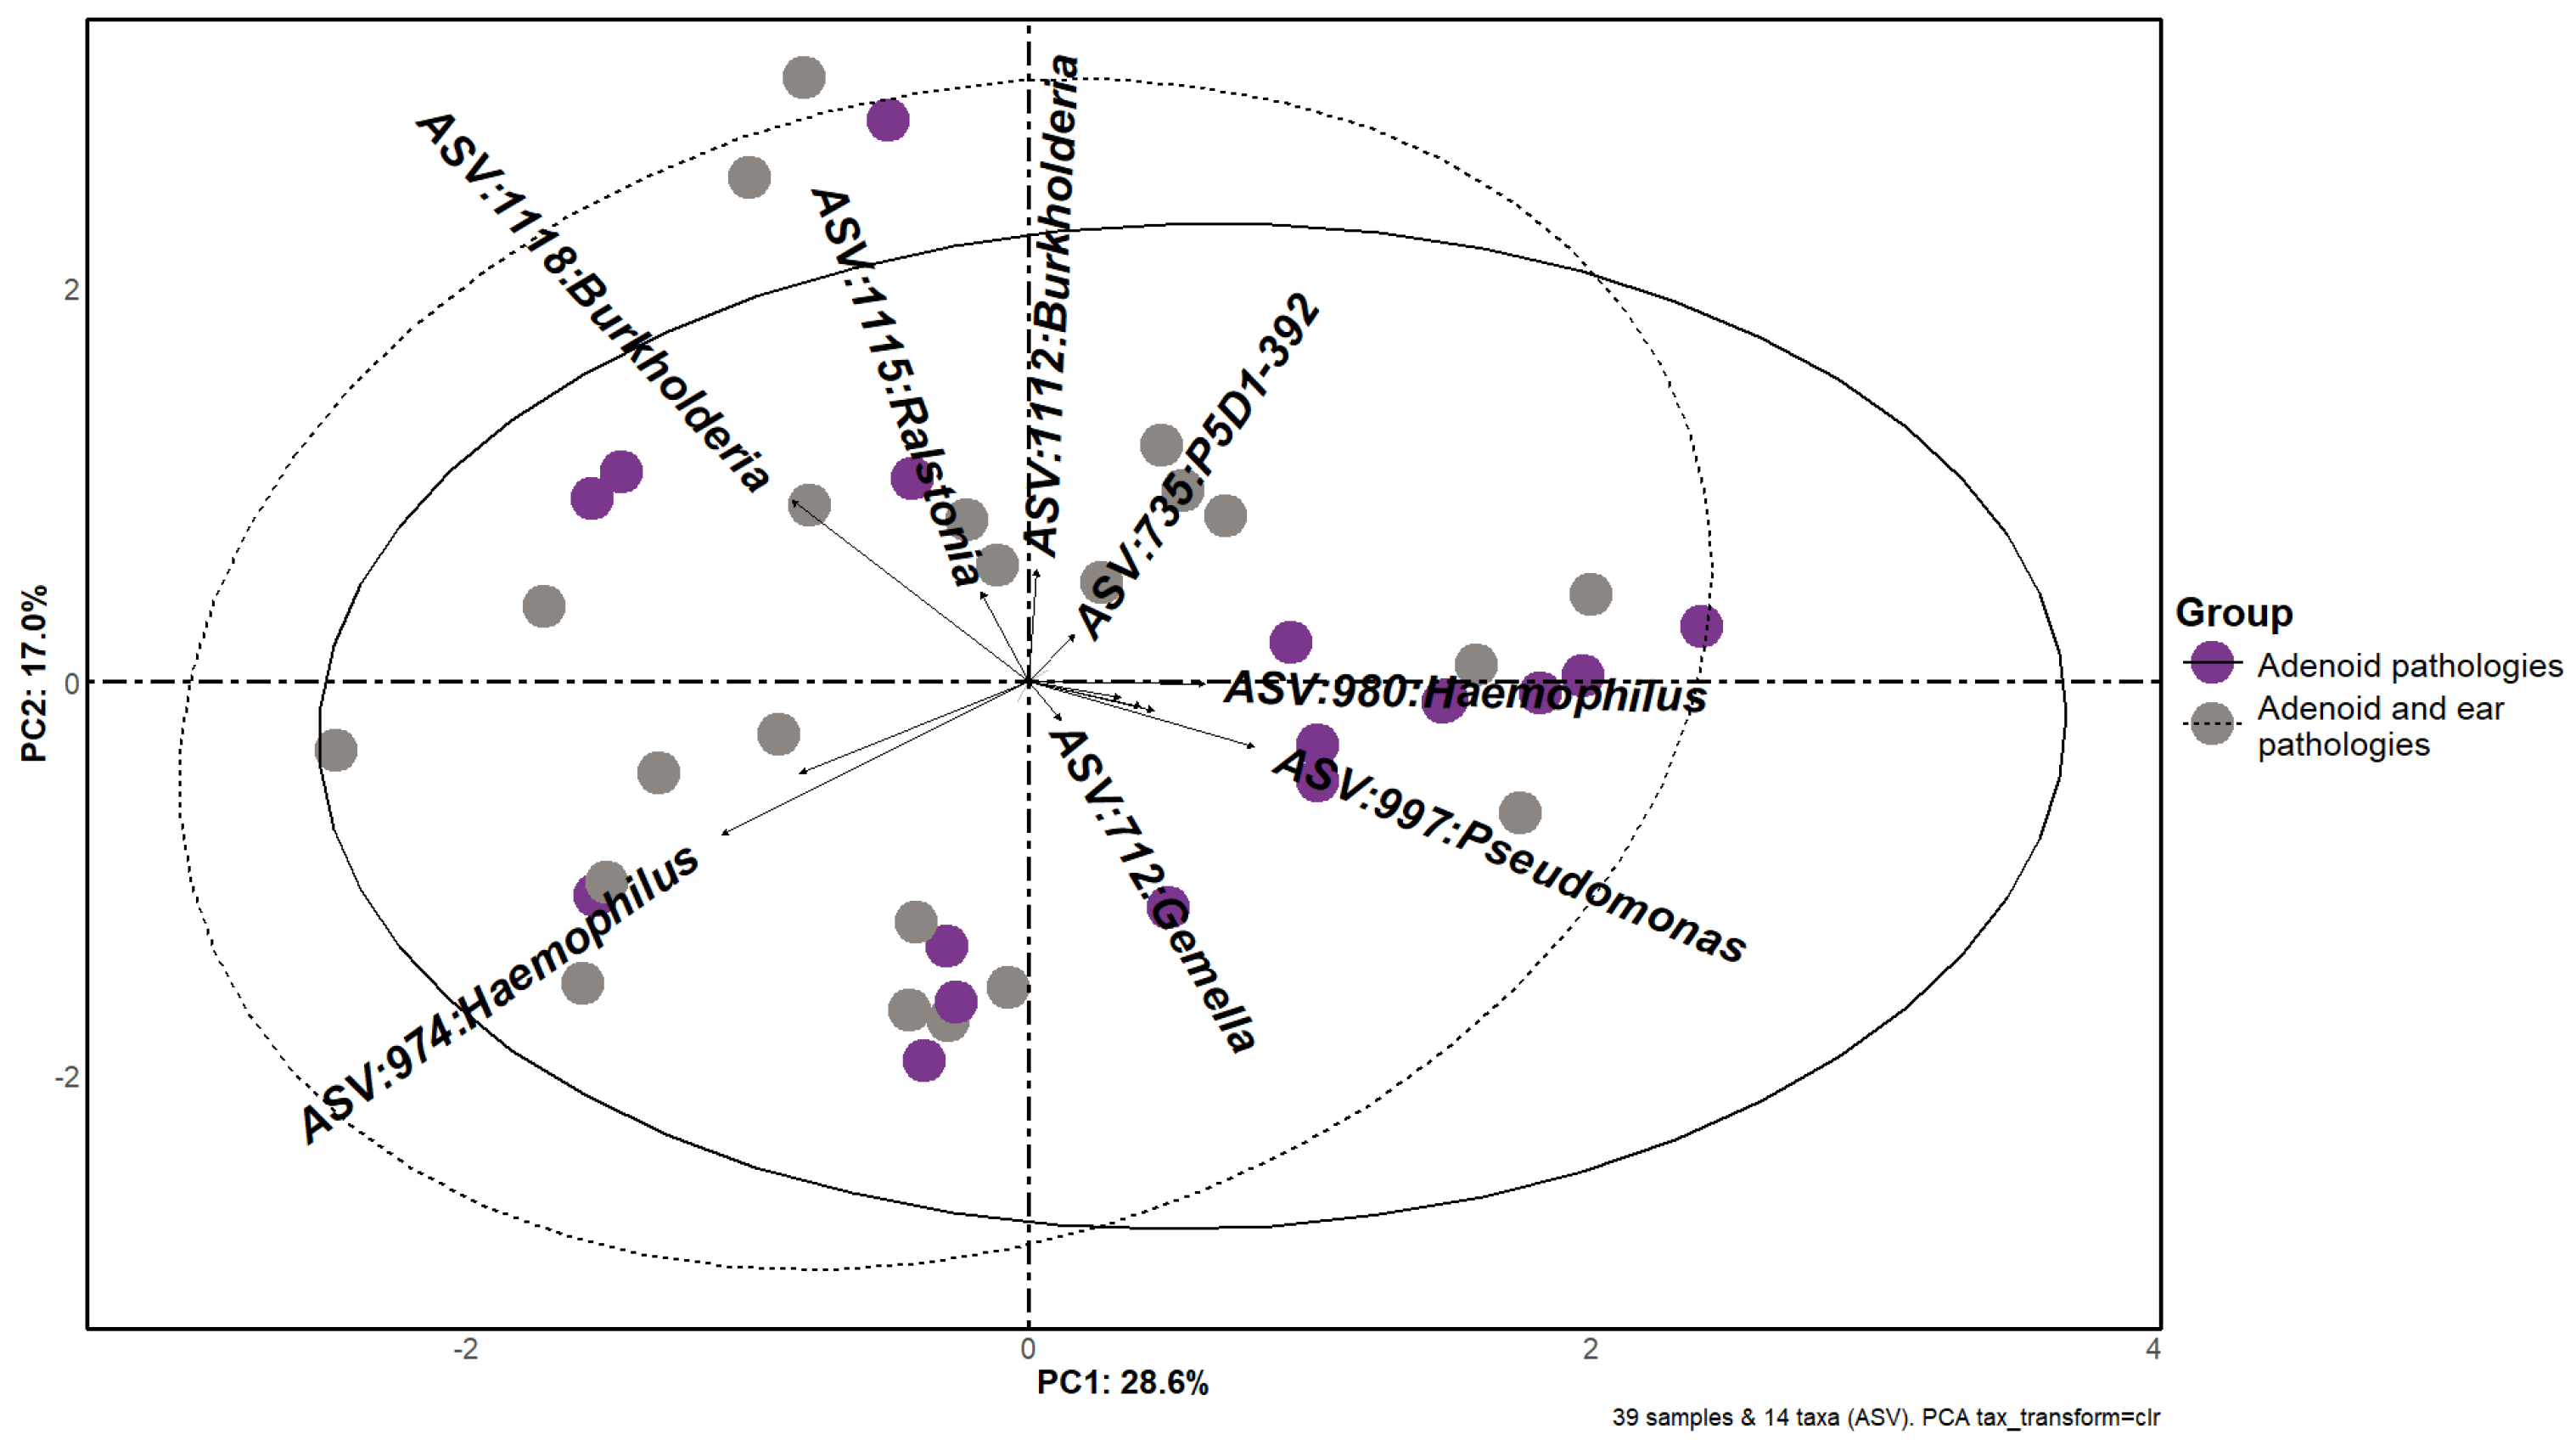
3.3. Beta Diversity
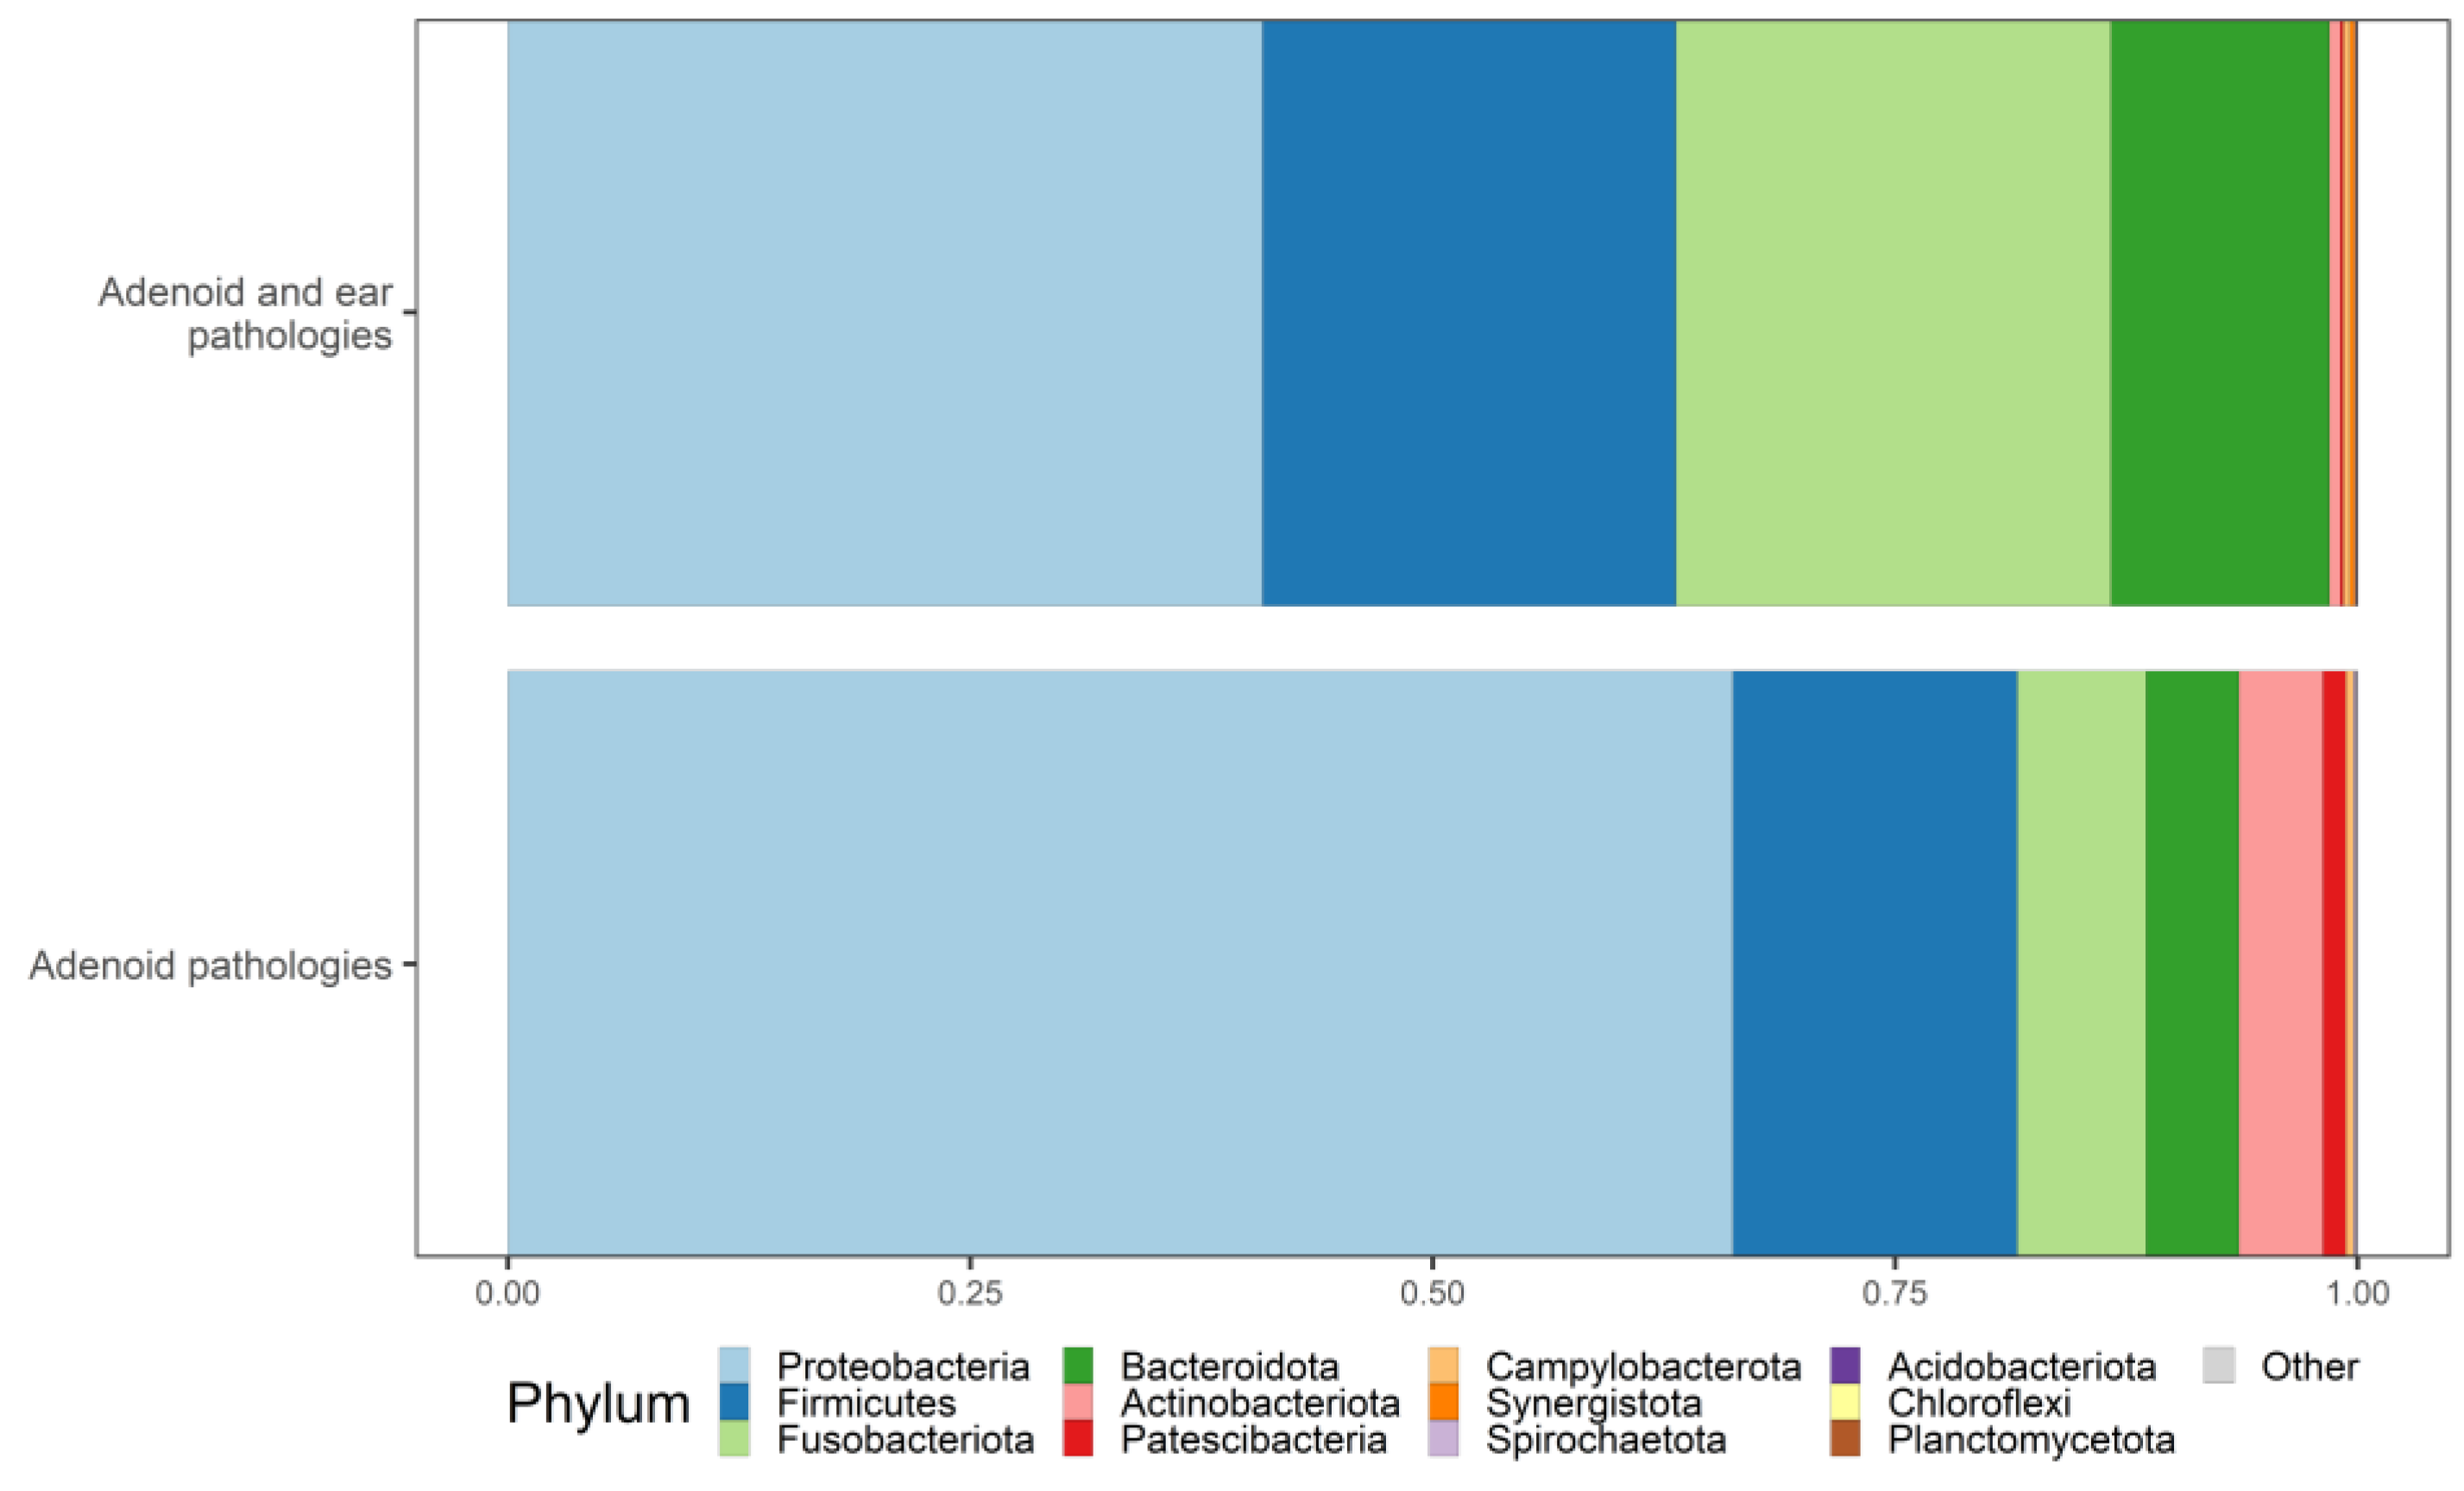
3.4. Taxonomy
3.5. Differential Abundance
4. Discussion
5. Conclusions
Author Contributions
Funding
Data Availability Statement
Conflicts of Interest
References
- Kumpitsch, C.; Koskinen, K.; Schöpf, V.; Moissl-Eichinger, C. The microbiome of the upper respiratory tract in health and disease. BMC Biol. 2019, 17, 87. [Google Scholar] [CrossRef] [PubMed]
- Huang, C.-C.; Chang, T.-H.; Lee, C.-Y.; Wu, P.-W.; Chen, C.-L.; Lee, T.-J.; Liou, M.-L.; Chiu, C.-H. Tissue microbiota in nasopharyngeal adenoid and its association with pneumococcal carriage. Microb. Pathog. 2021, 157, 104999. [Google Scholar] [CrossRef] [PubMed]
- Proctor, D.M.; Relman, D.A. The Landscape Ecology and Microbiota of the Human Nose, Mouth, and Throat. Cell Host Microbe 2017, 21, 421–432. [Google Scholar] [CrossRef] [PubMed]
- Xu, J.; Dai, W.; Liang, Q.; Ren, D. The microbiomes of adenoid and middle ear in children with otitis media with effusion and hypertrophy from a tertiary hospital in China. Int. J. Pediatr. Otorhinolaryngol. 2020, 134, 110058. [Google Scholar] [CrossRef] [PubMed]
- Samara, P.; Athanasopoulos, M.; Athanasopoulos, I. Unveiling the Enigmatic Adenoids and Tonsils: Exploring Immunology, Physiology, Microbiome Dynamics, and the Transformative Power of Surgery. Microorganisms 2023, 11, 1624. [Google Scholar] [CrossRef] [PubMed]
- Rosenfeld, R.M.; Shin, J.J.; Schwartz, S.R.; Coggins, R.; Gagnon, L.; Hackell, J.M.; Hoelting, D.; Hunter, L.L.; Kummer, A.W.; Payne, S.C.; et al. Clinical Practice Guideline: Otitis Media with Effusion (Update). Otolaryngol.–Head Neck Surg. 2016, 154, S1–S41. [Google Scholar] [CrossRef] [PubMed]
- Paradise, J.L. Otitis Media in Infants and Children. Pediatrics 1980, 65, 917–943. [Google Scholar] [CrossRef] [PubMed]
- Stool, S.E. Otitis Media with Effusion in Young Children; US Department of Health and Human Services: Washington, DC, USA, 1994. [Google Scholar]
- Williamson, I.G.; Dunleavey, J.; Bain, J.; Robinson, D. The natural history of otitis media with effusion—A three-year study of the incidence and prevalence of abnormal tympanograms in four South West Hampshire Infant and First schools. J. Laryngol. Otol. 1994, 108, 930–934. [Google Scholar] [CrossRef] [PubMed]
- Almonacid, D.E.; Kraal, L.; Ossandon, F.J.; Budovskaya, Y.V.; Cardenas, J.P.; Bik, E.M.; Goddard, A.D.; Richman, J.; Apte, Z.S. 16S rRNA gene sequencing and healthy reference ranges for 28 clinically relevant microbial taxa from the human gut microbiome. PLoS ONE 2017, 12, e0176555. [Google Scholar] [CrossRef]
- Buetas, E.; Jordán-López, M.; López-Roldán, A.; D’Auria, G.; Martínez-Priego, L.; De Marco, G.; Carda-Diéguez, M.; Mira, A. Full-length 16S rRNA gene sequencing by PacBio improves taxonomic resolution in human microbiome samples. BMC Genom. 2024, 25, 310. [Google Scholar] [CrossRef]
- Yang, A.; Jv, M.; Zhang, J.; Hu, Y.; Mi, J.; Hong, H. Analysis of Risk Factors for Otitis Media with Effusion in Children with Adenoid Hypertrophy. Risk Manag. Healthc. Policy 2023, 16, 301–308. [Google Scholar] [CrossRef] [PubMed]
- Regueira-Iglesias, A.; Vázquez-González, L.; Balsa-Castro, C.; Vila-Blanco, N.; Blanco-Pintos, T.; Tamames, J.; Carreira, M.J.; Tomás, I. In silico evaluation and selection of the best 16S rRNA gene primers for use in next-generation sequencing to detect oral bacteria and archaea. Microbiome 2023, 11, 58. [Google Scholar] [CrossRef] [PubMed]
- Ewels, P.; Magnusson, M.; Lundin, S.; Käller, M. MultiQC: Summarize analysis results for multiple tools and samples in a single report. Bioinformatics 2016, 32, 3047–3048. [Google Scholar] [CrossRef] [PubMed]
- Masella, A.P.; Bartram, A.K.; Truszkowski, J.M.; Brown, D.G.; Neufeld, J.D. PANDAseq: Paired-end assembler for illumina sequences. BMC Bioinform. 2012, 13, 31. [Google Scholar] [CrossRef] [PubMed]
- Bolyen, E.; Rideout, J.R.; Dillon, M.R.; Bokulich, N.A.; Abnet, C.C.; Al-Ghalith, G.A.; Alexander, H.; Alm, E.J.; Arumugam, M.; Asnicar, F.; et al. Reproducible, interactive, scalable and extensible microbiome data science using QIIME 2. Nat. Biotechnol. 2019, 37, 852–857. [Google Scholar] [CrossRef] [PubMed]
- Callahan, B.J.; McMurdie, P.J.; Rosen, M.J.; Han, A.W.; Johnson, A.J.A.; Holmes, S.P. DADA2: High-resolution sample inference from Illumina amplicon data. Nat. Methods 2016, 13, 581–583. [Google Scholar] [CrossRef] [PubMed]
- Quast, C.; Pruesse, E.; Yilmaz, P.; Gerken, J.; Schweer, T.; Yarza, P.; Peplies, J.; Glöckner, F.O. The SILVA ribosomal RNA gene database project: Improved data processing and web-based tools. Nucleic Acids Res. 2012, 41, D590–D596. [Google Scholar] [CrossRef] [PubMed]
- Davis, N.M.; Proctor, D.M.; Holmes, S.P.; Relman, D.A.; Callahan, B.J. Simple statistical identification and removal of contaminant sequences in marker-gene and metagenomics data. Microbiome 2018, 6, 226. [Google Scholar] [CrossRef] [PubMed]
- McMurdie, P.J.; Holmes, S. phyloseq: An R Package for Reproducible Interactive Analysis and Graphics of Microbiome Census Data. PLoS ONE 2013, 8, e61217. [Google Scholar] [CrossRef]
- Lin, H.; Peddada, S.D. Analysis of compositions of microbiomes with bias correction. Nat. Commun. 2020, 11, 3514. [Google Scholar] [CrossRef]
- Mallick, H.; Rahnavard, A.; McIver, L.J.; Ma, S.; Zhang, Y.; Nguyen, L.H.; Tickle, T.L.; Weingart, G.; Ren, B.; Schwager, E.H.; et al. Multivariable association discovery in population-scale meta-omics studies. PLoS Comput Biol. 2021, 17, e1009442. [Google Scholar] [CrossRef] [PubMed]
- Khoramrooz, S.S.; Mirsalehian, A.; Emaneini, M.; Jabalameli, F.; Aligholi, M.; Saedi, B.; Bazargani, A.; Taherikalani, M.; Borghaei, P.; Razmpa, E. Frequency of Alloicoccus otitidis, Streptococcus pneumoniae, Moraxella catarrhalis and Haemophilus influenzae in children with otitis media with effusion (OME) in Iranian patients. Auris Nasus Larynx 2012, 39, 369–373. [Google Scholar] [CrossRef] [PubMed]
- Johnston, J.; Hoggard, M.; Biswas, K.; Astudillo-García, C.; Radcliff, F.J.; Mahadevan, M.; Douglas, R.G. Paired analysis of the microbiota between surface tissue swabs and biopsies from pediatric patients undergoing adenotonsillectomy. Int. J. Pediatr. Otorhinolaryngol. 2018, 113, 51–57. [Google Scholar] [CrossRef]
- Sokolovs-Karijs, O.; Brīvība, M.; Saksis, R.; Sumeraga, G.; Girotto, F.; Erts, R.; Osīte, J.; Krūmiņa, A. An Overview of Adenoid Microbiome Using 16S rRNA Gene Sequencing-Based Metagenomic Analysis. Medicina 2022, 58, 920. [Google Scholar] [CrossRef] [PubMed]
- Sokolovs-Karijs, O.; Brīvība, M.; Saksis, R.; Rozenberga, M.; Girotto, F.; Osīte, J.; Reinis, A.; Sumeraga, G.; Krūmiņa, A. Identifying the Microbiome of the Adenoid Surface of Children Suffering from Otitis Media with Effusion and Children without Middle Ear Effusion Using 16S rRNA Genetic Sequencing. Microorganisms 2023, 11, 1955. [Google Scholar] [CrossRef]
- Katundu, D.R.; Chussi, D.; van der Gaast-de Jongh, C.E.; Rovers, M.M.; de Jonge, M.I.; Hannink, G.; van Heerbeek, N. Bacterial colonisation of surface and core of palatine tonsils among Tanzanian children with recurrent chronic tonsillitis and obstructive sleep apnoea who underwent (adeno)tonsillectomy. J. Laryngol. Otol. 2024, 138, 89–92. [Google Scholar] [CrossRef] [PubMed]
- Brook, I.; Foote, P.A. Isolation of methicillin resistant Staphylococcus aureus from the surface and core of tonsils in children. Int. J. Pediatr. Otorhinolaryngol. 2006, 70, 2099–2102. [Google Scholar] [CrossRef]
- Coticchia, J.; Zuliani, G.; Coleman, C.; Carron, M.; Gurrola, J., II; Haupert, M.; Berk, R. Biofilm Surface Area in the Pediatric Nasopharynx: Chronic Rhinosinusitis vs Obstructive Sleep Apnea. Arch. Otolaryngol.–Head Neck Surg. 2007, 133, 110–114. [Google Scholar] [CrossRef] [PubMed]
- Lewis, K. Riddle of biofilm resistance. Antimicrob. Agents Chemother. 2001, 45, 999–1007. [Google Scholar] [CrossRef]
- Zuliani, G.; Carron, M.; Gurrola, J.; Coleman, C.; Haupert, M.; Berk, R.; Coticchia, J. Identification of adenoid biofilms in chronic rhinosinusitis. Int. J. Pediatr. Otorhinolaryngol. 2006, 70, 1613–1617. [Google Scholar] [CrossRef]
- Brambilla, I.; Pusateri, A.; Pagella, F.; Caimmi, D.; Caimmi, S.; Licari, A.; Barberi, S.; Castellazzi, A.M.; Marseglia, G.L. Adenoids in children: Advances in immunology, diagnosis, and surgery. Clin. Anat. 2014, 27, 346–352. [Google Scholar] [CrossRef] [PubMed]
- Chen, W.; Yin, G.; Chen, Y.; Wang, L.; Wang, Y.; Zhao, C.; Wang, W.; Ye, J. Analysis of factors that influence the occurrence of otitis media with effusion in pediatric patients with adenoid hypertrophy. Front. Pediatr. 2023, 11, 1098067. [Google Scholar] [CrossRef] [PubMed]
- Stapleton, A.L.; Shaffer, A.D.; Morris, A.; Li, K.; Fitch, A.; Methé, B.A. The microbiome of pediatric patients with chronic rhinosinusitis. Int. Forum Allergy Rhinol. 2021, 11, 31–39. [Google Scholar] [CrossRef]
- Uhliarová, B.; Bugová, G.; Jeseňák, M.; Pechacova, S.; Hamarova, M.; Hajtman, A. The effect of adenotomy, allergy and smoking on microbial colonization of upper aerodigestive tract in children. Epidemiol. Mikrobiol. Imunol. 2017, 66, 67–72. [Google Scholar] [PubMed]
- Marseglia, G.L.; Poddighe, D.; Caimmi, D.; Marseglia, A.; Caimmi, S.; Ciprandi, G.; Klersy, C.; Pagella, F.; Castellazzi, A.M. Role of adenoids and adenoiditis in children with allergy and otitis media. Curr. Allergy Asthma Rep. 2009, 9, 460–464. [Google Scholar] [CrossRef]
- Fearon, M.; Bannatyne, R.M.; Fearon, B.W.; Turner, A.; Cheung, R. Differential bacteriology in adenoid disease. J. Otolaryngol. 1992, 21, 434–436. [Google Scholar] [PubMed]
- Kuhn, J.J.; Brook, I.; Waters, C.L.; Church, L.W.; Bianchi, D.A.; Thompson, D.H. Quantitative bacteriology of tonsils removed from children with tonsillitis hypertrophy and recurrent tonsillitis with and without hypertrophy. Ann. Otol. Rhinol. Laryngol. 1995, 104, 646–652. [Google Scholar] [CrossRef]
- Kosikowska, U.; Korona-Głowniak, I.; Niedzielski, A.; Malm, A. Nasopharyngeal and Adenoid Colonization by Haemophilus influenzae and Haemophilus parainfluenzae in Children Undergoing Adenoidectomy and the Ability of Bacterial Isolates to Biofilm Production. Medicine 2015, 94, e799. [Google Scholar] [CrossRef]
- Levine, O.S.; Knoll, M.D.; Jones, A.; Walker, D.G.; Risko, N.; Gilani, Z. Global status of Haemophilus influenzae type b and pneumococcal conjugate vaccines: Evidence, policies, and introductions. Curr. Opin. Infect. Dis. 2010, 23, 236–241. [Google Scholar] [CrossRef]
- Laupland, K.B.; Schønheyder, H.C.; Østergaard, C.; Knudsen, J.D.; Valiquette, L.; Galbraith, J.; Kennedy, K.J.; Gradel, K.O. Epidemiology of Haemophilus influenzae bacteremia: A multi-national population-based assessment. J. Infect. 2011, 62, 142–148. [Google Scholar] [CrossRef]
- Barkai, G.; Leibovitz, E.; Givon-Lavi, N.; Dagan, R. Potential contribution by nontypable Haemophilus influenzae in protracted and recurrent acute otitis media. Pediatr. Infect. Dis. J. 2009, 28, 466–471. [Google Scholar] [CrossRef] [PubMed]
- Gkentzi, D.; Slack, M.P.; Ladhani, S.N. The burden of nonencapsulated Haemophilus influenzae in children and potential for prevention. Curr. Opin. Infect. Dis. 2012, 25, 266–272. [Google Scholar] [CrossRef] [PubMed]
- Bernstein, J.M.; Sagahtaheri-Altaie, S.; Dryja, D.M.; Wactawski-Wende, J. Bacterial interference in nasopharyngeal bacterial flora of otitis-prone and non-otitis-prone children. Acta Otorhinolaryngol. Belg. 1994, 48, 1–9. [Google Scholar] [PubMed]
- Downes, J.; Dewhirst, F.E.; Tanner, A.C.R.; Wade, W.G. Description of Alloprevotella rava gen. nov., sp. nov., isolated from the human oral cavity, and reclassification of Prevotella tannerae Moore et al. 1994 as Alloprevotella tannerae gen. nov., comb. nov. Int. J. Syst. Evol. Microbiol. 2013, 63, 1214–1218. [Google Scholar] [CrossRef] [PubMed]
- Ulger Toprak, N.; Duman, N.; Sacak, B.; Ozkan, M.C.; Sayın, E.; Mulazimoglu, L.; Soyletir, G. Alloprevotella rava isolated from a mixed infection of an elderly patient with chronic mandibular osteomyelitis mimicking oral squamous cell carcinoma. New Microbes New Infect. 2021, 42, 100880. [Google Scholar] [CrossRef] [PubMed]
- Liu, Y.; Wang, H.; Jiang, H.; Sun, Z.; Sun, A. Alloprevotella Can be Considered as a Potential Oral Biomarker in Intestinal Metaphase of Gastric Patients. Stud. Health Technol. Inf. 2023, 308, 155–167. [Google Scholar] [CrossRef]
- Zhang, Y.; Fan, K.; Li, L.; He, J.; Sun, Y. Peptostreptococcus anaerobius is a potential diagnostic biomarker of colorectal cancer. Cell Mol. Biol. (Noisy-Le-Grand) 2023, 69, 244–247. [Google Scholar] [CrossRef] [PubMed]
- Rams, T.E.; Feik, D.; Listgarten, M.A.; Slots, J. Peptostreptococcus micros in human periodontitis. Oral Microbiol. Immunol. 1992, 7, 1–6. [Google Scholar] [CrossRef] [PubMed]
- Costa, C.; Santiago, M.; Ferreira, J.; Rodrigues, M.; Carvalho, P.; Silva, J.; Malcata, A. Septic arthritis caused by Peptostreptococcus asaccharolyticus. Acta Reumatol. Port. 2016, 41, 271–272. [Google Scholar] [PubMed]
- Sclafani, A.P.; Ginsburg, J.; Shah, M.K.; Dolitsky, J.N. Treatment of symptomatic chronic adenotonsillar hypertrophy with amoxicillin/clavulanate potassium: Short- and long-term results. Pediatrics 1998, 101, 675–681. [Google Scholar] [CrossRef]
- Jesic, S.; Stojiljkovic, L.; Petrovic, Z.; Djordjevic, V.; Nesic, V.; Stosic, S. Alteration of adenoid tissue alkaline and acid phosphatase in children with secretory otitis media. Int. J. Pediatr. Otorhinolaryngol. 2006, 70, 1069–1076. [Google Scholar] [CrossRef] [PubMed]
- Johnston, J.J.; Douglas, R. Adenotonsillar microbiome: An update. Postgrad. Med. J. 2018, 94, 398–403. [Google Scholar] [CrossRef] [PubMed]
- Mehrotra, P.; Somu, L. Bacteriology of Adenoids and Tonsils in Children With Recurrent Adenotonsillitis. Cureus 2023, 15, e47650. [Google Scholar] [CrossRef] [PubMed]
- Zuo, L.; He, L.; Huang, A.; Liu, Y.; Zhang, A.; Wang, L.; Song, Y.; Geng, J. Risk factors and antibiotic sensitivity of aerobic bacteria in Chinese children with adenoid hypertrophy. BMC Pediatr. 2022, 22, 553. [Google Scholar] [CrossRef]


| Name | Sequence |
|---|---|
| ci5_16S_V3_Fw(341F) | TCGTCGGCAGCGTCAGATGTGTATAAGAGACAGNNNNNNCCTACGGGNGGCWGCAG |
| ci7_16S_V4_Rs(805R) | GTCTCGTGGGCTCGGAGATGTGTATAAGAGACAGNNNNNNGACTACHVGGGTATCTAATCC |
| N | Mean | SD | Shapiro–Wilk | S-W p-Value | |
|---|---|---|---|---|---|
| Age | 40 | 4.45 | 1.45 | 0.837 | <0.01 |
| Group 1—No Middle Ear Effusion | Group 2—Secretory Otitis Media | |
|---|---|---|
| Gender | Male—15 participants | Male—8 participants |
| Female—5 participants | Female—12 participants | |
| Age | 3 years old—6 participants | 3 years old—8 participants |
| 4 years old—5 participants | 4 years old—5 participants | |
| 5 years old—3 participants | 5 years old—3 participants | |
| 6 years old—2 participants | 6 years old—2 participants | |
| 7 years old—4 participants | 7 years old—2 participants |
| Genus | Group | Coefficient | Standard Error | p-Value | p-Value (adj.) |
|---|---|---|---|---|---|
| Alloprevotella | Middle ear effusion | 2.71 | 0.82 | 9.61 × 10⁻⁴ | 0.0543 |
| Peptostreptococcus | Middle ear effusion | 3.53 | 1.13 | 1.80 × 10⁻³ | 0.054 |
| Porphyromonas | Middle ear effusion | 1.77 | 0.70 | 1.12 × 10⁻² | 0.168 |
| Johnsonella | Middle ear effusion | 4.43 | 1.71 | 9.58 × 10⁻³ | 0.168 |
| Parvimonas | Middle ear effusion | 2.94 | 1.31 | 2.49 × 10⁻² | 0.249 |
| Bordetella | Middle ear effusion | 4.75 | 2.10 | 2.35 × 10⁻² | 0.249 |
Disclaimer/Publisher’s Note: The statements, opinions and data contained in all publications are solely those of the individual author(s) and contributor(s) and not of MDPI and/or the editor(s). MDPI and/or the editor(s) disclaim responsibility for any injury to people or property resulting from any ideas, methods, instructions or products referred to in the content. |
© 2024 by the authors. Licensee MDPI, Basel, Switzerland. This article is an open access article distributed under the terms and conditions of the Creative Commons Attribution (CC BY) license (https://creativecommons.org/licenses/by/4.0/).
Share and Cite
Sokolovs-Karijs, O.; Brīvība, M.; Saksis, R.; Rozenberga, M.; Bunka, L.; Girotto, F.; Osīte, J.; Reinis, A.; Sumeraga, G.; Krūmiņa, A. Comparing the Microbiome of the Adenoids in Children with Secretory Otitis Media and Children without Middle Ear Effusion. Microorganisms 2024, 12, 1523. https://doi.org/10.3390/microorganisms12081523
Sokolovs-Karijs O, Brīvība M, Saksis R, Rozenberga M, Bunka L, Girotto F, Osīte J, Reinis A, Sumeraga G, Krūmiņa A. Comparing the Microbiome of the Adenoids in Children with Secretory Otitis Media and Children without Middle Ear Effusion. Microorganisms. 2024; 12(8):1523. https://doi.org/10.3390/microorganisms12081523
Chicago/Turabian StyleSokolovs-Karijs, Oļegs, Monta Brīvība, Rihards Saksis, Maija Rozenberga, Laura Bunka, Francesca Girotto, Jana Osīte, Aigars Reinis, Gunta Sumeraga, and Angelika Krūmiņa. 2024. "Comparing the Microbiome of the Adenoids in Children with Secretory Otitis Media and Children without Middle Ear Effusion" Microorganisms 12, no. 8: 1523. https://doi.org/10.3390/microorganisms12081523