

Determination of the De Novo Minimum Selection Concentration of Trimethoprim In Vivo for Escherichia coli Using Galleria mellonella: A Pilot Study

 , , and
Abstract
:1. Introduction
2. Materials and Methods
2.1. Bacterial Strains and Growth Conditions
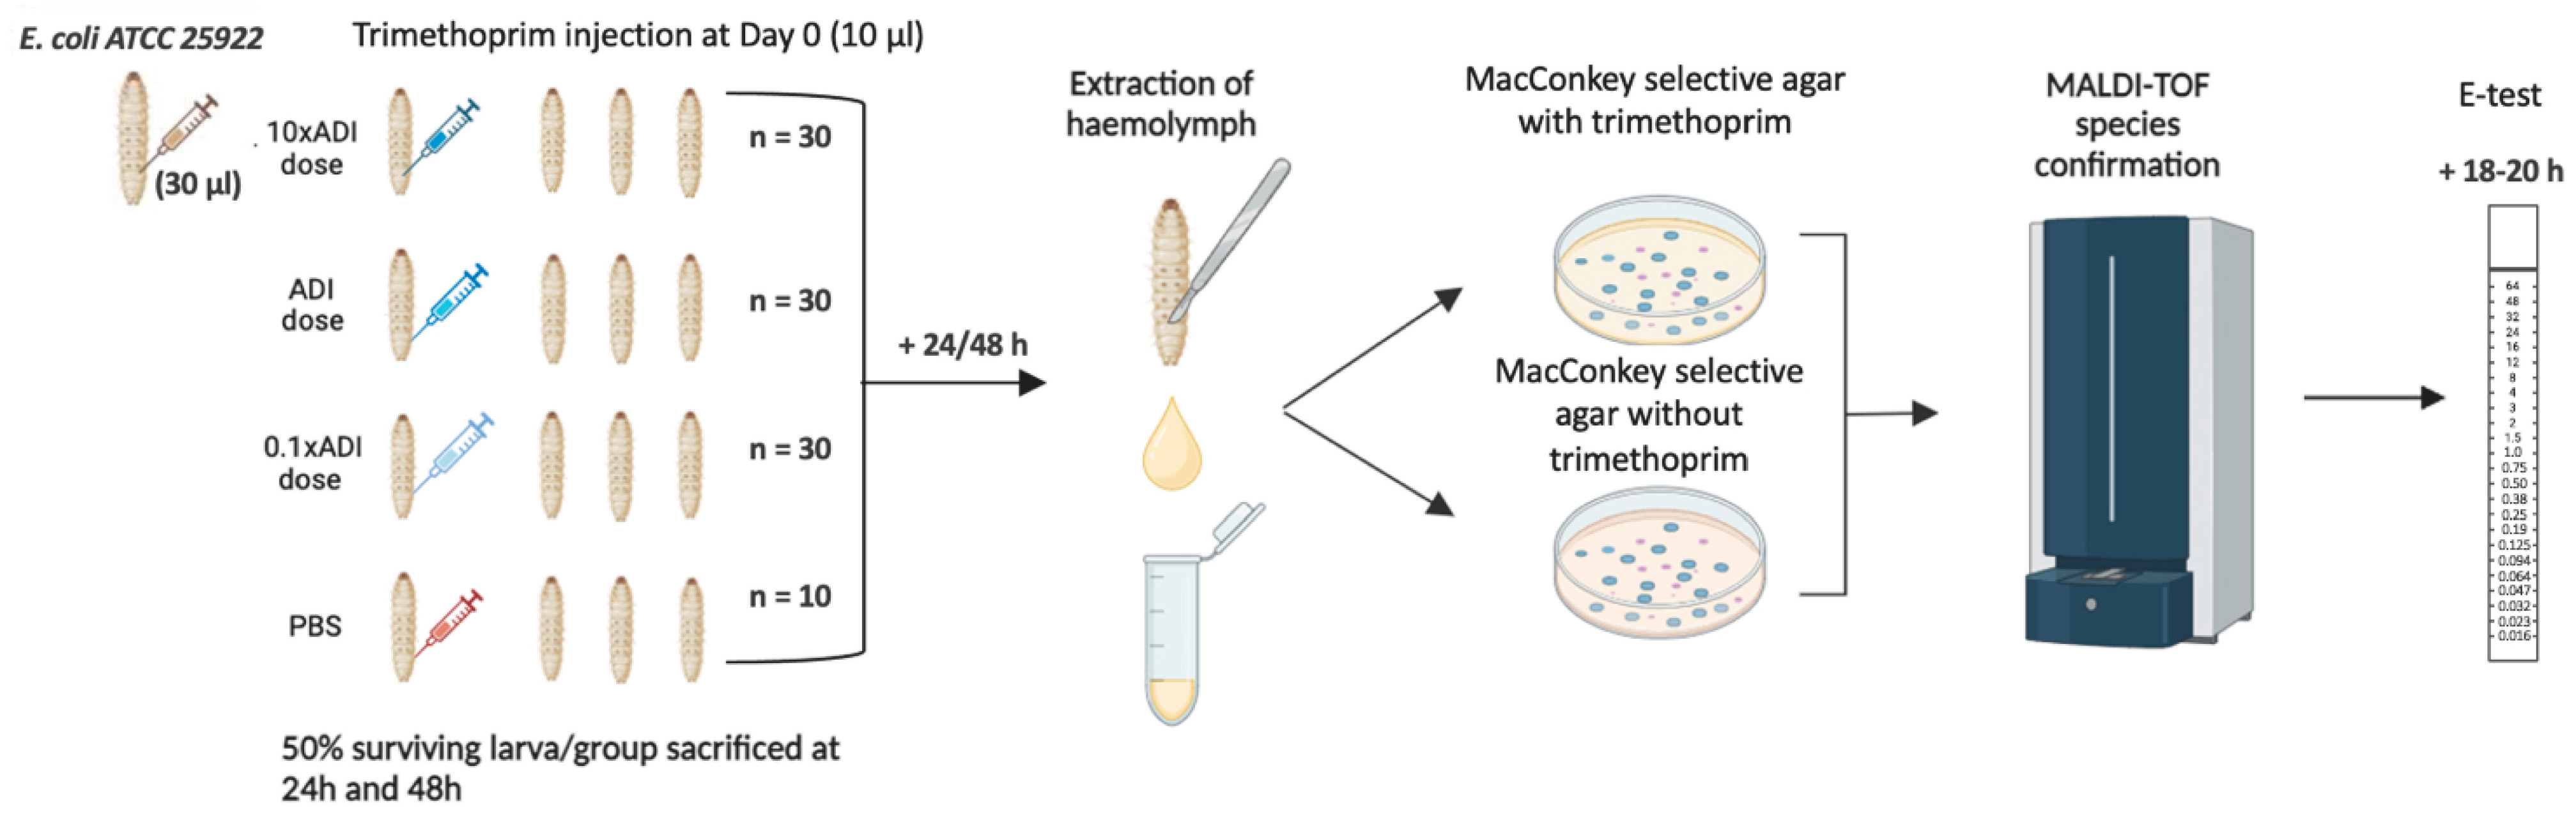
2.2. Preparation of Live Microbial Inocula for Infection
2.3. Injection of G. mellonella Larvae
2.4. Concentration of Trimethoprim Injected
2.5. Retrieval of E. coli from G. mellonella
2.6. MALDI-TOF MS Species Identification
3. Results
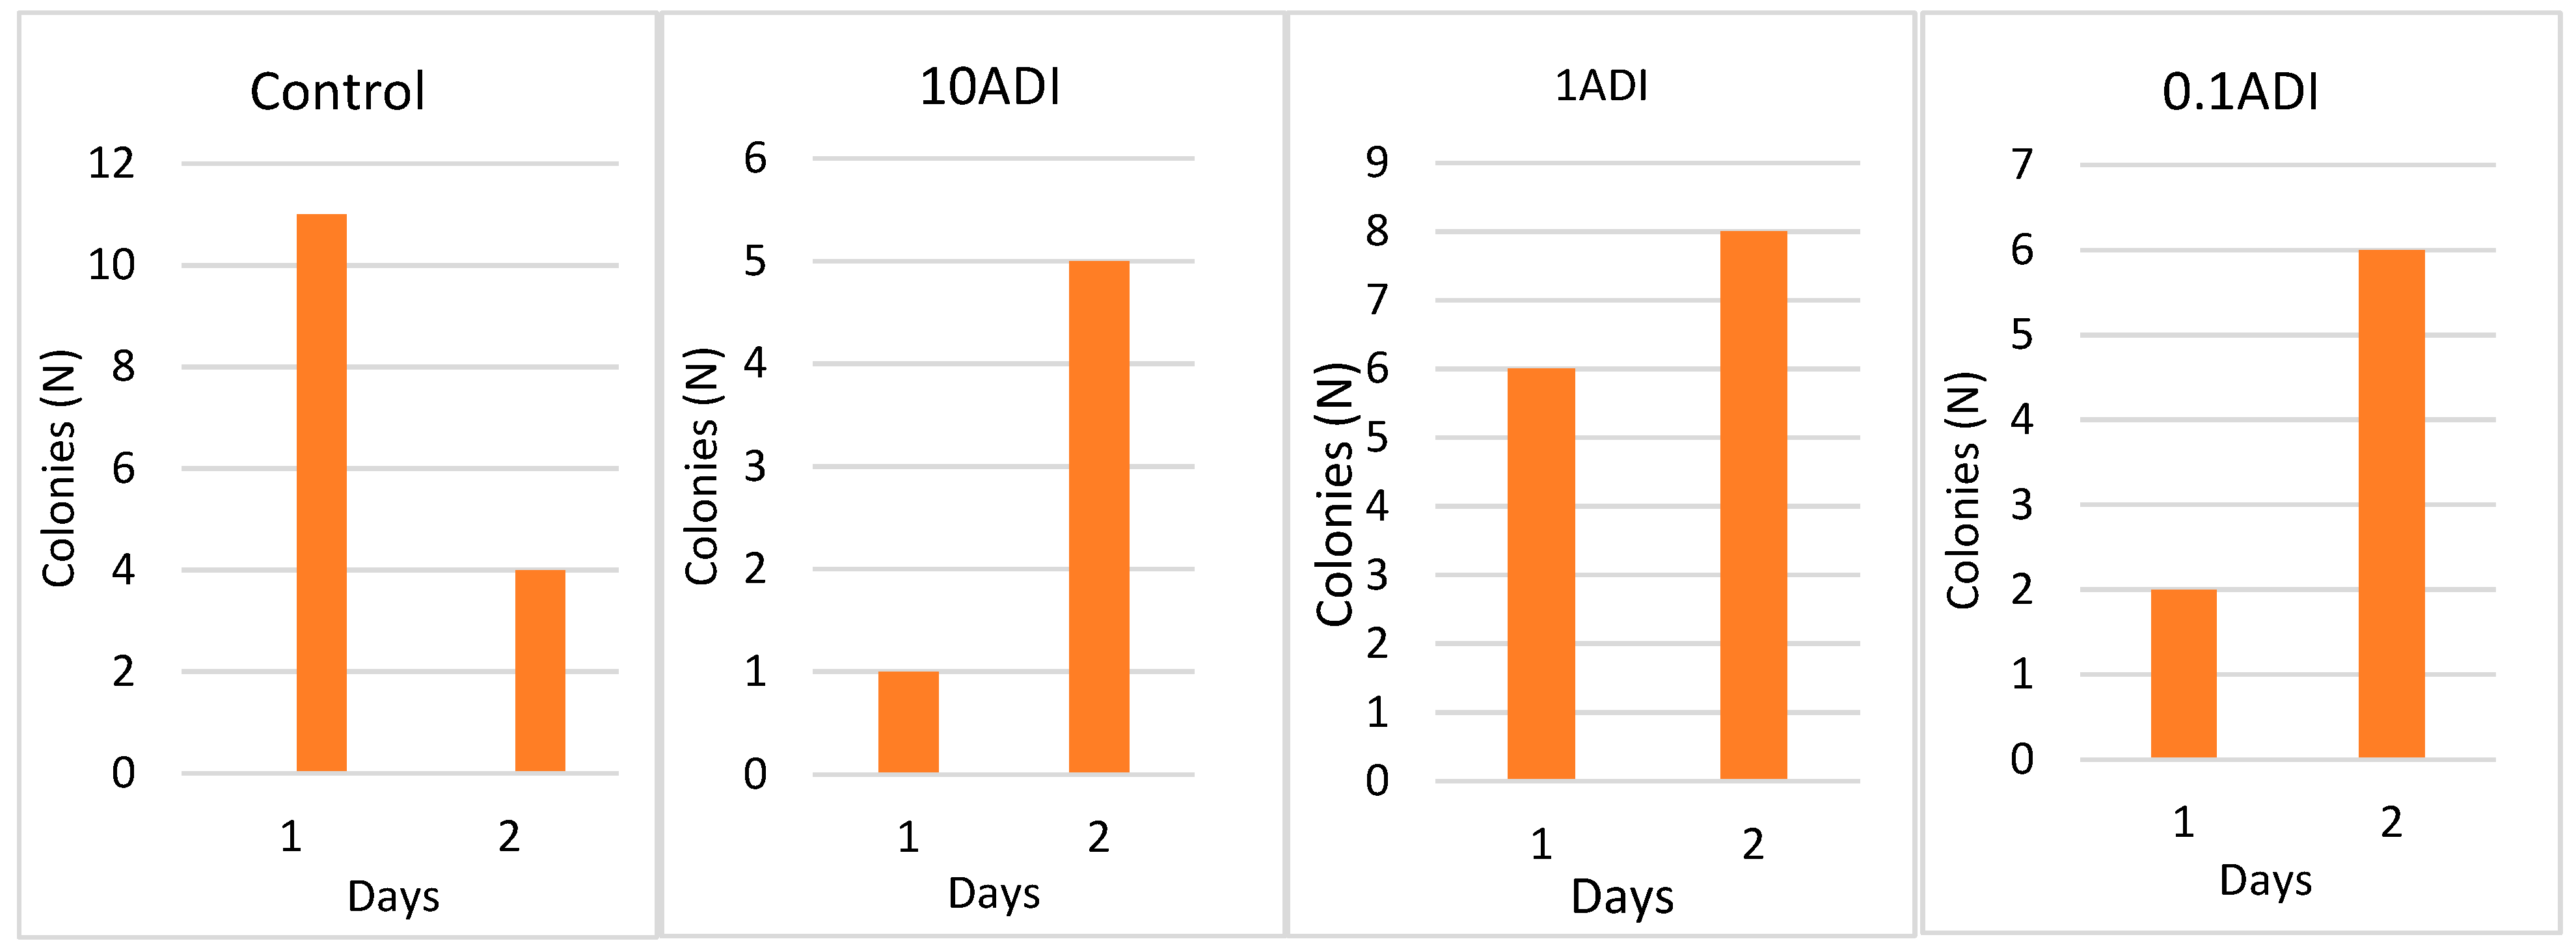
3.1. Colonization
3.2. Colony Emergence and Identification
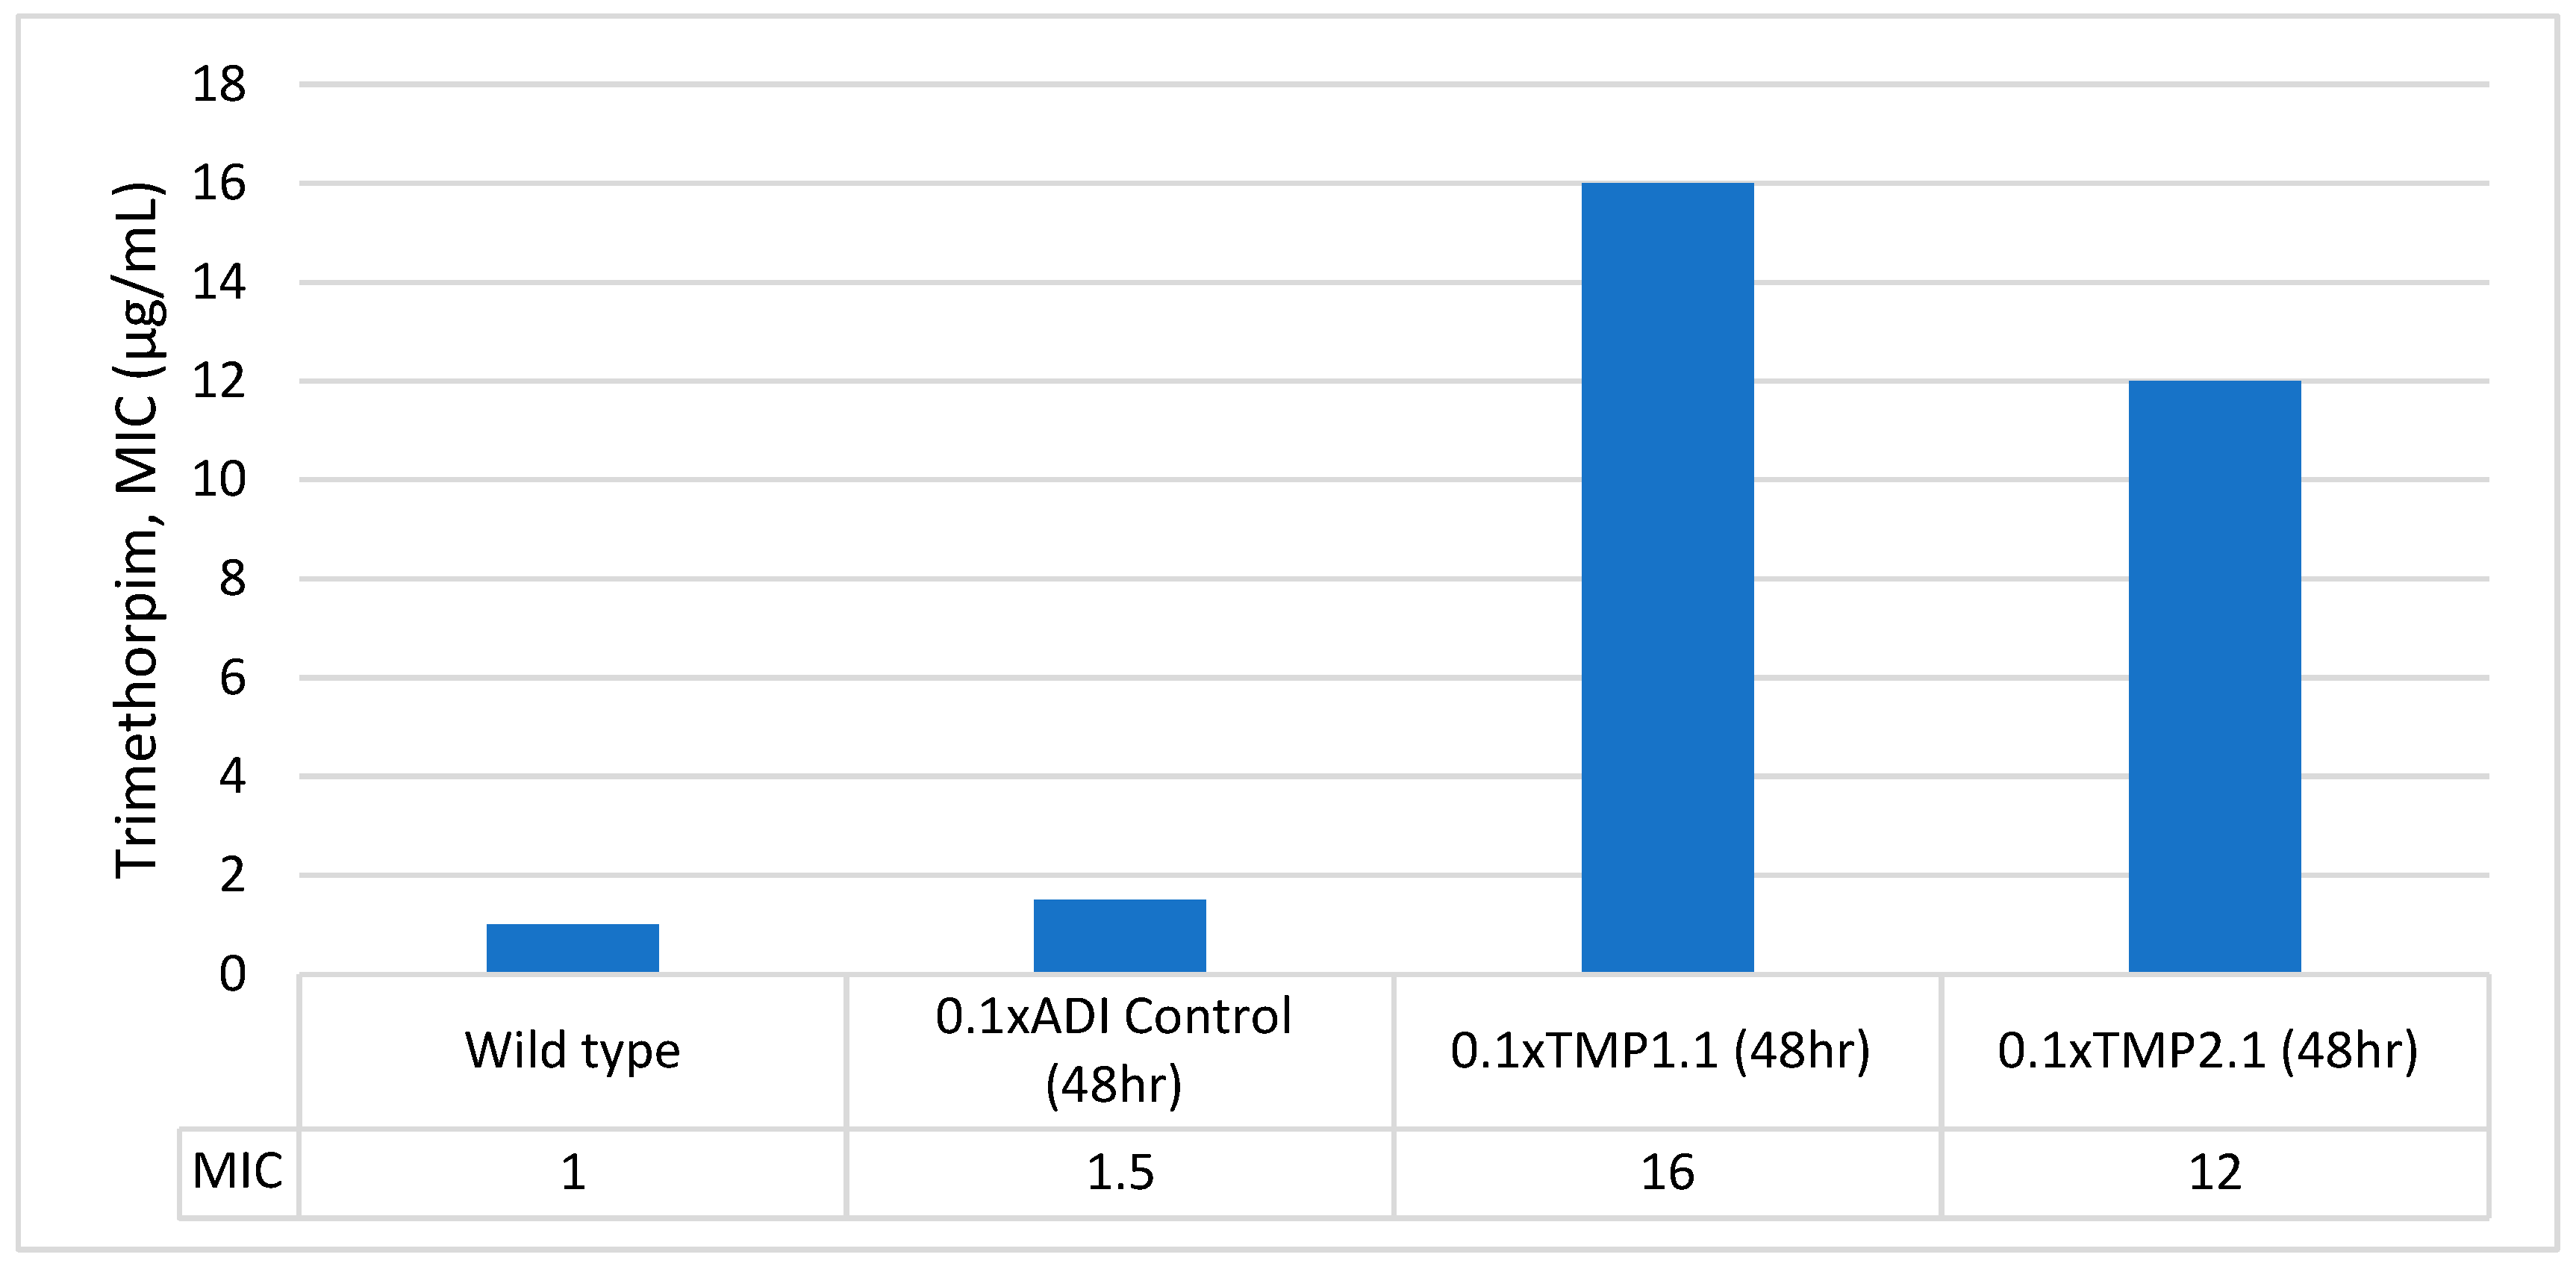
3.3. Stability of Trimethoprim-Resistant Isolates
4. Discussion
Supplementary Materials
Author Contributions
Funding
Data Availability Statement
Conflicts of Interest
References
- Gullberg, E.; Albrecht, L.M.; Karlsson, C.; Sandegren, L.; Andersson, D.I. Selection of a multidrug resistance plasmid by sublethal levels of antibiotics and heavy metals. MBio 2014, 5, 10–1128. [Google Scholar] [CrossRef] [PubMed]
- Hjort, K.; Fermér, E.; Tang, P.-C.; Andersson, D.I. Antibiotic Minimal Selective Concentrations and Fitness Costs during Biofilm and Planktonic Growth. MBio 2022, 13, e0144722. [Google Scholar] [CrossRef] [PubMed]
- Gestels, Z.; Abdellati, S.; Kenyon, C.; Manoharan-Basil, S.S. Ciprofloxacin Concentrations 100-Fold Lower than the MIC Can Select for Ciprofloxacin Resistance in Neisseria subflava: An In Vitro Study. Antibiotics 2024, 13, 560. [Google Scholar] [CrossRef]
- Gullberg, E.; Cao, S.; Berg, O.G.; Ilbäck, C.; Sandegren, L.; Hughes, D.; Andersson, D.I. Selection of resistant bacteria at very low antibiotic concentrations. PLoS Pathog. 2011, 7, e1002158. [Google Scholar] [CrossRef]
- González, N.; Abdellati, S.; De Baetselier, I.; Laumen, J.G.E.; Van Dijck, C.; de Block, T.; Manoharan-Basil, S.S.; Kenyon, C. Ciprofloxacin concentrations 1/1000th the MIC can select for antimicrobial resistance in N. gonorrhoeae-important implications for maximum residue limits in food. Antibiotics 2022, 11, 1430. [Google Scholar] [CrossRef]
- Kraupner, N.; Ebmeyer, S.; Hutinel, M.; Fick, J.; Flach, C.-F.; Larsson, D.G.J. Selective concentrations for trimethoprim resistance in aquatic environments. Environ. Int. 2020, 144, 106083. [Google Scholar] [CrossRef] [PubMed]
- Stanton, I.C.; Murray, A.K.; Zhang, L.; Snape, J.; Gaze, W.H. Evolution of antibiotic resistance at low antibiotic concentrations including selection below the minimal selective concentration. Commun. Biol. 2020, 3, 467. [Google Scholar] [CrossRef]
- Baranchyk, Y.; Gestels, Z.; Van den Bossche, D.; Abdellati, S.; Xavier, B.B.; Manoharan-Basil, S.S.; Kenyon, C. Effect of erythromycin residuals in food on the development of resistance in Streptococcus pneumoniae: An in vivo study in Galleria mellonella. PeerJ 2024, 12, e17463. [Google Scholar] [CrossRef] [PubMed]
- Wu-Wu, J.W.F.; Guadamuz-Mayorga, C.; Oviedo-Cerdas, D.; Zamora, W.J. Antibiotic resistance and food safety: Perspectives on new technologies and molecules for microbial control in the food industry. Antibiotics 2023, 12, 550. [Google Scholar] [CrossRef] [PubMed]
- Alimentarius, C. Guideline for the Simple Evaluation of Dietary Exposure to Food Additives; CAC/GL 3-1989; FAO: Rome, Italy, 2014. [Google Scholar]
- Gestels, Z.; Baranchyk, Y.; Van den Bossche, D.; Laumen, J.; Abdellati, S.; Britto Xavier, B.; Manoharan-Basil, S.S.; Kenyon, C. Could traces of fluoroquinolones in food induce ciprofloxacin resistance in Escherichia coli and Klebsiella pneumoniae? An in vivo study in Galleria mellonella with important implications for maximum residue limits in food. Microbiol. Spectr. 2024, 12, e03595-23. [Google Scholar] [CrossRef] [PubMed]
- Van Boeckel, T.P.; Gandra, S.; Ashok, A.; Caudron, Q.; Grenfell, B.T.; Levin, S.A.; Laxminarayan, R. Global antibiotic consumption 2000 to 2010: An analysis of national pharmaceutical sales data. Lancet Infect. Dis. 2014, 14, 742–750. [Google Scholar] [CrossRef]
- Ménard, G.; Rouillon, A.; Cattoir, V.; Donnio, P.-Y. Galleria mellonella as a Suitable Model of Bacterial Infection: Past, Present and Future. Front. Cell. Infect. Microbiol. 2021, 11, 782733. [Google Scholar] [CrossRef]
- Faleye, A.C.; Adegoke, A.A.; Ramluckan, K.; Fick, J.; Bux, F.; Stenström, T.A. Concentration and reduction of antibiotic residues in selected wastewater treatment plants and receiving waterbodies in Durban, South Africa. Sci. Total Environ. 2019, 678, 10–20. [Google Scholar] [CrossRef] [PubMed]
- Flach, C.-F.; Genheden, M.; Fick, J.; Joakim Larsson, D.G. A comprehensive screening of Escherichia coli isolates from Scandinavia’s largest sewage treatment plant indicates no selection for antibiotic resistance. Environ. Sci. Technol. 2018, 52, 11419–11428. [Google Scholar] [CrossRef]
- Khan, G.A.; Berglund, B.; Khan, K.M.; Lindgren, P.E.; Fick, J. Occurrence and Abundance of Antibiotics and Resistance Genes in Rivers, Canal near Drug Formul. Facilities—A Study Pakistan. PLoS ONE 2013, 8, e62712. [Google Scholar] [CrossRef]
- Seo, J.; Kloprogge, F.; Smith, A.M.; Karu, K.; Ciric, L. Antibiotic Residues in UK Foods: Exploring the Exposure Pathways and Associated Health Risks. Toxics 2024, 12, 174. [Google Scholar] [CrossRef] [PubMed]
- EMA. Committee for Veterinary Medicinal Products-Enrofloxacin Summary Report; EMA: Amsterdam, The Netherlands, 2002; Volume 5. [Google Scholar]
- Murray, A.K.; Stanton, I.; Gaze, W.H.; Snape, J. Dawning of a new ERA: Environmental Risk Assessment of antibiotics and their potential to select for antimicrobial resistance. Water Res. 2021, 200, 117233. [Google Scholar] [CrossRef] [PubMed]
- Alimentarius, C. Codex standard. In Rome, Food Agriculture Organization; FAO: Rome, Italy, 2011; pp. 33–198. [Google Scholar]
- Elder, H.A.; Roy, I.; Lehman, S.; Phillips, R.L.; Kass, E.H. Human studies to measure the effect of antibiotic residues. Vet. Hum. Toxicol. 1993, 35, 31–36. [Google Scholar] [PubMed]
- European Commission; European Food Safety Authority. The European Union Summary Report on Antimicrobial Resistance in zoonotic and indicator bacteria from humans, animals and food in 2018/2019. EFSA J. 2021, 19, e06490. [Google Scholar]
- Mitchell, J.M.; Griffiths, M.W.; McEwen, S.A.; McNab, W.B.; Yee, A.J. Antimicrobial drug residues in milk and meat: Causes, concerns, prevalence, regulations, tests, and test performance. J. Food Prot. 1998, 61, 742–756. [Google Scholar] [CrossRef]
- Gu, B.; Cao, Y.; Pan, S.; Zhuang, L.; Yu, R.; Peng, Z.; Qian, H.; Wei, Y.; Zhao, L.; Liu, G. Comparison of the prevalence and changing resistance to nalidixic acid and ciprofloxacin of Shigella between Europe–America and Asia–Africa from 1998 to 2009. Int. J. Antimicrob. Agents 2012, 40, 9–17. [Google Scholar] [CrossRef]
- EMA. The European Agency for the Evaluation of Medicinal Products. Committee for Veterinary Medicinal Products: Trimethoprim Summary Report; EMA: Amsterdam, The Netherlands, 1997; Volume 2. [Google Scholar]
- Gleckman, R.; Blagg, N.; Joubert, D.W. Trimethoprim: Mechanisms of action, antimicrobial activity, bacterial resistance, pharmacokinetics, adverse reactions, and therapeutic indications. Pharmacother. J. Hum. Pharmacol. Drug Ther. 1981, 1, 14–19. [Google Scholar] [CrossRef]
- Papich, M.G. Saunders handbook of veterinary drugs. North Carol. 2016, 12, 162–171. [Google Scholar]
- Poirel, L.; Madec, J.-Y.; Lupo, A.; Schink, A.-K.; Kieffer, N.; Nordmann, P.; Schwarz, S. Antimicrobial resistance in Escherichia coli. Microbiol. Spectr. 2018, 6, 10–1128. [Google Scholar] [CrossRef]
- Manna, M.S.; Tamer, Y.T.; Gaszek, I.; Poulides, N.; Ahmed, A.; Wang, X.; Toprak, F.C.R.; Woodard, D.R.; Koh, A.Y.; Williams, N.S. A trimethoprim derivative impedes antibiotic resistance evolution. Nat. Commun. 2021, 12, 2949. [Google Scholar] [CrossRef] [PubMed]
- Brolund, A.; Sundqvist, M.; Kahlmeter, G.; Grape, M. Molecular characterisation of trimethoprim resistance in Escherichia coli and Klebsiella pneumoniae during a two year intervention on trimethoprim use. PLoS ONE 2010, 5, e9233. [Google Scholar] [CrossRef]
- Bray, A.S.; Smith, R.D.; Hudson, A.W.; Hernandez, G.E.; Young, T.M.; George, H.E.; Ernst, R.K.; Zafar, M.A. MgrB-dependent colistin resistance in Klebsiella pneumoniae is associated with an increase in host-to-host transmission. MBio 2022, 13, e03595-21. [Google Scholar] [CrossRef] [PubMed]
- Baba, T.; Ara, T.; Hasegawa, M.; Takai, Y.; Okumura, Y.; Baba, M.; Datsenko, K.A.; Tomita, M.; Wanner, B.L.; Mori, H. Construction of Escherichia coli K-12 in-frame, single-gene knockout mutants: The Keio collection. Mol. Syst. Biol. 2006, 2, 8–2006. [Google Scholar] [CrossRef]
- Shi, H.; Li, T.; Xu, J.; Yu, J.; Yang, S.; Zhang, X.-E.; Tao, S.; Gu, J.; Deng, J.-Y. MgrB inactivation confers trimethoprim resistance in Escherichia coli. Front. Microbiol. 2021, 12, 682205. [Google Scholar] [CrossRef] [PubMed]
- Smith, D.R.; Calvo, J.M. Nucleotide sequence of dihydrofolate reductase genes from trimethoprim-resistant mutants of Escherichia coli: Evidence that dihydrofolate reductase interacts with another essential gene product. Mol. Gen. Genet. MGG 1982, 187, 72–78. [Google Scholar] [CrossRef] [PubMed]
- Flensburg, J.; Sköld, O. Massive overproduction of dihydrofolate reductase in bacteria as a response to the use of trimethoprim. Eur. J. Biochem. 1987, 162, 473–476. [Google Scholar] [CrossRef]
- Flensburg, J.; Sköld, O. Regulatory changes in the formation of chromosomal dihydrofolate reductase causing resistance to trimethoprim. J. Bacteriol. 1984, 159, 184–190. [Google Scholar] [CrossRef] [PubMed]
- Bhosle, A.; Datey, A.; Chandrasekharan, G.; Singh, D.; Chakravortty, D.; Chandra, N. A Strategic Target Rescues Trimethoprim Sensitivity in Escherichia coli. iScience 2020, 23, 100986. [Google Scholar] [CrossRef] [PubMed]
- Minogue, T.D.; Daligault, H.A.; Davenport, K.W.; Bishop-Lilly, K.A.; Broomall, S.M.; Bruce, D.C.; Chain, P.S.; Chertkov, O.; Coyne, S.R.; Freitas, T. Complete genome assembly of Escherichia coli ATCC 25922, a serotype O6 reference strain. Genome Announc. 2014, 2, 10–1128. [Google Scholar] [CrossRef]
- Calarga, A.P.; Gontijo, M.T.P.; de Almeida, L.G.P.; de Vasconcelos, A.T.R.; Nascimento, L.C.; de Moraes Barbosa, T.M.C.; de Carvalho Perri, T.M.; Dos Santos, S.R.; Tiba-Casas, M.R.; Marques, E.G.L. Antimicrobial resistance and genetic background of non-typhoidal Salmonella enterica strains isolated from human infections in São Paulo, Brazil (2000–2019). Braz. J. Microbiol. 2022, 53, 1249–1262. [Google Scholar] [CrossRef] [PubMed]
- Drlica, K. The mutant selection window and antimicrobial resistance. J. Antimicrob. Chemother. 2003, 52, 11–17. [Google Scholar] [CrossRef] [PubMed]
- Andersson, D.I.; Hughes, D. Antibiotic resistance and its cost: Is it possible to reverse resistance? Nat. Rev. Microbiol. 2010, 8, 260–271. [Google Scholar] [CrossRef] [PubMed]
- Kowalska-Krochmal, B.; Dudek-Wicher, R. The Minimum Inhibitory Concentration of Antibiotics: Methods, Interpretation, Clinical Relevance. Pathogens 2021, 10, 165. [Google Scholar] [CrossRef]
- Laumen, J.G.E.; Van Dijck, C.; Abdellati, S.; De Baetselier, I.; Serrano, G.; Manoharan-Basil, S.S.; Bottieau, E.; Martiny, D.; Kenyon, C. Antimicrobial susceptibility of commensal Neisseria in a general population and men who have sex with men in Belgium. Sci. Rep. 2022, 12, 9. [Google Scholar] [CrossRef]
- Gaulke, C.A.; Arnold, H.K.; Humphreys, I.R.; Kembel, S.W.; O’Dwyer, J.P.; Sharpton, T.J. Ecophylogenetics clarifies the evolutionary association between mammals and their gut microbiota. MBio 2018, 9, 10–1128. [Google Scholar] [CrossRef] [PubMed]
- Seiler, C.; Berendonk, T.U. Heavy metal driven co-selection of antibiotic resistance in soil and water bodies impacted by agriculture and aquaculture. Front. Microbiol. 2012, 3, 399. [Google Scholar] [CrossRef]
- Kenyon, C.; Gestels, Z.; Vanbaelen, T.; Abdellati, S.; Van Den Bossche, D.; De Baetselier, I.; Xavier, B.B.; Manoharan-Basil, S.S. Doxycycline PEP can induce doxycycline resistance in Klebsiella pneumoniae in a Galleria mellonella model of PEP. Front. Microbiol. 2023, 14, 1208014. [Google Scholar] [CrossRef]

| Sample ID (MacConkey) | Phenotype | Detected Species | MALDI-TOF Confidence Score | MIC (µg/mL) |
|---|---|---|---|---|
| 10x-24h-TMP4.1 | Pink | Escherichia coli | 2.46 | 8 |
| 1x-24h-TMP1.1 | Pink | Escherichia coli | 2.07 | 1.5 |
| 1x-24h-TMP2.1 | Pink | Escherichia coli | 2.01 | 1 |
| 1x-24h-TMP3.1 | Pink | Escherichia coli | 2.2 | 1.5 |
| 0.1x-24h-TMP1.1 | Pink | Escherichia coli | 2.01 | 1.5 |
| 10x-48h-TMP1.2 | Pink | Escherichia coli | 1.8 | 1.5 |
| 10x-48h-TMP2.1 | Pink | Escherichia coli | 2.21 | 1.5 |
| 1x-48h-TMP1.1 | Pink | Escherichia coli | 1.8 | 1.5 |
| 1x-48h-TMP2.1 | Pink | Escherichia coli | 2.02 | 1.5 |
| 0.1x-48h-TMP1.1 | Pink | Escherichia coli | 1.92 | 16 |
| 0.1x-48h-TMP1.2 | Pink | Escherichia coli | 1.91 | 1 |
| 0.1x-48h-TMP1.3 | Pink | Escherichia coli | 2.09 | 1.5 |
| 0.1x-48h-TMP2.1 | Pink | Escherichia coli | 1.92 | 12 |
Disclaimer/Publisher’s Note: The statements, opinions and data contained in all publications are solely those of the individual author(s) and contributor(s) and not of MDPI and/or the editor(s). MDPI and/or the editor(s) disclaim responsibility for any injury to people or property resulting from any ideas, methods, instructions or products referred to in the content. |
© 2024 by the authors. Licensee MDPI, Basel, Switzerland. This article is an open access article distributed under the terms and conditions of the Creative Commons Attribution (CC BY) license (https://creativecommons.org/licenses/by/4.0/).
Share and Cite
Macleod, J.K.; Gestels, Z.; Abdellati, S.; Vanbaelen, T.; Kenyon, C.; Manoharan-Basil, S.S. Determination of the De Novo Minimum Selection Concentration of Trimethoprim In Vivo for Escherichia coli Using Galleria mellonella: A Pilot Study. Microorganisms 2025, 13, 3. https://doi.org/10.3390/microorganisms13010003
Macleod JK, Gestels Z, Abdellati S, Vanbaelen T, Kenyon C, Manoharan-Basil SS. Determination of the De Novo Minimum Selection Concentration of Trimethoprim In Vivo for Escherichia coli Using Galleria mellonella: A Pilot Study. Microorganisms. 2025; 13(1):3. https://doi.org/10.3390/microorganisms13010003
Chicago/Turabian StyleMacleod, Jaime Knox, Zina Gestels, Said Abdellati, Thibaut Vanbaelen, Chris Kenyon, and Sheeba Santhini Manoharan-Basil. 2025. "Determination of the De Novo Minimum Selection Concentration of Trimethoprim In Vivo for Escherichia coli Using Galleria mellonella: A Pilot Study" Microorganisms 13, no. 1: 3. https://doi.org/10.3390/microorganisms13010003
APA StyleMacleod, J. K., Gestels, Z., Abdellati, S., Vanbaelen, T., Kenyon, C., & Manoharan-Basil, S. S. (2025). Determination of the De Novo Minimum Selection Concentration of Trimethoprim In Vivo for Escherichia coli Using Galleria mellonella: A Pilot Study. Microorganisms, 13(1), 3. https://doi.org/10.3390/microorganisms13010003